impacts of the gatt/uruguay round trade …ageconsearch.umn.edu/bitstream/31006/1/22010145.pdf ·...
TRANSCRIPT

Journal of Agricultural and Resource Economics 22(1):145-156Copyright 1997 Western Agricultural Economics Association
Impacts of the GATT/Uruguay Round TradeNegotiations on U.S. Beef and Cattle Prices
Gary W. Brester and Michael K. Wohlgenant
The GATT/Uruguay Round trade negotiations have resulted in a multilateral relax-ation of beef trade restrictions. A linear elasticity model of the U.S. beef industry isdeveloped using log differential equations. Beef consumption, production, and tradeare disaggregated into appropriate ground and table cut components. The model pre-dicts the GATT/Uruguay Round will cause asymmetric effects on ground and tablecut beef consumers. In general, fed cattle and cow/calf producers will benefit fromtrade liberalization because of increases in fed and feeder cattle prices. However,nonfed cattle price will decrease.
Key words: beef prices, cattle prices, GATT/Uruguay Round
Introduction and Brief History of Beef Trade Restrictions
The General Agreement on Tariffs and Trade (GATT)/Uruguay Round trade negotiationsreduce or eliminate many agricultural trade barriers. Trade barriers for beef productshave historically been significant. The effects of trade barrier reductions on U.S. beefand cattle prices are considered here. Specific attention is focused on relative impacts onfed cattle and cow/calf producers.
Prior to the recent GATT/Uruguay Round negotiations, the U.S. Meat Import Act of1979 (which amended the 1964 act) restricted U.S. beef imports. Hahn et al. describethis regulatory policy in detail. In general, the act established an overall import quotabased on a formula designed to make import quantities countercyclical with domesticproduction (Simpson). Imports could not exceed a calculated base quantity by more than10%. The base quantity was determined by contemporaneos production levels, an over-all growth factor, and average annual imports from 1968-77. The quota was dividedamong beef exporting countries. In addition, voluntary restraint agreements were nego-tiated with those countries. Exporting countries agreed to limit beef exports to the UnitedStates if U.S. beef imports approached annual trigger quotas. This arrangement avoidedthe need for imposing further import restrictions and allowed exporting countries toaccrue economic quota rents (Goddard).
In several years since 1979, imports reached trigger quota restrictions imposed by theU.S. Meat Import Act of 1979. Hahn et al. noted "the U.S. Meat Import Law occasionallyshuts off the additional supplies of beef from exporting nations" (p. 24). In other years,voluntary restraint agreements may have kept imports from reaching the trigger quota
Gary Brester is an associate professor in the Department of Agricultural Economics, Kansas State University, and MichaelWohlgenant is William Neal Reynolds Professor of Agricultural and Resource Economics, North Carolina State University.
We acknowledge the helpful comments provided by Sean Fox, Dermot Hayes, Terry Kastens, John Marsh, James Mintert,Myles Watts, and three anonymous reviewers. This is Contribution No. 97-291-J of the Kansas Agricultural ExperimentStation.

Journal of Agricultural and Resource Economics
levels. Thus, it is likely that relaxing U.S. import restrictions will increase U.S. beefimports.
The U.S. annual quantity share of the world fresh beef import market averaged 16.5%between 1980 and 1994 (United Nations). The U.S. is the largest single-country beefimporter (Hahn et al.). U.S. beef imports primarily consist of lower-quality, manufactur-ing-grade beef. The Livestock Marketing and Information Center (LMIC) estimates thatground beef comprises 80% of all U.S. beef imports.
U.S. beef exports have been subject to both tariff and nontariff barriers in manycountries. For example, prior to the GATT/Uruguay Round, Japan levied a 50% tariffon imported beef, South Korea imposed beef import quotas, and the European Union
(EU) subsidized beef exports.U.S. quantity share of the annual world beef export market averaged 5.9% between
1980 and 1994, but has increased to approximately 10% in recent years. In terms of beefand veal, the U.S. primarily exports higher-value beef cuts. However, the U.S. also ex-ports significant quantities of lower-value edible offals. Many of these products weresubject to less stringent trade restrictions relative to those imposed on higher-value cuts.Recently, U.S. beef exports have increased dramatically. Specifically, quantities of beefexports increased 26% between 1993 and 1994, and 13% from 1994 to 1995.
The GATT/Uruguay Round stipulates that Japan reduce its beef tariffs from 50% to38.5% by the year 2000. South Korea will increase its beef import quota from its current106,000 metric tons to 225,000 metric tons by the year 2000. In 2001, South Koreanimport quotas will be replaced by a 44% tariff which will be reduced to 40% by theyear 2004. The EU has agreed to reduce quantities of subsidized exports to 817,000metric tons by the year 2000 (which is 507,000 tons less than 1992 levels). On 1 January1995, the U.S. replaced import quotas established by the U.S. Meat Import Act of 1979with a tariff of 31.1% (which is to be reduced to 26.4% by the year 2000) and a tariff-rate quota of 656,621 metric tons. The tariff will be applied to all imports in excess ofthe tariff-rate quota [U.S. Department of Agriculture (USDA) 1994b]. Thus, the GATT/
Uruguay Round will affect both U.S. beef exports and imports.Houck (1974) considered the impact of beef import restrictions on U.S. retail prices
of beef, other meats, and other foods. Houck's short-run, partial equilibrium analysis wasbased on data from 1948-71 but did not consider the supply response of U.S. and foreignmeat producers. He noted that ground beef (e.g., hamburger) and table cut beef (e.g.,steaks and roasts) were imperfect substitutes. Data limitations, however, have frequently
forced researchers to use nonfed beef as a proxy for ground beef production and fedbeef as a proxy for table cut beef production (Brester and Wohlgenant). Nonetheless, anaccurate evaluation of beef import restrictions must appropriately disaggregate these twoproducts (Brester).
Similarly, Freebairn and Rausser disaggregated beef production and consumption intofed and nonfed components and used data from 1956-71 to examine the effects of beefimport quotas. They concluded that changes in U.S. beef import restrictions would haveasymmetric effects on feedlot operators (i.e., producers of fed cattle) and cattle ranchers
(i.e., producers of nonfed and feeder cattle).Simpson evaluated the U.S. Meat Import Act of 1979 which was supposed to correct
a flaw in the 1964 act. Specifically, the early version failed to prevent concurrent in-creases in imports and U.S. beef production. However, Simpson noted that the 1979 act
146 July 1997

Impacts of the GATT/Uruguay Round Trade Negotiations 147
would also fail to make imports countercyclical with U.S. production if an unexpected
slow growth in cattle inventories occurred.We estimate the effects of the GATT/Uruguay Round on the U.S. beef industry. In
addition, we use recent data and incorporate supply responses of cattle producers intothe analysis. Thus, like the work of Freebairn and Rausser, this research represents amultimarket equilibrium analysis. Furthermore, given the aforementioned concerns ofHouck, we disaggregate the retail market into ground beef and table cut beef componentsand explicitly recognize that neither of these products are produced exclusively by asingle animal type. Because both imports and exports directly affect the prices of groundand table cut beef, the impacts of changes in beef imports and exports indirectly affectcattle prices through shifts in the derived demands for fed, nonfed, and feeder cattle.
A Disaggregated Model of the U.S. Beef Industry
The following equations represent a disaggregated model of the U.S. beef industry:
(1) Ground beef demand: QG = f(PG, PT),
(2) Table cut beef demand: QT = f 2(P0, PT),
(3) Ground beef supply: QG = f 3(QF, QN, QM),
(4) Table cut beef supply: QT = f 4(QF QN, QM, Qx
(5) Joint product price of fed cattle: PF = fS(P, PT),
(6) Joint product price of nonfed cattle: PN = f 6 (PG, PT),
(7) Supply of fed cattle: QF = f(P),(8) Supply of nonfed cattle: QN = f(PN),
(9) Supply of feeder cattle: Qc = f(Pc),
(10) Derived demand for feeder cattle: Pc = flo(PF, Q)(11) Ground beef market clearing identity: QG = fl(QGD QM), and
(12) Table cut beef market clearing identity: QT = f 12 (QTD, QM, Q).
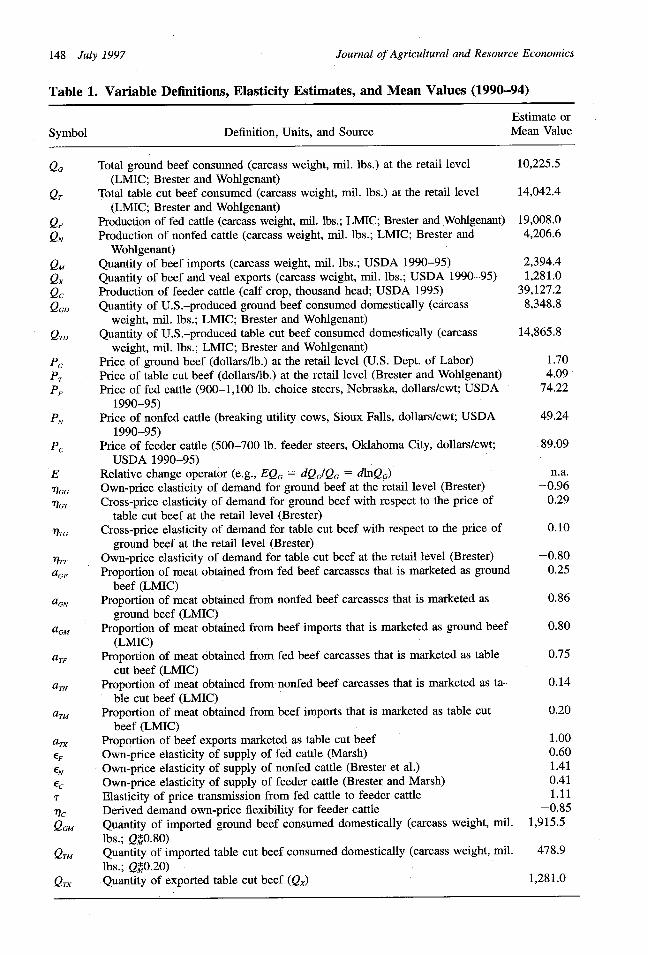
Variable definitions are presented in table 1. For each equation, those demand and supply
shifters which are likely unaffected by exogenous trade liberalization policies are ex-
cluded from the specifications. Equations (1) and (2) represent consumers' demand for
ground beef and table cut beef ignoring other demand shifters (i.e., income, prices ofother goods). The supply of ground beef at the retail level (3) is a function of groundbeef obtained from fed cattle, nonfed cattle, and imports. Exports are not included in thespecification because very little ground beef is exported. In addition, edible offal and
variety meat exports are excluded from this analysis because the demand for these prod-
ucts is quite different from the demand for ground beef. The supply of table cut beef at
the retail level (4) is a function of table cut beef obtained from fed beef, nonfed beef,
and imports less table cut beef exports. Equations (5) and (6) represent the prices of fed
cattle and nonfed cattle as functions of changes in the prices of the joint products (i.e.,ground beef and table cut beef) produced by these two inputs (Houck 1964). Processingcosts are excluded from these equations because they are probably unaffected by trade
negotiations. Changes in the supply of fed cattle, nonfed cattle, and feeder cattle [(7),
Brester and Wohlgenant
Journal of Agricultural and Resource Economics
Table 1. Variable Definitions, Elasticity Estimates, and Mean Values (1990-94)
Estimate or
Symbol Definition, Units, and Source Mean Value
QG Total ground beef consumed (carcass weight, mil. lbs.) at the retail level 10,225.5(LMIC; Brester and Wohlgenant)
QT Total table cut beef consumed (carcass weight, mil. lbs.) at the retail level 14,042.4(LMIC; Brester and Wohlgenant)
QF Production of fed cattle (carcass weight, mil. lbs.; LMIC; Brester and Wohlgenant) 19,008.0QN Production of nonfed cattle (carcass weight, mil. lbs.; LMIC; Brester and 4,206.6
Wohlgenant)
QM Quantity of beef imports (carcass weight, mil. lbs.; USDA 1990-95) 2,394.4Qx Quantity of beef and veal exports (carcass weight, mil. lbs.; USDA 1990-95) 1,281.0
Qc Production of feeder cattle (calf crop, thousand head; USDA 1995) 39,127.2
QGD Quantity of U.S.-produced ground beef consumed domestically (carcass 8,348.8weight, mil. lbs.; LMIC; Brester and Wohlgenant)
QTD Quantity of U.S.-produced table cut beef consumed domestically (carcass 14,865.8weight, mil. lbs.; LMIC; Brester and Wohlgenant)
PG Price of ground beef (dollars/lb.) at the retail level (U.S. Dept. of Labor) 1.70
PT Price of table cut beef (dollars/lb.) at the retail level (Brester and Wohlgenant) 4.09
PF Price of fed cattle (900-1,100 lb. choice steers, Nebraska, dollars/cwt; USDA 74.221990-95)
PN Price of nonfed cattle (breaking utility cows, Sioux Falls, dollars/cwt; USDA 49.241990-95)
PC Price of feeder cattle (500-700 lb. feeder steers, Oklahoma City, dollars/cwt; 89.09USDA 1990-95)
E Relative change operator (e.g., EQG = dQGQG = dlnQG) n.a.
ToGG Own-price elasticity of demand for ground beef at the retail level (Brester) -0.96
71GT Cross-price elasticity of demand for ground beef with respect to the price of 0.29
table cut beef at the retail level (Brester)
/tTG Cross-price elasticity of demand for table cut beef with respect to the price of 0.10ground beef at the retail level (Brester)
7Tr Own-price elasticity of demand for table cut beef at the retail level (Brester) -0.80
aGF Proportion of meat obtained from fed beef carcasses that is marketed as ground 0.25beef (LMIC)
aGN Proportion of meat obtained from nonfed beef carcasses that is marketed as 0.86ground beef (LMIC)
aGM Proportion of meat obtained from beef imports that is marketed as ground beef 0.80(LMIC)
aT, Proportion of meat obtained from fed beef carcasses that is marketed as table 0.75cut beef (LMIC)
aTN Proportion of meat obtained from nonfed beef carcasses that is marketed as ta- 0.14ble cut beef (LMIC)
aTM Proportion of meat obtained from beef imports that is marketed as table cut 0.20beef (LMIC)
aTX Proportion of beef exports marketed as table cut beef 1.00
EF Own-price elasticity of supply of fed cattle (Marsh) 0.60
EN Own-price elasticity of supply of nonfed cattle (Brester et al.) 1.41
Ec Own-price elasticity of supply of feeder cattle (Brester and Marsh) 0.41r Elasticity of price transmission from fed cattle to feeder cattle 1.11r7c Derived demand own-price flexibility for feeder cattle -0.85
QGM Quantity of imported ground beef consumed domestically (carcass weight, mil. 1,915.5lbs.; Q*0.80)
QTM Quantity of imported table cut beef consumed domestically (carcass weight, mil. 478.9lbs.; QM0.20)
QTX Quantity of exported table cut beef (Qx) 1,281.0
148 July 1997

Impacts of the GATT/Uruguay Round Trade Negotiations 149
(8), and (9)] are specified as functions of own prices. Because feed prices (as well asother inputs) are likely unaffected by beef trade liberalization, they are excluded fromthese supply function specifications. Equation (10) represents the derived demand forfeeder cattle as a function of the price of fed cattle and the production of feeder cattle.Equations (11) and (12) represent market clearing identities for ground beef and tablecut beef.
Totally differentiating (1)-(12) and using log differentials to convert to elasticitiesresults in the following linear elasticity model which is used to approximate changesfrom initial equilibrium in the relevant product and factor markets of the U.S. beefindustry:
(13) EQG = *1GGEPG + rlGTEPT,
(14) EQT = rlTGEPG + 7lTEPT,
(15) EQG = aG(QF/QG)EQF + aGN(QN/QG)EQN + aGM(QMIQG)EQM,
(16) EQT = aTF(QIQT)EQF + aN(QN/QT)EQN + aT(QMQT)EQM - aX(QX/QT)EQX,
(17) EPF = aGF(PG/PF)EPG + aTF(P/PF)EPT,
(18) EPN = aGN(PG/PN)EPG + aTN(P/PN)EPT,
(19) EQF = EFEPF,
(20) EQN = eNEPN
(21) EQc = ecEP,
(22) EPc = TEPF + lcEQ,
(23) EQG = (QG/IQG)EQGD + (QGM/QG)EQM, and
(24) EQT =(QTDIQT)EQTD + (QTM/QT)EQM - (Q/QT)EQx.
The linear elasticity model presented in equations (13)-(24) is a linear approximationto the underlying (unknown) demand and supply functions. The model's accuracy de-pends upon the degree of nonlinearity of the true functional forms, and the magnitudeof deviations from equilibrium being simulated. That is, the model is less accurate themore nonlinear the true underlying demand and supply functions and less accurate aslarger deviations from equilibrium are considered because of the assumption of constantelasticities between equilibria. In addition, this particular specification of the linear elas-ticity model implicitly assumes constant-returns-to-scale production technologies. Thelength of run considered by such a model depends upon the selected elasticities. Fur-thermore, because of data limitations, we assume that proportions of ground and tablecut beef obtained from fed and nonfed cattle are time invariant. To the extent that theseproportions do vary in response to market conditions, supply responses for each productwill be understated and associated price effects will be overstated. However, our modeldoes allow for substitution between each product by consumers.
Values of Market Parameters
Equations (13)-(24) are rewritten below using parameter estimates reported in table 1:
(25) EQG = -0.96EPG + 0.29EPT,
(26) EQT = O.1OEPG - 0.80EPT,
(27) EQG = 0.46EQF + 0.35EQN + 0.19EQM,
Brester and Wohlgenant

Journal of Agricultural and Resource Economics
(28) EQT = 1.02EQF + 0.04EQN + 0.03EQM - 0.09EQ,
(29) EPF = 0.57EPG + 4.13EPT,
(30) EPN = 2.97EPG + 1.16EPT,
(31) EQF = 0.60EPF,
(32) EQN = 1.41EPN,
(33) EQc = 0.41EPc,
(34) EPc = 1.11EPF - 0.85EQc,
(35) EQG = 0.81EQGD + 0.19EQM and
(36) EQT = 1.06EQTD + 0.03EQM - 0.09EQ.
Demand elasticity estimates for (25) and (26) are obtained from Brester. Quantity and
value share data for (27)-(30), (35), and (36) are obtained using LMIC procedures out-
lined by Brester and Wohlgenant. An estimate of the own-price elasticity of supply forfed cattle [0.60 in (31)] is obtained from Marsh. The own-price elasticity of supply fornonfed cattle [1.41 in (32)] is obtained from Brester et al. The own-price elasticity of
supply for feeder cattle [0.41 in (33)] is obtained from Brester and Marsh. These supply
elasticities represent medium-run producer behavior. Thus, they are appropriate for con-
sidering the effects of exogenous changes in imports and exports over a three-eight year
horizon.Elasticity estimates for the feeder cattle derived demand equation (34) are obtained
from the following ordinary least squares regression using annual data from 1962-94:
(37) In Pc = 8.67 + 1.11*ln P - 0.85* In Qc + 0.37*p,_,,
(2.24) (17.30) (-2.41) (2.32)
R2 = 0.091, Y = 0.093.88, DF = 30, DW = 1.83,
where p,_1 is the lagged error term, numbers in parentheses are t-values, R2 is the adjusted
R-squared, Sy is the standard error of the estimate, Y is the mean of the dependentvariable, DF is the degrees of freedom, and DW is the Durbin-Watson statistic. Because
the data are in natural logarithms, 1.11 represents an estimate of the elasticity of price
transmission from fed cattle to feeder cattle (r), and -0.85 represents the own-priceflexibility for the derived demand for feeder cattle (r/c) in (34).
The system of equations (25)-(36) can be solved numerically for relative changes inquantities, input prices, and output prices as functions of relative exogenous changes
(i.e., those caused by trade liberalization policies) in imports and exports. In matrixnotation, equations (25)-(36) can be written as:
(38) A.Y = B.E,
where A is a 12X 12 matrix of parameters, Y is a 12X 1 vector of changes in the endog-enous variables, and B is a 12X2 matrix of parameters associated with a 1% change inthe exogenous variables which are represented by the 2X 1 vector E. Explicitly, (38) has
the form:
150 July 1997

Impacts of the GAIT/Uruguay Round Trade Negotiations 151
1 0 0.96-0.29 0 0 0 0 0 0 0 00 1 -0.10 0.80 0 0 0 0 0 0 0 01 0 0 0 0 0 -0.46 -0.35 0 0 0 00 1 0 0 0 0 -1.02-0.04 0 0 0 00 0-0.57 -4.13 1 0 0 0 0 0 0 0 00 0-2.97-1.16 0 1 0 0 0 0 0 10 0 0 0 -0.60 0 1 0 0 0 0 000 0 0 0 -1.41 0 1 0 0 0 000 0 0 0 0 0 0 1 -0.41 0 000 0 0 -1.11 0 0 0 0.85 1 0 01 0 0 0 0 0 0 0 0 -0.81 00 1 0 0 0 0 0 0 0 0 0 -1.06
EQG
EQT
EPG
EPTEPF
EPN
EQF
EQNEQcEPc
EQGD
EQrT
0 00 00.19 00.03 -0.090 00 00 00 00 00 00.19 00.03 -0.09_
LEQM]EQxJ.
Relative changes in the endogenous variables caused by relative changes in imports andexports are calculated by solving (38) as:
(40) Y = A-I.B.E.
Reducing U.S. Beef Import Restrictions
Various methods for restricting U.S. beef imports have been in effect since 1964 (Hahnet al.). Thus, it is difficult to directly estimate increases in beef imports resulting fromreductions in those restrictions. The USDA (1994a) projects imports to increase by 6-10% over 1994 levels by the year 2005. The GATT/Uruguay Round does not completelyremove U.S. beef import restrictions given that a tariff-rate quota and a 31.1% tariff(which will gradually be reduced to 26.4%) on imports in excess of the quota have beennegotiated. Because of this sizeable tariff, significant quantities of beef in excess of thetariff-rate quota will only be imported if rest-of-the-world (predominantly Australian)beef prices are substantially lower than U.S. prices.
Trigger levels for import quotas under the U.S. Meat Import Act of 1979 averaged587,193 metric tons annually from 1990 to 1994 (Downing). The GATT/Uruguay Roundestablishes a U.S. tariff-rate quota of 656,621 metric tons which is divided among Aus-tralia (378,214), New Zealand (213,406), Japan (200), and several other countries(64,805). Imports from Canada and Mexico are not counted towards the tariff-rate quota.The tariff-rate quota represents an 11.8% increase over previous trigger quota levels.Furthermore, the agreement allows the tariff-rate quota to increase by 20,000 metric tonsfor both Uruguay and Argentina if they are able to meet sanitary requirements for un-cooked beef. In this case, the tariff-rate quota would increase to 696,621 metric tons-which is an 18.6% increase over the average previous trigger levels. Thus, our analysisevaluates the effects of the GATT/Uruguay Round using increases in imports rangingfrom 6% (the USDAs lowest estimate) to 19%.
Reducing Export Restrictions on U.S. Beef
Estimating the impact of reductions in rest-of-the-world beef trade restrictions is com-plicated by the heterogeneity of exported beef products, the number of countries in-volved, and a myriad of country-specific regulations. Hayes projects the value of beefexports to increase by 8-10% per year between 1994 and 2004 if several conditions
(39)
Brester and Wohlgenant
i L

Journal of Agricultural and Resource Economics
Table 2. Impacts of Small, Medium, and Large Increases in U.S. Beef Imports andExports on U.S. Meat Consumption, Meat Prices, Cattle Prices, and Production
% Change in the Endogenous Variables
Small Increases Medium Increases Large Increasesin Imports in Imports and in Imports
Endogenous Variables and Exportsa Exportsb and Exportsc
Ground beef consumption 0.66 1.78 3.09Table cut beef consumption -0.29 -1.06 -1.97Price of ground beef -0.60 -1.51 -2.57Price of table cut beef 0.29 1.14 2.14Price of fed cattle 0.84 3.85 7.36Price of nonfed cattle -1.45 -3.16 -5.17Fed cattle slaughtered 0.50 2.31 4.42Nonfed cattle slaughtered -2.04 -4.46 -7.29Feeder cattle production 0.28 1.30 2.48Price of feeder cattle 0.69 3.17 6.06U.S. consumption of domestically
produced ground beef -0.60 -0.62 -0.64U.S. consumption of domestically
produced table cut beef 0.41 2.05 3.97
a A "small" change refers to a 6% increase in U.S. beef imports and a 10% increase in U.S. beef exportsover 1990-94 average levels.b A "medium" change refers to a 12% increase in U.S. beef imports and a 40% increase in U.S. beefexports over 1990-94 average levels.c A "large" change refers to a 19% increase in U.S. beef imports and a 75% increase in U.S. beefexports over 1990-94 average levels.
favorable to U.S. trade occur (e.g., U.S. promotional expenditures increase to offset
Australian competitive pressures in Japan and favorable exchange rates exist). However,
export quantities will probably not increase as much as export values. Therefore, we use
75% as the upper-bound increase in export quantities occurring between 1994 and 2004.The USDA's (1994a) estimate of a 19-25% total increase in value (and a 10-14% in-crease in export quantities) from 1994 to 2005 is more conservative. Therefore, our
analysis uses 10% as the lower bound and 75% as the upper bound for percentageincreases in U.S. beef export quantities resulting from the GATT/Uruguay Round.
Impacts of the GATT/Uruguay Round on Prices, Consumption, and Production
Table 2 presents results obtained by solving the linear elasticity model (38) for small,medium, and large percentage changes in U.S. beef imports and exports resulting fromthe GATT/Uruguay Round trade negotiations. In general, increased imports decrease the
prices of ground beef and nonfed cattle. Nonfed cattle slaughter declines as does the
U.S. consumption of domestically produced ground beef. Nonetheless, total per capitaground beef consumption increases. Increased exports cause the prices of table cut beef,fed cattle, and feeder cattle to increase. Per capita consumption of table cut beef declinesslightly, and fed cattle slaughter and feeder cattle production both increase.
Specifically, the first column of table 2 presents the impacts of "small" increases
152 July 1997

Impacts of the GATT/Uruguay Round Trade Negotiations 153
(defined as the lower-bound estimates) in U.S. beef imports (6%) and exports (10%)from average 1990-94 levels. Ground beef consumption increases 0.66% in response toa 0.60% decrease in the price of ground beef. Table cut beef price increases by 0.29%and U.S. consumption declines by 0.29%. The price of fed cattle increases by 0.84%and the price of nonfed cattle declines by 1.45%. Feeder cattle production increases by0.28% in response to a 0.69% increase in feeder cattle price.
The second column of table 2 presents results for "medium" increases in U.S. beefimports (12%) and exports (40%). In this case, ground beef price declines by 1.51% andtable cut price increases by 1.14%. The price of fed cattle increases by 3.85%, the priceof nonfed cattle declines by 3.16%, and the price of feeder cattle increases by 3.17%.
The last column of table 2 presents results using upper-bound estimates for increasesin U.S. beef imports (19%) and exports (75%). In this case, ground beef price decreasesby 2.57% in response to increased imports which causes ground beef consumption toincrease by 3.09%. U.S. table cut beef consumption declines by 1.97% because of a2.14% increase in table cut beef price. However, increased exports cause fed cattle priceto increase by 7.36% and, through an increase in the derived demand for feeder cattle,feeder cattle price to increase by 6.06%. Increased beef imports cause nonfed cattle priceto decline by 5.17%.
Model Validation and Sensitivity to Elasticity Estimates
Validating the linear elasticity model posed in equation (38) is problematic. The model isdesigned to measure the impact of U.S. beef imports and exports on U.S. beef and cattleprices. However, a market-determined metric of these effects does not exist. Thus, one isunable to use either in-sample or out-of-sample prediction criteria to validate the model.
One approach to validating such a model is to compare its performance with that of anestablished simulation model. For example, although the Food and Agricultural Policy Re-search Institute's (FAPRI) model does not disaggregate ground and table cut beef productionand consumption, it does consider fed cattle price and production variables. A recent FAPRIstudy evaluates the effects of an immediate, and sustained, 500-million-pound increase inexports on fed cattle price (and many other variables). This represents a 39% increase over1990-94 average export levels. For a relevant comparison, the linear elasticity model (38)is resolved for a 39% increase in exports and no change in imports. Our model predicts thatsuch an increase would result in a 4.23% increase in fed cattle price. After five periods, theFAPRI model predicts an increase in fed cattle price of 5.92%. The somewhat higher impactsuggested by the FAPRI model should be expected because that simulation considers animmediate and sustained 39% increase in exports-whereas our model considers a 39%increase in exports that occurs gradually over several years.
An important consideration is the sensitivity of the simulation results to the ninedemand and supply elasticity estimates used in (38). Using the "medium" effects sce-nario (i.e., a 12% increase in imports and a 40% increase in exports), the model wasresolved using 25% more inelastic and 25% more elastic estimates for each elasticity.For example, the own-price elasticity of demand for ground beef is the first elasticity in(38). The model was resolved using a 25% more inelastic estimate (relative to the base-line value) for that own-price elasticity holding the remaining eight elasticities at theirbaseline values. Then, the procedure was repeated using a 25% more elastic estimate
Brester and Wohlgenant

Journal of Agricultural and Resource Economics
Table 3. Sensitivity of Results of Medium Increases in U.S. Beef Imports (12%) andExports (40%) to Alternative Supply and Demand Elasticity Estimates
% Change in the Endogenous Variables Using
25% More Inelastic Baseline 25% More ElasticElasticity Estimates Elasticity Elasticity Estimates
Endogenous Variables Relative to Baselinea Estimates Relative to Baseline
Ground beef consumption 1.95 1.78 1.65Table cut beef consumption -1.23 -1.06 -0.95Price of ground beef -1.69 -1.51 -1.37Price of table cut beef 1.35 1.14 0.99Price of fed cattle 4.73 3.85 3.24Price of nonfed cattle -3.69 -3.16 -2.77Fed cattle slaughtered 2.49 2.31 2.15Nonfed cattle slaughtered -5.13 -4.46 -3.92Feeder cattle production 0.97 1.30 1.63Price of feeder cattle 3.89 3.17 2.67U.S. consumption of domestically
produced ground beef -0.40 -0.62 -0.77U.S. consumption of domestically
produced table cut beef 2.22 2.05 1.91
a Baseline elasticity estimates are reported in table 1.
(relative to the baseline value) for the own-price elasticity of demand for ground beef.
Percentage changes in the endogenous variables were recorded, and the procedure was
repeated for each of the remaining elasticity estimates. Table 3 presents the widest range
of changes in the endogenous variables obtained from these simulations. From the nine
simulations which use 25% more inelastic estimates, the first column presents the largest
percentage change in the endogenous variables from baseline values. The second column
presents results obtained using baseline elasticity estimates (the same results as presented
in the second column of table 2). From the nine simulations which use 25% more elastic
estimates, the third column presents the largest percentage change in the endogenous
variables from baseline values. The resulting ranges are relatively small with, perhaps,
the exception of percentage changes in fed and nonfed cattle prices. That is, medium
increases in imports and exports result in a 4.73% increase in fed cattle price and a
3.69% decrease in nonfed cattle price when 25% more inelastic estimates are used. The
baseline predictions for percentage changes in these two prices is 3.85% and 3.16%,
respectively. Using 25% more elastic estimates results in an increase in fed cattle price
of 3.24% and a decrease in nonfed cattle price of 2.77%. Given that these two price
variables are somewhat sensitive to selected elasticity estimates, accurate estimates of
the own-price elasticities of fed and nonfed cattle supplies are important for evaluating
the effects of trade liberalization on U.S. cattle prices.
Conclusions and Implications
Multilateral trade liberalization will have significant impacts on U.S. beef and cattle
prices. For example, quantities of U.S. beef imports and exports have been projected to
154 July 1997

Impacts of the GATT/Uruguay Round Trade Negotiations 155
increase by 6-19% and 10-75%, respectively, because of the GATT/Uruguay Round.Because U.S. beef imports are primarily ground beef and exports are primarily table cutbeef, beef trade liberalization will have different impacts on fed cattle and nonfed cattleproducers. For example, ground beef price could decline by 0.60-2.57% from average1990-94 levels because of increased imports. Thus, the price of nonfed cattle (whichgenerally produce ground beef) could decline by 1.45-5.17%. Given that the price ofnonfed cattle averaged $49.24/cwt between 1990 and 1994, increased imports couldreduce nonfed cattle price by $0.71-$2.55/cwt. Conversely, because the U.S. primarilyexports table cut beef, table cut beef price in the U.S. could increase by 0.29-2.14%.Increased foreign demand for table cut beef would cause fed cattle price to increase by0.84-7.36%. Thus, fed cattle price could increase by $0.62-$5.46/cwt over the averageprice of $74.22 received during the 1990-94 period. In addition, increased demand forfed cattle increases the derived demand for feeder cattle. Thus, feeder cattle price couldincrease by 0.69-6.06% which represents $0.61-$5.40/cwt over the average price of$89.09/cwt received during the 1990-94 period.
Obviously, the GATT/Uruguay Round will have positive impacts on fed cattle pro-ducers. In addition, even though nonfed cattle price may decline, cow/calf producers willalso benefit from these trade negotiations because feeder cattle price will increase. Giventhat approximately 80% of cow/calf producers' revenue is derived from feeder cattlesales, revenue gains from feeder cattle price increases should more than offset lossesresulting from reductions in nonfed cattle price.
[Received August 1996; final version received February 1997.]
References
Brester, G. W. "Estimation of the U.S. Import Demand Elasticity for Beef: The Importance of Disaggrega-tion." Rev. Agr. Econ. 18(January 1996):31-42.
Brester, G. W., P. Lhermite, B. K. Goodwin, and M. C. Hunt. "Quantifying the Effects of New Product
Development: The Case of Low-Fat Ground Beef." J. Agr. and Resour. Econ. 18(December 1993):238-49.Brester, G. W., and J. M. Marsh. "A Statistical Model of the Primary and Derived Market Levels in the U.S.
Beef Industry." West. J. Agr. Econ. 8(July 1983):34-49.Brester, G. W., and M. K. Wohlgenant. "Estimating Interrelated Demands for Meats Using New Measures
for Ground and Table Cut Beef." Amer. J. Agr. Econ. 73(November 1991):1182-194.Downing, P. Agricultural Economist, Dairy, Livestock, and Poultry Division, U.S. Department of Agriculture,
Foreign Agricultural Service, Washington DC. Personal communication, June 1996.Food and Agricultural Policy Research Institute. "Impact Multipliers from the FAPRI U.S. Models." Rep.
No. FAPRI-UMC#20-96. Columbia MO, August 1996.Freebairn, J. W., and G. C. Rausser. "Effects of Changes in the Level of U.S. Beef Imports." Amer. J. Agr.
Econ. 57(November 1975):676-88.Goddard, E. W "Export Demand Elasticities in the World Market for Beef." In Elasticities in International
Agricultural Trade, eds., C. A. Carter and W. H. Gardiner, pp. 225-53. Boulder: Westview Press, 1988.Hahn, W. E, T. L. Crawford, L. Bailey, and S. Shagam. "The World Beef Market-Government Intervention
and Multilateral Policy Reform." Staff Rep. No. AGES 9051, U.S. Department of Agriculture, EconomicResearch Service, Commodity Economics Division, Washington DC, August 1990.
Hayes, D. J. Beef Market Update. Rep. prepared for the U.S. Meat Export Federation. Meat Export Research
Center, Iowa State University, May 1994.Houck, J. P. "Price Elasticities and Joint Products." J. Farm Econ. 46(August 1964):652-56.
. "The Short-Run Impact of Beef Imports.on U.S. Meat Prices." Aust. J. Agr. Econ. 56(April 1974):60-72.
Brester and Wohlgenant

156 July 1997 Journal of Agricultural and Resource Economics
Livestock Marketing Information Center. "Estimated Production of Ground & Processing Beef, Annual."
Table 6.110, Livestock Marketing Information Center Data Tables, Lakewood CO, August 1995.
Marsh, J. M. "Estimating Intertemporal Supply Response in the Fed Beef Market." Amer. J. Agr. Econ.
76(August 1994):444-53.Simpson, J. R. "The Countercyclical Aspects of the U.S. Meat Import Act of 1979." Amer. J. Agr. Econ.
64(May 1982):243-48.United Nations. FAO Trade Yearbook. FAO Statis. Ser. No. 63. Rome: Food and Agricultural Organization
of the United Nations. Various issues, 1980-95.
U.S. Department of Agriculture. Office of Economics. Effects of the Uruguay Round Agreement on U.S.
Agricultural Commodities. Washington DC: Economic Research Service, March 1994a.
. Livestock and Poultry Situation and Outlook Report. Washington DC: Economic Research Service.
Various issues, 1990-95..Livestock: World Markets and Trade. Cir. Ser. No. FL&P 2-94. Washington DC: Foreign Agricultural
Service, March 1994b.Red Meats Yearbook. Statis. Bull. No. 921. Washington DC: Economic Research Service, 1995.
U.S. Department of Labor. Consumer Price Indexes. Washington DC: Bureau of Labor Statistics. Various
issues. 1990-95.