impacts of surficial permafrost landforms on surface hydrology · rately model runoff in the arctic...
TRANSCRIPT

1 INTRODUCTION
Many coastal areas in the Arctic are characterized bytopographically low-gradients. Typically, the hydro-logic runoff response of low-gradient watersheds isdiminished because the gravitational forces that aremoving the water are quite small. Our efforts to accu-rately model runoff in the Arctic have been successfulin the higher gradient foothills, but not as successfulfor the coastal areas where the landscape is dominatedby wetlands, ponds and lakes. The main reason for thepoor model performance is the lack of quality digitalelevation data that would both delineate the drainagenetworks and define the distribution of the surfacewater bodies, including storage capabilities. Hall et al.(1994) have classified 83% of the Alaskan Arcticcoastal plain as wetlands. The two major reasons forthe presence of wetlands is the topography and thepresence of continuous permafrost; the fact that rela-tively large amounts of liquid water from snowmeltare present each year ensures that the summer seasonwill start out with wet conditions. In addition, thereare several permafrost related landforms that helpretard the runoff response from these watersheds.
The dynamic hydrologic event of the year for water-sheds on the low-gradient coastal plain of northernAlaska is the snowmelt breakup. Runoff response tosummer precipitation can be accurately described asminimal. There are several hydrologic processes andphysical features that minimize summer runoff; onethat has not been mentioned in the literature is the
impact of various permafrost related landforms thatare prevalent: drained-lakes, low-centered polygons(high-centered polygons to a lesser extent), strang-moor ridges and reticulate-patterned ground.
2 STUDY SITE
The Putuligayuk River drains north across the coastalplain of northern Alaska into the Arctic Ocean (Figure1). The river and watershed have the following fea-tures: drainage area of about 471 km2, elevation rangeof 7 to 109 m above msl, basin length of 60 km, streamlength 54 km and median watershed elevation of 39 m. This watershed is one of a nest of watershedsbeing studied on the North Slope of Alaska (Kane et al., 2000). The catchment is totally underlain bypermafrost from about 500 to 600 m thick. The lack oftrees and the abundance of wetlands, ponds and lakesare typical features of these high latitude areas (Figure2). Vegetation consists of grasses, sedges, shrubs andmosses. Active layer thickness is generally around50 cm. The USGS gauged this watershed for 15 years,from 1970–1986 (data for 1980 and 1981 missing);however no additional complementary hydrologicdata was collected in the area at that time. The USGScontinued to operate this site as a crest gauge from1987 until 1996. In 1993 we initiated some hydrologicand meteorological data collection adjacent to thePutuligayuk catchment, and we started gauging theriver at the old USGS site in 1999.
507
Impacts of surficial permafrost landforms on surface hydrology
D.L. Kane & R.E. GieckUniversity of Alaska Fairbanks Water & Environmental Research Center, Fairbanks, Alaska, USA
L.C. BowlingUniversity of Washington, Seattle, Washington, USA
ABSTRACT: The runoff response of low-gradient watersheds underlain by continuous permafrost is relativelyhigh during snowmelt, but low during the remainder of the summer period, although a majority of the annual pre-cipitation may occur during this three month period from June through August. Permafrost landforms such asdrained-lakes, low-centered polygons, strangmoor ridges and reticulate-patterned ground retard surface drainageand increase surface storage. This accounts for the abundance of lakes, ponds and wetlands found in many low-gradient arctic catchments. Near annual maximum solar energy during the summer, coupled with available sur-face water, results in substantial vertical fluxes of water back to the atmosphere by evaporation, but augmentedby transpiration. Evapotranspiration exceeds precipitation during the summer months. Extensive wetlands dry outduring the summer; this produces potential surface storage for future rainfall or snowmelt and fragments theexisting drainage network. The connectivity of the drainage network is only restored through large inputs of waterinto the basin; this generally occurs during the next spring snowmelt. A three-year case study of the PutuligayukRiver catchment (471 km2) in northern Alaska will be presented.
Permafrost, Phillips, Springman & Arenson (eds)© 2003 Swets & Zeitlinger, Lisse, ISBN 90 5809 582 7

3 RELEVANT STUDIES
Arctic watersheds with permafrost typically havehigher peak flows and lower base flows than moretemperate watersheds. The recession constant is onecharacteristic of the runoff hydrograph that reflectsphysical features of the watershed and other hydro-logic processes. The recession limb of snowmelt andrainfall runoff events can typically be described byexponential decay:
q qoe(�t/t*) (1)
where q is the streamflow rate (m3/s) at time t (hours),qo is the streamflow rate at time zero and t* is the reces-sion constant (sometimes reported as 1/t*). One mightexpect that the presence of permafrost may result in ashorter recession, but this is not the case. Permafrostdoes accelerate the initiation of runoff (McNamara et al., 1998) and reduce the baseflow contribution.
Several earlier studies have shown that the recessionconstant (t*) is greater for areas with permafrost. In anarea of discontinuous permafrost near Fairbanks, AK,Dingman (1973) determined a value of 39 h for a1.8 km2 catchment. In continuous permafrost, Likes
(1966) reported a value of 35 h for a 98 km2 basin near Cape Thompson, AK and Brown et al. (1968)determined a value of 160 h for a small basin nearBarrow, AK. More recently, McNamara et al. (1998)examined four neighboring catchments underlain bycontinuous permafrost that were located in the northernfoothills of the Brooks Range; they obtained averagevalues of 20.6 h for a 0.026 km2 hillslope drainage,30.2 h for 2.2 km2 Imnavait Creek, 74.4 h for 142 km2
Upper Kuparuk River and 167.2 h for 8140 km2
Kuparuk River. McNamara also showed that all ofthese values are significantly greater than those givenfor streams in the conterminous states by Holtan andOverton (1963).
The physical explanation for the high values of therecession constant by Likes (1966) was that the infil-tration into the surface active layer was released slowly.Dingman (1970) found that as evapotranspiration(ET) in the Subarctic increased, the recession constantdecreased; he further concluded that the Subarctic hadlow ET and therefore high recession values. McNamaraet al. (1998) offered an alternative explanation that thelack of subsurface storage because of permafrostrequires that water is lost from the watershed directlyto either ET or runoff. Arctic rivers have very highrunoff coefficients, but at the same time they have lowbase flows (McNamara et al., 1998; Kane et al., 1998,Lilly et al., 1998) that result in longer recessions. Allthese explanations relate to the fact that permafrostlimits subsurface storage and water is retained in theshallow active layer where the pathways are limited toET and runoff.
McNamara et al. (1997) also found that duringsnowmelt most of the runoff water came directly fromthe snowpack; during the summer, most of the runoffwas derived from older water stored in the activelayer, from earlier hydrologic precipitation events.
4 RESULTS
The runoff pattern for the Putuligayuk River consistsof a snowmelt peak with only slight runoff response tosummer precipitation (Figure 3) super-imposed on therecession flow. The pattern is repeated for 18 years ofrunoff data; the only difference is the magnitude andtiming of the snowmelt peak event. Unlike watershedsin the foothills, coastal catchments have considerablesurface storage in lakes, ponds and wetlands. Beforesnowmelt runoff is generated each spring the surfacestorage deficit from the previous summer must bereplenished (Bowling et al., 2002). During each sum-mer, ET exceeds precipitation (Mendez et al., 1998;Kane et al., 1990) and the surface storage deficit buildsagain. Precipitation generally increases over the sum-mer with August being the wettest month, while ET
508
Figure 1. Location and drainage map showing the low-gradient Putuligayuk River on the North Slope of Alaska. In contrast, both the adjacent Kuparuk and SagavanirktokRivers carry runoff from headwater foothills and mountains.

decreases from a maximum near the solstice; at sum-mer’s end some of the surface storage deficit thatdeveloped over the summer is recovered when precip-itation exceeds ET.
Obviously, the low-hydraulic gradient is partiallyresponsible for the slow hydrologic response of theseareas. In addition, many surficial permafrost land-forms further retard surface runoff. The fact that manyof these surficial permafrost features get fragmentedfrom the drainage network means that these areas areno longer contributing to the runoff response. Forexample, consider the drained lakes that are plentifulin this area. During snowmelt, a certain amount ofmelt water has to collect in the lake and raise the waterlevel before runoff is generated. During the summer,the lake outlet becomes perched as ET exceeds pre-cipitation. At this point, part of the basin becomes dis-connected until summer precipitation or snowmeltagain raises the lake water surface to a threshold level.During the summer, there is basically shrinkage of thedrainage network and an areal reduction in the con-tributing area for runoff. McNamara et al. (1999) haveconcluded that drainage networks in the Arctic are
509
Figure 2. A mosaic from x-band radar illustrating the dominating effect that lakes, ponds and wetlands have on the struc-ture of arctic coastal watersheds (August 31, 2000, Intermap Technologies, Inc).
0
20
40
60
801976
1979
1983
Putuligayuk River at Spine Road
Date5/19 6/3 6/18 7/13 7/18 8/2 8/17
Dis
char
ge (
m3 /s
)
Figure 3. Three typical summer hydrographs with noresponse to summer precipitation (data collected by theU.S. Geological Survey).
immature in their development, and they suggest thatthis is due to the presence of permafrost that retardserosion.
But other permafrost features such as low-centeredpolygons, strangmoor ridges and reticulate-patternedground further retard surface drainage and increasesurface water storage. This is done by physicallyblocking the flow by ridges normal to the flow path, as in the case of strangmoor ridges or water that istrapped in the center of low-centered polygons.
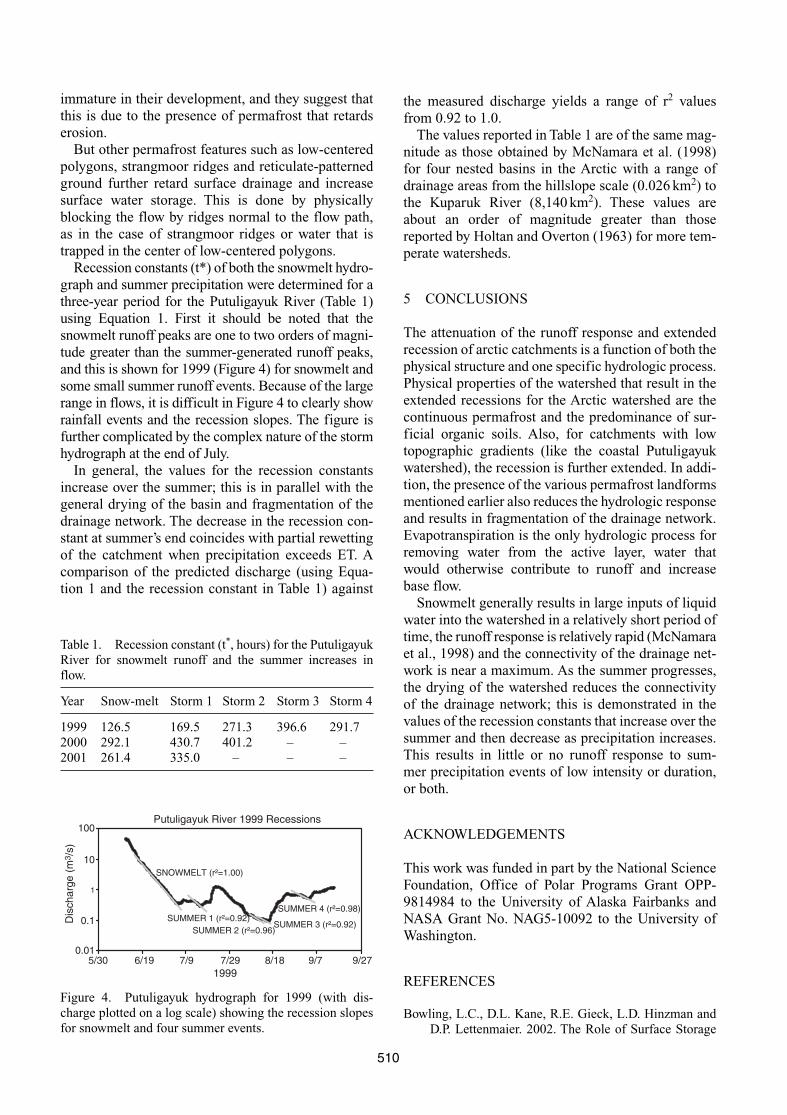
Recession constants (t*) of both the snowmelt hydro-graph and summer precipitation were determined for athree-year period for the Putuligayuk River (Table 1)using Equation 1. First it should be noted that thesnowmelt runoff peaks are one to two orders of magni-tude greater than the summer-generated runoff peaks,and this is shown for 1999 (Figure 4) for snowmelt andsome small summer runoff events. Because of the largerange in flows, it is difficult in Figure 4 to clearly showrainfall events and the recession slopes. The figure isfurther complicated by the complex nature of the stormhydrograph at the end of July.
In general, the values for the recession constantsincrease over the summer; this is in parallel with thegeneral drying of the basin and fragmentation of thedrainage network. The decrease in the recession con-stant at summer’s end coincides with partial rewettingof the catchment when precipitation exceeds ET. Acomparison of the predicted discharge (using Equa-tion 1 and the recession constant in Table 1) against
the measured discharge yields a range of r2 valuesfrom 0.92 to 1.0.
The values reported in Table 1 are of the same mag-nitude as those obtained by McNamara et al. (1998)for four nested basins in the Arctic with a range ofdrainage areas from the hillslope scale (0.026 km2) tothe Kuparuk River (8,140 km2). These values areabout an order of magnitude greater than thosereported by Holtan and Overton (1963) for more tem-perate watersheds.
5 CONCLUSIONS
The attenuation of the runoff response and extendedrecession of arctic catchments is a function of both thephysical structure and one specific hydrologic process.Physical properties of the watershed that result in theextended recessions for the Arctic watershed are thecontinuous permafrost and the predominance of sur-ficial organic soils. Also, for catchments with lowtopographic gradients (like the coastal Putuligayukwatershed), the recession is further extended. In addi-tion, the presence of the various permafrost landformsmentioned earlier also reduces the hydrologic responseand results in fragmentation of the drainage network.Evapotranspiration is the only hydrologic process forremoving water from the active layer, water thatwould otherwise contribute to runoff and increasebase flow.
Snowmelt generally results in large inputs of liquidwater into the watershed in a relatively short period oftime, the runoff response is relatively rapid (McNamaraet al., 1998) and the connectivity of the drainage net-work is near a maximum. As the summer progresses,the drying of the watershed reduces the connectivityof the drainage network; this is demonstrated in thevalues of the recession constants that increase over thesummer and then decrease as precipitation increases.This results in little or no runoff response to sum-mer precipitation events of low intensity or duration,or both.
ACKNOWLEDGEMENTS
This work was funded in part by the National ScienceFoundation, Office of Polar Programs Grant OPP-9814984 to the University of Alaska Fairbanks andNASA Grant No. NAG5-10092 to the University ofWashington.
REFERENCES
Bowling, L.C., D.L. Kane, R.E. Gieck, L.D. Hinzman andD.P. Lettenmaier. 2002. The Role of Surface Storage
510
1
10
100
1999
Putuligayuk River 1999 Recessions
Dis
char
ge (
m3 /
s)
0.1
0.015/30 6/19 7/9 7/29 8/18 9/7 9/27
SNOWMELT (r²=1.00)
SUMMER 1 (r²=0.92)SUMMER 2 (r²=0.96)
SUMMER 3 (r²=0.92)
SUMMER 4 (r²=0.98)
Figure 4. Putuligayuk hydrograph for 1999 (with dis-charge plotted on a log scale) showing the recession slopesfor snowmelt and four summer events.
Table 1. Recession constant (t*, hours) for the PutuligayukRiver for snowmelt runoff and the summer increases inflow.
Year Snow-melt Storm 1 Storm 2 Storm 3 Storm 4
1999 126.5 169.5 271.3 396.6 291.72000 292.1 430.7 401.2 – –2001 261.4 335.0 – – –

in a Low-Gradient Arctic Watershed. Submitted toWater Resources Research.
Brown, J., S.L. Dingman and R.J. Lewellen. 1968. Hydrol-ogy of a Drainage Basin on the Arctic Coastal Plain.USA CRREL, Hanover, NH, Research Report 240.
Dingman, S.L. 1970. Hydrology of Glenn Creek Watershed,Tanana River Basin, Central Alaska. USA CRREL,Hanover, NH, Research Report 297.
Dingman, S.L. 1973. Effects of Permafrost on StreamCharacteristics in the Discontinuous permafrost Zoneof Central Alaska. In: Permafrost, North AmericanContribution to the Second International Conference,Washington, DC, National Academy of Science, pp 447–453.
Hall, J.V., W.E. Frayer and B.O. Wilen. 1994. Status ofAlaska Wetlands. U.S. Fish and Wildlife Service,Alaska Region, Anchorage, AK, 32 pp.
Holtan, H.N. and D.E. Overton. 1963. Analyses andApplication of Simple Hydrographs. Journal ofHydrology, 2:309–323.
Kane, D.L., R.E. Gieck and L.D. Hinzman. 1990. Evapo-transpiration from a Small Alaskan Arctic Watershed.Nordic Hydrology, 21:253–272.
Kane, D.L., D.J. Soden, L.D. Hinzman and R.E. Gieck.1998. Rainfall Runoff in a Nested Watershed in theAlaskan Arctic. Proceedings, The 7th InternationalPermafrost Conference, Yellowknife, NWT, Canada,pp 539–544.
Kane, D.L., L.D. Hinzman, J.P. McNamara, Z. Zhang andC.S. Benson. 2000. An Overview of a NestedWatershed Study in Arctic Alaska. Nordic Hydrology,31(4/5):245–266.
Likes, E.H. 1966. Surface-water Discharge of OgoturukCreek. Environment of Cape Thompson Region,Alaska. US Atomic Energy Commission, Oak Ridge,TN, pp 125–131.
Lilly, E.K., D.L. Kane, L.D. Hinzman and R.E. Gieck.1998. Annual Water Balance for Three Nested Water-sheds on the North Slope of Alaska. Proceedings, The7th International Permafrost Conference, Yellowknife,NWT, Canada, pp 669–674.
McNamara, J.P., D.L. Kane and L.D. Hinzman. 1997. Hydro-graph Separation in an Arctic Watershed Using MixingModel and Graphical Techniques. Water ResourcesResearch, 33(7):1707–1719.
McNamara, J.P., D.L. Kane and L.D. Hinzman. 1998. AnAnalysis of Streamflow Hydrology in the KuparukRiver Basin, Arctic Alaska: A Nested WatershedApproach. Journal of Hydrology, 206:39–57.
McNamara, J.P., D.L. Kane and L.D. Hinzman. 1999. AnAnalysis of an Arctic Channel Network Using a DigitalElevation Model. Geomorphology, 29:339–353.
Mendez, J., L.D. Hinzman and D.L. Kane. 1998. Evapo-transpiration from a Wetland Complex on the ArcticCoastal Plain of Alaska. Nordic Hydrology, 29(4/5):303–330.
511
