impacts of smallholder participation in high-quality coffee markets
TRANSCRIPT

Impacts of smallholder participation in high-quality coffee markets: The Relationship Coffee
Model
Juan N. Hernandez-Aguilera
Ph.D. Student - Charles H. Dyson School of Applied Economics and Management Cornell University, Ithaca, NY. E-mail: [email protected]
Miguel I. Gómez
Associate Professor - Charles H. Dyson School of Applied Economics and Management Cornell University, Ithaca, NY. E-mail: [email protected]
Amanda D. Rodewald
Associate Professor - Cornell Lab of Ornithology and Department of Natural Resources Cornell University, Ithaca, NY. E-mail: [email protected]
Ximena Rueda
Assistant Professor - School of Business Universidad de los Andes, Bogota, Colombia. E-mail: [email protected]
Colleen Anunu
Master of Professional Studies in Agriculture and Life Sciences Cornell University, Ithaca, NY. E-mail: [email protected]
Ruth Bennett
Ph.D. Student - Cornell Lab of Ornithology and Department of Natural Resources Cornell University, Ithaca, NY. E-mail: [email protected]
Robert R. Schindelbeck
Extension Associate - Department of Crop and Soil Science Cornell University, Ithaca, NY. E-mail: [email protected]
Harold M. van Es
Professor - Department of Crop and Soil Science Cornell University, Ithaca, NY. E-mail: [email protected]
Selected Paper prepared for presentation at the 2015 Agricultural & Applied Economics Association and Western Agricultural Economics Association Annual Meeting, San Francisco, CA, July 26-28
Copyright 2015 by Juan N. Hernandez-Aguilera, Miguel I. Gómez, Amanda D. Rodewald, Ximena Rueda, Colleen Anunu, Ruth Bennett, Robert R. Schindelbeck, Harold M. van Es. All rights reserved. Readers may make verbatim copies of this document for non-commercial purposes by any means, provided that this copyright notice appears on all such copies.

Abstract
The Relationship Coffee Model (RCM) is an emerging business model in the coffee value chain
that promotes long-term partnerships between coffee buyers and smallholder growers based on
transparency, product quality and value sharing. However, to date, there are limited studies
assessing outcomes for the smallholder growers participating in high-quality coffee value chains
and specifically in models such as RCM. We developed a framework to examine how geography,
environmental conditions, production practices and technology affect coffee quality, and
consequently, grower’s ability to participate in RCM. In turn, we evaluated the impact of RCM
participation on key environmental, socio-economic, and technological indicators. Using data
collected from 265 Colombian smallholder growers, we examined relationships among socio-
economic characteristics, soil quality indicators, coffee landscape characteristics, bird
populations, and product quality scores. Our estimation based on propensity score matching
indicated that RCM participants employ more environmentally-friendly resource management
practices, have better understanding of the coffee business and are more optimistic about the
future of the industry, relative to non-participants. Although farm gate prices did not
significantly differ between the two groups, RCM participants had increased access to credit.
Overall, the estimated impacts suggest that RCM contributes to integrate smallholder growers
into global-coffee markets and generates socioenvironmental benefits.
Keywords: Specialty coffee; relationship coffee model; sustainable agriculture; cooperatives;
propensity-score matching. JEL Codes: Q13, Q17, Q20
2

1. Introduction
Coffee is the second most valuable commodity exported by developing countries after
petroleum (Haight, 2011). According to the International Coffee Organization (ICO), 25
million smallholders produce 80% of the world’s coffee, with the livelihoods of over 100
million people supported in some way by coffee production (Fairtrade, 2012). However,
recent drastic changes in global-coffee markets have affected smallholder growers in many
coffee-producing countries. In the past, coffee was traded primarily as a commodity, and
public policies played an important role in the coffee value chain (e.g., export quota system
mechanisms and coffee export boards in exporting countries). Today, in contrast,
governments have little influence on global-coffee markets and the product is becoming
increasingly differentiated (Lee and Gómez, 2013). With increased global competition, coffee
growers are currently exposed to high-price volatility and are challenged to become part of
private initiatives and certification schemes required for specialty-coffee value chains (Bacon,
2005; LeClair, 2002; Rueda and Lambin, 2013).
Specialty coffees differ from commodity coffees in two key dimensions, namely
product quality and/or production practices (Lewin et al., 2004). In the first dimension, coffee
is classified as ‘specialty’ based on physical and sensorial characteristics (e.g., aroma, flavor,
and body), which in turn determine a price premium for the product. In the second dimension,
specialty coffees differ from their commodity counterparts based on specific production
standards that ensure desired social and environmental outcomes (e.g., fair wages, adoption
of environmentally friendly practices). These practices are communicated to consumers
through various product labels (e.g., Fair Trade, Rainforest Alliance, Smithsonian-Bird
Friendly).
The Relationship-Coffee Model (RCM) is an emerging business model based on
product quality and social responsibility. RCM is a type of specialty coffee value chain
3

arrangement where smallholder growers work closely with roasters, buyers and importers to
establish a direct, long-term trading partnership for coffees that have high-quality cup profiles.
Not only is a price premium offered to growers for quality coffee, but RCM also promotes
transparency, traceability, and active engagement of smallholder growers throughout the
value chain (Raynolds, 2009). For instance, each year RCM smallholder growers’ and coffee
roasters meet for five days to analyze the coffee market challenges and agree on trade
conditions and quality standards (Sinclair, 2012). Although not always an explicit goal, the
RCM model is thought to indirectly incentivize good environmental stewardship given that
better environmental conditions will generally produce higher-quality coffee (e.g., Läderach
et al., 2011; Oberthür et al., 2011).
Despite the promise of RCM, the extent to it realizes positive social, economic, and
environmental outcomes remains to be tested. Most of our understanding of specialty coffee
chains comes from studies on the impacts and dynamics of smallholder participation on Fair
Trade and Organic certifications schemes (Bacon et al., 2008; Barham et al., 2011; Blackman
and Naranjo, 2012; Calo and Wise, 2005; De Janvry et al., 2010; Nelson and Pound, 2009;
Podhorsky, 2013; Ruben and Fort, 2012; Valkila, 2009). In contrast, there is limited
knowledge of the impacts of emerging business models such as the RCM, which promotes
smallholder participation in high-quality coffee value chains (Barham et al., 2011; Calo and
Wise, 2005; De Janvry et al., 2010; Donovan, 2011; Raynolds, 2009). Previous studies have
generally emphasized how environmental conditions affect coffee quality (e.g., Läderach et
al., 2011; Oberthür et al., 2011) rather the smallholder growers who participate in these
markets.
Knowledge of socioenvironmental outcomes of RCM is critically needed by private
and public decisionmakers and researchers interested in promoting and understanding
sustainable and profitable integration of smallholder growers into global food value chains.
4

To meet this need, we evaluated the economic, social and environmental outcomes of
smallholder participation in high-quality coffee value chains, in two important coffee
growing regions of Colombia. Initially, we developed a conceptual framework explaining
how geographic, environmental, production and technological factors influence smallholder
grower ability to produce high-quality coffee and to participate in RCM. Second, we
collected farm-level data related to soil quality, biodiversity of plants and animals, landscape
utilization, and household socio-economic characteristics. Third, we used a propensity score
matching model (Imbens and Rubin, 2014) to examine differences between RCM participants
and non-participants on various socio-economic and environmental outcomes.
2. Conceptual Framework
We used variables known to affect both coffee quality and participation by smallholder
growers to construct our conceptual framework of RCM impacts (Figure 1). Only those
growers that exceed a minimum threshold in coffee quality (typically over 80 on a scale from
0-100) are able to participate in RCM. Otherwise, they participate in the commodity market.
We then explicitly compared socio-economic, environmental, and technological outcomes
observed for RCM participants and non-participants. This framework integrates relationships
across key performance indicators found in the specialty coffee markets literature (Blackman
and Naranjo, 2012; Nelson and Pound, 2009; Ruben and Fort, 2012; Valkila, 2009; Wollni
and Brümmer, 2012) and in studies examining the effect of environmental conditions and
production processes on coffee-quality (Castro-Tanzi et al., 2012; De Janvry et al., 2010;
Läderach et al., 2011; Oberthür et al., 2011).
[FIGURE 1 HERE]
To classify variables as input or outcome variables, we used the notion of stock and
flows often employed in approaches linking ecological and economic systems (Häyhä and
Franzese, 2014). Accordingly, input variables refer to the stock of human, physical and social
5
capital, the stock of natural resources, and the types of technologies employed to combine
these stocks to yield a target product quality level. Outcome variables, for their part, refer to
the flow of environmental effects, socio-economic impacts and technological innovations
(Costanza and Daly, 1992; Odum, 1994), which we hypothesize depend on growers’ ability
to participate in RCM.
2.1 Input Variables
Several types of inputs can impact coffee quality at different levels. For example, geographic
conditions influence coffee quality at a regional scale, while other environmental
characteristics such as terrain slope and soil properties, are more relevant when analyzing a
particular farm or plot (Läderach et al., 2011; Oberthür et al., 2011). Specifically, soil
chemistry and nutrient retention capacity are important factors associated with coffee cup
quality (Castro-Tanzi et al., 2012). Consequently, in our framework the first set of inputs
comprises biological, chemical and physical soil health indicators, as well as geographic
indicators such as farm elevation.
In addition to geographical and environmental conditions, the use of certain
production practices as well as pre- and post-harvest technologies affect coffee quality levels.
For instance, the literature suggests that pulping exclusively ripe fruits and washing coffee
beans improves product quality (Dias et al., 2012; Knopp et al., 2006). In many countries,
including Colombia, smallholder growers implement these practices to simultaneously
preserve quality and avoid specific crop diseases (Guhl, 2008; Mueller et al., 2013; Rueda
and Lambin, 2013). Extension services, education programs and growers associations have
all contributed to disseminate and educate growers in these quality-enhancing practices.
Accordingly, we defined a second set of input variables that captures critical production
inputs, such as grower educational level and training in coffee production, grower exposure
to networks (e.g. level of participation in civic organizations) and grower stock of physical
6
capital (e.g. ownership of coffee production machinery). All of these factors influence a
grower’s ability to learn and adopt specific harvest and post-harvest techniques that preserve
and enhance product quality. Furthermore, within this same set, we considered other
indicators that reflect the type of technologies used by the growers, such as the production
factors more intensively used (e.g. labor: remunerations to contracted workers, land:
percentage of the farm allocated to coffee crops), the coffee-varieties grown (e.g. percentage
of Arabica Vs. Robusta), and if they are -or not- endorsed by coffee certifications that
validate specific-production practices (e.g. Fair Trade, Organic).
2.2 Outcome Variables
The potential outcomes derived from RCM participation are not limited to the quality
price premium received by growers. For instance, many RCM participants grow coffee under
a canopy of trees that, under certain site-specific conditions, increases coffee quality and
indirectly promotes sustainable land-use systems (Läderach et al., 2011; Vaast et al., 2006).
Furthermore, RCM engages smallholders in commercialization and marketing processes,
positively affecting their knowledge of the business model and their expectations about the
future of their coffee business (Raynolds, 2009).
Accordingly, we considered three broad outcome dimensions where RCM
participation could have a potential impact: environmental, technological and socio-
economical. The environmental dimension involves indicators typically associated with
sustainable resources management, such as water saving techniques; to sustainable landscape
practices, such as crop-tree diversity, and to biological indicators, such as bird biodiversity
(Blackman and Naranjo, 2012; Jha et al., 2014; Siebert, 2002; Tscharntke et al., 2011). The
technological dimension incorporates outcomes such as the preparation and use of their own
organic fertilizers, as well as innovations in the role that smallholder growers have
traditionally played in value chain and commercialization activities. This technological
7

dimension is relevant because some literature identifies poor understanding of common
instruments, concepts (e.g., price premiums, certifications), and roles in the value chain
(Ruben and Fort, 2012). Consequently, our framework includes measures of grower
knowledge of downstream value chain activities and functions (e.g. knowledge of the
exporter and roaster who buy the coffee that they produce).
Our framework also includes multiple socio-economical variables that reflect short-
term (or present) outcomes, with potential effects over human and physical resources in the
long term. Consequently, we considered outcomes likely to affect grower health (e.g. use of
protection equipment during agro-chemical application) and the availability and access to
alternative food sources (e.g. products different than coffee that are produced on the farm for
consumption and sell). In the same way, we considered access to microcredit because it
constrains physical assets (e.g. quality of their households and facilities and appropriate
machinery for production of high-quality coffees) of growers over the long-term (Bacon et al.,
2008; Raynolds, 2009). In addition, we measured price premium, the most common indicator
analyzed in the literature (Bacon et al., 2008; Barham et al., 2011; Calo and Wise, 2005; De
Janvry et al., 2010; Nelson and Pound, 2009; Raluca et al., 2014; Ruben and Fort, 2012),
using the farm price received by each grower. Lastly, among the socio-economic outcomes,
we evaluated how RCM participation affects grower’s outlook about coffee livelihoods,
measuring preferences that their children would be involved in coffee business in the future.
Finally, our conceptual framework illustrates the hypothesized ways that human and
physical capital, technology, and geography can be affected in by RCM participation as well
as the feedback loops between associated outcomes and future participation (Figure 1). For
instance, Rueda and Lambin (2013) show that the increasing demand for high-quality and
sustainable coffees has driven land-use decisions among Colombian farmers, and growers
who sell to these markets have experienced the greatest increase in area planted. Another
8

example is related to the adoption of shade-grown coffee systems to improve product quality.
These systems offer an appropriate habitat for many resident and migratory birds that provide
pest control services, thereby reducing input costs to growers and reliance on harmful
agrochemicals. Recent literature shows that insectivorous birds can halve coffee berry borer
infestations, which can save a medium-sized coffee farm up to US$9,400 annually and
ultimately modify the cost structure and technologies used on the farm (Karp et al., 2013).
3. Data
To evaluate the short-term impacts of the RCM participation, we considered an organization
that has been involved in the RCM for six years. This group of RCM participants included 78
growers from a cooperative located in Cauca department, Colombia. The control group
included 186 smallholder growers who did not participate in RCM. Of these, 66 growers
were located in the same department than RCM participants. The other 120 growers in the
control group were located in the Antioquia department and represented growers across a
range of coffee quality cup profiles and affiliations with coffee grower associations. We
assembled a farm-level database of input and outcome variables and collected information on
socio-economic indicators, soil quality, coffee landscape characteristics, bird diversity, and
coffee quality scores. These data are described below. (See supplementary online material for
detailed data description).
3.1 Socio-economic variables
Between August 2013 and January 2014, we conducted a voluntary survey eliciting detailed
socio-economic information of the household. For each farm in our sample, we interviewed
the head of the household and collected information on family composition, health status,
education level, family members working in the farm, among other household characteristics.
In addition, the survey incorporated questions about production factors and endowments such
as availability and use of machinery and equipment, farm size and farm ownership, among
9

others. The survey also included questions related to production, harvest and post-harvest
practices, common crop diseases and risks, use of paid labor, and farm gate prices, among
others. Finally, the survey included information on community characteristics, including
participation in civil organizations, security conditions in the region, and desire that their
children continue in the coffee business in the future.
3.2 Soil-quality variables
During the same span of time, we collected soil samples from fertile and less fertile areas on
each farm, that were identified by the growers, following the protocols and transportation
requirements for its posterior analysis (Gugino et al., 2009). These analyses provided soil
physical indicators such as aggregate stability and water capacity; biological soil indicators
including organic matter, active carbon and potentially mineralizable nitrogen; and a standard
soil chemical composition soil test. A protein analysis was conducted for each sample to
determine storage of organic nitrogen for later use by the soil system and plants. In addition
to their importance for coffee quality (Castro-Tanzi et al., 2012), these indicators can be also
linked to poverty and economic conditions of the growers as a healthier soil contributes to
enhance smallholders access to natural resource assets and affects land productivity (Scherr,
2000).
3.3 Analysis of coffee-growing landscape
Variation in the method of coffee cultivation, including variety, tree density, and percent
shade coverage have been shown to affect coffee quality (Läderach et al., 2011; Oberthür et
al., 2011; Vaast et al., 2006; Vaast et al., 2005). Certain land use practices may conserve
biodiversity on a landscape when considering the inclusion of native trees in coffee shade
composition and the communities of birds and other taxa supported in the coffee ecosystem.
In order to establish the differences between land use practices in RCM and non-participant
growers, we collected geographical and biophysical data in delimited transects on each farm.
10

We furthermore sought to link these land-use practices to biodiversity through bird
community assessments. We used a paired-match random sampling design to measure coffee
trees density and diversity, as well as non-coffee tree species richness, composition, canopy
cover and strata, and soil cover. On each farm, we established a 20x50 m quadrant, and at the
northwest and southeast corners of the plot were additionally demarcated 10x10 m quadrants.
Within each of the 10m2 quadrants, we measured the diameter at breast height (dbh) and
identified species of each non-sapling tree (i.e., >2m tall at bifurcation), within the quadrants.
All quadrants were geo-referenced in their southwestern-most point, where also we recorded
the elevation (See supplementary online material for maps).
In addition to tree species diversity, we estimated complexity of forest structure by
indicating presence/absence of 4 height strata (< 0.5m, 0.5. to 1.5m, 1.5 to 3m, and 3m+)
using a modified Relevé method (Mueller-Dombois, 2001). A stratum was marked as
“present” when foliage covered at least 20% of the surface area of the 10 x 10m quadrant.
Within the larger 20 x 50 m quadrant, we assessed tree species richness by counting the
number of different tree species within the entire transect area. At 0.5m-intervals along the
longitudinal 50m midline of each transect (100 points total), ground cover was classified as
leaf litter, weeds and/or plants, bare soil, and other. From these classifications, a proportional
estimation of ground cover composition was calculated.
3.4 Bird assessment
Bird communities were surveyed using point-count methodology (Bibby et al., 2000). Using
the same protocol to establish habitat-sampling points in the coffee landscape, we randomly
established a survey point within each coffee quadrant and another at the nearest edge
between the coffee and an adjacent habitat. For each point count, a trained observer recorded
all birds seen or heard within a 10-minute period between 0545 to 1100, the period with the
greatest bird activity. Distance to each bird, its relative location (i.e., being inside, outside, or
11

on the edge of each coffee plot), and its participation in mixed-species foraging flocks was
recorded for each individual detected within 100 m of the point count center. At each point
count location, data on weather (e.g., wind, precipitation, and cloud cover) and habitat (e.g.
distance to edge of coffee plot, percentage of coffee within 100 meter radius, number of trees
within a 100 meter radius, and average canopy height) were also recorded.
We recorded 205 bird species in surveys. Species diversity (i.e., total number of
species detected on a farm) and total bird abundance were used as two broad descriptors of
the bird community. Because we also were interested in potential pest control services
provided by birds, we considered species within three genera identified in feeding trials by
Karp et al. (2013) to be predators of the coffee borer beetle: Setophaga (S. petechial, S.
cinerea, S. fusca, S. pitiayumi, S. ruticilla), Basileuterus (B. culicivorus, B. luteoviridis) and
Pheugopedius (P. mystacalis). Many of these same species heavily use shade-coffee farms,
which also are associated with high quality cup profiles (Vaast et al., 2006).
3.5 Quality Scores
A certified coffee cupper in our team (Q grader) verified the coffee quality and quality
evaluation protocols followed by the cooperative under RCM participants and non-
participants. These quality assessments are actually performed by the roasters when
deciding to buy or not specific lots, and follow the Specialty Coffee Association of America
standards (SCAA, 2013). Although it was not possible to collect and analyze individual
coffee samples for each grower, it was verified that the coffee gathered and exported by the
cooperative under RCM fulfilled the required standards. In addition, in the control group, we
found growers with quality scores that potentially would allow them to participate in the
RCM.
12

4. Preliminary data statistics: Selection into RCM
We found evidence that RCM participants and non-participants differ in key
geographical, environmental and technological inputs. Table 1 shows those differences for a
representative set of input variables. In particular, soil iron content of RCM participants was
lower, and both protein and soil respiration were higher, in comparison to non-participants.
These soil conditions provide an advantage and a better soil endowment to RCM participants,
since higher indicators of protein and soil respiration are associated to desirable soil
characteristics like the ability to make nitrogen available by mineralization, soil aggregation
and water movement (Gugino et al., 2009).
RCM participants also exhibited greater human capital, in terms of better training in
agricultural production. On average, RCM participants received some training in agricultural
production from twice as many institutions or organizations (1.88 institutions for RCM
participants Vs. 0.85 for non-participants). Social capital also was higher among RCM
participants since they participated more in formal and informal networks with other coffee
growers than non-participants. Not only social capital, but also physical capital of RCM
participants was greater, as indicated by higher rates of ownership of coffee production
machinery and more informal saving stocks compared to non-participants. Collectively, these
differences suggest the possibility of a positive selection bias in our sample, given that more
education, better machines and a higher social cohesion may growers to performance in the
coffee business better, regardless of whether or not they participate in RCM.
In addition, both groups differ in grower’s housing infrastructure and access to
facilities, coffee varieties produced in the farm and percentage of coffee-crop area. On
average, non-participants allocated a higher proportion of their farms devoted to coffee
production compared with RCM participants (0.71 non-participants Vs. 0.54 participants).
However, the greatest difference between both groups refers to the enrollment on labor-
13

related certifications such as Fair Trade. Almost all RCM participants (97%) are certified
while only 30% of the non-participants are. Overall, these results suggest important
differences in the input variables between RCM participants and non-participants that will
contribute to over -or under- estimate the outcome effects of RCM participation. In order to
reduce these biases, and before estimate any outcome difference, we defined a set of
comparable RCM participants and non-participants. As explained in the next section, we used
Imbens and Rubin (2014) algorithm to predict the participants and non-participants
probabilities of RCM-participation and then, to compare similar growers.
[TABLE 1 HERE]
5. Empirical model
We followed Imbens and Rubin (2014) methodology to assess outcome differences between
RCM participants and non-participants and reduce the bias due to confounding variables.
Initially, we selected the relevant input variables to predict RCM participation based on a
large set of candidate variables. Subsequently, to ensure comparable groups of RCM
participants and non-participants, we verified that selected input variables were similar (i.e.
balancing and overlapping properties). Finally, we estimated the outcome differences
between equivalent participants and non-participants.
A critical assumption of this methodology is referenced by the literature as
unconfoundedness (Imbens and Rubin, 2014). This assumption implies that, given the
potential outcomes and the observed inputs, the probability (Pr) of RCM participation equals
the probability of participation given only the observed inputs. Mathematically:
Pr(𝑊𝑊𝑖𝑖 = 1|𝑌𝑌𝑖𝑖(0),𝑌𝑌𝑖𝑖(1),𝑋𝑋𝑖𝑖) = Pr(𝑊𝑊𝑖𝑖 = 1|𝑋𝑋𝑖𝑖) = 𝑒𝑒(𝑋𝑋𝑖𝑖) (1)
In equation (1) 𝑊𝑊 represents the participation in the RCM (0=non-RCM participants,
1=RCM participants); 𝑌𝑌𝑖𝑖(0) and 𝑌𝑌𝑖𝑖(1) the outcome variables for grower 𝑖𝑖 if not enrolled and
enrolled in the RCM respectively, 𝑋𝑋 the inputs or observed variables used to predict
14

participation, and e the probability of participate in the RCM, or the propensity score (p-
score).
The unconfoundedness assumption is not testable because it is impossible to
simultaneously know for the same grower his outcomes if he participate and not participate in
the RCM �𝑌𝑌𝑖𝑖(0),𝑌𝑌𝑖𝑖(1)�. However, to support this assumption, we collected as much
information as possible from each grower, assuming that even latent variables (i.e.,
unobservable characteristics) could be properly accounted through the use of the observable
input variables.
One of the main advantages of propensity score methodology is that it matches
numerous observable characteristics among RCM participants and non-participants to a
single measure, reducing the dimensionality problem (Rosenbaum and Rubin, 1983). This
methodology has been widely used in previous studies (Blackman and Naranjo, 2012;
Mendola, 2007).
5.1 Input variables and the selection algorithm
First, we specified a logistic regression where the dependent variable 𝑊𝑊 was equal to one if a
grower participated in RCM or it was equal to zero otherwise. In general, participation is
initially defined as a function of all possible input variables and their interactions (see online
material for a description of the complete set of input variables). Following Imbens and
Rubin (2014), we verified whether the inclusion of each input variable and interaction
improved the goodness of fit (measured by the likelihood ratio test statistic), and contributed
to preserve similar input characteristics (i.e. mean, standard deviations) between RCM
participants and non-participants.
Furthermore, we verified that RCM participants and non-participants shared a
common support, which refers to an initial block of comparable p-scores among participants
and non-participants (Heckman et al., 1997). Accordingly, non-participants with propensity
15

scores below the lowest probability estimated among participants, and RCM participants with
p-scores above the highest propensity score estimated for non-participants were dropped.
This procedure, called trimming, ensures the existence of comparable probabilities between
groups, and improves the consistency of the estimated parameters, but at the cost that the
original sample will be reduced.
Finally, we compared the means of the estimated propensity scores for RCM
participants and non-participants in the initial trimmed block. Generally, when this
difference is not statistically different from zero, sub-blocks of participants and non-
participants are defined looking for comparable paired participants and non-participants. New
sub-blocks are defined until further splitting of the initial block (at the median of the
respective p-scores) is not possible because these new blocks are too small.
5.2 Input Variables Balancing and Overlapping
To test for balancing, we verified that the means of input variables for participants and non-
participants were similar. We used two methods to test for balancing of our data. First, for
each input variable, we tested the hypothesis that the difference in means between
participants and non-participants was not statistically different than zero. Generally, if values
of this statistic are substantially larger in absolute value than one, the stratification does not
lead to satisfactory balance in the covariates. Second, we tested the hypothesis that the input
variable means do not depend on program participation. When values in this statistic are
concentrated towards more negative values relative to a normal distribution there is less
evidence of a good balance (Appendix A summarizes the main equations related to these
tests).
Furthermore, we verified that input variables for RCM participants and non-
participants overlapped and shared similar dispersions on their distributions. We reported
four measures to assess overlapping for each input variable: 1) the difference in means by
16

treatment group normalized by the square root of the average within group variance; 2) the
ratio of the participants and non-participants standard deviations; 3) the proportion of
participants outside the 0.025 and 0.975 quantiles of the non-participants’ distribution; and 4)
the proportion of non-participants outside the 0.025 and 0.975 quantiles of the participants’
distribution. In general, higher values in measures three and four imply that it will be
relatively difficult to predict missing potential outcomes for participants and non-participants
groups since there will be a higher proportion of comparable observations at the tails of the
distributions.
5.3 Propensity score matching
After verifying balancing and overlapping in the inputs, we matched participants and non-
participants according to the estimated propensity scores. We estimated outcome differences
between the two groups based on several criteria including: a single match on p-score with no
bias reduction assuming homoscedasticity for the standard errors; a single match on p-score
with no bias reduction assuming heteroscedasticity; a Mahalanobis distance matching
designed to minimize differences on all covariates employed in estimating the p scores; and
multiple matches based on p scores using two, three and four matches (Imbens and Rubin,
2014; Morgan and Harding, 2006).
6. Results and discussion of outcome differences
Table 2 summarizes the fifteen relevant input variables that were selected by the Imbens and
Rubin (2014) algorithm to predict grower RCM participation (see Appendix B for the logit
model specification and estimation). After trimming, the final subsample of comparable
RCM participants and non-participants is constituted by 25% of the initial sample, and p
scores in this block goes from 0.00023 to 0.92. Although the difference in p scores means’
between participants and non-participants was different than zero, the block was not
amenable for additional splitting.
17

[TABLE 2 HERE]
We proceed by checking balancing and distribution overlapping for the fifteen input
variables selected. In general, RCM participants and non-participants’ inputs were balanced
(Table 3) and overlapped (Table 4). However, this was not the case for labor-related
certifications (i.e., participation in Fair Trade certifications), which was the variable with the
greatest mean difference between both groups before trimming (Table 1). In particular, Table
4 shows that labor-related certifications variable has the largest mean difference between
participant and non-participants relative to its variance (0.828). In contrast, other related
measures, such as the environmental-related certification variable, were balanced and
overlapped among RCM participants and non-participants (although were not selected by the
algorithm to predict RCM participation).
[TABLE 3 HERE]
[TABLE 4 HERE]
Table 5 compares the variables before and after the application of Imbens and Rubin’s
method. The results show that, after establishing the comparable subsample of growers, there
are not significant differences in input variable means between participants and non-
participants. The only exception is the labor-related certifications variable, which confirms
that participation in Fair Trade certifications is highly associated to RCM-participation.
[TABLE 5 HERE]
6.1 Outcome differences between RCM participants and non-participants
Once balancing and overlapping properties were verified in the input variables, we estimated
the difference in outcomes between RCM participants and non-participants. Table 6 describes
the outcome variables reported.
[TABLE 6 HERE]
18
Our findings suggest that RCM participation is associated with environmentally
friendly and sustainable resources management practices (Table 7). Specifically, RCM
participants’ used on average at least one additional technique to save water, compared with
similar non-participants. Furthermore, around 36% to 56% more of RCM participants,
affirmed that they used more biological control methods compared with other growers in the
area (four out of the six matching alternatives suggest significant differences). In addition,
RCM growers prepared in higher proportion their own organic fertilizers (between 27% to
42%); affirmed in a higher proportion that they used organic fertilizers during the last crop
(between 43% to 59%), and implemented more times organic fumigation alternatives against
coffee rust (between 28% to 65%).
[TABLE 7 HERE]
Moreover, RCM farms had greater tree diversity than non-RCM farms. We identified in the
small quadrants of 10x10 meters, about 0.54 to 0.80 more trees species on average.
Furthermore, RCM participants had increased volumes of Inga trees for shading planted on
their farms, with around 20 centimeters more in the average diameter of the trees measured in
the small quadrants. This tropical tree species contributes to nitrogen-fixing (Rhoades et al.,
1998) and also is preferred by many foraging birds (Newell et al. 2014).
In general, the higher tree diversity within RCM coffee crops is considered a
sustainable agro-ecological practice since it conserves soil health and reduces nutrient
leaching and forest fragmentation (Wezel et al., 2014). Simultaneously, this crops tree
diversity contributes to break the dependence to chemical inputs due to adaptation and
resistance developed by pests (Carvalho, 2006; Méndez et al., 2009). Indeed, we found
evidence of less intensive use of chemicals, as reflected by the lower levels of potassium in
RCM soils (52.9 ppm less compared to non-RCM soil samples table 7).
19

Although RCM participation is thought to be associated with price advantages, we did
not find any significant differences in farm gate prices received by RCM participants and
non-participants (table 7). That said, RCM participants may have indirectly received the price
premiums, through their cooperatives. For example, RCM participants had 30% to 60%
greater access to microcredit for, than non-participants.
We also identified outcomes that affect human capital and grower’s health and access
to food sources. Specifically, RCM participants used more protective equipment during
fumigation and, on average, for nearly 50% more of the comparable RCM participants over
half of the food that they daily consume was produced in their own farms. Furthermore, RCM
participants sold and consumed a greater number of products (different than coffee) produced
on their farms compared to non-participants. The increased diversity of trees and products
observed in RCM farms may expand the set of goods that growers can consume and
represents an additional source of income.
Innovations in the business model have also impacted the way as smallholder growers’
link to global markets, affecting their expectations of the coffee business and their perception
and empowerment on the value chain. RCM participants had better knowledge of the value
chain in which they participated and also a higher proportion of participants (at least 35%
more participants than non-participants) expect that future generations will be involved in the
coffee business (Table 7). RCM principles of transparency and traceability play an important
role on these outcomes.
We estimated bird survey differences for the full sample, and the refined sample that
considers comparable RCM participants and non-participants (Table 8). We found similar
abundance and species richness of birds in participant and nonparticipant farms for the
refined sample. Because bird-friendly habitat can take years to develop fully, biodiversity
benefits are best examined over longer time scales. Interestingly, the most common genus of
20

documented borer predators, Setophaga, was nearly 60% more abundant on participant farms
on average (1.92 Vs. 1.19). Though this trend was not statistically significant, it hints that
pest control services may be realized on RCM farms.
[TABLE 8 HERE]
As mentioned before, Fair Trade enrollment was significantly higher among RCM-
participants. In order to determine if the observed differences by RCM participation are
explained by Fair Trade certification, we ran the Imbens and Rubin (2014) algorithm for
certified (treatment) and non-certified (control) smallholders using the original input
variables and adding the RCM participation variable as an input. We found that all input
variables were relatively well balanced and overlapped (see appendix C). In addition, we did
not find significant differences in outcomes between certified and non-certified participants
(Table C2 in appendix C). The only outcome variable that was significantly higher among
certified smallholders was the use of protective equipment during fumigation. This is not
surprising given that Fair Trade certification is oriented to protect workers safety conditions.
Thus, while outcomes associated with RCM-participation are unlikely to be
completely explained by Fair Trade, we recognize that Fair Trade certification standards are
aligned with many of the same principles, such as cooperative practices, supported by RCM.
Likewise, Fair Trade certification may facilitate participation in RCM, and the initial
matching between the cooperatives and the RCM importer (as we suspect may have been the
case for our RCM cooperative). What we argue, is that RCM and certifications such us Fair
Trade can complement one another by emphasizing different attributes (e.g., product quality,
conditions for growers, environmental health).
Currently, Fair Trade certification does not recognize product quality. Instead, this
certification generally targets economically disadvantaged producers, with limited capital,
reduced market access and low bargaining power. In this context, Fair Trade price premiums
21

appear relatively more appealing for producers selling lower-quality coffee since they will
receive a fixed amount with the certification, without any concern about product quality
investments (Raluca et al., 2014). In the long run, the market is likely to react to the lower
quality, driving down the price premiums for Fair Trade growers (De Janvry et al., 2010).
Some experiments show that buyers are willing to pay 50 cents extra for a pound of Fair
Trade coffee (Hertel et al., 2009; Verteramo et al., 2014). Nevertheless, empirically, has been
also proved that consumers reduce their willingness to pay for a lower quality Fair-Trade
coffee. For instance, a 9 percent increase in price result in a 30 percent decline in demand for
a product with lower quality, while the demand for more expensive an higher quality coffee
is insensitive to price (Hainmueller et al., 2014).
RCM better ensures the viability of the business model by actively promoting the
smallholder participation in high-quality coffee value chains; while, third party certifications,
provide relevant information about growers’ organizations and grower’s working conditions
to importers, roasters and final consumers (Nelson and Pound, 2009; Raluca et al., 2014) In
addition, when growers consider alternatives such us the inclusion of diverse trees in coffee
shade composition to improve coffee quality, economic and environmental goals are aligned.
Sustainability is not just about fair trade practices and production methods that foster
environmental protection. It is also about product quality to promote sustainable participation
of smallholders in high-quality value chains.
Although smallholder participation in high-quality coffee value chains such as RCM
seems to be an alternative for the growers and the environment, this model faces its own set
of challenges. One of the main difficulties for the model is how to allocate the price
premiums associated to high-quality coffee. In our interviews, and other similar studies
(Prevezer, 2013), growers enrolled in cooperatives often complained of the lack of
communication about the allocation of price premiums and the decision making process. We
22
must better understand the consequences of improvements in coffee quality and different
payout schemes for premiums (e.g. directly to growers to induce individual efforts to improve
coffee quality or to the cooperatives to support infrastructure or programs). Although
cooperatives are crucial to link farmers to high-value markets (Wollni and Brümmer, 2012),
ownership and governance of these cooperatives ultimately may determine who benefits from
such quality differentiation (Neilson, 2007).
In addition, besides the long run benefits of higher tree diversity and more organic
alternatives (in terms of pest control, soil health and food availability), these forms of
production also imply a significant reduction in coffee yields and higher labor costs in the
short term (Atallah and Gómez, 2014; Valkila, 2009). Quality price premiums and business
models should justify and recognize those transitions. The development of dynamic models
over specific relations like shade plantations, coffee quality, birds populations services,
consumers preferences and price premiums would contribute to understand those long-term
interactions and the most effectively way to insert growers into sustainable global markets.
8. Conclusions
After using propensity score matching to control for self-selection bias among
smallholder coffee growers in Colombia, we found evidence that RCM participation was
associated with several socioenvironmental benefits. First, RCM farms had greater tree
diversity which should improve the ability of these farms to support other biodiversity, the
access and availability of food for growers, as well as reduces dependency on agrichemicals.
Second, RCM participants employed more water-saving practices and organic fertilizers than
non-participants. Third, participants had better access to credit, were more knowledgeable of
downstream segments of the value chain, and felt more optimistically about the future of the
coffee business relative to non-participants.
23

The results show that high-quality coffee production systems are complementary to
traditional certifications schemes, achieving similar desirable outcomes in social and
environmental terms, but in addition, incorporating the coffee quality aspect that consumers
are demanding. Future research should identify efficient mechanisms to distribute quality-
based price premiums across cooperative members and alternative mechanisms to incentivize
growers’ efforts to increase product quality individually and collectively. In addition, future
research would contribute to understand the dynamic behind growers’ decision to adopt
sustainable coffee agro ecosystems, given the potential interactions between neo-tropical
birds populations and pest control services. For that purpose, it is required to study in more
detail the smallholder growers’ production costs and their behavior in terms of discount rates,
cooperation and risk attitude.
Finally, our results are relevant to other crops beyond coffee. Cocoa production, for
example, is similar in many respects to specialty coffee production (Anglaaere et al., 2011).
In general, the integration of efficient agricultural production with biodiversity conservation
is a global challenge (Railsback and Johnson (2014) and research and policy decisions are
striving to link sustainable agriculture production with sustainable livelihoods (Jha et al.,
2014). Future studies focusing on cooperation to increase quality and additional impact
evaluations in other countries can contribute to identify appropriate structures to elevate
product quality.
24

Acknowledgements
We thank Federación Campesina del Cauca and Cooperativa Andes, particularly the coffee
growers who participated in this study and the administrative staff that provided logistical
support. We also thank Sustainable Harvest for facilitating contact with the aforementioned
organizations. This study was supported by the Atkinson Center for a Sustainable Future, the
Einaudi Center and the Graduate School at Cornell University.
Appendix A. Balancing and Overlapping Tests
[Appendix A Here]
Appendix B. Logit Model Estimation
[Appendix B. Table B1 Here]
Appendix C. Labor-related certifications comparable groups and outcomes
[Appendix C. Table C1 Here]
[Appendix C. Table C1 Here]
Appendix D. Supplementary material (online version).
D1. Initial Input Variables Set
[TABLE D1 HERE]
D2. Survey
[PDF ATTACHED]
D3. Complementary information on birds watching
D3. Geo-referenciation RCM participants and non-participants farms
[FIGURE D1 HERE]
[FIGURE D2 HERE]
[FIGURE D3 HERE]
25

References
Anglaaere, L.C., Cobbina, J., Sinclair, F.L., McDonald, M.A., 2011. The effect of land use systems on tree diversity: farmer preference and species composition of cocoa-based agroecosystems in Ghana. Agroforestry systems 81, 249-265.
Atallah, S.S., Gómez, M.I., 2014. Bioeconomics of Climate Change Adaptation: Coffee Berry Borer and Shade-Grown, 2014 Annual Meeting, July 27-29, 2014, Minneapolis, Minnesota. Agricultural and Applied Economics Association.
Bacon, C., 2005. Confronting the Coffee Crisis: Can Fair Trade, Organic, and Specialty Coffees Reduce Small-Scale Farmer Vulnerability in Northern Nicaragua? World Development 33, 497-511.
Bacon, C.M., Ernesto Mendez, V., Gomez, M.E.F., Stuart, D., Flores, S.R.D., 2008. Are sustainable coffee certifications enough to secure farmer livelihoods? The millenium development goals and Nicaragua's Fair Trade cooperatives. Globalizations 5, 259-274.
Barham, B.L., Callenes, M., Gitter, S., Lewis, J., Weber, J., 2011. Fair trade/organic coffee, rural livelihoods, and the “agrarian question”: Southern Mexican coffee families in transition. World Development 39, 134-145.
Bibby, C.J., Burgess, N.D., Hill, D.A., 2000. Bird census techniques, Second Edition ed. Academic press.
Blackman, A., Naranjo, M.A., 2012. Does eco-certification have environmental benefits? Organic coffee in Costa Rica. Ecol. Econ. 83, 58-66.
Calo, M., Wise, T.A., 2005. Revaluing peasant coffee production: Organic and fair trade markets in Mexico. Global Development and Environment Institute, Tufts University.
Carvalho, F.P., 2006. Agriculture, pesticides, food security and food safety. environmental science & policy 9, 685-692.
Castro-Tanzi, S., Dietsch, T., Urena, N., Vindas, L., Chandler, M., 2012. Analysis of management and site factors to improve the sustainability of smallholder coffee production in Tarrazú, Costa Rica. Agriculture, Ecosystems & Environment 155, 172-181.
Costanza, R., Daly, H.E., 1992. Natural capital and sustainable development. Conservation biology 6, 37-46.
De Janvry, A., McIntosh, C., Sadoulet, E., 2010. Fair Trade and free entry: Generating benefits in a disequilibrium market. USAID-BASIS Working Paper, Washington, DC.
Dias, E.C., Borém, F.M., Pereira, R.G.F.A., Guerreiro, M.C., 2012. Amino acid profiles in unripe Arabica coffee fruits processed using wet and dry methods. European Food Research and Technology 234, 25-32.
Donovan, J.A., 2011. Value chain development for addressing rural poverty: asset building by smallholder coffee producers and cooperatives in Nicaragua. SOAS, University of London.
26

Fairtrade, 2012. Commodity briefing, May ed. Fairtrade Foundation.
Gugino, B.K., Abawi, G.S., Idowu, O.J., Schindelbeck, R.R., Smith, L.L., Thies, J.E., Wolfe, D.W., van Es, H.M., 2009. Cornell soil health assessment training manual. Cornell University College of Agriculture and Life Sciences.
Guhl, A., 2008. Café y cambio de paisaje en Colombia, 1970-2005. Fondo Editorial Universidad EAFIT.
Haight, C., 2011. The problem with fair trade coffee. Stanford Social Innovation Review 3, 74-79.
Hainmueller, J., Hiscox, M.J., Sequeira, S., 2014. Consumer Demand for the Fair Trade Label: Evidence from a Multi-Store Field Experiment. Review of Economics and Statistics.
Häyhä, T., Franzese, P.P., 2014. Ecosystem services assessment: A review under an ecological-economic and systems perspective. Ecological Modelling 289, 124-132.
Heckman, J.J., Ichimura, H., Todd, P.E., 1997. Matching as an econometric evaluation estimator: Evidence from evaluating a job training programme. The review of economic studies 64, 605-654.
Hertel, S., Scruggs, L., Heidkamp, C.P., 2009. Human rights and public opinion: From attitudes to action. Political Science Quarterly 124, 443-459.
Imbens, G.W., Rubin, D.B., 2014. Causal inference in statistics and the social sciences. Cambridge and New York: Cambridge University Press. forthcoming.
Jha, S., Bacon, C.M., Philpott, S.M., Méndez, V.E., Läderach, P., Rice, R.A., 2014. Shade Coffee: Update on a Disappearing Refuge for Biodiversity. BioScience 64, 416-428.
Karp, D.S., Mendenhall, C.D., Sandí, R.F., Chaumont, N., Ehrlich, P.R., Hadly, E.A., Daily, G.C., 2013. Forest bolsters bird abundance, pest control and coffee yield. Ecology Letters 16, 1339-1347.
Knopp, S., Bytof, G., Selmar, D., 2006. Influence of processing on the content of sugars in green Arabica coffee beans. European Food Research and Technology 223, 195-201.
Läderach, P., Oberthür, T., Cook, S., Estrada Iza, M., Pohlan, J.A., Fisher, M., Rosales Lechuga, R., 2011. Systematic agronomic farm management for improved coffee quality. Field Crops Research 120, 321-329.
LeClair, M.S., 2002. Fighting the Tide: Alternative Trade Organizations in the Era of Global Free Trade. World Development 30, 949-958.
Lee, J., Gómez, M.I., 2013. Impacts of the End of the Coffee Export Quota System on International-to-Retail Price Transmission. Journal of Agricultural Economics 64, 343-362.
27

Lewin, B., Giovannucci, D., Varangis, P., 2004. Coffee markets: new paradigms in global supply and demand. World Bank Agriculture and Rural Development Discussion Paper.
Méndez, V.E., Shapiro, E.N., Gilbert, G.S., 2009. Cooperative management and its effects on shade tree diversity, soil properties and ecosystem services of coffee plantations in western El Salvador. Agroforestry Systems 76, 111-126.
Mendola, M., 2007. Agricultural technology adoption and poverty reduction: A propensity-score matching analysis for rural Bangladesh. Food policy 32, 372-393.
Morgan, S.L., Harding, D.J., 2006. Matching estimators of causal effects prospects and pitfalls in theory and practice. Sociological Methods & Research 35, 3-60.
Mueller, B.C., Gómez, M.I., Ricketts, K., 2013. An evaluation of extension services of the Colombian Coffee Growers Federation MEAS, USAID.
Mueller-Dombois, D., 2001. Island biogeography. Encyclopedia of Biodiversity 3, 565-580.
Neilson, J., 2007. Institutions, the governance of quality and on ‐farm value retenti Indonesian specialty coffee. Singapore Journal of Tropical Geography 28, 188-204.
Nelson, V., Pound, B., 2009. The last ten years: a comprehensive review of the literature on the impact of Fairtrade. Natural Resources Institute, 1-48.
Oberthür, T., Läderach, P., Posada, H., Fisher, M.J., Samper, L.F., Illera, J., Collet, L., Moreno, E., Alarcón, R., Villegas, A., Usma, H., Perez, C., Jarvis, A., 2011. Regional relationships between inherent coffee quality and growing environment for denomination of origin labels in Nariño and Cauca, Colombia. Food Policy 36, 783-794.
Odum, H.T., 1994. Ecological and general systems. Univ. Press of Colorado.
Podhorsky, A., 2013. Certification programs and north-south trade. Journal of Public Economics 108, 90-104.
Prevezer, M., 2013. Fairtrade governance and its impact on local development, in: Granvillle, B., Dine, J. (Eds.), The Process and Practices of Fair trade. Routledge, London, pp. 19-42.
Railsback, S.F., Johnson, M.D., 2014. Effects of land use on bird populations and pest control services on coffee farms. Proceedings of the National Academy of Sciences 111, 6109-6114.
Raluca, E., Daniele, G., Nathan, N., 2014. The Economics of Fair Trade. Journal of Economic Perspectives 28, 217-236.
Raynolds, L.T., 2009. Mainstreaming fair trade coffee: from partnership to traceability. World Development 37, 1083-1093.
28

Rhoades, C.C., Eckert, G.E., Coleman, D.C., 1998. Effect of pasture trees on soil nitrogen and organic matter: implications for tropical montane forest restoration. Restoration Ecology 6, 262-270.
Rosenbaum, P.R., Rubin, D.B., 1983. The central role of the propensity score in observational studies for causal effects. Biometrika 70, 41-55.
Ruben, R., Fort, R., 2012. The impact of fair trade certification for coffee farmers in Peru. World Development 40, 570-582.
Rueda, X., Lambin, E.F., 2013. Linking Globalization to Local Land Uses: How Eco-Consumers and Gourmands are Changing the Colombian Coffee Landscapes. World Development 41, 286-301.
SCAA, 2013. Specialty Coffee Association of America Protocols - Cupping Specialty Coffee.
Scherr, S.J., 2000. A downward spiral? Research evidence on the relationship between poverty and natural resource degradation. Food policy 25, 479-498.
Siebert, S.F., 2002. From shade-to sun-grown perennial crops in Sulawesi, Indonesia: implications for biodiversity conservation and soil fertility. Biodiversity & Conservation 11, 1889-1902.
Sinclair, L., 2012. Let’s Talk Coffee: 5 Takeaways. Sprudge. com 9.
Tscharntke, T., Clough, Y., Bhagwat, S.A., Buchori, D., Faust, H., Hertel, D., Hölscher, D., Juhrbandt, J., Kessler, M., Perfecto, I., 2011. Multifunctional shade ‐tree managem in tropical agroforestry landscapes–a review. Journal of Applied Ecology 48, 619-629.
Vaast, P., Bertrand, B., Perriot, J.J., Guyot, B., Genard, M., 2006. Fruit thinning and shade improve bean characteristics and beverage quality of coffee (Coffea arabica L.) under optimal conditions. Journal of the Science of Food and Agriculture 86, 197-204.
Vaast, P., Kanten, R.v., Siles, P., Dzib, B., Franck, N., Harmand, J., Genard, M., 2005. Shade: a key factor for coffee sustainability and quality, ASIC 2004. 20th International Conference on Coffee Science, Bangalore, India, 11-15 October 2004. Association Scientifique Internationale du Café (ASIC), pp. 887-896.
Valkila, J., 2009. Fair Trade organic coffee production in Nicaragua—Sustainable development or a poverty trap? Ecol. Econ. 68, 3018-3025.
Verteramo, L.J., Gómez, M.I., Kaiser, H.M., Yan, J., 2014. Socially-Responsible Certification Schemes for Smallholder Coffee Farmers: Economics of Giving and Consumer Utility, 2014 Annual Meeting, July 27-29, 2014, Minneapolis, Minnesota. Agricultural and Applied Economics Association.
Wezel, A., Casagrande, M., Celette, F., Vian, J.-F., Ferrer, A., Peigné, J., 2014. Agroecological practices for sustainable agriculture. A review. Agronomy for sustainable development 34, 1-20.
29

Wollni, M., Brümmer, B., 2012. Productive efficiency of specialty and conventional coffee farmers in Costa Rica: Accounting for technological heterogeneity and self-selection. Food Policy 37, 67-76.
30

Figure 1. Conceptual Framework - RCM participation.
31
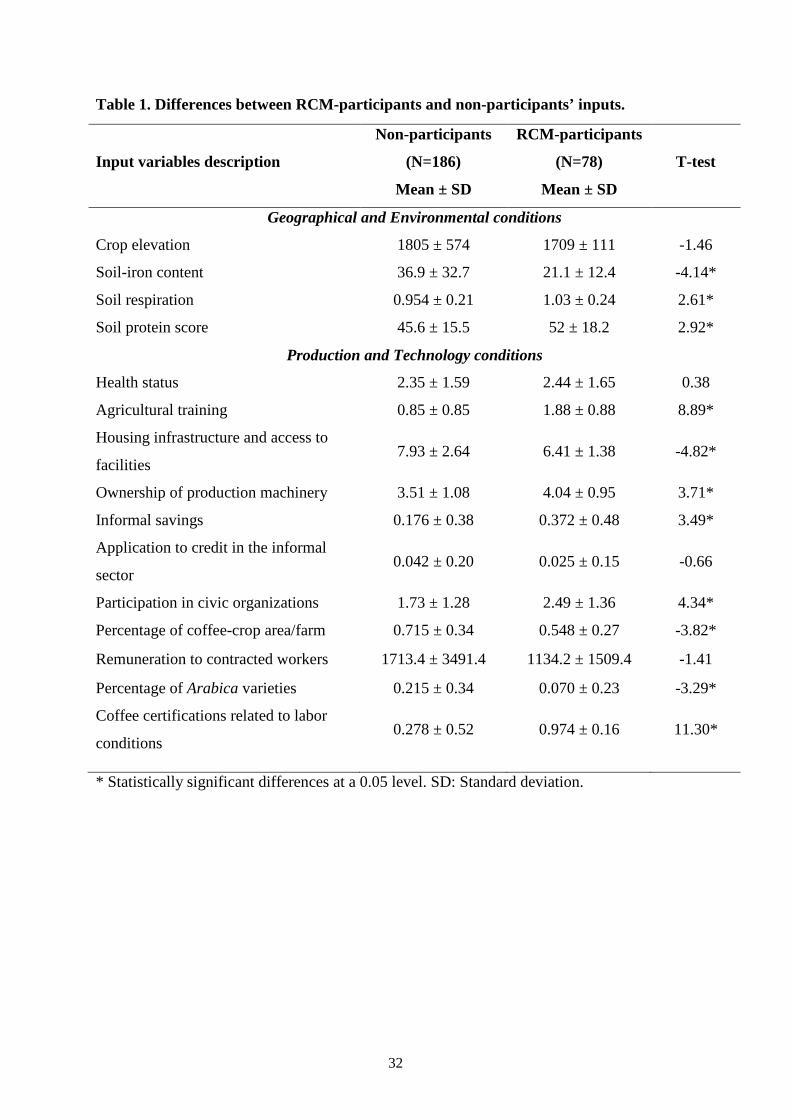
Table 1. Differences between RCM-participants and non-participants’ inputs.
Input variables description
Non-participants
(N=186)
Mean ± SD
RCM-participants
(N=78)
Mean ± SD
T-test
Geographical and Environmental conditions
Crop elevation 1805 ± 574 1709 ± 111 -1.46
Soil-iron content 36.9 ± 32.7 21.1 ± 12.4 -4.14*
Soil respiration 0.954 ± 0.21 1.03 ± 0.24 2.61*
Soil protein score 45.6 ± 15.5 52 ± 18.2 2.92*
Production and Technology conditions
Health status 2.35 ± 1.59 2.44 ± 1.65 0.38
Agricultural training 0.85 ± 0.85 1.88 ± 0.88 8.89*
Housing infrastructure and access to
facilities 7.93 ± 2.64 6.41 ± 1.38 -4.82*
Ownership of production machinery 3.51 ± 1.08 4.04 ± 0.95 3.71*
Informal savings 0.176 ± 0.38 0.372 ± 0.48 3.49*
Application to credit in the informal
sector 0.042 ± 0.20 0.025 ± 0.15 -0.66
Participation in civic organizations 1.73 ± 1.28 2.49 ± 1.36 4.34*
Percentage of coffee-crop area/farm 0.715 ± 0.34 0.548 ± 0.27 -3.82*
Remuneration to contracted workers 1713.4 ± 3491.4 1134.2 ± 1509.4 -1.41
Percentage of Arabica varieties 0.215 ± 0.34 0.070 ± 0.23 -3.29*
Coffee certifications related to labor
conditions 0.278 ± 0.52 0.974 ± 0.16 11.30*
* Statistically significant differences at a 0.05 level. SD: Standard deviation.
32

Table 2. Input variables selected according to Imbens and Rubin (2014) algorithm.
Category Variable Description
Geographical and Environmental Conditions
Farm-geographical
characteristics Crop elevation Crop elevation from sea level measured in each farms. Unit:
Meters
Soil-quality assessment
Soil-iron content Quantification of particles per million of iron calculated after chemical evaluation of soil
Soil respiration Measure of metabolic activity from microbial community of the soil
Soil-protein score Quantification of protein content
Production & technological conditions
Production factors &
endowments
Human capital Health status
Index that aggregates: diabetes, heart diseases, dental diseases, eyes diseases, pressure and circulation problems, respiratory sicknesses and gastric illnesses.
Training in agricultural production
Number of institutions in which the farmer has taken some training.
Physical capital
Housing infrastructure and access to facilities
Index that aggregates: electricity, gas pipes, natural gas, telephone, cell phone, water and sewage, garbage collection, internet, cable TV and or national TV.
Ownership of coffee production machinery
Index that aggregates: coffee cherry depulping machine, mucilage-taker, dryer (3 types), fumigation equipment, lawn trimmer, power saw, grass-sting, silo
Informal savings Maintain savings by his/her own, family or friends or with not regulated groups (1 if true)
33

Application to credit in the informal sector
Requested a credit at the informal sector during last 12 months. Includes not regulated borrowers, family and friends (1 if true)
Social Capital Participation in civic organizations
Index that measures participation in civic organizations. Includes: coffee growers formal and informal organizations, religious, recreational and/or educational groups.
Harvest and post-harvest
practices
Factor shares
Percentage of coffee-crop area/farm Percentage of coffee hectares in relation to the total farm size.
Remunerations to contracted workers
Includes: payments during the last crop to workers contracted to coffee beans collection plus payments to daily workers (Thousands of COL pesos)
Coffee varieties Percentage of Arabica Percentage of Arabica trees in a representative quadrant.
Certified processes and
standards
Certifications related to labor and business conditions.
Index that aggregates: Fair Trade, Utz and 4C Common.
* Not selected by the algorithm * Environmental related certifications.
Index that aggregates: Rainforest Alliance, Organic, UTZ, 4C Common, Smithsonian Bird Friendly.
For the RCM participants labor related certifications basically refer to Fair Trade. The cooperative and almost all of their 700 members are certified (in the sample 96% affirmed to be Fair Trade certified). Any of them have Utz or 4C certifications. In the case of environmental related certifications, the most common is Organic, although, only 11.5% in the cooperative members are certified or in process of certification. This proportion is similar to the percentage of growers in the RCM participants’ sample who affirm to be organic certified (12.8%).
34

Table 3. Balancing test for RCM-participants and non-participants’ input selected variables according to Imbens and Rubin (2014) algorithm.
Input variables description Balancing Method 1 T-test (z-values) a
Balancing Method 2
F-test (z-values) b
Geographical and Environmental conditions
Crop elevation -1.092 -0.589
Soil-iron content -0.631 0.075
Soil respiration 0.745 -0.106
Soil protein score 0.897 -0.326
Production and Technology conditions
Health status -0.643 0.055
Agricultural training 0.905 -0.338
Housing infrastructure and access to facilities -0.512 0.279
Ownership of production machinery 0.402 0.492
Informal savings -0.874 -0.294
Application to credit in the informal sector -0.743 -0.102
Participation in civic organizations -0.628 0.079
Percentage of coffee-crop area/farm -0.028 2.005*
Remuneration to contracted workers -0.278 0.778
Percentage of Arabica varieties 0.636 0.066 Coffee certifications related to labor conditions 2.264 * -1.931
Environmental related certifications
-0.467 0.362
a Non-satisfactory input balance when values are substantially larger in an absolute value than one. b The p values associated with the F statistic are converted to a z-value. Non-satisfactory balance when there are large positive values. Not selected as an input by Imbens and Rubin algorithm, but balanced between RCM participants and non-participants.
35

Table 4. Overlapping test for RCM-participants and non-participants’ input selected variables according to Imbens and Rubin (2014).
a Values around zero reflect a better overlapping. b Ratio equal to 1 if control and treatment covariates have the same standard deviation (SD). c In a randomized experiment this measures are equal to 𝛼𝛼 in expectation and only 𝛼𝛼 × 100% of units have covariate values that make the prediction of missing potential outcomes relatively difficult. Not selected as an input by Imbens and Rubin algorithm, but overlapped between RCM participants and non-participants.
Input variables description Mean differences a
SD sample ratio b
Proportion outside quartiles for covariate distribution c
Non-participants
RCM-participants
Geographical and Environmental conditions
Crop altitude -0.355 0.837 0.392 0.067
Soil-iron content -0.144 0.670 0.098 0.067
Soil respiration 0.204 1.328 0.000 0.133
Soil protein score 0.252 1.196 0.000 0.133
Production and Technology conditions
Health status -0.219 0.811 0.020 0.000
Agricultural training 0.275 0.553 0.294 0.000 Housing infrastructure and access to facilities
-0.138 0.923 0.098 0.067
Ownership of production machinery 0.080 0.814 0.098 0.000
Informal savings -0.316 0.966 0.000 0.000 Application to credit in the informal sector
-0.283 1.040 0.000 0.000
Participation in civic organizations -0.157 0.812 0.020 0.000
Percentage of coffee-crop area/farm 0.018 0.501 0.059 0.000
Remuneration to contracted workers 0.060 0.847 0.059 0.000
Percentage of Arabica varieties 0.182 1.335 0.000 0.133 Coffee certifications related to labor conditions
0.828 0.419 0.098 0.000
Environmental related certifications -0.189 0.857 0.020 0.000
36

Table 5. Input variables comparison between RCM-participants and non-participants. Original sample vs. refined sample after Imbens and Rubin algorithm (2014).
Input variables description
Original total sample Refined sample after trimming Non-
participants (N=186)
Mean ± SD
RCM-participants
(N=78) Mean ± SD
T-test
Non-participants
(N=50) Mean ± SD
RCM-participants
(N=14) Mean ± SD
T-test
Crop elevation 1805 ± 574 1709 ± 111 -1.46 1742.5 ± 123.7 1702.0 ± 103.6 -1.11 Soil-iron content 36.9 ± 32.7 21.1 ± 12.4 -4.14* 22.50 ± 11.84 21.05 ± 7.93 -0.43 Soil respiration 0.954 ± 0.21 1.03 ± 0.24 2.61* 0.96 ± 0.18 1.00 ± 0.24 0.73 Soil protein score 45.6 ± 15.5 52 ± 18.2 2.92* 46.55 ± 13.87 50.40 ± 16.58 0.87 Growers’ health status 2.35 ± 1.59 2.44 ± 1.65 0.38 2.60 ± 1.71 2.26 ± 1.38 -0.68 Growers’ training in agricultural production
0.85 ± 0.85 1.88 ± 0.88 8.89* 1.19 ± 0.91 1.40 ± 0.50 0.79
Grower’s housing infrastructure and access to facilities
7.93 ± 2.64 6.41 ± 1.38 -4.82* 6.71 ± 1.87 6.46 ± 1.72 -0.44
Ownership of coffee production machinery
3.51 ± 1.08 4.04 ± 0.95 3.71* 3.64 ± 1.18 3.73 ± 0.96 0.25
Informal savings 0.176 ± 0.38 0.372 ± 0.48 3.49* 0.49 ± 0.50 0.33 ± 0.48 -1.03 Application to credit in the informal sector
0.042 ± 0.20 0.025 ± 0.15 -0.66 0.03 ± 0.19 0.00 ± 0.00 -0.07
Participation in civic organizations 1.73 ± 1.28 2.49 ± 1.36 4.34* 2.35 ± 1.53 2.13 ± 1.24 -0.04 Percentage of coffee-crop area/farm 0.715 ± 0.34 0.548 ± 0.27 -3.82* 0.74 ± 0.46 0.74 ± 0.23 0.05 Remuneration to contracted workers 1713.4 ± 3491.4 1134.2 ± 1509.4 -1.41 1222.3 ± 1867.0 1325.3 ± 1582 0.18 Percentage of Arabica varieties 0.215 ± 0.34 0.070 ± 0.23 -3.29* 0.10 ± 0.25 0.155 ± 0.33 0.65 Coffee certifications related to labor conditions
0.278 ± 0.52 0.974 ± 0.16 11.30* 0.471 ± 0.674 0.899 ± 0.282 2.30*
37

Table 6. Outcome Variables Description
Environmental Impact
Resource management
Water saving techniques Index that aggregates techniques for saving water and treatment of residual water (goes from 0 to 3).
Awareness of the use of biological control methods
Compare with other growers in the area the farmer considers that he/she uses more biological control methods.
Landscape management
Crop-tree diversity Average of the number of tree species identified in the small quadrants of each farm.
Inga-tree diameter Perimeter of Inga species trees in the quadrants (average in centimeters).
Biological indicators
Birds abundance and genus Observed number of specimens from the southwest quadrant point at each farm.
Bird species diversity Total number of species detected on a farm
Soil potassium content Particles per million
Technological Impact
Environmental friendly practices
Preparation of own fertilizer Farmer prepares organic fertilizers in the farm
Use of organic fertilizer Farmer used organic fertilizers during the last crop.
Use of organic fumigation Farmer used organic fumigation alternatives against coffee rust.
Connection to global markets Knows the final buyer/Exporter
The farmer knows who are the final buyer and/or exporter of the coffee that he produces (goes from 0 to 2).
38

Socio-Economic Impact
Price and income Price per kilogram Price received per kilogram of coffee produced during the last crop in Colombian pesos.
Health and safety
Use of protection equipment Index that aggregates protection gear used during agro-chemicals application. Includes: gloves, mask, coveralls, glasses, boots and caps.
> 50% of consumed food came from its own farm
In a regular day more than half of food consumed come from the own farm.
Products different from coffee, are sold and self consumed
Index that aggregates items that are produced for consumption and sell. Includes: cassava, plantain, banana, corn, rice, cane, chickens, pigs, cattle, vegetables, legumes and fruits.
Physical capital accumulation Access to microcredit Farmer received a credit from a cooperative or small
financial entity during the last 12 months.
Expectations Farmer expects children will be involved in coffee activities
Farmer wants that his son(s) and/or daughter(s) will be involved in coffee activities.
39

Table 7. Outcomes differences between RCM-participants and non-RCM participants according to Imbens and Rubin (2014).
Outcome variables
description
Single propensity score
Homoscedasticity Mean ± SD
Single propensity score
Heteroscedasticity Mean ± SD
Matching single
covariate Mean ± SD
Two-match propensity
score Mean ± SD
Three-match propensity score
Mean ± SD
Four match propensity score
Mean ± SD
Environmental Impact Water saving techniques 0.57 ± 0.62 0.57 ± 0.44 0.65 ± 0.42 1.03 ± 0.52** 1.05 ± 0.47** 1.02 ± 0.46**
Awareness of the use of biological control methods
0.561 ± 0.26** 0.56 ± 0.36 0.18 ± 0.17 0.53 ± 0.22** 0.36 ± 0.21* 0.37 ± 0.20*
Crop-tree diversity 0.06 ± 0.52 0.06 ± 0.80 0.74 ± 0.23*** 0.80 ± 0.47* 0.63 ± 0.37* 0.54 ± 0.31*
Inga-tree diameter 19.98 ± 9.39** 19.98 ±15.39 10.45 ± 5.22** 12.11± 9.12 19.27 ± 8.09** 18.19 ± 6.82***
Soil potassium content (PPM) -52.91 ± 59.31 -52.91 ± 17.83*** -50.37 ± 32.47 -51.79 ± 47.82 -55.65 ± 41.82 -55.23 ± 38.58
Technological Impact Preparation of own organic fertilizers
0.42 ± 0.23* 0.42 ± 0.06*** 0.27 ± 0.15* 0.42 ± 0.19** 0.42 ± 0.17** 0.38 ± 0.16**
Use of organic fertilizers during the last crop
0.51 ± 0.31 0.51 ± 0.38 0.53 ± 0.14*** 0.59 ± 0.24** 0.43 ± 0.21** 0.47 ± 0.19**
Uses organic fumigations against coffee roast
0.65 ± 0.28** 0.65 ± 0.36* 0.28 ± 0.11** 0.35 ± 0.21 0.28 ± 0.18 0.20 ± 0.16
Knows final buyer/exporter of his coffee
1.48 ± 0.43*** 1.48 ± 0.73** 1.37 ± 0.22*** 1.43 ± 0.35*** 1.09 ± 0.38*** 1.12 ± 0.33***
Socio-Economic Impact Price per coffee kilo -209.84 ± 399.69 -209.84 ± 235.48 81.71 ± 219.19 -54.73 ±
305.19 -39.97 ± 261.95 54.06 ± 300.10
40

Access to micro credits 0.65 ± 0.24*** 0.65 ± 0.38* 0.28 ± 0.16* 0.61 ±
0.20*** 0.36 ± 0.22 0.43 ± 0.19**
Use of protective equipment during fumigation
2.90 ± 1.07*** 2.90 ± 0.76*** 1.83 ± 0.67*** 2.35 ± 0.97** 2.02 ± 0.89** 2.06 ± 0.78***
>50% of consumed food came from its own farm
0.56 ± 0.25** 0.56 ± 0.38 0.03 ± 0.13 0.21 ± 0.26 0.36 ± 0.22 0.43 ± 0.19**
Products different from coffee, are sold and self consumed
0.68 ± 1.25 0.68 ± 0.75 0.63 ± 0.33* 0.87 ± 0.78 0.90 ± 0.63 1.28 ± 0.57**
Farmer want his/her children to be involved in coffee production
0.63 ± 0.24*** 0.63 ± 0.14*** 0.21 ± 0.16 0.62 ± 0.20*** 0.55 ± 0.20*** 0.35 ± 0.21*
S.D: Standard deviation *, p < 0.1; **, p < 0.05, and *** p<0.01
41

Table 8. Bird-survey differences between RCM-participants and non-RCM participants
a Significance levels adjusted by Bonferroni correction. S.D: Standard deviation *, p < 0.1; **, p < 0.05, and *** p<0.01
Variables description
Original total sample Refined sample after trimming
Non-participants
(N=169)
Mean ± SD
RCM-participants
(N=63)
Mean ± SD
T-test a
Non-participants
(N=41)
Mean ± SD
RCM-participants
(N=13)
Mean ± SD
T-test
Abundance 28.68 ± 16.51 34.92 ± 12.76 2.71*** 33.14 ± 17.17 32 ± 14.26 -0.21
Diversity 14.34 ± 6.81 18.73 ± 5.68 4.54*** 16.60 ± 7.36 19.46 ± 7.64 1.20
Setophaga 1.19 ± 1.32 1.38 ± 1.50 0.91 1.19 ± 1.34 1.92 ± 1.75 1.57
Basileuterus 0.029 ± 0.22 0.095 ± 0.42 1.49 0.048 ± 0.31 0 ± 0 -0.55
Pheugopedious 0.24 ± 0.61 0.36 ± 0.65 1.32 0.51 ± 0.89 0.23 ± 0.43 -1.08
42

Appendix A. Balancing and Overlapping Tests
In general, the first balancing method tests the hypothesis that the block-weighted difference
between participants and non-participants means is not statistically different than zero.
𝑧𝑧𝑘𝑘 =∑
𝑁𝑁𝑛𝑛𝑛𝑛 + 𝑁𝑁𝑝𝑝𝑛𝑛𝑁𝑁
𝐽𝐽𝑛𝑛=1 . (𝑋𝑋�𝑝𝑝𝑘𝑘𝑛𝑛 − 𝑋𝑋�𝑛𝑛𝑘𝑘𝑛𝑛)
�𝑉𝑉�𝑘𝑘 (𝐴𝐴1)
Where 𝑋𝑋�𝑝𝑝𝑘𝑘𝑛𝑛 is the participants (𝑝𝑝) 𝑘𝑘 input mean in sub-block 𝑗𝑗, 𝑋𝑋�𝑛𝑛𝑘𝑘𝑛𝑛 is the non-
participants (𝑛𝑛) 𝑘𝑘 input mean in sub-block 𝑗𝑗, 𝑁𝑁𝑛𝑛𝑛𝑛 the number of non-participants in sub-block j,
𝑁𝑁𝑝𝑝𝑛𝑛 the number of participants in sub-block j, 𝑁𝑁 the total number of participants and non-
participants in the original trimmed block and 𝑉𝑉�𝑘𝑘 the estimated sampling variance for input 𝑘𝑘.
However, with only one block this test can be simplified to:
𝑧𝑧𝑘𝑘 = �𝑋𝑋�𝑝𝑝𝑝𝑝−𝑋𝑋�𝑛𝑛𝑝𝑝�
�𝑉𝑉�𝑝𝑝 (𝐴𝐴2) ; 𝑉𝑉�𝑘𝑘 = 𝑠𝑠𝑘𝑘2 �
1𝑁𝑁𝑛𝑛
+ 1𝑁𝑁𝑝𝑝� (𝐴𝐴3)
𝑎𝑎𝑛𝑛𝑎𝑎 𝑠𝑠𝑘𝑘2 =1
𝑁𝑁𝑛𝑛 + 𝑁𝑁𝑝𝑝 − 2� � �𝑋𝑋𝑖𝑖𝑘𝑘 − 𝑋𝑋�𝑝𝑝𝑘𝑘�
2
𝑖𝑖:𝑊𝑊𝑖𝑖=0
+ � (𝑋𝑋𝑖𝑖𝑘𝑘 − 𝑋𝑋�𝑛𝑛𝑘𝑘)2𝑖𝑖:𝑊𝑊𝑖𝑖=1
� (𝐴𝐴4)
In addition, expression (A5) contributes to understand the intuition behind the second
balancing test. In this expression the dependent variable is the 𝑘𝑘 input variable 𝑋𝑋 for grower 𝑖𝑖
(𝑋𝑋𝑖𝑖𝑘𝑘) while (𝐵𝐵𝑛𝑛.𝑊𝑊) represents the interaction of the sub-block 𝐵𝐵𝑛𝑛 and the treatment variable 𝑊𝑊
𝑋𝑋𝑖𝑖𝑘𝑘 = 𝛼𝛼𝑘𝑘𝑛𝑛 .𝐵𝐵𝑖𝑖𝑛𝑛 + 𝜏𝜏𝑘𝑘𝑛𝑛 ( 𝐵𝐵𝑖𝑖𝑛𝑛.𝑊𝑊𝑖𝑖) (𝐴𝐴5)
According to this test, if any input variable is balanced in a particular sub-block, it is expected
that this input variable depend on the sub-block (coefficient 𝛼𝛼𝑘𝑘𝑛𝑛 ≠ 0), but not on the interaction
between that sub-block and the treatment (coefficient 𝜏𝜏𝑘𝑘𝑛𝑛 = 0). In other words, the mean of any
input variable for participants and non-participants can be different across sub-blocks but not
43

within sub-blocks. With only one block, this test helps to verify that the inputs average values do
not depend of participation in the program.
In relation to overlapping, the first test is represented in equation (A6) where the
difference in means by treatment group is normalized by the square root of the average within
group standard deviations.
∆𝑝𝑝𝑛𝑛=𝑋𝑋�𝑝𝑝 − 𝑋𝑋�𝑛𝑛𝑝𝑝
�(𝑠𝑠𝑛𝑛𝑝𝑝2 + 𝑠𝑠𝑝𝑝2)/2 (𝐴𝐴6)
In contrast with the first balancing test, which is heavily impacted by N, in this normalized
difference the number of treatment and control individuals (𝑁𝑁𝑛𝑛 and 𝑁𝑁𝑝𝑝) do not divide the
estimated standard deviations. The advantage is that we can obtain a good measure of the
differences in location of the distribution due to small differences in the covariates and not
necessary explained by a larger N
44

Appendix B. Table B1. Estimated parameters of Propensity Score
Variable Abbreviation Coefficient Std. Error t-stat
Intercept 8.30 18.31 0.45
Linear Terms
Crop altitude altitude 0.01 0.01 1.06 Percentage of Arabica varieties arab -30.72 12.10 -2.54 Growers’ health status health -3.67 1.55 -2.36 Grower’s training in agricultural production training 0.62 1.00 0.61 Percentage of coffee-crop area/farm coffee 4.61 2.78 1.66 Ownership of coffee production machinery machine 0.32 0.47 0.69 Participation in civic organizations civic 3.74 1.08 3.45 Remuneration to contracted workers remuneration 0.00 0.00 -1.72 Soil respiration respiration -116.41 37.56 -3.10 Soil protein score protein 1.54 0.49 3.13 Soil-iron content iron 2.22 1.09 2.04 Informal savings saving 13.74 4.39 3.13 Application to credit in the informal sector credit -6.31 2.77 -2.28 Certifications related to labor conditions certification 31.98 8.37 3.82 Grower’s housing infrastructure and facilities house -1.63 0.62 -2.62
Second Order Terms
arab_ protein 0.35 0.17 2.07 certification _civic -2.43 0.83 -2.93 certification _ arab -23.37 6.56 -3.56 certification _ coffee -22.08 6.57 -3.36 altitude _iron 0.00 0.00 -2.09 arab _civic 6.92 2.27 3.06 civic _ saving -3.24 1.17 -2.76 training _ arab 1.24 0.51 2.43 house _ arab_ 0.31 0.16 2.01
Number of Observations
265
LR chi2 (24) 277.94 Log likelihood
-21.62
Prob > chi2 0
Pseudo R2 0.87
45

Appendix C. Labor-related certifications comparable groups and outcomes
Table C1. Balancing and Overlapping tests for certified-participants and non-participants’ input selected variables.
Input variables description
Balancing Method 1
T-test (z-values) a
Balancing Method 2
F-test (z-values) b
Mean differences c
SD sample ratio d
Proportion outside quartiles for covariate distribution e
Non-participants
RCM-participants
Geographical and Environmental conditions
Crop altitude 0.003 2.852* 0.001 0.741 0.243 0.000
Soil-iron content -0.232 0.905 -0.123 0.518 0.459 0.000
Soil respiration 0.431 0.434 0.234 0.443 0.351 0.000
Soil protein score 0.483 0.334 0.256 0.508 0.351 0.000
Production and Technology conditions
Growers’ health status 1.334 -0.882 0.449 1.863 0.000 0.167
Growers’ training in agricultural production 0.169 1.109 0.080 0.829 0.108 0.000
Grower’s housing infrastructure and access to facilities
0.469 0.362 0.176 1.462 0.000 0.167
Ownership of coffee production machinery 0.203 0.995 0.098 0.766 0.108 0.000
Informal savings 0.617 0.101 0.249 1.237 0.000 0.000
Application to credit in the informal sector -0.709 -0.047 -0.414 0.000 0.081 0.000
46

Participation in civic organizations 0.375 0.551 0.181 0.761 0.162 0.000
Percentage of coffee-crop area/farm -0.119 1.315* -0.062 0.549 0.189 0.000
Remuneration to contracted workers -0.349 0.608 -0.188 0.455 0.135 0.000
Percentage of Arabica varieties 0.761 -0.126 0.304 1.271 0.000 0.000
RCM participation -0.402 0.493 -0.182 0.939 0.000 0.000
a Non-satisfactory input balance when values are substantially larger in an absolute value than one. b Non-satisfactory balance when there are large positive values. c Values around zero reflect a better overlapping. d Ratio equal to 1 when control and treatment covariates have the same standard deviation (SD). e 𝛼𝛼 × 100% of units have covariate values that make the prediction of missing potential outcomes relatively difficult.
47

Table C2. Outcomes differences between certified and non-certified participants
Input variables description
Single propensity score
Homoscedasticity Mean ± SD
Single propensity score
Heteroscedasticity Mean ± SD
Matching single covariate
Mean ± SD
Two-match propensity score
Mean ± SD
Three-match propensity score
Mean ± SD
Four match propensity score
Mean ± SD
Environmental Impact Water saving techniques 0.58 ± 0.54 0.58 ± 0.61 0.44 ± 0.52 0.51 ± 0.52 0.22 ± 0.51 0.26 ± 0.52
Awareness of the use of biological control methods
0.09 ± 0.24 0.09 ± 0.21 0.23 ± 0.23 0.16 ± 0.23 0.16 ± 0.21 0.12 ± 0.21
Crop-tree diversity 0.08 ± 0.29 0.08 ± 0.36 0.01 ± 0.23 -0.04 ± 0.30 0.14 ± 0.30 0.03 ± 0.31
Inga-tree diameter 6.75 ± 8.11 6.75 ± 11.66 8.24 ± 6.39 6.09 ± 7.37 13.81 ± 7.76* 10.29 ± 8.11
Soil potassium content (PPM) -77.78 ± 60.22 -77.78 ± 30.60 -83.73 ± 55.42 -88.73 ± 60.21 -92.15 ± 60.22 -89.25 ± 61.05
Technological Impact Preparation of own organic fertilizers
0.02 ± 0.24 0.02 ± 0.21 0.23 ± 0.17 0.15 ± 0.22 0.18 ± 0.20 0.22 ± 0.20
Use of organic fertilizers during the last crop
-0.09 ± 0.21 -0.09 ± 0.20 0.04 ± 0.22 0 ± 0.20 -0.04 ± 0.19 0.02 ± 0.20
Uses organic fumigations against coffee roast
-0.04 ± 0.12 -0.04 ± 0.06 -0.02 ± 0.11 -0.04 ± 0.11 -0.02 ± 0.12 -0.03 ± 0.12
Knows final buyer/exporter of his coffee
0.11 ± 0.39 0.11 ± 0.40 0.30 ± 0.25 0.16 ± 0.34 0.32 ± 0.35 0.33 ± 0.34
Socio-Economic Impact Price per coffee kilo -183.61 ± 353.87 -183.61 ± 404.79 -237.14 ± 371.89 -169.71 ± 366.31 -148.22 ± 369.12 -186.73 ± 351.89
48

Access to micro credits -0.02 ± 0.25 -0.02 ± 0.21 -0.18 ± 0.16 -0.09 ± 0.21 -0.14 ± 0.19 -0.16 ± 0.18
Use of protective equipment during fumigation
2.81 ± 0.83*** 2.81 ± 0.64*** 2.46 ± 0.93*** 2.72 ± 0.85*** 2.41 ± 0.89*** 2.59 ± 0.88***
>50% of consumed food came from its own farm
-0.09 ± 0.10 -0.09 ± 0.04* -0.07 ± 0.08 -0.08 ± 0.09 -0.07 ± 0.09 -0.08 ± 0.09
Products different from coffee, are sold and self consumed
-0.37 ± 0.40 -0.37 ± 0.47 -0.34 ± 0.30 -0.48 ± 0.41 -0.17 ± 0.41 -0.35 ± 0.42
Farmer want his/her children to be involved in coffee production
-0.14 ± 0.22 -0.14 ± 0.208 0.023 ± 0.24 -0.105 ± 0.23 0.008 ± 0.218 -0.029 ± 0.221
S.D: Standard deviation *, p < 0.1; **, p < 0.05, and *** p<0.01
49

(Supplementary Online Material. Appendix D)
Table D1. Input variables description
Group Variable
Location Department
Topography Altitude
Soil Characteristics
Aggregate Stability (%), Available Water Capacity (m/m), Organic Matter (%), Active Carbon (ppm), pH, Extractable Phosphorus (ppm), Extractable Potassium (ppm), Magnesium (ppm), Iron (ppm), Manganese (ppm), Zinc (ppm), Sand, Clay, Silt, Textural Class, Protein (mg/g soil), Protein "Score", Respiration (mg/g soil, 4day Total), Protein "Score" (not texture adjusted)
Biophysical/Landscape
Percentage of Arabica variety in the quadrant. Includes: Caturra, Typica, Borbon, Catuai and Pacamara
Percentage of Robusta variety in the quadrant. Includes Colombia, Castillo, Catimor, F1, F4, F6, F8, "suprema", 2000
Numbers of trees in the quadrant.
Natural Disasters and Pests
Exposure to natural disasters. Includes: floods, droughts, land slides (last crop, last 3 crops).
Pest exposure and incidence during the last 3 crops. Includes coffee berry borer (CBB) and rust
Family Structure Age
Number of economically dependent members
Health Aggregation of the pre-existing conditions: diabetes, heart, dental eyes, pressure, circulation, gastric or respiratory problems or diseases.
Education
Years of education
The farmer knows institutions that provide technical assistances and number of institutions that knows.
Number of institutions farmer assisted for technical capacitation.
Fixed Assets
Owner of his own farm
Legal document that supports landholding.
Farm size
Coffee hectares
50

Percentage of coffee hectares in relation to farm size
House, apartment, land and/or car possession index.
Variable Assets Index that aggregates the number of animals: weighted according to market value
House Household infrastructure and access to utilities index
Saving
Saving in the financial sector
Number of formal financial services used for saving.
Saving in the informal sector: Includes not regulated borrowers, family, friends
Credit
Applied for a credit in the last two years
Applied to credit in the financial sector
Applied to microcredit
Requested a credit at the informal sector.
Fixed Capital Index that aggregate the ownership of the following machines: coffee cherry de-pulping machine, mucilage-taker, dryer (3 types), fumigation equipment, lawn trimmer, power saw, grass-sting, silo
Political Institutions Level of participation in presidential, state and city elections, coffee guild representatives, cooperative and federations delegates.
Civic Institutions
Level of participation in civic organizations. Includes: coffee growers, religious, recreational, certification, and educational groups or organizations.
Coordinate communal work with other coffee groups.
Tradition and Expectations Farmer's parents where involve in the coffee production.
Security The security conditions in the regions are bad or worse than before.
The farmer has suffered displacement, extortion over assets, or extortion over profits.
Cooperatives Belong to a cooperative of growers where members are under RCM
Time that a cooperative has been involved with the RCM
Diversification Total of food products produced in the farm different than coffee for consumption
Total of food products produced in the farm different than coffee for sale
51

Income Household total income below a specific income line
Production Factors Remuneration
Payment for coffee beans collection: kilograms produced times payment per kilogram
Payment to per day workers (jornales): Days times payment per day
Total labor remuneration: Payment for coffee beans collection plus payment to per day workers (jornales)
Household members who help in the coffee production
Harvest & Post-Harvest Practices & Management
Tech processing plant to process coffee bean
Percentage of the coffee crops associated with other products.
52

Figure D1. Colombia - Geo-referenciation RCM participants and non-participants farms
53
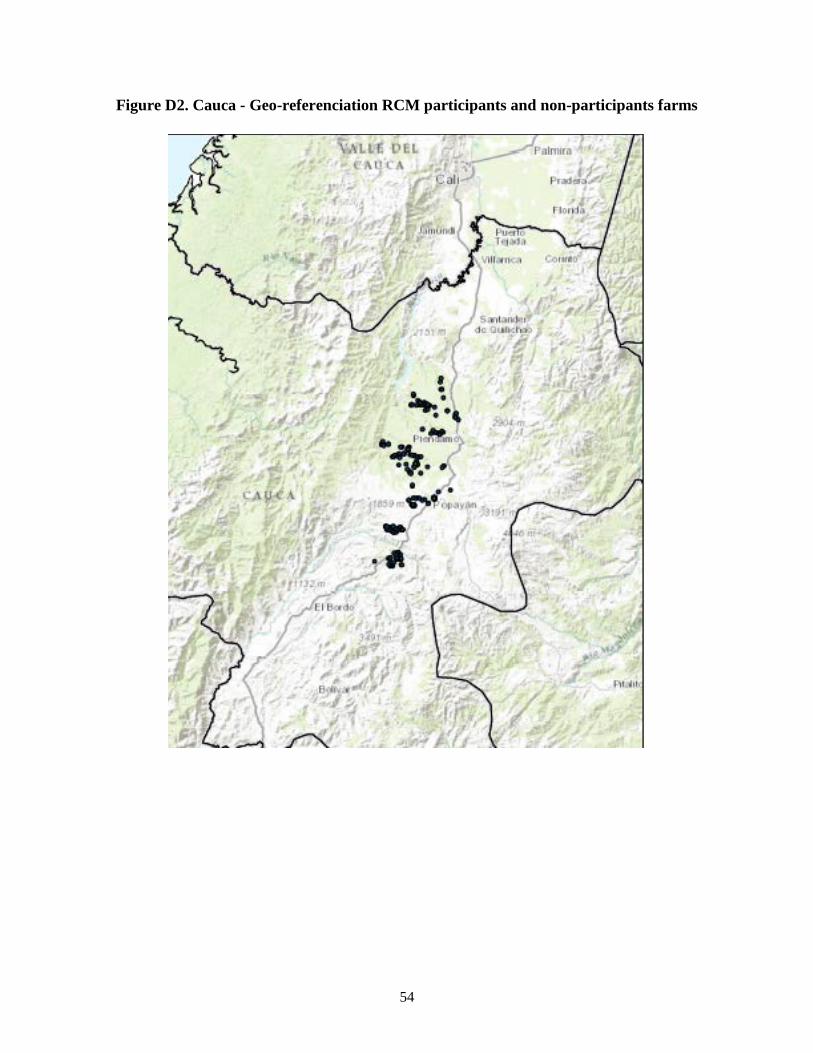
Figure D2. Cauca - Geo-referenciation RCM participants and non-participants farms
54

Figure D3. Antioquia - Geo-referenciation RCM participants and non-participants farms
55