impacts of pine and eucalyptus plantations on carbon and
TRANSCRIPT

Impacts of Pine and Eucalyptus Plantations on Carbon and Nutrients Stocks and Fluxes in Miombo Forests
Ecosystems
Benard Guedes Faculty of Forest Sciences
Department of Ecology Uppsala
Licentiate Thesis Swedish University of Agricultural Sciences
Uppsala 2016

ISBN (print version) 978-91-576-9408-9 ISBN (electronic version) 978-91-576-9409-6 © 2016 Benard Guedes, Uppsala Print: SLU Service/Repro, Uppsala 2016
Cover: Old Pinus taeda stands at Inhamacari forest, Machipanda Research Centre. (photo: B. Guedes)

Impacts of Pine and Eucalyptus Plantations on Carbon and Nutrient Stocks and Fluxes in Miombo Forest Ecosystems
Abstract Knowledge of how commercial pine and eucalyptus plantations affect soil carbon and nutrient status is important in Mozambique, where incentives are available to increase the area of forest plantations and also to conserve mature miombo forests. Tree species growing on similar sites may affect ecosystem carbon differently if they allocate carbon to aboveground and belowground parts at different rates. Moreover, changes in ecosystem carbon and nutrient status are closely correlated. This thesis examined the effects of first-rotation (around 34 years old) commercial plantation of Pinus taeda L. (Loblolly pine), Eucalyptus grandis Hill ex. Maiden and Eucalyptus cloeziana F. Muell in Mozambique on carbon and nutrient stocks, carbon fluxes (CF) and net primary production (NPP) compared with adjacent miombo forests.
At three study sites (Penhalonga, Inhamacari, Rotanda) in the Western Highlands of Manica Province, Mozambique, plots of Pinus taeda, Eucalyptus grandis and mixed-deciduous miombo species were delineated to investigate soil carbon and nutrient status (0-10, 10-30, 30-50 cm depth). Additional plots with these three stand types were established at Inhamacari to determine aboveground and belowground carbon stocks, CF and NPP. Aboveground carbon stocks were estimated using allometric biomass equations (ABEs) developed in this thesis, while belowground biomass was estimated using root-shoot ratio values from the literature.
Tree carbon stocks, net annual rate of carbon accumulation by trees, carbon allocation to litterfall and to fine root production and NPP were all significantly higher in Pinus taeda and Eucalyptus cloeziana plantations than in Miombo forest. Total (0-50 cm) soil carbon stocks, but not total soil nitrogen stocks, increased significantly following Pinus taeda and Eucalyptus grandis plantation. However, soil nitrogen stocks were higher in the top 10-cm layer of plantation soil than Miombo forest soil. Plantation of Pinus taeda had no effect on soil acidity, but Eucalyptus grandis increased soil pH (10-50 cm) and reduced total stock of extractable soil phosphorus (0-50 cm).
Thus overall, after around 34 years, tree carbon stocks, aboveground and belowground carbon fluxes, total carbon stocks and NPP were higher in commercial plantations than in natural Miombo forest. The commercial

plantations affected soil acidity and soil nutrient status differently, apart from total soil N stocks. Another novel contribution of the present work was development of ABEs for high-altitude Miombo forests and commercial plantations of Pinus taeda, Eucalyptus cloeziana and E. grandis in Mozambique.
Keywords: Carbon fluxes, litterfall, fine root production, net primary production, Miombo forest, pH, biomass allometric equations, Mozambique
Author’s address: Benard Guedes, (1) SLU, Department of Ecology, P.O. Box 7044, S-75007 Uppsala, Sweden, E-mail: Benard. Guedes@ slu.se; (2) UEM, Department of Forestry, Maputo, Mozambique, E-mail: besoguedes@ gmail.com

Dedication To my wonderful wife and daughters


Contents List of Publications 9
Abbreviations 11
1 Introduction 13 1.1 Tree species effects on the carbon balance and nutrient cycling of forest
ecosystems 14 1.2 Net primary production 15 1.3 The rationale for the study 16
2 Thesis aims 19
3 Material and methods 21 3.1 Study area 21
3.1.1 Study design 22 3.1.2 Study of soils (Paper I) 23 3.1.3 Study of forest stands (Paper II) 24 3.1.4 Calculations 25 3.1.5 Statistical analyses 27
4 Results and Discussion 29 4.1 Comparison of carbon stocks 29 4.2 Comparison of carbon fluxes 32 4.3 Net primary production 33 4.4 Effects on Nitrogen and Carbon-to-Nitrogen ratio (Paper I) 35 4.5 Effects on soil pH and extractable Phosphorus 35
5 Conclusions 39
6 Further work 41
References 43
Acknowledgements 49


List of Publications This thesis is based on the work contained in the following papers, referred to by Roman numerals in the text:
I Benard S. Guedes, Bengt A. Olsson, Erik Karltun. Effects of 34-year-old Pinus taeda and Eucalyptus grandis plantation on soil carbon and nutrient status in former miombo forest soils (manuscript).
II Benard S. Guedes, Bengt A. Olsson, Almeida A. Sitoe, Gustaf Egnell. Replacement of mountain miombo forest by Pinus taeda and Eucalyptus cloeziana plantations increases carbon stocks, carbon fluxes and net primary production (manuscript).
9

The contribution of Benard Guedes to the papers included in this thesis was as follows:
I Idea and hypotheses 50%, planning 50%, performance of work 90%, analyses and summary of results 75%, writing 50%.
II Idea and hypotheses 75%, planning 75%, performance of work 90%, analyses and summary of results 75%, writing 60%.
10

Abbreviations ABEs Allometric Biomass Equation (s) AGC Aboveground Carbon Stock (Trees) AGCI Aboveground Carbon Increment (Trees) C Carbon CEC Cations Exchange Capacity CRC Coarse root carbon stock FRP Fine Root Carbon Production LFC Litterfall Carbon Stock M&M Measurement and Monitoring MPE Mean Prediction Error N Nitrogen NPP Net Primary Production P Extractable Phosphorus PSP Permanent Sample Plots REDD+ Reduction of Emissions from Deforestation and Forest
Degradation RMSE Root Mean Square Error RSR Root-Shoot Ratio SOC Soil Organic Carbon UNFCCC United Nations Framework Convention on Climate Change
11

1 Introduction This thesis investigated the effects of approximately 34-year-old plantations of P. taeda, E. grandis and E. cloeziana on carbon and nutrient stocks and fluxes following conversion of miombo forest in the Western highlands of Manica province, Central Mozambique. A first generation and first rotation of large-scale commercial forest plantations in Mozambique was studied.
Knowledge of how commercial pine and eucalyptus plantations affect carbon and soil nutrient status is of particular importance in Mozambique, since incentives both to increase the area of forest plantations and to conserve mature miombo forests are available, under the National Strategy for Reforestation (NSR) (MINAG, 2009) and the REDD+ mechanism (Reducing Emissions from Deforestation and Forest Degradation), under the United Nations Framework Convention on Climate Change (UNFCCC) (IPCC, 2006). Commercial plantations are being promoted in Mozambique for industrial, social and environmental purposes. Through the NSR, Mozambique aims at establishing 1 million ha of commercial forest by 2030 (MINAG, 2009), which is more than a 10-fold increase in area from the current situation.
Forest plantations generally use degraded native forests, including thickets and degraded agricultural land (Coetzee and Alves, 2005; Maússe-Sitoe et al., 2016; MINAG, 2009). However, it is widely admitted that the expansion of forest plantations in Mozambique may also involve direct conversion of non-degraded forests (Indufor, 2012; Nhantumbo and Salomão, 2010), including mature miombo forest.
Miombo is a colloquial term used to describe natural forest dominated by the genera Brachystegia, Julbernardia and/or Isoberlinia (Chidumayo, 2014; Frost, 1996). It is the most extensive tropical seasonal woodland and dry forest formation in Africa and occurs in regions with mean annual rainfall ranging from 650 to 1400 mm, from lowlands up to 1200 m a.s.l. (Campbell et al., 1996). Miombo forest occurs in 11 African countries, but mostly in Mozambique, Angola, Democratic Republic of Congo, Zimbabwe, Zambia,
13

Malawi and Tanzania. In this thesis, degraded miombo forest (or ‘high utilisation forest’ according to Jew et al. (2016), was defined as forest on soil with reduced capacity to store carbon as a result of anthropogenic changes (adapted from Thompson et al., 2013). This definition also denotes a reduction in forest cover while still remaining a “forest” (Tavani et al., 2009). The main causes of degradation are selective and unsustainable logging, agriculture and fuelwood gathering, including fuel for charcoal production (see Jansen et al., 2008; Sitoe et al., 2012; Thompson et al., 2013). These causes are intrinsically connected and generally result in a landscape characterised as “agriculture mosaic with forest” (Sitoe et al., 2012).
1.1 Tree species effects on the carbon balance and nutrient cycling of forest ecosystems
The carbon balance of forest ecosystems is determined by the balance between carbon gained in net primary production (NPP) and carbon losses by decomposition and other export fluxes. Forest NPP includes carbon acquisition in biomass and litter production in litterfall and root turnover (see Clark et al., 2001a; Malhi et al., 1999). Thus, at the ecosystem scale, there is both a biomass and soil component of the total carbon balance.
Different tree species growing on similar sites may alter net ecosystem C fluxes as a result of different growth rates and aboveground and belowground allocation patterns. The strong role of these biological processes in regulating carbon stocks and fluxes in forest ecosystems is widely demonstrated in the literature (Chapin III et al., 2011; Coleman et al., 2004; Hu et al., 2016; Lehtonen et al., 2016; Ågren and Andersson, 2011).
A meta-analysis of afforestation by Li et al. (2012) concluded that soil C stocks increased after plantation of hardwood species such as Eucalyptus, but did not change with softwood species such as Pinus. The increase in soil C stocks by Eucalyptus spp. occurred in both the organic horizon and the mineral soil, whereas Pinus spp. increased soil C stocks in the organic horizons, but generally depleted C stocks in the mineral soil, resulting in insignificant overall change (Li et al., 2012). Lower soil C stocks in the mineral horizon under Pinus spp. plantations could be a consequence of lower below-ground litter production compared with Eucalyptus spp. Li et al. (2012) also found that changes in stocks of soil C and nitrogen (N) correlate positively and have a similar temporal pattern, but that changes in soil N are detected at later age stages than changes in soil C. In general, changes in soil C stocks are detected 30-40 years after plantation, whereas significant changes in soil N stocks appear from around 50 years after plantation. One main cause of the strong
14
positive correlation between changes in soil C and soil N is the fairly fixed stoichiometric relationship between C and N in plant litter, a relationship that also includes phosphorus (P). As with N, the relationship between soil C and soil P suggests that an increase in soil organic C is associated with increased stocks of soil P, dominated by P in organic form. This is partly because as soil C stock increases, P fixation in minerals decreases (Brady and Weil, 2008; Moody and Bolland, 1999). However, the correlation between C and P is generally weak (r: 40 to 57%; Hou et al., 2014).
In highly weathered, leached and acidic soils, such as those in Mozambique, available soil P is typically low and is often the major growth-limiting factor, whereas N is not a limiting nutrient (Aggangan et al., 1996; Binkley, 1997; Högberg, 1986; Moody and Bolland, 1999). In highly weathered soils, the availability of P also depends on soil pH level. While the fixation of P is at its lowest, plant P availability is highest in the soil pH range 6-7 (Brady and Weil, 2008; Chapin III et al., 2011; Hazelton and Murphy, 2007). Higher demand by tree species for nutrients may cause a reduction in plant-available P, particularly if forest growth results in soil acidification. Furthermore, lower soil pH and base saturation (BS) can be expected, as a result of higher accumulation of base cations by plants (Brady and Weil, 2008). In addition, increased stocks of soil C can be expected to increase the organic acidity, manifested in lower BS, lower pH and higher cation exchange capacity (CEC) of the soil (Berthrong et al., 2009).
1.2 Net primary production
Net primary production by forest trees includes the increment in aboveground and belowground biomass and the production of short-lived components such as fine roots and foliage. However, NPP measurements are often restricted to the aboveground production due to difficulties in estimating the belowground production (Clark et al., 2001a; Coleman et al., 2004). Net primary production differs widely among forest types (Malhi et al., 1999), depending on variations in climate (e.g. solar radiation, temperature, rainfall), stand structure (e.g. stand age, canopy architecture), soil conditions and disturbance regimes (Finér et al., 2011a; Gillman et al., 2015; Gower et al., 2001; Huston and Wolverton, 2009; Pierre et al., 2016; Zhang et al., 2009).
The increment in aboveground carbon in biomass can represent 40-70% of NPP of forest ecosystems, while litterfall and fine root production can account for 10-30% and 30-40% of NPP, respectively (Coleman et al. (2004); Chapin III et al. (2011). Estimating NPP belowground is a challenge (Clark et al., 2001a). Besides fine root production, there are other components associated
15

with fine root activity that are mostly ignored, but may be of great significance. Such components may include root exudates/secretions (10-40% of NPP), root transfer to mycorrhizae (15-30% of NPP) and losses to herbivores and mortality (1-40%) (modified from Chapin III et al., 2011; Coleman et al., 2004).
However, reliable estimates of forest NPP require all components that contribute to total NPP to be quantified (see Clark et al., 2001a), or at least those that can be considered representative and/or very sensitive to a specific forest ecosystem. Such information on forest carbon dynamics can then be used to develop better policy decisions relating to forest production or conservation (Clark et al., 2001a).
1.3 The rationale for the study
There is a general need for better knowledge on how replacement of native, degraded miombo forest with plantations of Pinus and Eucalyptus affects carbon stocks and fluxes, including the nutrient status of soils. Improved knowledge in this area would increase the possibility to assess the effects on the carbon balance at the regional scale. Such knowledge is also needed to develop management practices for sustainable forest production. Miombo forests and Pinus and Eucalyptus spp. plantations occur in various climate and soil conditions in southern Africa. The Western Highlands of Manica province in Mozambique are characterised by a mountain miombo forest type that is different to lowland miombo forest types. For this and similar regions, there are knowledge gaps concerning the fundamental effects of a change from native forest and woodland to fast-growing Pinus and Eucalyptus plantations.
Four of the most important questions are: 1. What are the effects of a first rotation of Pinus or Eucalyptus plantation
on the soil stocks of carbon, nitrogen and other nutrients and soil characteristics?
2. Are there true tree species effects that can be separated from the influence of differences in management, such as better protection from fires in plantations?
3. Are tree species effects on soil carbon stocks caused by differences in litter production or the quality (degradability) of the litter?
4. Do the effects of plantations observed in the first rotation persist in the following rotations?
16

Besides understanding the fundamental effects of converting miombo forest to plantations, there is a need to estimate NPP and establish allometric biomass equations (ABEs) that can be used to estimate carbon stocks and fluxes at the regional scale when implementing forest measuring and monitoring systems for REDD+. Carbon flux data, otherwise known as emissions factors (EFs), are used to calibrate carbon models for predicting and mapping carbon stocks and changes in forest ecosystems at specific times, and to support the use of the gain-loss method, which is the most robust method for carbon accounting.
17


2 Thesis aims The overall aims of this thesis were to:
1. Examine the effects of Pinus and Eucalyptus plantations on ecosystem carbon and nutrient stocks and fluxes and net primary production following conversion of ‘degraded’ miombo forests in Mozambique (Papers I and II).
2. Develop biomass allometric equations for miombo, Pinus and Eucalyptus species for predicting and mapping carbon stocks at ecosystem level in Mozambique (Paper II).
The specific aims of Papers I and II were to:
Quantify effects of first rotation, 34-year-old Pinus taeda and Eucalyptus grandis stands on soil carbon and nutrients stocks compared with “degraded” miombo forest ecosystem (Paper I).
Develop biomass allometric equations for accurate estimation of aboveground carbon stocks in Pinus taeda, Eucalyptus grandis, and E. cloeziana and miombo forests growing at high altitudes (Paper II).
Quantify the effects of 34-year-old Pinus taeda and Eucalyptus
cloeziana plantations on aboveground and belowground carbon stocks, carbon fluxes and net primary production (NPP) compared with those in “degraded” miombo forest ecosystems (Paper II).
19

3 Material and methods
3.1 Study area
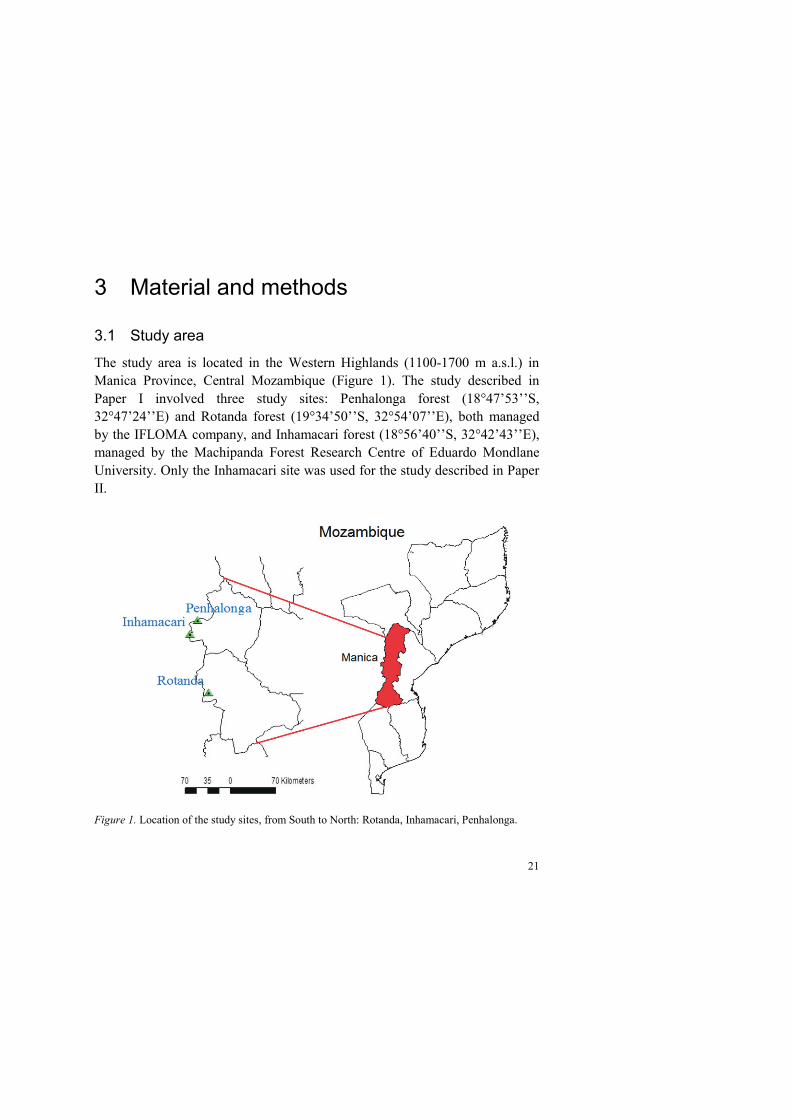
The study area is located in the Western Highlands (1100-1700 m a.s.l.) in Manica Province, Central Mozambique (Figure 1). The study described in Paper I involved three study sites: Penhalonga forest (18°47’53’’S, 32°47’24’’E) and Rotanda forest (19°34’50’’S, 32°54’07’’E), both managed by the IFLOMA company, and Inhamacari forest (18°56’40’’S, 32°42’43’’E), managed by the Machipanda Forest Research Centre of Eduardo Mondlane University. Only the Inhamacari site was used for the study described in Paper II.
Figure 1. Location of the study sites, from South to North: Rotanda, Inhamacari, Penhalonga.
21

The Western Highlands region is part of the Cordillera of Chimanimani
(African mountainous element), one of most important centres of mega-biodiversity in Mozambique. The terrain of the region is mostly steeply sloping, with elevation ranging from 1100 to 1200 m a.s.l. The climate in the study area is temperate, with dry winters and warm summers (Cwb according to the Köppen-Geiger climate classification; (Peel et al., 2007). Mean annual temperature is 21.2 °C and mean annual precipitation 1300 mm, with a dry season during May-October (IIAM, 2007). The soils are weathered, nutrient-poor and acid or moderately acid. The vegetation in the study area is dominated by dry miombo forest at high altitude and non-native commercial forest plantations. The area covered by these forest types is estimated to be 31 000 ha and 21 000 ha, respectively, based on a forest inventory of Manica Province (Cuambe and Marzoli, 2006). Dominating species in the miombo forests are Brachystegia spiciformes Benth., Julbernardia globiflora (Benth.) Troupin, Pericopsis angolensis [Baker] Meeuwen, Uapaca kirkiana Müll. Arg., and Parinari curatellifolia Planch. ex Benth. Canopy cover of the miombo sites ranges between 10- 40% (see Cuambe and Marzoli, 2006), with mean total height of 12 m (field estimates).
The planted forests included in this study are pure P. taeda, E. grandis and E. cloeziana stands established between 1977-1980 (see Adam et al., 1991). These species, except E. cloeziana, are also widely planted in the bordering countries (see Dube and Mutanga, 2015; FAO, 2001; Mujuru et al., 2014). The studied planted forests are part of the first generation of large-scale industrial forest plantations that have been established in the study area. The mean age of the planted forests was 34 years (± 6% uncertainty error) according to oral sources (senior staff of the Machipanda Research Centre and IFLOMA) and a SIDA evaluation report of the Mozambique-Nordic Agricultural Programme (MONAP) (Adam et al. (1991).To our knowledge, forest plantations received no fertiliser and no silvicultural treatments (pruning or thinning) since its establishment (A. Esequias, senior staff at Machipanda Forest Centre, personal communication, Sept., 2012). The plantations have been better protected against cutting, pruning and fires compared to the adjacent miombo forests. However, the miombo stands included in this study were relatively better protected and were less degraded compared to most other miombo forests of the region.
3.1.1 Study design
The sites used for the investigation of tree species effects on soils in Paper I (Inhamacari, Penhalonga and Rotanda) (Figure 1) were considered as blocks in
22

a randomised block design (n=3). At each site, one study plot (30 m x 30 m) was selected for each of three forest types/tree species: miombo, Pinus taeda and Eucalyptus grandis.
Forest stands that fulfilled the following criteria were identified: (i) Forest stands of first-rotation plantation of P. taeda and E. grandis, located adjacent to miombo forests; (ii) forest plantations established on soil similar to miombo forest soil; (iii) forest plantations established on land with a former land similar that in the current miombo forest stands; and (iv) high canopy cover and high homogeneity in canopy cover and stem density. The study plots were identified in the field with the help of senior staff from IFLOMA (M. Mariano, personal communication, Oct. 2012) and Machipanda Forest Centre (A. Esequias, personal communication, Sept. 2012). Studies of forest type differences in biomass, growth and litter production (Paper II) were confined to the Inhamacari site, where Machipanda Research Centre provided logistics support to ensure monitoring of litterfall and other repeated measurements. Three plots (30 m x 30 m) of each forest type (miombo, Pinus taeda and Eucalyptus cloeziana) were selected for that study, following the same criteria (i)-(iv) as described above. Thus, the studies in Papers I and III shared one plot of miombo and one plot of P. taeda at Inhamacari (Figure 1).
3.1.2 Study of soils (Paper I)
Sample collection In each plot, diameter at breast height (DBH) was measured on all trees and
the field with the help of a botanically skilled technician. Soil and litter mass were sampled using a grid sampling design involving 10 spots in each plot, in order to cover the expected variability in soil and litter mass. The litter layer was sampled within a 15 cm x 15 cm frame. Soil samples were collected with a steel corer (28 mm diameter) and soil cores were divided into depth sections (0-10, 10-30 cm) and pooled together to one sample per soil layer and main plot. For the deeper layers (30-50 cm), soil samples were collected from one soil pit in each plot. In total, nine soil samples were collected per vegetation type for chemical analyses (three sites x three soil layers). A forest and soil inventory was carried out.
Laboratory analyses Soil analyses included total soil organic carbon (SOC) determined by the Walkley-Black method, and total soil nitrogen (Kjeldahl method according to Westerhout and Bovee (1985). Exchangeable base cations (Ca2+, Mg2+, K+ and
23

Na+) were analysed by extraction in ammonium-acetate, followed by determination using atomic absorption spectrophotometry. Exchangeable acidity (Al3+ + H+) was determined by a complexometric titration method and extractable phosphorus was determined according to the Bray (I) method. Soil pH was measured potentiometrically in a 1:2.5 soil:water solution according to Houba et al. (1989). In addition, soil texture was determined by mechanical analyses and the Robinson pipette method was used for determination of the clay content (Westerhout and Bovee, 1985). Laboratory work was based on the protocol by Houba et al. (1989). Soil analyses were performed at the Faculty of Agronomy and Forest Engineering (FAEF), University Eduardo Mondlane (UEM) in Mozambique.
3.1.3 Study of forest stands (Paper II)
Structural analysis and growth rate of forest stands In each of the nine study plots at Inhamacari, trees were individually marked
2013, using a diameter tape with metric units. These measurements were repeated in July 2014. All individuals were identified to species level in the field with the help of a botanist. No mortality was observed during the 1.3 years of forest monitoring.
Litterfall Litterfall was collected continuously throughout one year (November 2012 to October 2013) using square litter traps (50 cm x 50 cm, approx. 20 cm deep). In each study plot, 15 litter traps were installed, giving in total 45 traps per forest type. Litterfall mass was collected monthly and pooled per plot. Dry mass of litterfall was determined after drying at 65°C by constant weight. Carbon content in litter was assumed to be 50% of dry mass (Grace et al., 2006). The collected litterfall included tree foliage, reproductive parts (flowers,
but excluded herbaceous material and branches >5 mm (see Clark et al., 2001a)
Fine root production Fine roots were defined a (Lehtonen et al., 2016; McCormack et al., 2015). Annual production of fine roots in the top 15 cm of the soil and their carbon content were estimated using the ingrowth core method (Finér et al., 2011a; Jackson et al., 1996; Mainiero and Kazda, 2006). Ingrowth bags (150 mm long, 50 mm Ø) were made from nylon mesh, with 2 mm mesh size. In each study plot, 5 soil cores (50 mm Ø) were taken with a
24

steel auger, all roots were removed and the root-free soil was placed in an ingrowth mesh bag, which was name-tagged, sealed and tucked into the sampling hole, after which the litter layer was replaced. The roots in these cores were used to estimate fine root biomass. After 7 months, the mesh bags were retrieved, soil sampling for root biomass was repeated and new ingrowth bags were installed and retrieved after 9 months.
Roots within the bags were carefully separated from the soil manually, washed in a ~0.5 mm mesh sieve and oven-dried to constant weight at 65 oC. Live and dead roots were not separated owing to practical difficulties (Bledsoe et al., 1999; Ciais et al., 2011). Fine root turnover rate was calculated as the ratio between fine root production over 16 months divided by the fine root biomass at the first root sampling and 1.3 (time correction factor). The carbon content in fine roots was assumed to be 50%. The inverse of fine root production was considered an estimate of fine root longevity (residence time).
3.1.4 Calculations
Study of soils (Paper I) The soil study included calculations of effective cation exchange capacity (CECeff), base saturation (BS), SOC stocks, total soil nitrogen (N) and extractable phosphorus (P). CECeff was calculated from the sum of equivalent charges of base cations (Ca++, Mg++, K+, Na+) and exchangeable acidity (Al+++, H+) (Hazelton and Murphy, 2007). Base saturation was calculated from the sum of base cations divided by CECeff.
The element stocks (SOC, N and P) per unit area and soil layer (Mg ha-1) were calculated by multiplying the bulk density (BD), soil layer thickness and the element concentration per unit dry mass. Total element stocks (Mg ha-1) were calculated as the sum of stocks in all layers in all layers (0-10cm + 10-30cm + 30-50 cm depth) and plot level. Soil bulk density (g cm-3) was estimated per soil layer using a general pedotransfer function (Guo and Gifford, 2002; Paul et al., 2002; Post and Kwon, 2000). Assumptions made and a detailed description of bulk density determination is presented in Paper I.
Calculation of mean relative difference (RD; Equation 1) was used to determine the magnitude of the impact of planted forests (P. taeda and E. grandis) on total SOC stock, total stock of extractable phosphorus (in the soil and whole tree) and total nitrogen stock (in the soil and whole tree). RD (%) = 100 ( Eq. 1)
25

Study of forest stands (Paper II) Aboveground carbon (AGC) stock (Mg ha-1) was calculated per forest type using allometric biomass equations (ABEs) developed. Trees for destructive sampling for biomass determination were taken within the Inhamacari study area, but outside the nine study plots, in order to avoid disturbance to the plot soil.
Destructive sampling was carried out in January 2013 (Eucalyptus stands) and in June 2014 (miombo, Pinus stands). In both cases, trees were sampled in the period of peak foliage. A total of 30 trees were sampled in P. taeda stands, 31 trees in Eucalyptus stands (E. cloeziana and some E. grandis) and 38 trees in miombo forest. The five dominant tree species in miombo forest were included (i.e. Brachystegia spiciformes, Julbernardia globiflora, Pericopsis angolensis, Uapaca kirkiana and Parinari curatellifolia).
The following equations were developed to predict total aboveground biomass (in metric tons dry weight, tDW) from DBH (cm):
For P. taeda plantations: tDW ( ) = 0.1942 . (Eq. 2)
(DBH range = 9 to 39, mean prediction error = 1%, precision = 99%).
For E. cloeziana plantations: tDW ( ) = 1.1547 . (Eq. 3)
(DBH range= 5 to 74, mean prediction error = 2.7%, precision = 97.3%).
For miombo forest stands: tDW ( ) = 0.1397 . (Eq. 4)
(DBH range= 4 to 36, mean prediction error = -0.5%, precision = 99.5%).
The carbon stocks in aboveground biomass (Mg ha-1 yr-1), i.e. stems + branches + foliage, were calculated for individual trees in study plots by applying the DBH data to the ABEs (Equations 2-4) and adding up the carbon stock at plot scale. Growth increment, i.e. carbon accumulation in biomass following forest growth, was calculated as the difference between carbon stocks (Mg ha-1) of the two consecutive forest inventories, divided by the time interval (1.3 years).
Coarse root carbon (CRC) stock (Mg ha-1), here defined as all roots >10 mm diameter (Levillain et al., 2011), was estimated using root–shoot ratio
26

(RSR) values taken from the literature. For miombo forest, a mean RSR of 0.48 was assumed, considering that the reported value varies between 0.40 and 0.56 (see Chidumayo, 2014; Kachamba et al., 2016; Mokany et al., 2006; Mugasha et al., 2013; Ryan et al., 2011). For P. taeda and E. cloeziana plantations, a mean RSR value of 0.27 was used, given that it can vary between 0.20 and 0.32 (see Cairns et al., 1997; IPCC, 2006; Mokany et al., 2006). No distinction was made between plantation forest species because RSR can be independent of tree type, i.e. angiosperm or gymnosperm (see Cairns et al., 1997; Mokany et al., 2006). Net primary production was defined as the amount of carbon produced and lost by the three stand types during the one-year period of field monitoring (adapted from Clark et al., 2001a). In this context, NPP was considered equivalent to the sum of carbon fluxes of three components (Clark et al., 2001a): aboveground carbon increment (AGCI), carbon lost as litterfall (LFC) and carbon production by fine roots (FRP). The contribution of belowground increment in coarse roots to NPP was not included here due to the relatively large uncertainty of that estimate.Similarly to the soil study, mean relative difference (RD; Equation 1) was calculated in order to determine the magnitude of the impact of P. taeda and E. cloeziana on aboveground and belowground carbon stocks (i.e. AGC and CRC), carbon fluxes (AGCI, LFC and FRP) and net primary production (NPP).
3.1.5 Statistical analyses
For the soil study, the linear mixed-effects model in R package lme4 (Bates et al., 2014) and two-way analysis of variance model was used to evaluate the effect of the planted forests (P. taeda and E. grandis) on soil properties compared with miombo forest. For the study of forest stands, the linear model in R package lm (RCoreTeam, 2014) and one-way analysis of variance was used.
In both cases, pair-wise comparisons were performed based on Tukey’s post hoc test, with P value adjusted using the single-step method and
(Bretz et al., 2010). The P values from the model were extracted using R package multcomp (Bretz et al., 2010). Results for Z-test, T-test and F-test are presented in Chapter 4 of this thesis. When the F-test value is presented, the three stand types did not differ significantly, while when Z-test and T-test values are presented this indicates that pair-wise comparisons were performed and that significant differences between the three vegetation types occurred. Biomass allometric equations were fitted using R package nlstools (Baty et al., 2015). All statistical analyses were carried out using R statistical software, version 3.0.3 (RCoreTeam, 2014).
27

28

4 Results and Discussion
4.1 Comparison of carbon stocks
Carbon stocks in the soil (SOC, Paper 1) and in the biomass (Paper II) of different forest types are summarized in Figure 2. However, it should be kept in mind that the SOC data were mean values from three sites, whereas the biomass stocks were only measured on one location, Inhamacari. Further, SOC stocks of Eucalyptus were measured in E. grandis stands on all three locations, whereas the biomass of Eucalyptus included only data on E. cloeziana stands from plots in Inhamacari. The carbon stocks in the litter layer of E. grandis and E. cloeziana stands in Inhamacari were almost the same (data not shown), but SOC stocks were much lower in the study plot with E. cloeziana.
In miombo forest and Pinus plantation (Figure 2), SOC accounted for 78% and 50%, respectively, of the total carbon stocks in biomass and soil. In contrast, in the Eucalyptus plantations, aboveground carbon in biomass was the largest stock, which accounted for 46% of total carbon budget and was slightly greater than SOC stock (41% of total carbon stock).
Pinus and Eucalyptus on carbon stocks, increasing the carbon stocks in both biomass and soil (AGC, CRC and SOC) compared with miombo forest (Figure 2). The magnitude of the effect of plantation was clearly higher on aboveground carbon stocks than on soil carbon stocks.
Aboveground carbon stock was 563% (or 106 Mg C ha-1) larger in P. taeda and 875% (or 156 Mg C ha-1) larger in E. cloeziana plantation than in miombo forest (16 Mg C ha-1). A similar effect, but at a lower level, was observed for SOC stocks, which were 55% larger in P. taeda (or 135 Mg C ha-1) and 60% larger in E. grandis (or 139 Mg C ha-1) than in miombo forest (87 Mg C ha-1). Assuming a steady state stock of soil carbon in miombo forest over 34 years, the net accumulation of SOC was 1.41 Mg ha-1 yr-1 in P. taeda stands and 1.53
29

Mg ha-1 yr-1 in E. grandis stands. These estimates were within the range of 0-3.3 Mg ha yr reported by Post and Kwon (2000), but higher than the 0.15-0.75 Mg ha-1 yr-1 reported by Li et al. (2012).
The higher aboveground carbon stocks in planted forest compared with miombo forests were reflected in higher basal area in the plantations (Paper II). Increases in aboveground C stocks are often correlated with increased SOC (e.g., Hansson et al., 2013; Wang et al., 2009), and this was also the case in this Thesis.
Figure 2. Pattern of allocation of carbon stocks to aboveground and belowground systems in miombo, Pinus and Eucalyptus stands. Soil organic carbon stocks are mean values from three locations of miombo, Pinus taeda and E. grandis forests (Paper I). Carbon stocks in tree biomass are from on miombo, P. taeda and E. cloeziana forests in Inhamacari (Paper II).
30

Tabl
e 1.
Tre
nd a
naly
sis
and
sum
mar
y st
atis
tics
for
the
effe
ct o
f pla
nted
fore
sts
on e
cosy
stem
car
bon
stoc
ks, c
arbo
n ch
ange
(flu
x) a
nd n
utrie
nt s
tock
s fo
llow
ing
conv
ersi
on o
f mio
mbo
fore
st in
Moz
ambi
que.
AG
C =
abo
vegr
ound
car
bon
stoc
k; C
RC =
car
bon
stoc
k in
coa
rse
root
s; S
OC
= s
oil o
rgan
ic c
arbo
n; C
SR =
ca
rbon
sequ
estr
atio
n ra
te b
y tr
ees;
LFC
= li
tterf
all c
arbo
n st
ock;
FRP
= c
arbo
n pr
oduc
tion
by fi
ne ro
ots;
EP
= e
xtra
ctab
le p
hosp
horu
s; N
= to
tal n
itrog
en; +
=
sign
ifica
ntly
hig
h ef
fect
; -
= s
igni
fican
tly lo
w e
ffect
; ns=
non
-sig
nific
ant.
Whe
n th
e F-
test
val
ue is
pre
sent
ed, t
he th
ree
stan
d ty
pes
did
not d
iffer
sig
nific
antly
, w
hile
whe
n Z-
test
and
T-te
st v
alue
s are
pre
sent
ed th
is in
dica
tes t
hat p
air-
wis
e co
mpa
riso
ns w
ere
perf
orm
ed a
nd th
at si
gnifi
cant
diff
eren
ces b
etw
een
pla
ntat
ions
an
d m
iom
bo st
ands
occ
urre
d.
Para
met
er
Pinu
s pla
ntat
ion
Eu
caly
ptus
pla
ntat
ion
Sour
ce
Tren
d of
ch
ange
St
atis
tical
sign
ifica
nce
Tr
end
of
chan
ge
Stat
istic
al si
gnifi
canc
e
Car
bon
stoc
ks (M
g·ha
-1)
T
rees
(AG
C)
+
+
Pa
per I
I
Coa
rse
root
s (C
RC
) +
T va
lue
+
Pape
r II
T
otal
SO
C st
ock
(Mg·
ha-1
) +
Z va
lue
= 3.
19; P
+ Z
valu
e= 2
.91;
P<
0.05
Pa
per I
Car
bon
fluxe
s (M
g·ha
-1 y
r-1)
T
rees
(AG
CI)
+
+ 0.
0001
Pa
per I
I
Fin
e lit
terf
all (
LFC
) +
T va
lue
= 3.
18; P
=0.0
44
+
T va
lue=
-3.2
8; P
=0.0
39
Pape
r II
F
ine
root
s (FR
P)
ns
T va
lue
= 2.
89; P
=0.0
6
+ T
valu
e =
-
Pape
r II
N
et p
rim
ary
prod
uctio
n (N
PP)
+
+
T va
lue
= -
Pa
per I
I
Nut
rien
t sto
cks (
kg·h
a-1)
S
oil (
0-50
cm
dep
th)
T
otal
soil
EP
-
Z va
lue
= -2
.65;
P
ns
Z
valu
e =
1.66
; P>
0.1
Pape
r I
T
otal
soil
N
ns
F va
lue=
0.7
4; P
>0.1
ns
F va
lue=
0.7
4; P
>0.1
Pa
per I
31

4.2 Comparison of carbon fluxes
The carbon fluxes in biomass increment and aboveground litterfall were significantly higher in the plantations than in the miombo forest and there was also a difference ( 0.05) in fine root production in E. cloeziana compared with miombo (Table 1, Figure 3). Mean value of fine root production was 53% higher in P. taeda than in miombo, but the difference was not significant (T-value = 2.89; P= 0.06).
The Pinus and Eucalyptus plantations allocated most of their carbon to stand growth (5.9 and 8.3 Mg C ha-1 yr-1, respectively), whereas miombo forest stands showed the opposite, with more carbon allocation to litterfall (2.3 Mg C ha-1 yr-1) (Figure 3). In forest plantations at similar sites elsewhere (annual
-1), the mean annual rate of carbon allocated to stand growth is reported to range between 5.5 and 8 Mg ha yr-1 (IPCC, 2006), which is comparable to the rate found in Pinus and Eucalyptus plantations in this thesis.
Figure 3. Carbon fluxes and pattern of allocation of net primary production (NPP) to aboveground and belowground systems in miombo, Pinus and Eucalyptus stands (Paper II).
32

The mean rate of carbon allocation to stand growth observed in miombo trees (1.49 Mg C ha yr-1 ) showed good agreement with the ranges reported in global reviews, of 0.3-3.8 Mg C ha yr-1 (Clark et al., 2001b) and 1.61-3.99 Mg C ha yr-1 (Luyssaert et al., 2007). However, it was slightly higher than the 0.1-0.9 Mg C ha yr-1 reported for miombo forests elsewhere in Africa (Lupala et al., 2014; Williams et al., 2008).
In this thesis, there was a consistent and increasing trend in carbon in litterfall and fine root production with increasing aboveground and coarse root carbon stocks. The general claim of a strong positive relationship between tree biomass and fine root production (see Lehtonen et al., 2016; Raich et al., 2014) was confirmed in this study. As demonstrated by e.g. (Hu et al., 2016; Lehtonen et al., 2016; Li et al., 2012), fine root production and litterfall are important drivers in explaining SOC changes. In this thesis, the increased SOC stocks in planted forests were correlated with higher litter production (Figures 2 and 3).
4.3 Net primary production
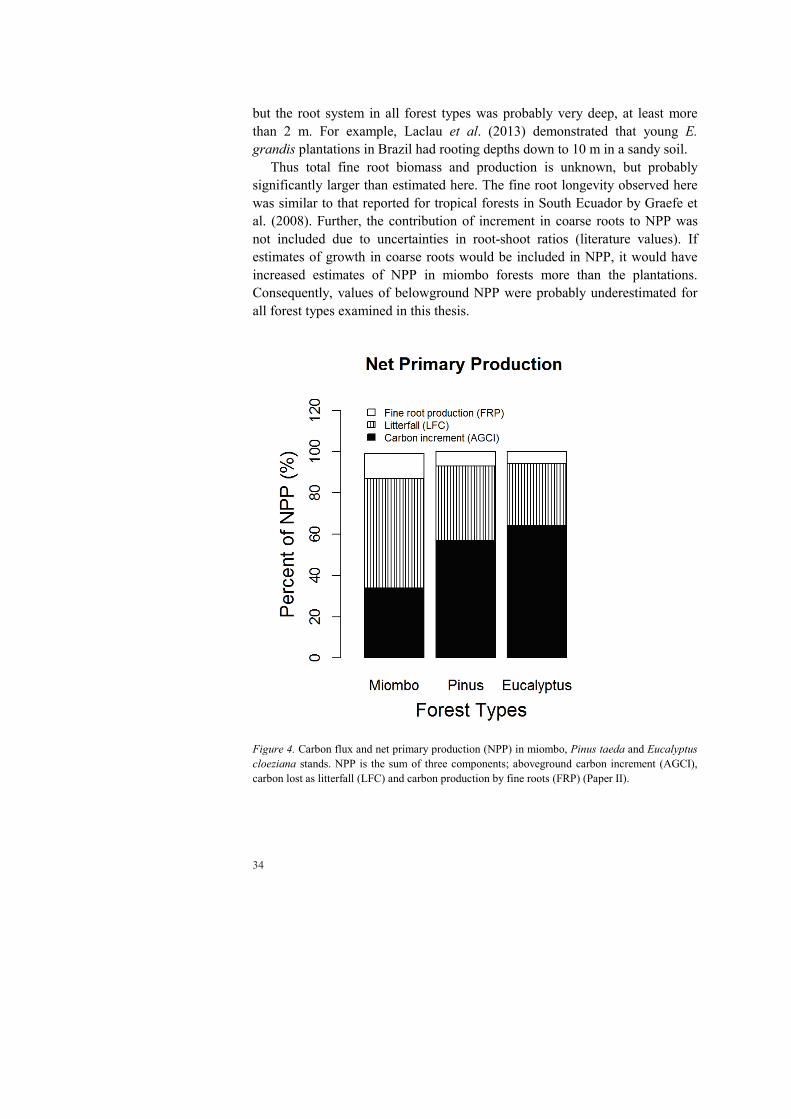
Net primary production is influenced by a number of factors, which poses challenges when comparing data from different sites. In this study, the contribution of net increment in aboveground biomass in Pinus and Eucalyptus plantation (57 and 64%, respectively; Figure 4) lay within the range of 40-70% of NPP compiled from different sources (Chapin III et al., 2011; Coleman et al., 2004; Ågren and Andersson, 2011). The value found here for net increment in aboveground biomass of miombo forests was 34% of NPP, which is relatively low.
Carbon allocation to litterfall may account for 10-30% of NPP in forest ecosystems (see Chapin III et al., 2011; Clark et al., 2001a; Coleman et al., 2004; Yang et al., 2007). The contribution of litterfall in Eucalyptus plantations (30% of NPP) showed excellent agreement with the cited range, but litterfall in the Pinus plantations and miombo forest was higher, 53% and 36% of NPP, respectively.
The proportion of C allocated to fine roots can vary between 30 and 40% of NPP (see Chapin III et al., 2011; Coleman et al., 2004; Lehtonen et al., 2016). The proportion of fine root production was much lower in this thesis for all forest types, and ranged from 6-12% of NPP in Eucalyptus (E. cloeziana) and Miombo stands, with Pinus intermediate (7% of NPP). The main cause of this was probably that fine root production was only measured in the top 15 cm of the soil. Soil profiles dug out at the study site indicated that this soil layer probably included fine roots of great importance to nutrient and water uptake,
33
but the root system in all forest types was probably very deep, at least more than 2 m. For example, Laclau et al. (2013) demonstrated that young E. grandis plantations in Brazil had rooting depths down to 10 m in a sandy soil.
Thus total fine root biomass and production is unknown, but probably significantly larger than estimated here. The fine root longevity observed here was similar to that reported for tropical forests in South Ecuador by Graefe et al. (2008). Further, the contribution of increment in coarse roots to NPP was not included due to uncertainties in root-shoot ratios (literature values). If estimates of growth in coarse roots would be included in NPP, it would have increased estimates of NPP in miombo forests more than the plantations. Consequently, values of belowground NPP were probably underestimated for all forest types examined in this thesis.
Figure 4. Carbon flux and net primary production (NPP) in miombo, Pinus taeda and Eucalyptus cloeziana stands. NPP is the sum of three components; aboveground carbon increment (AGCI), carbon lost as litterfall (LFC) and carbon production by fine roots (FRP) (Paper II).
34
4.4 Effects on Nitrogen and Carbon-to-Nitrogen ratio (Paper I)
In contrast to SOC, there were non-significant effects of stand type on total soil N stock (0-50 cm layer). Total stock (0-50 cm layer) of nitrogen (N) did not differ between Miombo and planted forests (F=0.74; P>0.1). It ranged from 5.9 Mg ha-1 in Miombo forest to 7.0 Mg ha-1 in E. grandis, with P. taeda intermediate (6.7 Mg ha-1). The findings agrees with the observation by Li et al. (2012) that a longer time (~50 years) is needed to detect significant increases in soil N than increases in SOC following plantation. However, soil nitrogen stocks were higher in the top 10-cm layer of plantation soil than miombo forest soil.
However, this study estimated an average accumulation rate of approximately 32 kg N ha-1 yr-1 by Pinus and Eucalyptus plantation, which was a substantial accumulation rate of total soil N stocks compared to Miombo. The estimates of total N stocks (0-50 cm) for Miombo forest and plantation of P. taeda in this study were similar to those reported by Mujuru et al. (2014) in Zimbabwe, namely: 5 Mg N ha-1 in Miombo sites and 7.5 Mg N ha-1 in P. patula plantation.
The mean value of the C/N ratio (0-50 cm) was 15, 21 and 22 for Miombo, E. grandis and P. taeda soils, respectively. In a study in Zimbabwe, Mujuru et al. (2014) reported a mean C/N ratio of 13 and 17 in the 0-60 cm soil layer of miombo forest and 30-year-old P. patula, respectively. In contrast, King and Campbell (1994) reported higher values for stands in Zimbabwe: a C/N ratio of 21 in miombo forest, 22 in P. patula and 26 in E. grandis stands. It can be seen that the findings in this study, falls between the C/N ratios reported by those two studies.
4.5 Effects on soil pH and extractable Phosphorus
Eucalyptus grandis plantation increased soil pH and reduced extractable soil P in this study. Extractable phosphorus (P) stock (Figure 5) was 22% lower in E. grandis soils (0-50 cm) than Miombo (Z=- 0.01). Miombo and Pinus soils did not differ significantly in this respect. Extractable P stock in E. grandis was also significantly lower than P. taeda 0.001).
In both the E. grandis and P. taeda plantation, extractable P and SOC were strongly (t=10.44; degrees of freedom= 0.001) and positively correlated to each other (Pearson's r = 0.97). The significant positive correlation between SOC and P found in the planted stands, but not in miombo forest, was not surprising, since an increase in soil organic C should be associated with increased availability of P (Brady and Weil, 2008; Moody and Bolland, 1999; Rashidi and Seilsepour, 2008).
35

Figure 5. Patterns of allocation of phosphorus (P) to aboveground and belowground systems in miombo, Pinus taeda and Eucalyptus cloeziana stands (Paper I).
Higher demand by tree species for nutrients may cause a reduction in plant-available P, particularly if forest growth results in soil acidification. Available soil P in the studied soils, i.e. highly weathered, leached and acidic soils is typically low P limitations for plant growth and P limitation can be expected (Aggangan et al., 1996; Binkley, 1997; Högberg, 1986; Moody and Bolland, 1999).
In highly weathered, leached and acidic soils the availability of P also depends on soil pH level. The effect of E. grandis plantation on soil pH, i.e. pH: 0.6-0.8 pH units higher, was a significantly large impact relative to adjacent Miombo soils. The effect of E. grandis plantation on soil pH was the opposite to that of P. taeda (Data not shown).
The combination between nutrient depletion from the soil in to the tree components (stem, branches, and foliage) plus increased soil pH should be connected to the observed effects. Plant P availability is highest in the soil pH range 6-7 (Brady and Weil, 2008; Chapin III et al., 2011; Hazelton and Murphy, 2007), which is corresponds to findings in E. grandis plantation (pH:
36

. Plantation of Pinus taeda had no effect on soil acidity, but Eucalyptus grandis increased soil pH (10-50 cm) and reduced total stock of extractable soil P (0-50 cm).
The estimated mean amount of P in above-ground biomass of E. grandis (67 kg ha-1) was of a similar magnitude to the apparent decline in P content in the soil compared with miombo forest (38 kg ha-1) (Figure 5). In contrast, there were no differences in soil P stocks between miombo forest and P. taeda plantations, while the amounts of P accumulated in the biomass of pines was substantial. This difference between stands of Pinus and Eucalyptus may derive from species differences in e.g. nutrient uptake capacity and mycorrhizal associations to roots.
The results suggest that P. taeda has a greater capacity than E. grandis to utilise other P sources in the soil than measured by the extraction method used here. Another explanation is that extractable P depends on soil pH (Brady and Weil, 2008; Hazelton and Murphy, 2007), and organic P is an important source of plant P uptake in weathered soils.
37

5 Conclusions This thesis compared ecosystem carbon and nutrient status in soil following first-rotation Pinus and Eucalyptus plantation in a high-altitude region of Mozambique with the situation in adjacent native, mixed-species miombo forests.
The main conclusions of the work were: After around 34 years, tree carbon stocks, aboveground and
belowground carbon fluxes and net primary production were higher in Pinus taeda and Eucalyptus cloeziana plantations than in miombo forest.
After around 34 years, total soil carbon stocks were higher in Pinus taeda and Eucalyptus grandis plantations than in miombo forest.
Nitrogen stocks in the top 10 cm soil layer soil were higher in the plantations than in miombo forest.
The Pinus taeda and Eucalyptus grandis plantations affected soil acidity and exchangeable soil nutrient status differently (0-50 cm).
Thus, plantation of Pinus taeda had no effect on soil acidity, but Eucalyptus grandis increased soil pH (10-50 cm) and reduced total stock of extractable soil phosphorus (0-50 cm).
Biomass allometric equations were successfully developed for aboveground biomass of high-altitude, mixed-species miombo forests, plantations of Pinus taeda and plantations of Eucalyptus cloeziana and E. grandis in Mozambique.
The allometric biomass equations developed predicted aboveground 97%, mean
prediction error: -3 to 1%).
39


6 Further work This licentiate thesis was produced as part of a PhD thesis project. More data and material have been gathered within the project and are intended for the following planned publications:
1. A study of decomposition rate of foliage litter in miombo, Pinus taeda and Eucalyptus cloeziana stands. Foliage litter was collected and used for a litter-bag study of decomposition rate. The field study was run for two years. Temperature in the topsoil was monitored daily in different forest stands. The mass loss data will be analysed using the Q-model to predict long-term carbon dynamics in litter. Litterfall data will be used to predict the long-term consequences for carbon dynamics in the soil.
2. Prediction of aboveground carbon stocks in miombo forest at landscape scale in the Central region of Mozambique. Three potential biomass allometric equations have been developed for a wider geographical area characterised by diverse miombo ecosystems in different stages of degradation. Landscape-scale carbon prediction is of interest for implementing forest measuring and monitoring systems for the REDD+ mechanism at sub-national level. In addition, some equations have been developed for predicting aboveground carbon based on stem diameter measurements at the root collar, to allow estimation of biomass lost in forest degradation. To the best of my knowledge, no similar models have been proposed elsewhere except those using remote sensing technologies.
3. An analysis of how traditional uses of miombo forests are linked to forest degradation in the Central region of Mozambique. The study will involve structural analysis of tree species individually and forest ecosystems as a whole. Tree species with high traditional value locally and which are highly threatened as a result of overexploitation have already been identified. The findings in the study will allow the impacts of traditional uses on the conservation status of individual tree species to be determined.
41


References Adam, Y., Goodyear, R., Greeley, M., Moore, M., Munguambe, J., Neves, M.,
Roberts, P., Taju, G., and Vieira, S. (1991). Aid Under Fire: An Evaluation of the Mozambique-Nordic Agricultural Programme (Monap). SIDA Evaluation Report, Agriculture, Mozambique. pp. 125. Swedish International Development Authority. SIDA`s Evaluation Section, Stockholm.
Aggangan, N. S., Dell, B., and Malajczuk, N. (1996). Effects of soil pH on the ectomycorrhizal response of Eucalyptus urophylla seedlings. New Phytologist 134, 539-546.
Bates, D., Maechler, M., Bolker, B., and Walker, S. (2014). lme4: Linear mixed-effects models using Eigen and S4. pp. 51.
Baty, F., Ritz, C., Charles, S., Brutsche, M., Flandrois, J.-P., and Delignette-Muller, M.-L. (2015). A Toolbox for Nonlinear Regression in R: The Package nlstools. 2015 66, 21.
Berthrong, S. T., Jobbágy, E. G., and Jackson, R. B. (2009). A global meta-analysis of soil exchangeable cations, pH, carbon, and nitrogen with afforestation. Ecological Applications 19, 2228-2241.
Binkley, D. (1997). Bioassays of the influence of Eucalyptus saligna and Albizia falcataria on soil nutrient supply and limitation. Forest Ecology and Management 91, 229-234.
Bledsoe, C. S., Fahey, T. J., Day, F. P., and Ruess, R. W. (1999). Measurement of Static Root Parameters: Biomass, Length, and Distribution in the Soil Profile. In "Standard soil methods for long-term ecological research" (G. P. Robertson, D. C. Coleman, C. S. Bledsoe and P. Sollins, eds.), pp. 413-436. Oxford University Press, Inc., New York, USA.
Brady, N. C., and Weil, R. R. (2008). "The nature and properties of soils," 14th Edition/Ed. Pearson-Prentice Hall, Upper Saddle River, NJ., New Jersey.
Bretz, F., T., H., and Westfall, P. (2010). Multiple Comparisons Using R. Chapman \& Hall/CRC Press, Boca Raton. Florida. USA.
Cairns, M. A., Brown, S., Helmer, E. H., and Baumgardner, G. A. (1997). Root biomass allocation in the world's upland forests. Oecologia 111, 1-11.
Campbell, B., Frost, P., and Byron, N. (1996). Miombo woodlands and their use: Overview and key issues. In "The Miombo in transition: Woodlands and
43

welfare in Africa" (B. Campbell, ed.), pp. 1-10. Center for International Forestry Research, Bogor, Indonesia.
Chapin III, F. S., Matson, P. A., and Vitousek, P. M. (2011). "Principles of Terrestrial Ecosystem Ecology," Second/Ed. Springer Science+Business Media, LLC, USA.
Chidumayo, E. N. (2014). Estimating tree biomass and changes in root biomass following clear-cutting of Brachystegia-Julbernardia (miombo) woodland in central Zambia. Environmental Conservation 41, 54-63.
Ciais, P., Bombelli, A., Williams, M., Piao, S. L., Chave, J., Ryan, C. M., Henry, M., Brender, P., and Valentini, R. (2011). The carbon balance of Africa: synthesis of recent research studies. Philosophical Transactions of the Royal Society of London A: Mathematical, Physical and Engineering Sciences 369, 2038-2057.
Clark, D. A., Brown, S., Kicklighter, D. W., Chambers, J. Q., Thomlinson, J. R., and Ni, J. (2001a). Measuring Net Primary Production in Forests: Concepts and Field Methods. Ecological Applications 11, 356-370.
Clark, D. A., Brown, S., Kicklighter, D. W., Chambers, J. Q., Thomlinson, J. R., Ni, J., and Holland, E. A. (2001b). Net primary production in tropical forests: an evaluation and synthesis of existing field data. Ecological Applications 11, 371-384.
Coetzee, H., and Alves, T. (2005). National Afforestation Strategy. pp. 91. Food and Agriculture Organization of the United Nations, Maputo, Mozambique.
Coleman, D. C., Crossley, D. A., Jr., and Hendrix, P. F. (2004). "Fundamentals of Soil Ecology," Second/Ed. Elsevier Academic Press, Burlington, USA.
Cuambe, C., and Marzoli, A. (2006). Avaliação integrada de florestas em Mozambique – AIFM. Relatório do Inventário Provincial de Manica. Relatório Final., pp. 46. Direcção Nacional de Terras e Florestas. Departamento de Inventário Florestal, Maputo, Mozambique.
Dube, T., and Mutanga, O. (2015). Quantifying the variability and allocation patterns of aboveground carbon stocks across plantation forest types, structural attributes and age in sub-tropical coastal region of KwaZulu Natal, South Africa using remote sensing. Applied Geography 64, 55-65.
FAO (2001). Mean annual volume increment of selected industrial forest plantation species by L. Ugalde & O. Pérez. In "Forest Plantation Thematic Papers, Working Paper 1. Forest Resources Development Service, Forest Resources Division" (FAO, ed.), pp. 27, Italy, Rome.
Finér, L., Ohashi, M., Noguchi, K., and Hirano, Y. (2011a). Fine root production and turnover in forest ecosystems in relation to stand and environmental characteristics. Forest Ecology and Management 262, 2008-2023.
Frost, P. (1996). The Ecology of Miombo Woodlands. In "The Miombo in transition: Woodlands and welfare in Africa" (B. Campbell, ed.), pp. 11-55. CIFOR, Bogor, Indonesia.
Gillman, L. N., Wright, S. D., Cusens, J., McBride, P. D., Malhi, Y., and Whittaker, R. J. (2015). Latitude, productivity and species richness. Global Ecology and Biogeography 24, 107-117.
44

Gower, S. T., Krankina, O., Olson, R. J., Apps, M., Linder, S., and Wang, C. (2001). Net primary production and carbon allocation patterns of boreal forest ecosystems. Ecological Applications 11, 1395-1411.
Grace, J., José, J. S., Meir, P., Miranda, H. S., and Montes, R. A. (2006). Productivity and carbon fluxes of tropical savannas. Journal of Biogeography 33, 387-400.
Graefe, S., Hertel, D., and Leuschner, C. (2008). Fine root dynamics along a 2,000-m elevation transect in South Ecuadorian mountain rainforests. Plant and Soil 313, 155-166.
Guo, L. B., and Gifford, R. M. (2002). Soil carbon stocks and land use change: a meta analysis. Global Change Biology 8, 345-360.
Hansson, K., Helmisaari, H.-S., Sah, S. P., and Lange, H. (2013). Fine root production and turnover of tree and understorey vegetation in Scots pine, silver birch and Norway spruce stands in SW Sweden. Forest Ecology and Management 309, 58-65.
Hazelton, P., and Murphy, B. (2007). "Interpreting Soil Test Results: What do all the Numbers Mean?," CSIRO Publishing, Collingwood, Austaralia.
Hou, E., Chen, C., Wen, D., and Liu, X. (2014). Relationships of phosphorus fractions to organic carbon content in surface soils in mature subtropical forests, Dinghushan, China. Soil Research 52, 55-63.
Houba, V., Van der Lee, J., Novozamsky, I., and Walinga, I. (1989). "Soil and plant analysis. A series of syllabi. Part5. Soil analysis procedures," 4th/Ed., Wageningen. The Netherlands.
Hu, Y.-L., Zeng, D.-H., Ma, X.-Q., and Chang, S. X. (2016). Root rather than leaf litter input drives soil carbon sequestration after afforestation on a marginal cropland. Forest Ecology and Management 362, 38-45.
Huston, M. A., and Wolverton, S. (2009). The global distribution of net primary production: resolving the paradox. Ecological Monographs 79, 343-377.
Högberg, P. (1986). Soil nutrient availability, root symbioses and tree species composition in tropical Africa: a review. Journal of Tropical Ecology 2, 359-372.
IIAM (2007). Acidez e Alcalinidade dos Solos de Mozambique, Propriedades dos Solos, Profundidade Efectiva, Drenagem, Salinidade, Acidez e Alcalinidade. (I. d. I. A. d. Moçambique, ed.), Maputo, Mozambique.
Indufor (2012). "Strategic review on the future of forest plantations." Forest Stewardship Council (FSC), Helsinki, Finland.
IPCC (2006). "Good Practice Guidance for Land Use, Land-Use Change and Forestry," Rep. No. ISBN 4-88788-003-0. Institute for Global Environmental Strategies, Kanawaga,Japan.
Jackson, R. B., Canadell, J., Ehleringer, J. R., Mooney, H. A., Sala, O. E., and Schulze, E. D. (1996). A global analysis of root distributions for terrestrial biomes. Oecologia 108, 389-411.
Jansen, L. J. M., Bagnoli, M., and Focacci, M. (2008). Analysis of land-cover/use change dynamics in Manica Province in Mozambique in a period of transition (1990–2004). Forest Ecology and Management 254, 308-326.
45
Jew, E. K. K., Dougill, A. J., Sallu, S. M., O’Connell, J., and Benton, T. G. (2016). Miombo woodland under threat: Consequences for tree diversity and carbon storage. Forest Ecology and Management 361, 144-153.
Kachamba, D., Eid, T., and Gobakken, T. (2016). Above- and Belowground Biomass Models for Trees in the Miombo Woodlands of Malawi. Forests 7, 38.
Laclau, J.-P., da Silva, E. A., Rodrigues Lambais, G., Bernoux, M., le Maire, G., Stape, J. L., Bouillet, J.-P., Gonçalves, J. L. d. M., Jourdan, C., and Nouvellon, Y. (2013). Dynamics of soil exploration by fine roots down to a depth of 10 m throughout the entire rotation in Eucalyptus grandis plantations. Frontiers in Plant Science 4, 243.
Lehtonen, A., Palviainen, M., Ojanen, P., Kalliokoski, T., Nöjd, P., Kukkola, M., Penttilä, T., Mäkipää, R., Leppälammi-Kujansuu, J., and Helmisaari, H. S. (2016). Modelling fine root biomass of boreal tree stands using site and stand variables. Forest Ecology and Management 359, 361-369.
Levillain, J., Thongo M'Bou, A., Deleporte, P., Saint-André, L., and Jourdan, C. (2011). Is the simple auger coring method reliable for below-ground standing biomass estimation in Eucalyptus forest plantations? Annals of Botany 108, 221-230.
Li, D., Niu, S., and Luo, Y. (2012). Global patterns of the dynamics of soil carbon and nitrogen stocks following afforestation: a meta-analysis. New Phytologist 195, 172-181.
Lupala, Z. J., Lusambo, L. P., and Ngaga, Y. M. (2014). Management, Growth, and Carbon Storage in Miombo Woodlands of Tanzania. International Journal of Forestry Research 2014, 11.
Luyssaert, S., Inglima, I., Jung, M., Richardson, A. D., Reichstein, M., Papale, D., Pioa, S. L., Schulze, E.-D., Wingate, L., Matteucci, G., Aragao, L., Aubinet, M., Beer, C., Bernhofer, C., Bonnefond, J.-M., Chambers, J., Ciais, P., Cook, B., Davis, K. J., Dolman, A. J., Gielen, B., Goulden, M., Grace, J., Granier, A., Grelle, A., Griffis, T., Grünwald, T., Guidolotti, G., Hanson, P. J., Harding, R., Hollinger, D. Y., Hutyra, L. R., Kolari, P., Kruijt, B., Kutsch, W., Lagergen, F., Laurila, T., Law, B. E., Le Maire, G., Lindroth, A., Lousteau, D., Mahli, Y., Mateus, J., Miglivacca, M., Misson, L., Montagnani, L., Moncrieff, J., Moors, E., Munger, J. W., Nikinmaa, E., Ollinger, S. V., Pita, G., Rebmann, C., Roupsard, O., Saigusa, N., Sanz, M. J., Seufert, G., Sierra, C., Smith, M.-L., Tang, J., Valentini, R., Vesala, T., and Janssens, I. (2007). The CO2-balance of boreal, temperate and tropical forests derived from a global database. Global Change Biology 13.
Mainiero, R., and Kazda, M. (2006). Depth-related fine root dynamics of Fagus sylvatica during exceptional drought. Forest Ecology and Management 237, 135-142.
Malhi, Y., Baldocchi, D. D., and Jarvis, P. G. (1999). The carbon balance of tropical, temperate and boreal forests. Plant, Cell & Environment 22, 715-740.
46

Maússe-Sitoe, S. N. D., Chen, S., Wingfield, M. J., and Roux, J. (2016). Diseases of eucalypts in the central and northern provinces of Mozambique. Southern Forests: a Journal of Forest Science, 1-15.
McCormack, M. L., Dickie, I. A., Eissenstat, D. M., Fahey, T. J., Fernandez, C. W., Guo, D., Helmisaari, H.-S., Hobbie, E. A., Iversen, C. M., Jackson, R. B., Leppälammi-Kujansuu, J., Norby, R. J., Phillips, R. P., Pregitzer, K. S., Pritchard, S. G., Rewald, B., and Zadworny, M. (2015). Redefining fine roots improves understanding of below-ground contributions to terrestrial biosphere processes. New Phytologist 207, 505-518.
MINAG (2009). Estratégia para o Reflorestamento. (M. d. A. Direcção Nacional de Terras e Florestas, ed.), pp. 38, Maputo, Mozambique.
Mokany, K., Raison, R. J., and Prokushkin, A. S. (2006). Critical analysis of root : shoot ratios in terrestrial biomes. Global Change Biology 12, 84-96.
Moody, P. W., and Bolland, M. D. A. (1999). Phosphorus. In "Soil Analysis: An Interpretation Manual " (K. I. Peverill, L. A. Sparrow and D. J. Reuter, eds.), pp. 187–220. CSIRO Publishing, Melbourne, Australia.
Mugasha, W. A., Eid, T., Bollandsås, O. M., Malimbwi, R. E., Chamshama, S. A. O., Zahabu, E., and Katani, J. Z. (2013). Allometric models for prediction of above- and belowground biomass of trees in the miombo woodlands of Tanzania. Forest Ecology and Management 310, 87-101.
Mujuru, L., Gotora, T., Velthorst, E. J., Nyamangara, J., and Hoosbeek, M. R. (2014). Soil carbon and nitrogen sequestration over an age sequence of Pinus patula plantations in Zimbabwean Eastern Highlands. Forest Ecology and Management 313, 254-265.
Nhantumbo, I., and Salomão, A. (2010). "Biofuels, land access and rural livelihoods in Mozambique." IIED, London.
Paul, K. I., Polglase, P. J., Nyakuengama, J. G., and Khanna, P. K. (2002). Change in soil carbon following afforestation. Forest Ecology and Management 168, 241-257.
Peel, M. C., Finlayson, B. L., and McMahon, T. A. (2007). Updated world map of the Köppen-Geiger climate classification. Hydrol. Earth Syst. Sci. Discuss. 4, 439-473.
Pierre, K. J., Blumenthal, D. M., Brown, C. S., Klein, J. A., and Smith, M. D. (2016). Drivers of Variation in Aboveground Net Primary Productivity and Plant Community Composition Differ Across a Broad Precipitation Gradient. Ecosystems 19, 521-533.
Post, W. M., and Kwon, K. C. (2000). Soil carbon sequestration and land-use change: processes and potential. Global Change Biology 6, 317-327.
Raich, J. W., Clark, D. A., Schwendenmann, L., and Wood, T. E. (2014). Aboveground Tree Growth Varies with Belowground Carbon Allocation in a Tropical Rainforest Environment. PLoS ONE 9, e100275.
Rashidi, M., and Seilsepour, M. (2008). Modeling of soil total nitrogen based on soil organic carbon. ARPN Journal of Agricultural and Biological Science 4, 1-5.
RCoreTeam (2014). R: A language and environment for statistical computing. R Foundation for Statistical Computing. URL http://www.R-project.org/, Vienna, Austria.
47
Ryan, C. M., Williams, M., and Grace, J. (2011). Above- and Belowground Carbon Stocks in a Miombo Woodland Landscape of Mozambique. Biotropica 43, 423-432.
Sitoe, A., Salomão, A., and Wertz-Kanounnikoff, S. (2012). "O contexto de REDD+ em Moçambique: Causas, actores e instituições." Publicação Ocasional 76. CIFOR, Bogor, Indonesia.
Tavani, R., Saket, M., Piazza, M., Branthomme, A., and Altrell, D. (2009). "Case studies on measuring and assessing forest degradation: Measuring and monitoring forest degradation through national forest monitoring assessment (NFMA)." Forestry Department Food and Agriculture Organization of the United Nations. Forest Resources Assessment Working Paper 172.
Thompson, I. D., Guariguata, M. R., Okabe, K., Bahamondez, C., Nasi, R., Heymell, V., and Sabogal, C. (2013). An Operational Framework for Defining and Monitoring Forest Degradation. Ecology and Society 18.
Wang, L., Okin, G. S., Caylor, K. K., and Macko, S. A. (2009). Spatial heterogeneity and sources of soil carbon in southern African savannas. Geoderma 149, 402-408.
Westerhout, F., and Bovee, M. (1985). "Métodos de análise química e física em uso no INIA. Comunicação No 38. Série terra e água," Maputo, Mozambique.
Williams, M., Ryan, C. M., Rees, R. M., Sambane, E., Fernando, J., and Grace, J. (2008). Carbon sequestration and biodiversity of re-growing miombo woodlands in Mozambique. Forest Ecology and Management 254, 145-155.
Yang, X., Warren, M., and Zou, X. (2007). Fertilization responses of soil litter fauna and litter quantity, quality, and turnover in low and high elevation forests of Puerto Rico. Applied Soil Ecology 37, 63-71.
Zhang, Y., Xu, M., Chen, H., and Adams, J. (2009). Global pattern of NPP to GPP ratio derived from MODIS data: effects of ecosystem type, geographical location and climate. Global Ecology and Biogeography 18, 280-290.
Ågren, G. I., and Andersson, F. O. (2011). "Terrestrial Ecosystem Ecology," Cambridge University Press, New York, USA.
48

Acknowledgements I thank Bengt Olsson, the best Supervisor I could imagine, for their very valuable help and guidance during my thesis. I also thank my assistant Supervisors Erik Karltun, Almeida Sitoe, Gustaf Egnell and Riitta Hyvönen for their support during planning and execution of these studies.
To my fellow PhD colleagues- Emílio Magaia, Mário Chilundo, João Bila, Rosta Mate and Nícia Givá- for their moral support and sharing of ideas.
I would also like to thank Mary McAfee for the linguistic revision, which is gratefully acknowledged.
Finally, to my family! I wouldn’t be here without you. You are always there for me, helping and supporting me in any way possible. I can’t imagine how I would have done without you.
This work was financially supported by the Swedish International Development Agency (SIDA).
49
