impacts of film cooling parameters on … and blades from hot gas. ... stream mixing has a strong...
TRANSCRIPT

Proceedings of the 1st Global Power and Propulsion Forum GPPF 2017
Jan 16-18, 2014, Zurich, Switzerland www.pps.global
This work is licensed under a Creative Commons Attribution 4.0 International License Creative Commons Attribution-NonCommercial-NoDerivatives 4.0
International License
GPPF-2017- 127
IMPACTS OF FILM COOLING PARAMETERS ON AERODYNAMIC LOSS OF A COOLED TURBINE VANE
Xiao-Chun LIN Key Laboratory of Advanced Energy and
Power, Institute of Engineering Thermophysics, Chinese Academy of
Sciences School of Physics, University of Chinese
Academy of Sciences
Jian-Jun LIU Key Laboratory of Light-Duty Gas Turbine,
Institute of Engineering Thermophysics, Chinese Academy of Sciences
Email:[email protected] Beijing 100190,China
Email:[email protected] Beijing 100190,China
Chen LI Key Laboratory of Advanced Energy and
Power, Institute of Engineering Thermophysics, Chinese Academy of
Sciences
Jing-Lun FU Key Laboratory of Light-Duty Gas Turbine,
Institute of Engineering Thermophysics, Chinese Academy of Sciences
Beijing 100190,China Beijing 100190,China
ABSTRACT
This paper describes the experimental and numerical study on
aerodynamic loss due to coolant and main flow mixing for a
cooled turbine guide vane. The impacts of blowing ratio, hole
shape, injection location and multi-row injection on mixing
loss are investigated. Ideal isentropic mixing method is
introduced to quantize the aerodynamic loss caused by film
cooling. Measurements of total pressure loss due to the mixing
were performed for a linear cascade with various film cooling
configurations at different blowing ratios. Numerical
simulations were also performed to study the mixing flow
details. The results showed that aerodynamic loss increases
with the increase of blowing ratio. The change of loss
increment in the wake region near trailing edge is discussed
and the mechanism is exposed.
INTRODUCTION
Film cooling is an effective technology to protect turbine
vanes and blades from hot gas. The turbine metal temperature
is reduced by film cooling, at the penalty of aerodynamic loss
increment. Literature research shows that most of the
experimental and computational studies of film cooling focus
on increasing the adiabatic cooling effectiveness. For modern
gas turbines, full coverage film cooling is commonly applied.
Therefore, the additional loss due to the coolant and main
stream mixing has a strong impact on the turbine aerodynamic
efficiency. In the design stage of a modern gas turbine, not
only the film cooling effectiveness should be considered, but
also the aerodynamic mixing loss should be taken into
account. Previous study of Ito et al.[1] found that the
introduction of film cooling on turbine blade and vane surface
will change the loss, and then influence the aerodynamic
performance of the cascades. Hong et al. [2] performed
experiments to study the effects of coolant injection on
secondary flows. The experimental results showed that the
coolant injection from the rear of the suction surface causes
more energy loss compared with other locations. Haller et al.
[3] studied the effects of coolant injection on the loss of vane
cascade. The experiments showed that the aerodynamic
mixing loss varies with the locations of film holes, and mixing
loss is increased with the increase of blowing ratio. Day et al.
[4] performed experiments on the aerodynamic loss of a
turbine guide vane. The injection location, number of film
hole rows and film hole shape proved to be influential on the
aerodynamic loss. The fan-shaped holes cause generally
higher mixing loss than cylindrical holes. Walters and Leylek
[5] performed numerical simulations on a linear turbine airfoil
cascade to study the impact of film-cooling injection on
aerodynamic loss. They separated the increase in profile loss
by coolant injection into two sources, the mixing loss is the
main reason for loss increase at lower blowing ratio, while the
wall loss changes by film cooling becomes significant at
higher blowing ratio. Chappell [6] investigated the
performance of suction-side gill region film cooling.

2
Experimental results showed that the shaped holes always
cause more loss than cylindrical holes. The aerodynamic
losses at trailing edge are caused by the changes of boundary
layer thickness, which result from film cooling. The similar
conclusion can be found in [7] and [8]. Gomes et al. [9] studied
the flow separation caused by film cooling on suction surface.
It is found that the flow separation appearing at low Reynolds
number can be restrained by the coolant injection and the total
aerodynamic loss can be reduced as a result. The effects of
endwall film cooling [10,11] and trailing-edge slot [12,13]
have been studied as well. The hole shapes, blowing ratio,
injection location and other parameters of the coolant injection
can influence the secondary flow structure. As a result, the
aerodynamic loss is enlarged or even reduced.
In order to study the aerodynamic mixing loss caused by
film cooling, a mixing loss evaluation method should be set
up. Most of the studies [1,2,5~7,10] picked the total pressure
loss coefficient as the quantization standard. Besides,
thermodynamic efficiency [3], integrated aerodynamic losses
[6,7] and entropy creation [8] were used as well.
Most of previous studies focused on the effects of one or
two parameters on aerodynamic loss. In this paper, both
experimental and numerical methods will be employed to
study the impacts of blowing ratio, hole shape, injection
location and multi row injection on mixing loss. A new
rational method is put forward to evaluate the aerodynamic
loss of a guide vane with film cooling. Both phenomenon and
mechanism will be discussed. After this introduction,
experimental and numerical methods, validation and main
results are presented.
Experimental Facilities and Technique
Wind Tunnel and Film-Cooling Injection System. The
present experiments were conducted in an open-cycle, low-
speed continuously tunnel rig. Facilities are illustrated in
Figure 1. The mainstream is provided by a 55kW radial-flow
blower. The max pressure head of the blower is up to 8515Pa
and the max mass flow rate is up to 4.5kg/s. After the blower
are the transition section, settling section, contraction section
and test section of linear cascade. The mainstream is
accelerated in the contraction section to 15m/s, with a
turbulence intensity of 3.5%, measured by hot wire
anemometer.
Figure 1 Experimental facilities
The inlet size of the test section is 600mm*125mm. Four
vanes are placed 250mm downstream from the inlet,
numbered from 1 to 4, see Figure 2a. Vane 1 and Vane 4 are
made of metal, Vane 2 and Vane 3 are 3D printed resin vanes
with film cooling structures. The middle three passages are
adjusted to be periodic by two guide plates placed after vane
1 and vane 4. Probe slot is placed 38mm downstream the vane
trailing edge for the total pressure measurement. The coolant
is provided by the film-cooling injection system, which is
composed of an air compressor, air reservoir, electromagnetic
flowmeters and valves. Coolant pressure is maintained up to
0.8MPa by air reservoir, and decompressed by the valve to fit
the required blowing ratio. Temperature, density ratio and
other operating conditions are summarized in Table1.
Table 1 Test rig operating conditions
Main flow
Temperature Tt,m 314K
Pressure Pt,m ≈2kPa
Velocity um 15m/s
Turbulence level Tu 3.5%
Coolant
Temperature Tt,c 300K
Pressure Pt,c <35kPa
Density ratio DR 1.05
Blowing ratio BR 0.5-2.0
Vane Profile and Hole Geometry. The vane profile
models the mid-span section of a turbine nozzle guide vane in
a heavy duty gas turbine. The span height, axial chord and
pitch of the vane blade are 125mm, 94.1mm and 150.4mm,
respectively. The vane inlet angle is 0° and the outlet angle is
74.2°. In the present study, 6 typical locations of cooling holes
on suction and pressure surface are considered. Film cooling
holes are located at three different locations for both pressure
surface (PS1, PS2, PS3) and suction surface (SS1, SS2, PS3),
the relative positions are listed in Table 2, expressed as a
percentage of axial chord length. The location of the throat has
been marked as well, see Figure 2b. For the convenience of
internal structural design, SS1, SS3, PS1 and PS3 are set in
one vane, SS2 and PS2 are set in another. Figure 2c shows a
side view of the vane. For each row of holes, a separate coolant
inlet is designed to control coolant mass flow rate individually.
Table 2 Relative positions of film cooling holes
Location SS1 SS2 SS3 PS1 PS2 PS3
Percentage of
Axial Chord 17.1 53.0 63.8 13.3 34.2 51.5
a. vane locations b. hole locations

3
c. side view of the vane
Figure 2 Test section
Four different hole shapes are employed in the present
study, the cylindrical hole (CH), the fan-shaped hole (FSH),
the laidback fan-shaped hole (LFSH) and the double jet hole
(DJH). The characteristic diameter of holes is D=1.6mm. The
length of the hole is L=5D and hole pitch is p=5D. For FSH
and LFSH, see Figure 3, the length of the cylindrical inlet
portion is l=2D. is the angle of hole inclination, 30
is invariant for all shapes. 1 14 is the lateral diffusion
angle for FSH and LFSH. 2 8 is the forward diffusion
angle for LFSH. FSH has no forward diffusion angle, which
is the only difference between FSH and LFSH. For DJH, the
compound angle is 30 .
Figure 3 Geometry parameters of FSH and LFSH
Measurements of Aerodynamic Mixing loss. Total
pressure measurements are carried out at the location of probe
slot after the trailing edge, using a five-hole probe fixed on a
shifting axes frame. The total pressure distributions of the
measure plane are obtained automatically. Meanwhile the
main flow total pressure, static pressure and the coolant total
pressure are measured respectively. The control and
acquisition system are constructed on NI PXI platform.
For an uncooled vane, the aerodynamic loss can be
evaluated with total pressure loss coefficient (TPLC), defined
as,
, ,
,
t in t out
t in out
P PTPLC
P P
(1)
Where ,t inP is the inlet total pressure of main flow, outP
and ,t outP are respectively the static pressure and total
pressure at the outlet plane. For the film cooled vane, ,t inP
should be modified to account for the effect of coolant total
pressure. The mass flow averaged (MFA) method is
commonly used, which defined as
, ,, ,
m t m c t ct in MFA
cm
m P m PP
m m
(2)
Where mm and ,t mP are the mass flow rates and the
total pressure of the main stream.
An ideal isentropic mixing (IIM) method is proposed in
this paper to modify ,t inP . We assume that the main flow and
the coolant have reached a mixed state (before the real
mixing). Constraint condition is that the entropy of the mixed
flow keeps unchanged. By means of this assumption, the
suppositional mixing process doesn’t cause any other
aerodynamic loss. And the total pressure of the mixed state is
equivalent to the summation of main flow and coolant, in
terms of aerodynamic loss. The averaged total pressure by IIM
method can be expressed as:
1
( ) ( ), ,
( ) ( 1) 1
( ) ( )c c m c c m
γ
γm c c m c m
m m m m m mm c c
t in II
m
M
P m m m T TP
P P T T
(3)
The rationality of the IIM method will be discussed
thereinafter.
Parameter Definition and Test Case Configurations.
Define the blowing ratio as:
(
/
)
c
m
cm ABR
V (4)
The metering area cA is the cross-section of the initial
cylindrical hole portion:
2
4cA D
(5)
Test blowing ratio is selected from 0.5 to 2.0, which
contained most of the real cooling conditions. For DJH, BR is
from 0.25 to 1.0, due to the limitation of coolant supply. When
a single row is selected to test, the coolant supply for other
rows is cut off and the holes are blocked as well to reduce the
interference. A full test matrix of 96 different single row
cooling configurations is created and each of them has been
tested, as well as the uncooled condition (NH). For the
convenience of memory and use, each case has a short name,
e.g. a test case of fan shaped hole at the second hole row on
suction surface with BR=1.0 can be shorten as SS2FSH1.0.
The results are analysed with control variate method, in order
to investigate the influence of different blowing ratio, different
hole shape and different hole location on aerodynamic mixing
loss.
Two-row CH film cooling cases are tested as well. The
results are compared with single row film cooling, in order to
obtain the loss correlation between multi-row and single-row
injection.
Measurement Uncertainty. The uncertainties were
estimated using error propagation analysis:

4
1
1
( ), ...,n
ni
ii
f x xy x
x
(6)
For the blowing ratio, the uncertainty is primarily dependent
on the coolant mass flow rate and main flow velocity
uncertainty (±0.5m/s). According to the precision of the
electromagnetic flowmeter (±0.5% of full scale range), the
maximum possible variation of blowing ratio is estimated to
be 4%. The uncertainties in the flowmeter, the pressure
transducer (±0.05% of the full scale range), the thermocouple
(±0.5ºC) and the five-hole probe calibration (1% for total
pressure and 0.08% for static pressure) are applied to calculate
the uncertainty of TPLC, which is estimated to be 10% in the
worst-case scenario.
Numerical Method
Geometry and Grid. The geometries used for CFD are the
same as experimental vanes. Computational domain contains
three regions, the main flow region, the film-cooling hole and
the coolant plenum, as shown in Figure 4a. To reduce the
consumption of computational resources, only one vane and
one passage are adopted. Periodic conditions were used on the
two sides of the main flow passage to simulate the
experimental condition with multi-rows of vanes.
Unstructured grids were generated by using ICEM CFD. The
first layer height near the wall was 0.01 mm and the growth
ratio was 1.2. Thus, Y+<1 was obtained for all solid walls. The
grids are refined locally in the cooling hole to improve the
local grid quality. For the vane with two plenums (SS2 and
PS2) the grid contains 12,150,000 cells, if double the plenum
number (SS1, SS3, PS1 and PS3), the grid contains
17,810,000 cells. Figure 4b shows the grid details of double
jet film holes.
a. computational domain b. grid details
Figure 4
Boundary Conditions and Solver. Boundary conditions
are chosen to match the experimental test cases as closely as
possible. As mentioned above, periodic conditions are applied
between the vanes in order to model an infinite linear cascade.
CFD simulations are conducted with Ansys CFX. The
solver is based on finite volume method, and is second order
accurate. SST turbulence model with scaled wall function is
employed for RANS calculation. It can provide highly
accurate prediction of the separation under adverse pressure
gradients, which are common in the boundary layer and in the
cooling hole. Several studies [14-16] showed that the SST
turbulence model is suitable for the film cooling calculations.
Convergence to a steady state is reached only if the
overall residuals of the primary variables are less than 1e-4
and the variables of monitor points are kept unchanged for
enough iteration steps.
Validation. A validation simulation is performed for the
uncooled vane and then compared with the present experiment
result. Pressure coeffient can reflect the vane load features, as
shown in Figure 5. Horizontal ordinate x/Cx is the
dimensionless axial chord length, negtive for PS, 0 for the
leading edge and positive for SS. The numerical result is very
close to the experimental results of Vane2 and Vane3, which
means that the numerical method employed in this paper is
feasible and reliable.The experimental results of Vane2 and
Vane3 agree with each other at most positions. Only slight
divergence is observed after x/Cx >0.6. It can be stated that,
the experimental passages have a good periodicity.
Figure 5 Pressure coefficient of the validation result
Experimental Results
Rationality of the IIM Method. The suppositional ideal
isentropic mixing method mentioned above is compared with
traditional mass flow average method, in terms of TPLC
calculation. Theoretically, this IIM avoided the uncertain loss
occurred in mass flow averaging which is not considered yet.
In addition, this method considered the influence of
temperature difference between the main flow and coolant.
For a real gas turbine, the temperature difference can be more
than 1000K, which will cause a great disparity between these
two average method.
Specific to the present experimental results, TPLC of each
test conditions are calculated with these two averaging
method. Figure 6 shows the disparities of these two methods
(TPLCMFA – TPLCIIM) with horizontal ordinate sorted by
TPLC. For lower mixing loss test cases(TPLC<0.08),
TPLCMFA almost equals to TPLCIIM. For higher mixing loss
test cases (after TPLC>0.08), positive disparities appear and
become more obvious with the increase of TPLC. That means
the ,t aveP given by MFA is higher than that given by an ideal
isentropic process, which is obviously improper. The highest
disparity of 0.02 appears at TPLCMFA=0.22.
The present experiments are conducted at normal
atmospheric temperature with only 14K temperature

5
difference. If the temperature difference increased up to
1000K, the disparities will increase enormously. Therefor the
MFA method should be eliminated and replaced with IIM
method. All results have been processed with IIM method in
the following parts.
Figure 6 Disparities of MFA and IIM methods
Aerodynamic Mixing loss. The TPLC distributions on the
measurement plane are obtained with the help of an automatic
measure system, as shown in Figure 7. The horizontal ordinate
donates the pitch direction of the vane, and the vertical
ordinate denotes the span wise direction of the vane. For the
uncooled condition(NH), good periodicity can be observed in
pitch direction, which means the vane configuration in the test
section is rational.
The left wake region is from the cooled Vane 3 and the
right wake is from the reference uncooled Vane 2. High TPLC
districts appear at the wake region of the vanes. The highest
TPLC arisen at z=2cm and z=8cm is caused by the passage
vortex, which is mainly determined by vane profile. It is
worthwhile to note that, the TPLCs of the cooled vane
decreases at higher blow ratios. In a sense, it can be stated that
the film cooling with high blowing ratios will decrease the loss
of the wake region, by raising the local total pressure. This
phenomenon appears at local analysis may result in an
incorrect conclusion, especially the total pressure of the
coolant is not taken into account of TPLC, which can be found
in [2]. In order to benchmark the actual aerodynamic mixing
loss caused by film cooling, the TPLCs are averaged in the
mid span clip (z ranges from 4cm to 6cm) for an entire passage
(y ranges from 4cm to 18cm).
Figure 7 TPLC distributions on the measurement plane
Effect of Blowing Ratio. Blowing Ratio is a parameter to
describe the cooling condition and the coolant injection
behaviour. For a cylindrical hole, the coolant injected at low
blowing ratio will stay attached to the vane surface and form

6
an effective film. At high blowing ratio the coolant will be
blown away from the vane surface, and the metal will be
exposed to hot gas temperature. Some diffuser film cooling
holes have proved to be more effective at higher blowing
ratios, such as FSH and LFSH [17]. As BR increasing, more
coolant will be injected into the main flow, with the mixing
loss increment as well. Thus, the experimental results of CH
and LFSH are selected to analyse the effect of blowing ratio
on aerodynamic mixing loss.
Averaged TPLCs of CH and LFSH on suction surface are
compared for BR=0.5 to 2.0, see Figure 8. The uncooled vane
is selected as a reference. From BR=0 to BR=2.0, TPLC
increases continuously at each inject location as BR increases.
The loss increment can be separated into two parts, the extra
aerodynamic loss caused by the mixing process and the
internal separation loss generated in the film holes. Due to the
incline of the hole, separation appears near the hole inlet,
which is related to the inner-hole velocity of the coolant. In a
narrow sense, the inner-hole loss cannot be considered as part
of mixing loss. However, the measurement of inner-hole loss
will be difficult. As a matter of convenience, the inner-hole
loss will be treated as part of the mixing loss, not be discussed
solely. The TPLC increments at SS3 are higher than other
location, especially for LFSH. It means the film cooling
mixing loss at SS3 is more sensitive to blowing ratio. Diffuser
shaped holes that gain the best effectiveness at high BR should
be carefully considered to place at SS3 in order to avoid high
aerodynamic losses.
Figure 8 TPLCs of CH and LFSH on suction surface.
On the pressure surface, see Figure 9, there are also
increasing trends for TPLCs, though the increment is not as
obvious as on the suction surface. There is an exception at
PS1, the TPLC seems to be self-limited at higher BR. In other
words, the mixing loss at PS1 is not sensitive to blowing ratio,
which is an advantage to place diffuser shaped holes.
Effect of Hole Location. The cooling holes are scattered
on both suction and pressure surface. Thus, the influence of
the coolant injection to main flow may differ at each location.
Figure 10 shows the averaged TPLCs of CH on various hole
locations. The uncooled vane (NH, BR=0) is selected as the
reference. TPLCs on the suction surface are much higher than
those on the pressure surface. That is because the blowing
ratio is based on the local main flow velocity. Due to the vane
profile, the local main flow velocity near SS2 is more than
eight times of the velocity near PS1. It needs more coolant for
SS2 to obtain the same blowing ratio, compared with other
locations. The more coolant, the more mixing loss. Therefore,
TPLC on SS2 is the highest at most test conditions.
Figure 9 TPLCs of CH and LFSH on pressure surface.
Figure 10 The influence of injection locations on TPLC of
CH
At the trailing edge, the low velocity boundary layer will
be sucked into the trailing wake, aerodynamic loss increases
sharply after the trailing wake, see Figure 11. With the help of
CFD simulation, the linear averaged TPLC is illustrated from
the leading to the measurement plane, with clear marks of the
injection location as well as the trailing wake region. For the
uncooled vane, the loss increment in the trailing wake is
impressive. About one third of the total loss is generated in
this region. The numerical result under predicted the
aerodynamic loss of the film cooling on pressure surface,
which is very close to the uncooled vane. For SS film cooling,
the loss is generated at both the injection location and the
trailing wake. It is important to note that, the gradient of TPLC
in the trailing wake region decreases obviously, especially for
SS2CH2.0. According to previous studies [6-8], the loss

7
variety is the result of the change boundary layer thickness,
caused by coolant injection. Figure 12 shows that the
boundary layer on the suction surface is interrupted by the
injection at SS2. After the injection, the boundary layer begins
to redevelop again.
Figure 11 Linear averaged TPLC of CH at BR=2.0
Figure 12 Boundary layer changed by coolant injection
Effect of Hole Geometry. Bunker’s study [17] showed
that, hole shapes have great influence for film cooling
effectiveness. They listed 30 different hole shape with cooling
effectiveness, manufacturing cost, repairing difficulty and
other measure items. The LFSH gained the highest scores and
is ranked as one of Top 3 hole shapes. However, the
aerodynamic mixing loss is not included in the ranking. The
present study shows that, LFSH will cause the highest
aerodynamic loss at any cooling condition on suction surface,
see Figure 13.
The loss of injection at SS2 is higher than that at SS3 for
CH and FSH, which is mainly because that the loss is
determined by the location factor. For LFSH and DJFH, the
loss of injection at SS3 is higher than that at SS2. It can be
explained that, the geometry factor becomes determination for
loss increment. In other words, the hole shape and hole
location are in the same order in impacting the aerodynamic
loss, especially at high blowing ratio. An elaborative
arrangement of the hole shape and injection location will
improve the cooling effect and reduce aerodynamic loss at the
same time.
Figure 13 The influence of hole shapes on TPLC
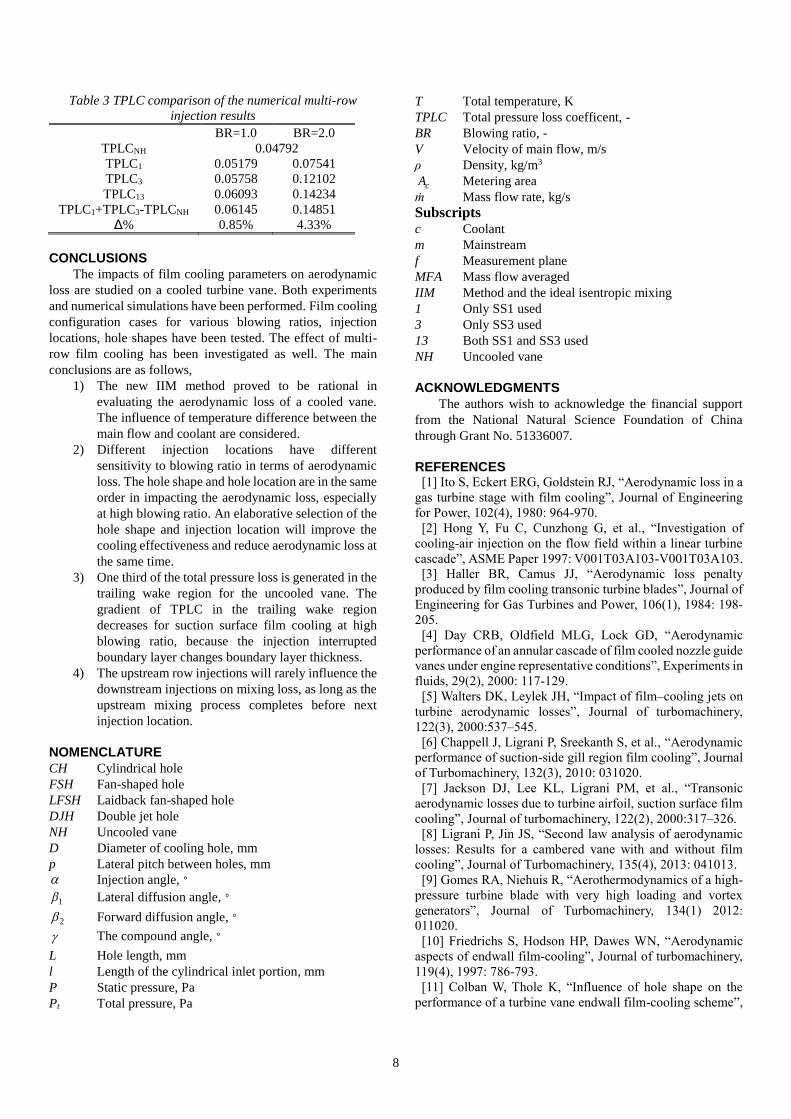
Effect of Multi Rows Cooling. When multi rows of holes
applied, the cooling effectiveness has been proved to be
additive [18]. As the aerodynamic loss is mainly investigated
in this paper, we wish to find a loss correlation for multi-row
film cooling. Figure 14 shows the TPLCs when SS1 and SS3,
or PS1 and PS3 are used synchronously. The loss of two-row
film cooling TPLC13 is higher than single hole film cooling
(TPLC1 or TPLC3) at any condition. Considering each TPLC
contains the common vane profile loss TPLCNH, TPLC13 will
be compared with the actual sum (TPLC1+TPLC3-TPLCNH).
The multi-row mixing loss TPLC13 is slightly higher than the
sum of two single row losses. A comparison of numerical
result is made, as shown in Table 3. The relative error is less
than 5% for the highest blowing ratio. That is to say, the
upstream row injections will rarely influence the downstream
injections on mixing loss, as long as the upstream mixing
process completes before the next injection location.
Fig14 The influence of multi-row injection on TPLC
8
Table 3 TPLC comparison of the numerical multi-row
injection results
BR=1.0 BR=2.0
TPLCNH 0.04792
TPLC1 0.05179 0.07541
TPLC3 0.05758 0.12102
TPLC13 0.06093 0.14234
TPLC1+TPLC3-TPLCNH 0.06145 0.14851
Δ% 0.85% 4.33%
CONCLUSIONS
The impacts of film cooling parameters on aerodynamic
loss are studied on a cooled turbine vane. Both experiments
and numerical simulations have been performed. Film cooling
configuration cases for various blowing ratios, injection
locations, hole shapes have been tested. The effect of multi-
row film cooling has been investigated as well. The main
conclusions are as follows,
1) The new IIM method proved to be rational in
evaluating the aerodynamic loss of a cooled vane.
The influence of temperature difference between the
main flow and coolant are considered.
2) Different injection locations have different
sensitivity to blowing ratio in terms of aerodynamic
loss. The hole shape and hole location are in the same
order in impacting the aerodynamic loss, especially
at high blowing ratio. An elaborative selection of the
hole shape and injection location will improve the
cooling effectiveness and reduce aerodynamic loss at
the same time.
3) One third of the total pressure loss is generated in the
trailing wake region for the uncooled vane. The
gradient of TPLC in the trailing wake region
decreases for suction surface film cooling at high
blowing ratio, because the injection interrupted
boundary layer changes boundary layer thickness.
4) The upstream row injections will rarely influence the
downstream injections on mixing loss, as long as the
upstream mixing process completes before next
injection location.
NOMENCLATURE
CH Cylindrical hole
FSH Fan-shaped hole
LFSH Laidback fan-shaped hole
DJH Double jet hole
NH Uncooled vane
D Diameter of cooling hole, mm
p Lateral pitch between holes, mm
Injection angle, °
1 Lateral diffusion angle, °
2 Forward diffusion angle, °
The compound angle, °
L Hole length, mm
l Length of the cylindrical inlet portion, mm
P Static pressure, Pa
Pt Total pressure, Pa
T Total temperature, K
TPLC Total pressure loss coefficent, -
BR Blowing ratio, -
V Velocity of main flow, m/s
ρ Density, kg/m3
cA Metering area
ṁ Mass flow rate, kg/s
Subscripts c Coolant
m Mainstream
f Measurement plane
MFA Mass flow averaged
IIM Method and the ideal isentropic mixing
1 Only SS1 used
3 Only SS3 used
13 Both SS1 and SS3 used
NH Uncooled vane
ACKNOWLEDGMENTS
The authors wish to acknowledge the financial support
from the National Natural Science Foundation of China
through Grant No. 51336007.
REFERENCES [1] Ito S, Eckert ERG, Goldstein RJ, “Aerodynamic loss in a
gas turbine stage with film cooling”, Journal of Engineering
for Power, 102(4), 1980: 964-970.
[2] Hong Y, Fu C, Cunzhong G, et al., “Investigation of
cooling-air injection on the flow field within a linear turbine
cascade”, ASME Paper 1997: V001T03A103-V001T03A103.
[3] Haller BR, Camus JJ, “Aerodynamic loss penalty
produced by film cooling transonic turbine blades”, Journal of
Engineering for Gas Turbines and Power, 106(1), 1984: 198-
205.
[4] Day CRB, Oldfield MLG, Lock GD, “Aerodynamic
performance of an annular cascade of film cooled nozzle guide
vanes under engine representative conditions”, Experiments in
fluids, 29(2), 2000: 117-129.
[5] Walters DK, Leylek JH, “Impact of film–cooling jets on
turbine aerodynamic losses”, Journal of turbomachinery,
122(3), 2000:537–545.
[6] Chappell J, Ligrani P, Sreekanth S, et al., “Aerodynamic
performance of suction-side gill region film cooling”, Journal
of Turbomachinery, 132(3), 2010: 031020.
[7] Jackson DJ, Lee KL, Ligrani PM, et al., “Transonic
aerodynamic losses due to turbine airfoil, suction surface film
cooling”, Journal of turbomachinery, 122(2), 2000:317–326.
[8] Ligrani P, Jin JS, “Second law analysis of aerodynamic
losses: Results for a cambered vane with and without film
cooling”, Journal of Turbomachinery, 135(4), 2013: 041013.
[9] Gomes RA, Niehuis R, “Aerothermodynamics of a high-
pressure turbine blade with very high loading and vortex
generators”, Journal of Turbomachinery, 134(1) 2012:
011020.
[10] Friedrichs S, Hodson HP, Dawes WN, “Aerodynamic
aspects of endwall film-cooling”, Journal of turbomachinery,
119(4), 1997: 786-793.
[11] Colban W, Thole K, “Influence of hole shape on the
performance of a turbine vane endwall film-cooling scheme”,

9
International journal of heat and fluid flow, 28(3), 2007: 341-
356.
[12] Rehder HJ, “Investigation of trailing edge cooling
concepts in a high pressure turbine cascade: Aerodynamic
experiments and loss analysis”, ASME Journal of
Turbomachinery, 134(5), 2012: 051029.
[13] Schobeiri MT, Pappu K, “Optimization of trailing edge
ejection mixing losses: A theoretical and experimental study”,
Journal of fluids engineering, 121(1), 1999: 118-125.
[14] Rezasoltani M, Lu K, Schobeiri MT, and Han JC, “A
combined experimental and numerical study of the turbine
blade tip film cooling effectiveness under rotation condition”,
ASME J. Turbomach., 137(5), 2015, pp 051009.
[15] Abdelfattah SA, and Schobeiri, MT, “Experimental and
numerical investigations of aerodynamic behavior of a three-
stage hp-turbine at different operating conditions”, Journal of
Mechanical Engineering Science, 226(6), 2012, 1535-1549.
[16] Liao G, Wang X, Li J, et al, “Effects of curvature on the
film cooling effectiveness of double-jet film cooling”, ASME
Paper No. GT2014- 26263.
[17] Bunker RS, “Film cooling: breaking the limits of
diffusion shaped holes”, Heat Transfer Research, 41(6), 2010,
627-650.
[18] Han JC, Dutta S, Ekkad S, “Gas turbine Heat Transfer
and Cooling Technology”, New York: Taylor & Francis, 2000.