impacts of federal tax credit extensions on renewable ... · impacts of federal tax credit...
TRANSCRIPT
NREL is a national laboratory of the U.S. Department of Energy Office of Energy Efficiency & Renewable Energy Operated by the Alliance for Sustainable Energy, LLC
This report is available at no cost from the National Renewable Energy Laboratory (NREL) at www.nrel.gov/publications.
Contract No. DE-AC36-08GO28308
Impacts of Federal Tax Credit Extensions on Renewable Deployment and Power Sector Emissions Trieu Mai, Wesley Cole, Eric Lantz, Cara Marcy, and Benjamin Sigrin National Renewable Energy Laboratory
Technical Report NREL/TP-6A20-65571 February 2016

NREL is a national laboratory of the U.S. Department of Energy Office of Energy Efficiency & Renewable Energy Operated by the Alliance for Sustainable Energy, LLC
This report is available at no cost from the National Renewable Energy Laboratory (NREL) at www.nrel.gov/publications.
Contract No. DE-AC36-08GO28308
National Renewable Energy Laboratory 15013 Denver West Parkway Golden, CO 80401 303-275-3000 • www.nrel.gov
Impacts of Federal Tax Credit Extensions on Renewable Deployment and Power Sector Emissions Trieu Mai, Wesley Cole, Eric Lantz, Cara Marcy, and Benjamin Sigrin National Renewable Energy Laboratory
Prepared under Task Nos. SA15.1013, SA15.0710, ST6B.0111, and WE14.CF03
Technical Report NREL/TP-6A20-65571 February 2016

NOTICE
This report was prepared as an account of work sponsored by an agency of the United States government. Neither the United States government nor any agency thereof, nor any of their employees, makes any warranty, express or implied, or assumes any legal liability or responsibility for the accuracy, completeness, or usefulness of any information, apparatus, product, or process disclosed, or represents that its use would not infringe privately owned rights. Reference herein to any specific commercial product, process, or service by trade name, trademark, manufacturer, or otherwise does not necessarily constitute or imply its endorsement, recommendation, or favoring by the United States government or any agency thereof. The views and opinions of authors expressed herein do not necessarily state or reflect those of the United States government or any agency thereof.
This report is available at no cost from the National Renewable Energy Laboratory (NREL) at www.nrel.gov/publications.
Available electronically at SciTech Connect http:/www.osti.gov/scitech
Available for a processing fee to U.S. Department of Energy and its contractors, in paper, from:
U.S. Department of Energy Office of Scientific and Technical Information P.O. Box 62 Oak Ridge, TN 37831-0062 OSTI http://www.osti.gov Phone: 865.576.8401 Fax: 865.576.5728 Email: [email protected]
Available for sale to the public, in paper, from:
U.S. Department of Commerce National Technical Information Service 5301 Shawnee Road Alexandria, VA 22312 NTIS http://www.ntis.gov Phone: 800.553.6847 or 703.605.6000 Fax: 703.605.6900 Email: [email protected]
Cover Photos by Dennis Schroeder: (left to right) NREL 26173, NREL 18302, NREL 19758, NREL 29642, NREL 19795.
NREL prints on paper that contains recycled content.

iii This report is available at no cost from the National Renewable Energy Laboratory at www.nrel.gov/publications.
Acknowledgments We would like to thank the following individuals for their thoughtful reviews, comments, and suggestions: Jeffrey Logan, David Mooney, Robin Newmark, Gian Porro, and Daniel Steinberg of the National Renewable Energy Laboratory; Mark Bolinger and Ryan Wiser of the Lawrence Berkeley National Laboratory; Ben Paulos of PaulosAnalysis; John Larsen and Whitney Herndon of the Rhodium Group; Chris Namovicz of the U.S. Department of Energy’s (DOE’s) Energy Information Administration; Carla Frisch and Judi Greenwald of DOE’s Office of Energy Policy and Systems Analysis; Rich Tusing of Allegheny Science and Technology (senior advisor to DOE’s Wind and Water Power Technologies Office); and Steve Capanna, Paul Donohoo-Vallett, Margaret Schaus, and Paul Spitsen of DOE’s Office of Energy Efficiency and Renewable Energy. We also wish to thank Changgui Dong, Kelly Eurek, and Michael Gleason of NREL for their model development contributions and analysis support; and Mike Meshek and Scott Gossett of NREL for editorial support. Finally, we would like to thank DOE’s Office of Energy Efficiency and Renewable Energy’s Strategic Programs Office, Solar Energy Technologies Office, and Wind and Water Power Technologies Office for primary funding support for this analysis. In particular, we are grateful to Steve Capanna, Lidija Sekaric, and Jose Zayas (DOE) for their support of this study. This research was funded by the U.S. Department of Energy under contract number DE-AC36-08GO28308. Any errors or omissions are the sole responsibility of the authors.

iv This report is available at no cost from the National Renewable Energy Laboratory at www.nrel.gov/publications.
Executive Summary Federal tax credits for renewable energy (RE) have served as one of the primary financial incentives for RE deployment over the last two decades in the United States. In December 2015, RE tax credits, including the wind power production tax credit and solar investment tax credits, were extended as part of the Consolidated Appropriations Act of 2016. The act extended the solar and wind tax credit deadlines by five years from their prior scheduled expiration dates, but included ramp downs in tax credit value during the latter years of the five-year period. This report explores two specific questions: (1) How might RE deployment in the contiguous United States change with these recent federal tax credit extensions? (2) How might this change in RE deployment impact carbon dioxide (CO2) emissions in the power sector?
We use a scenario analysis approach to estimate the impacts of the tax credit extensions under two distinct natural gas price futures.1 Under both sets of natural gas assumptions, we find that scenarios with RE tax credit extensions show greater renewable technology investments through the early 2020s than scenarios without extensions (Figure ES1). In all scenarios, nearly all of the estimated growth in RE capacity is primarily comprised of new solar and wind capacity. Scenarios with tax credit extensions also show lower CO2 emissions from the U.S. electricity system (Figure ES2).
Impacts to Renewable Energy Deployment Under base natural gas price assumptions shown in Figure ES1, the scenario with tax credit extensions (solid red line) results in a higher rate of renewable capacity additions through the early 2020s compared with the scenario without tax credit extensions (dotted red line) and compared with recent historical rates during 2010–2014 (black line). Incremental RE capacity driven by the tax credit extension—defined as the RE capacity differences between the extension and no-extension scenarios—is estimated to peak at 53 GW in 2020. By the mid-2020s, other drivers (most notably assumed reductions in the costs of RE generation technologies and assumed rising fossil fuel costs, coupled with the Environmental Protection Agency’s Clean Power Plan [CPP]2) propel continued growth in cumulative RE capacity through 2030 under both extension and no-extension scenarios. During this period, these drivers have a greater impact to RE deployment in the scenario without tax credit extensions; the scenario with extensions is not found to result in significantly greater cumulative RE deployment in the long run (by 2030). These results suggest that RE tax credit extensions can accelerate renewable deployment through the early 2020s, thereby helping avoid what otherwise might be a near-term decrease in the rate of RE development compared to recent years; but the impacts of tax credit extensions to cumulative installed RE capacity are noticeably less significant by 2030 under base natural gas price assumptions.
1 This analysis uses two natural gas price scenarios. The “base natural gas prices” scenario (or Base Gas Price) is based on the EIA Annual Energy Outlook 2015 Reference case. The “lower natural gas prices” scenario (or Low Gas Price) is based on the EIA Annual Energy Outlook 2015 High Oil & Gas Resource case. 2 The analysis, conducted in January and February 2016, is designed to evaluate impacts of the tax credits based on policies as of January 1, 2016 only. While the U.S. Supreme Court issued a stay for the CPP on February 9, 2016, the rule was not overturned and is thus included in all scenarios in our analysis. This report includes modeling of a single simplifying representation of the CPP and does not assess the tax credit extension impacts across a range of different CPP compliance scenarios.
v This report is available at no cost from the National Renewable Energy Laboratory at www.nrel.gov/publications.
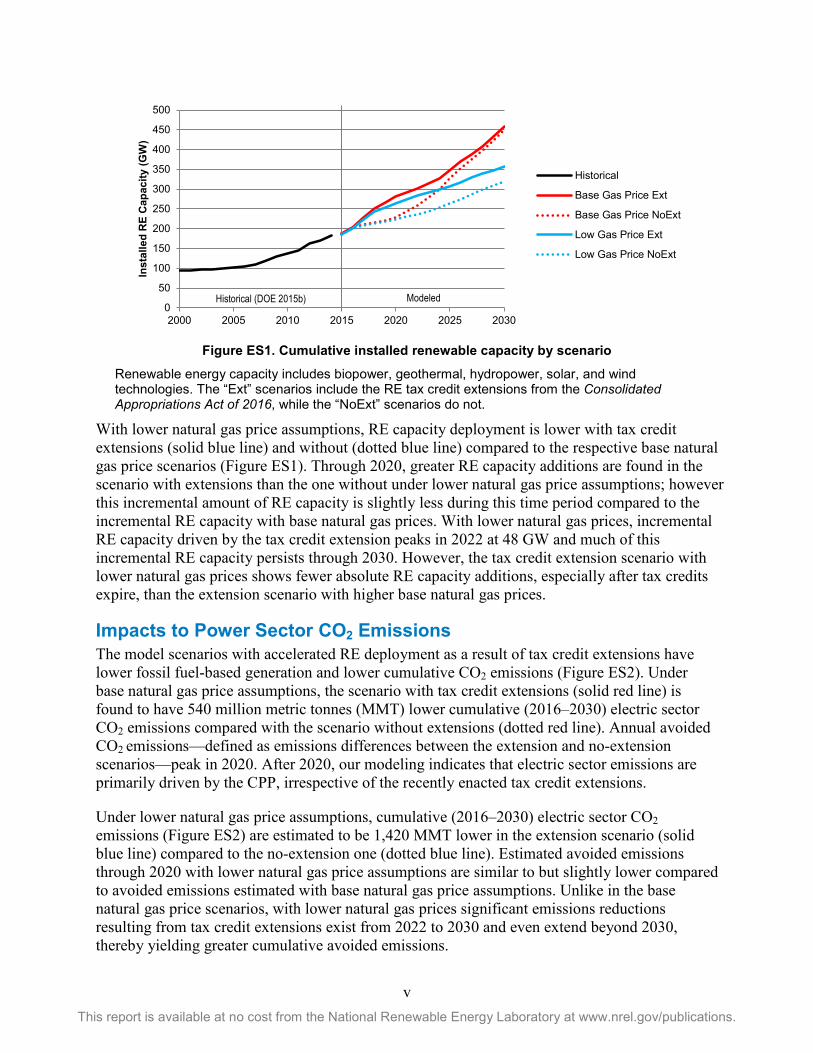
Figure ES1. Cumulative installed renewable capacity by scenario
Renewable energy capacity includes biopower, geothermal, hydropower, solar, and wind technologies. The “Ext” scenarios include the RE tax credit extensions from the Consolidated Appropriations Act of 2016, while the “NoExt” scenarios do not.
With lower natural gas price assumptions, RE capacity deployment is lower with tax credit extensions (solid blue line) and without (dotted blue line) compared to the respective base natural gas price scenarios (Figure ES1). Through 2020, greater RE capacity additions are found in the scenario with extensions than the one without under lower natural gas price assumptions; however this incremental amount of RE capacity is slightly less during this time period compared to the incremental RE capacity with base natural gas prices. With lower natural gas prices, incremental RE capacity driven by the tax credit extension peaks in 2022 at 48 GW and much of this incremental RE capacity persists through 2030. However, the tax credit extension scenario with lower natural gas prices shows fewer absolute RE capacity additions, especially after tax credits expire, than the extension scenario with higher base natural gas prices.
Impacts to Power Sector CO2 Emissions The model scenarios with accelerated RE deployment as a result of tax credit extensions have lower fossil fuel-based generation and lower cumulative CO2 emissions (Figure ES2). Under base natural gas price assumptions, the scenario with tax credit extensions (solid red line) is found to have 540 million metric tonnes (MMT) lower cumulative (2016–2030) electric sector CO2 emissions compared with the scenario without extensions (dotted red line). Annual avoided CO2 emissions—defined as emissions differences between the extension and no-extension scenarios—peak in 2020. After 2020, our modeling indicates that electric sector emissions are primarily driven by the CPP, irrespective of the recently enacted tax credit extensions.
Under lower natural gas price assumptions, cumulative (2016–2030) electric sector CO2 emissions (Figure ES2) are estimated to be 1,420 MMT lower in the extension scenario (solid blue line) compared to the no-extension one (dotted blue line). Estimated avoided emissions through 2020 with lower natural gas price assumptions are similar to but slightly lower compared to avoided emissions estimated with base natural gas price assumptions. Unlike in the base natural gas price scenarios, with lower natural gas prices significant emissions reductions resulting from tax credit extensions exist from 2022 to 2030 and even extend beyond 2030, thereby yielding greater cumulative avoided emissions.
0
50
100
150
200
250
300
350
400
450
500
2000 2005 2010 2015 2020 2025 2030
Inst
alle
d R
E C
apac
ity (G
W)
Historical
Base Gas Price Ext
Base Gas Price NoExt
Low Gas Price Ext
Low Gas Price NoExt
Historical (DOE 2015b) Modeled

vi This report is available at no cost from the National Renewable Energy Laboratory at www.nrel.gov/publications.
Figure ES2. Electric sector CO2 emissions relative to 2005 emissions by scenario
Historical emissions data are from the EIA’s November 2015 Monthly Energy Review. Emissions include the portion of the electric sector covered by ReEDS only. This excludes emissions from “direct use” facilities, such as combined heat and power, certain on-site generating systems, and other similar facilities. The “Ext” scenarios include the RE tax credit extensions from the Consolidated Appropriations Act of 2016, while the “NoExt” scenarios do not.
In summary, these findings suggest that tax credit extensions can have a measurable impact on future RE deployment and electric sector CO2 emissions under a range of natural gas price assumptions.
0%
20%
40%
60%
80%
100%
120%
2000 2005 2010 2015 2020 2025 2030
Annu
al C
O2 E
mis
sion
s (%
of 2
005)
Historical
Base Gas Price Ext
Base Gas Price NoExt
Low Gas Price Ext
Low Gas Price NoExt
Historical (EIA) Modeled

vii This report is available at no cost from the National Renewable Energy Laboratory at www.nrel.gov/publications.
Table of Contents 1 Introduction ........................................................................................................................................... 1 2 Methods ................................................................................................................................................. 4
2.1 Electric Sector Models .................................................................................................................. 4 2.2 Key Data and Assumptions ........................................................................................................... 5 2.3 Scenarios and Tax Credit Policy Representation .......................................................................... 8 2.4 Modeling Limitations and Caveats .............................................................................................. 11
3 Results ................................................................................................................................................. 13 3.1 Impact on Renewable Deployment ............................................................................................. 13 3.2 Impact on CO2 Emissions ............................................................................................................ 18
4 Conclusions ........................................................................................................................................ 22 References ................................................................................................................................................. 23 Appendix .................................................................................................................................................... 26

viii This report is available at no cost from the National Renewable Energy Laboratory at www.nrel.gov/publications.
List of Figures Figure ES1. Cumulative installed renewable capacity by scenario .............................................................. v Figure ES2. Electric sector CO2 emissions relative to 2005 emissions by scenario .................................... vi Figure 1. Cumulative installed renewable capacity by scenario ................................................................. 14 Figure 2. Difference in cumulative installed RE capacity between extension and no-extension scenarios 15 Figure 3. Installed solar (left) and wind (right) capacity by scenario ......................................................... 16 Figure 4. Renewable penetration in the Base Gas Price (left) and Low Gas Price (right) scenarios ......... 18 Figure 5. Electric sector CO2 emissions relative to 2005 emissions by scenario ........................................ 19 Figure 6. Annual (left) and cumulative (right) avoided CO2 emissions as a result of incremental RE driven
by the tax credit extensions .................................................................................................... 20 Figure 7. Model-estimated electric sector natural gas price (left) and consumption (right) by scenario .... 21 Figure A1. Estimated implied levelized cost of energy (LCOE) for utility PV before and after tax credit
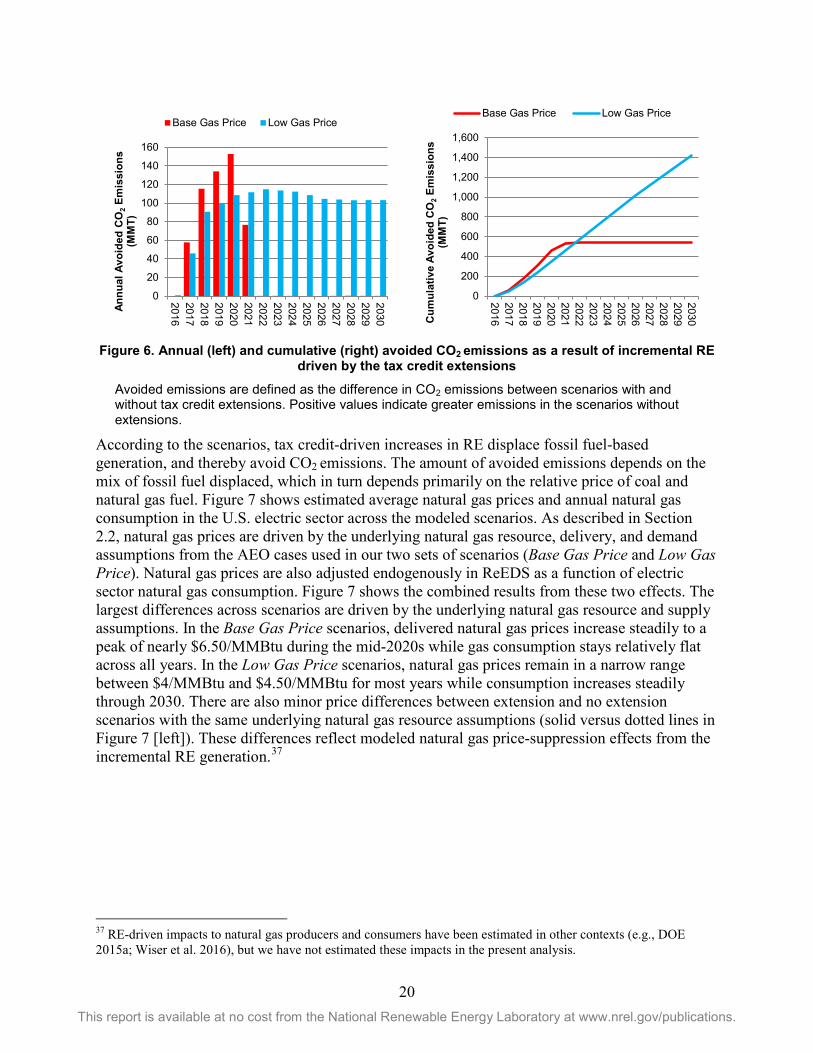
extensions ............................................................................................................................... 26 Figure A2. Estimated implied levelized cost of energy (LCOE) for land-based wind before and after tax
credit extensions ..................................................................................................................... 27 Figure A3. Comparison of estimated utility PV and wind implied LCOEs based on the assumed cost
reductions and tax credit schedule from the Consolidated Appropriates Act of 2016. .......... 27 Figure A4. Installed biopower capacity by scenario ................................................................................... 28 Figure A5. Installed geothermal capacity by scenario ................................................................................ 28 Figure A6. Installed hydropower capacity by scenario ............................................................................... 29 Figure A7. Installed wind capacity by scenario .......................................................................................... 29 Figure A8. Installed concentrating solar power capacity by scenario......................................................... 30 Figure A9. Installed utility PV capacity by scenario .................................................................................. 30 Figure A10. Installed rooftop PV capacity by scenario .............................................................................. 31
List of Tables Table 1. Schedule of Wind and Solar Tax Credits Prior to and After the Consolidated Appropriations Act
of 2016 ..................................................................................................................................... 2 Table 2. Technology Cost and Performance Assumptions for New Generation Capacity ........................... 6 Table 3. Actual and Modeled Schedule of Wind and Solar Tax Credits from the Consolidated
Appropriations Act of 2016 .................................................................................................... 10 Table A1. Estimated Annual Change in RE Cumulative Installed Capacity in the Base Gas Price
Scenarios (MW) ..................................................................................................................... 32 Table A2. Estimated Annual Change in RE Installed Capacity in the Low Gas Price Scenarios (MW) ... 33 Table A3. Historical Annual Change in RE Installed Capacity (MW) ....................................................... 33
1 This report is available at no cost from the National Renewable Energy Laboratory at www.nrel.gov/publications.
1 Introduction Federal tax credits have served as one of the primary financial incentives for renewable energy (RE) deployment in the United States over the past two decades. The production tax credit (PTC) was first enacted as part of the Energy Policy Act of 19923 and has historically played a significant role in supporting wind energy. An investment tax credit (ITC) of 30% for solar projects was initially established in the Energy Policy Act of 2005.4 Since their initial inceptions, some federal renewable tax credits have expired, been extended, modified, and renewed numerous times. Historically, changes in federal tax policies have been highly correlated with year-to-year variations in annual RE installations, particularly for wind, where the U.S. wind industry has experienced multiple boom-and-bust cycles that coincided with PTC expirations and renewals (Wiser and Bolinger 2015).
Prior to the passage of the Consolidated Appropriations Act of 20165 in December 2015, the PTC had expired and the ITC was set to decline at the end of 2016. More specifically, the wind PTC, valued at 2.3¢/kWh for electricity production over the first 10 years of a plant’s output, expired on December 31, 2014; however, projects with commercial operation dates after 2014 could qualify for the tax credit as long as they “commenced construction” prior to the expiration deadline. The solar ITC was set to decline from 30% to 10% of the cost of development for business energy projects, generally applicable to utility-scale, industrial, commercial, and third party-owned residential solar projects, and from 30% to 0% for residential host-owned projects after December 31, 2016. These solar ITC schedules reflect a “placed in service” requirement as opposed to the commenced-construction provision for the wind PTC.
The Consolidated Appropriations Act of 2016 extended these ITC and PTC deadlines by five years from their prior scheduled expiration dates, but included ramp downs in tax credit value during the latter years of the five-year period. Notably, the act kept the commenced-construction provision for the wind PTC and extended the provision to the ITC for utility-scale and commercial solar. No such provision is applied to the ITC for residential solar photovoltaics (PV), which has a placed-in-service requirement instead. Table 1 summarizes the wind and solar tax credit schedule set forth in the act as well as the tax credit schedule before the act was passed. The act also extended tax credits for a wider suite of RE technologies, including biomass, geothermal, and hydropower; however, these extensions are set to expire at the end of 2016.6 In addition, the ITC option in lieu of the PTC is also available for certain qualifying projects, such as offshore wind. Hereafter, we refer to differences in federal RE tax credits from before and after the Consolidated Appropriations Act of 2016 as “tax credit extensions.”7
3 https://www.gpo.gov/fdsys/pkg/STATUTE-106/pdf/STATUTE-106-Pg2776.pdf 4 https://www.gpo.gov/fdsys/pkg/BILLS-109hr6enr/pdf/BILLS-109hr6enr.pdf 5 https://www.gpo.gov/fdsys/pkg/BILLS-114hr2029enr/pdf/BILLS-114hr2029enr.pdf 6 More specifically, 2.3¢/kWh PTCs are available for geothermal and closed-loop biomass facilities and 1.2¢/kWh PTCs are available for open-loop biomass facilities and qualifying hydropower. The 2016 expiration reflects a commence-construction deadline for these PTCs. 7 See http://www.dsireusa.org for details on the policy.

2 This report is available at no cost from the National Renewable Energy Laboratory at www.nrel.gov/publications.
Table 1. Schedule of Wind and Solar Tax Credits Prior to and After the Consolidated Appropriations Act of 2016
New Policy 2015 2016 2017 2018 2019 2020 2021 Future Wind PTC Full Full 80% 60% 40% 0% 0% 0%
Solar ITC
Utility 30% 30% 30% 30% 30% 26% 22% 10% Commercial/Third-Party-Owned 30% 30% 30% 30% 30% 26% 22% 10% Residential Host-Owned 30% 30% 30% 30% 30% 26% 22% 0%
Prior Policy 2015 2016 2017 2018 2019 2020 2021 2022 Wind PTC 0% 0% 0% 0% 0% 0% 0% 0%
Solar ITC
Utility 30% 30% 10% 10% 10% 10% 10% 10% Commercial/Third-Party-Owned 30% 30% 10% 10% 10% 10% 10% 10% Residential Host-Owned 30% 30% 0% 0% 0% 0% 0% 0%
The New Policy schedules reflect “commenced-construction” dates for all categories except Solar ITC Residential Host-Owned for which “placed-in-service” dates are shown. The Prior Policy schedules reflect “placed-in-service” dates for all categories except or the Wind PTC which had a “commenced-construction” deadline of December 31, 2014. The “Full” (100%) wind PTC value is 2.3¢/kWh for electricity production over the first ten years.
The primary objective of our analysis is to explore two key questions with respect to the impacts of the renewable tax credit extensions: (1) How might RE deployment in the contiguous United States change with the federal tax credit extensions? (2) How might this change in RE deployment impact carbon dioxide (CO2) emissions in the power sector?
The historical impact of federal tax credits on energy portfolios and CO2 emissions, as well as the impact of these tax policies in comparison to other energy policies, are topics examined by multiple recent studies (Barradale 2010; Shrimali, Lynes, and Indvik 2015; Palmer et al. 2011; Arce, Sauma, and Contreras 2016; Comello and Reichelstein 2016). Tax credits can have a broader set of potential impacts, including to: taxpayers and electricity ratepayers; air pollution, land use, and environmental quality; clean energy policy compliance costs; and grid operations and electricity markets, and some of these broader impacts have been studied recently (Heeter et al. 2015; Roach 2015; Burns and Kang 2012). Studies of tax credit extensions also exist. For example, Comello and Reichelstein (2016) investigated different “glide” path scenarios for solar ITC extensions using bottom-up cost modeling and Lantz et al. (2014) explored a range of wind PTC extension scenarios. Although forward-looking, these studies do not evaluate extensions consistent with the Consolidated Appropriations Act of 2016. Other analyses have recently been published on the impacts of this specific tax credit extension policy (BNEF 2015a; Munsell 2015; Larsen and Herndon 2016).
Our analysis, conducted during January and February 2016, focuses on the most recent extensions passed in December 2015. However, its scope is largely restricted to RE deployment and CO2 emissions impacts. Our analysis does not address broader issues and, for this reason, our analysis does not represent a comprehensive cost-benefit assessment of the tax credit extensions. In addition, it is not designed to evaluate the impact of or compliance pathways for other electric sector policies and regulations, such as the Clean Power Plan (CPP). Moreover, significant deviations in future policy or market conditions from those modeled are likely, and none of the scenarios analyzed in the report reflect a prediction or forecast from the National Renewable

3 This report is available at no cost from the National Renewable Energy Laboratory at www.nrel.gov/publications.
Energy Laboratory (NREL) or the U.S. Department of Energy. Instead, the scenario analysis employs a self-consistent modeling approach that considers the complex interactions driving future RE deployment in the U.S. electricity sector and the comparative impacts of federal tax credits therein.
This report is organized as follows. Section 2 describes the modeling methods, assumptions, scenarios, and key modeling limitations and caveats. Scenario results, which are focused on RE deployment and U.S. power sector CO2 emissions, are presented in Section 3. Further technology-specific data are shown in the appendix. We conclude in Section 4.

4 This report is available at no cost from the National Renewable Energy Laboratory at www.nrel.gov/publications.
2 Methods 2.1 Electric Sector Models We use electric sector models developed by the National Renewable Energy Laboratory to explore the impacts of tax credit extensions. The primary analytic tool used is the Regional Energy Deployment System (ReEDS) model,8 a capacity expansion and dispatch model for the contiguous United States that relies on system-wide least cost optimization to estimate the type and location of future generation and transmission capacity (Sullivan et al. 2015; Short et al. 2011).9 In conjunction with ReEDS, which does not explicitly model distributed generation; we use Distributed Solar (dSolar), a consumer adoption model for the U.S. rooftop PV market. dSolar simulates future rooftop PV deployment in the industrial, commercial buildings, and residential buildings sectors (Sigrin et al. 2016).10 We currently do not have the capability to model other distributed technologies using this modeling framework and, as such, other distributed technologies are excluded from our analysis. Both ReEDS and dSolar proceed in two-year solve intervals between the present day and 2050; however, we restrict our study horizon to 2030 for this analysis.
While ReEDS and dSolar model a large suite of generation technology options, they are designed specifically to represent the unique characteristics of renewable generation and the major factors that might influence the economics and deployment of renewable technologies. For example, ReEDS uses high spatial resolution and statistical methods to account for the location-dependence, variability, and uncertainty of wind and solar resources in determining optimal portfolio mixes. In each of its 134 model balancing areas, ReEDS ensures supply and demand are balanced and reserve requirements are met.11 Similarly, dSolar uses a detailed representation of rooftop PV consumer segments and a highly disaggregated (county-level) representation to model geographic differences in rooftop PV resource and electricity markets. Despite these features and as with all models, ReEDS and dSolar are subject to certain limitations and caveats, described in Section 2.4.
The core modeling approach used for this analysis has been applied in many recent studies, including the Wind Vision study (DOE 2015a), the SunShot Vision Study (DOE 2012), and the Renewable Electricity Futures Study (NREL 2012). It has also been used to examine impacts of a range of wind production tax credit extensions (Lantz et al. 2014), to simulate solar ITC scenarios (Mai et al. 2015), and to assess near-term renewable market potential (Zinaman et al. 2014). Analyses of proposed energy policies and other prominent studies have used ReEDS to generate future electric sector scenarios (Cole et al. 2015; Sullivan et al. 2015; Clemmer et al. 2014; Mai et al. 2014; Mignone et al. 2012; Logan et al. 2013).
8 http://www.nrel.gov/analysis/reeds 9 We use the 2016 early release version of ReEDS (v2016.ER) with modifications to represent the extended tax credits that are the focus of our analysis. 10 For residential PV, dSolar considers adoption of host-owned and third-party-owned systems. dSolar is an updated version of the NREL SolarDS model (Denholm et al. 2009). 11 ReEDS uses 356 resource regions representing wind and concentrating solar power (CSP) resources. All other technologies and resources, including PV, are represented at the 134 model balancing area resolution.

5 This report is available at no cost from the National Renewable Energy Laboratory at www.nrel.gov/publications.
2.2 Key Data and Assumptions Input assumptions used in the modeling analysis are based on multiple recent analyses employing ReEDS: wind, solar, geothermal, and hydropower technology cost and performance assumptions are from the central case of the NREL 2015 Annual Technology Baseline;12 non-renewable technologies and biopower technology cost and performance, fossil fuel price, and demand growth assumptions13 are from the Energy Information Administration’s 2015 Annual Energy Outlook (AEO) (EIA 2015);14 and transmission cost and other assumptions are from the NREL 2015 Standard Scenarios Annual Report (Sullivan et al. 2015) and the DOE Wind Vision study (DOE 2015a). In this section, we describe a subset of the technology, fuel price, and policy assumptions used in our modeling analysis; we refer the reader to the above-referenced documents for more complete descriptions of these assumptions.
Table 2 presents technology cost and performance assumptions for natural gas-fired, land-based wind and solar PV technologies modeled in ReEDS and dSolar (see the appendix for graphical presentations). We focus on these specific technologies because they have experienced the greatest amount of deployment in recent years and they are projected to experience the largest amount of growth in the modeled scenarios (Section 3). Cost and performance assumptions for all other technologies—including biopower, coal, geothermal, hydropower, offshore wind, concentrating solar power, carbon capture and storage, nuclear, and electrical storage—can be found in the 2015 Annual Technology Baseline. Capital costs listed in Table 2 reflect overnight costs. To inform the ReEDS objective function, we apply additional costs, including interest during construction and other financing costs (including the impact of tax credits when appropriate) (Mai et al. 2015). Moreover, for new wind and utility solar capacity, costs associated with new transmission infrastructure needed for grid interconnection are also modeled, and they are additive to the costs shown on Table 2.15 Finally, capital costs are also regionally differentiated in ReEDS and dSolar to reflect regional differences in labor costs, siting costs, and other costs.
Fuel price assumptions used in this analysis are from the AEO 2015 (EIA 2015). Coal and uranium prices are taken directly from the AEO 2015 Reference case. For natural gas, ReEDS uses a supply curve approach to reflect price-demand elasticities in the natural gas market wherein marginal prices depend on the amount of fuel consumed by the electricity sector. Two sets of natural gas price assumptions, from the Reference and High Oil & Gas Resource cases in AEO 2015, are used to inform these supply curves. ReEDS also includes regionally differentiated fossil fuel prices and includes seasonal adjustments for natural gas prices. Model outcomes based on these assumptions and model treatment are shown in Section 3.2.
12 http://www.nrel.gov/analysis/data_tech_baseline.html For rooftop PV, we use cost reduction scenarios from the SunShot Vision Study (DOE 2012) that are aligned with those in the 2015 Annual Technology Baseline central case for utility-scale PV. 13 Price-demand elasticities are not modeled in the present analysis; electricity consumption is identical in all scenarios. 14 Unless otherwise noted, assumptions are from the AEO 2015 Reference case. 15 Expansion of long-distance transmission lines and any associated costs are also modeled in ReEDS; however, those costs are viewed from a system-wide perspective and are not directly tied to any individual technologies.

6 This report is available at no cost from the National Renewable Energy Laboratory at www.nrel.gov/publications.
Table 2. Technology Cost and Performance Assumptions for New Generation Capacity
2016 2020 2025 2030 Overnight Capital Costs (2015$/kW)
Natural Gas-Combined Cycle 974 962 948 927
Natural Gas-Combustion Turbine 831 814 802 781
Land-based Wind (TRG 1)a 1,647 1,600 1,561 1,546
Land-based Wind (TRG 5)a 1,783 1,770 1,759 1,755
Utility PVb 1,915 1,633 1,361 1,088
Commercial PVb 2,777 1,922 1,646 1,370
Rooftop PVb 3,342 2,306 1,975 1,644
Fixed O&M (2015$/kW-yr)c
Natural Gas-Combined Cycle 14.5 14.5 14.5 14.5
Natural Gas-Combustion Turbine 7.3 7.3 7.3 7.3
Land-based Wind (all TRGs)a 51.1 50.0 49.1 48.2
Utility PVb 14.8 7.7 7.7 7.7
Commercial PVb 8.9 6.1 6.1 6.1
Residential PVb 9.4 6.6 6.6 6.6
Variable O&M (2015$/MWh)c
Natural Gas-Combined Cycle 3.5 3.5 3.5 3.5
Natural Gas-Combustion Turbine 13.1 13.1 13.1 13.1
Heat Rate (MMBtu/MWh)
Natural Gas-Combined Cycle 6.67 6.62 6.57 6.57
Natural Gas-Combustion Turbine 9.96 9.76 9.50 9.50
Annual Capacity Factor (%)
Land-based Wind (TRG 1)a 52% 54% 55% 56%
Land-based Wind (TRG 5)a 33% 35% 36% 37%
Utility PVb 14–29% 14–29% 14–29% 14–29%
Commercial PVb 14–18% 14–18% 14–18% 14–18%
Residential PVb 13–18% 13–18% 13–18% 13–18% a Land-based wind is modeled using five techno-resource groups (TRGs), and the table shows cost and performance assumptions for the best (TRG 1) and worst (TRG 5) groups where appropriate. b PV capacity is represented in DC terms. PV capacity factor reflects AC output divided by DC capacity. AC capacity and output are used for all other technologies. The capacity factor ranges shown for commercial and residential PV reflect the 10th and 90th percentiles for all rooftop sites modeled in dSolar. Utility PV represents 1-axis tracking systems. c We assume all operations and maintenance (O&M) costs for wind and PV technologies fall under the Fixed O&M category. Fuel costs for natural gas are not included in either Fixed or Variable O&M categories.

7 This report is available at no cost from the National Renewable Energy Laboratory at www.nrel.gov/publications.
We model current policies and regulations as of January 1, 2016 in all scenarios with the exception of the federal tax credits that are the focus on this study. Model representations of federal RE tax credits are presented in Section 2.3. Policies modeled in all scenarios include state renewable portfolio standards, state and regional carbon emissions policies,16 and the CPP. We acknowledge that there are significant uncertainties with respect to future policies, as highlighted by the recent U.S. Supreme Court stay on the CPP (see West Virginia 2016) and that the analysis is designed to evaluate impacts of the tax credits based on policies as of January 1, 2016 only. The recently issued stay on the CPP could delay its implementation but does not overturn the rule. As a result, we include a representation of the CPP in all scenarios.
For the CPP, we assume mass-based compliance with new source complement targets for each state, and we allow for full credit trading between the states.17 We recognize that significant uncertainties exist in future state plans for CPP compliance and that no state plans have been submitted and approved to date. Also, ReEDS does not have the capability to endogenously model energy efficiency or coal plant heat rate improvements as CPP compliance options. The Clean Energy Incentive Program of the CPP is also not included.18 For these reasons, our CPP representation only reflects a simplifying choice and we do not evaluate how results might change with different compliance scenarios.19 We note that while different representations of the CPP can potentially impact absolute RE deployment and CO2 emissions, it is unclear how much different CPP variants would meaningfully impact incremental RE deployment driven by tax credit extensions—particularly for near-term modeling results before the CPP is in effect, i.e. before 2022.
Investment and dispatch decisions in ReEDS are influenced by the amount of rooftop PV capacity from dSolar and the electricity production profiles of the projected rooftop PV. Assumptions and methods specific to the dSolar rooftop PV adoption model are reported in Sigrin et al. (2016). Of particular note is that we model net metering rules, including any net metering caps, based on policies in place as of October 1, 2015. For systems not subject to net metering, we assume that electricity exported to the grid from rooftop PV systems is valued at wholesale electricity rates.20
16 Carbon caps set forth by California’s Assembly Bill 32 and the Regional Greenhouse Gas Initiative are modeled. 17 It is assumed that allowances are auctioned and that revenues from auctioned are recycled in lump-sum to consumers. 18 The Clean Energy Incentive Program offers incentives for solar, wind, and low-income energy efficiency to help meet CPP emissions targets. It is unclear the extent to which this program might impact solar and wind deployment or interact with the federal RE tax credits. 19 Forthcoming research using ReEDS will examine a broad range of sensitivities with respect to CPP compliance options. In addition, further details on the representation of the CPP in ReEDS will be provided in a forthcoming documentation report. 20 Wholesale electricity rates are determined using ReEDS scenarios.

8 This report is available at no cost from the National Renewable Energy Laboratory at www.nrel.gov/publications.
2.3 Scenarios and Tax Credit Policy Representation We model four scenarios using two separate sets of natural gas price assumptions and two sets of tax credit policy assumptions:21
• Base Gas Price Extension (Ext): a scenario with tax credit extensions using the assumptions described in Section 2.2, including natural gas prices based on the AEO 2015 Reference case
• Base Gas Price No Extension (NoExt): a reference scenario to the Base Gas Price Ext scenario with identical assumptions except without the tax credit extensions
• Low Gas Price Extension (Ext): a scenario with tax credit extensions using lower natural gas price projections based on the AEO 2015 High Oil & Gas Resource case but otherwise using the same assumptions as the Base Gas Price Ext scenario
• Low Gas Price No Extension (NoExt): the no tax credit extension reference scenario to the Low Gas Price Ext scenario.
The “no extension” scenarios serve simply as references and depart from current policies by excluding the recently passed tax credit extensions. In these scenarios, the PTC is assumed to remain expired starting in 2015 and the solar ITC is assumed to decline after 2016. Differences between these counterfactual scenarios and the ones with the tax credit extensions are used to estimate the impacts of the extensions.
We use two distinct sets of natural gas price assumptions to reflect the uncertainty of future natural gas prices and the large impact that these assumptions can have on new investment and dispatch decisions, as well as the associated generation and emissions impacts. Both sets of assumptions rely on outputs from the AEO 2015 (EIA 2015); however, the two sets rely on distinctly different natural gas resource assumptions. The Base Gas Price scenarios use gas assumptions from the AEO 2015 Reference case, as is consistent with many other assumptions in this analysis; however, the Low Gas Price scenarios reflect assumptions from the AEO 2015 High Oil & Gas Resource case. We do not include scenarios with higher natural gas prices (e.g., lower gas resource) than those in the Base Gas Price scenario due to the lack of a Low Oil & Gas Resource case in AEO 2015 and due to recent expectations of continued low natural gas prices at least in the near term (e.g., EIA 2016; Logan et al. 2015; BNEF 2015b). In the longer-term, natural gas prices are less certain and historical forecasts of natural gas prices have been inaccurate. While the range modeled does not respect absolute bounds across all possible future scenarios, they span a reasonably broad range of anticipated price trends.22 Section 3.2 presents natural gas prices from the modeled scenarios.
21 We explore a range of natural gas price trajectories due to the great deal of uncertainties associated with future natural gas prices. Uncertainties exist for other future parameters, such as RE costs and energy policies, as well and further work is needed to explore more fully these sensitivities. 22 We also do not model impacts of different natural gas price assumptions on rooftop PV deployment. Natural gas prices can indirectly impact rooftop PV adoption by altering wholesale and retail electricity prices, thereby affecting avoided costs and value of PV generation.
9 This report is available at no cost from the National Renewable Energy Laboratory at www.nrel.gov/publications.
Model representations of the latest tax credit extensions (in the Base Gas Price Ext and Low Gas Price Ext scenarios) are complicated by the “commenced-construction” provision in these policies, the annual ramp-down in tax credit value during the five-year period of the extensions, and the two-year solve intervals used in both ReEDS and dSolar.23 Because the ReEDS and dSolar models account for the timing of plants coming online rather than when they begin construction, we represent the commenced-construction provision by assuming that the tax credit received by facilities corresponds to the value of the tax credits at the time the plant would typically start construction. We assume that construction starts two years prior to the commercial operation date for utility-scale solar and wind and one year prior for commercial rooftop PV.24 For residential PV, the ITC is a placed-in-service tax credit, meaning the commenced-construction provision does not apply. Furthermore, the effective value of the tax credit during each two-year model period is based on the average value of the tax credit available after accounting for these under construction periods. For example, an effective 28% ITC is modeled for utility-scale solar during the 2022 ReEDS solve period (representing 2021–2022) based on the average of the 30% ITC available in 2019 and the 26% ITC available in 2020.25 Table 3 presents the effective wind PTC and solar ITC schedules modeled in the Base Gas Price Ext and Low Gas Price Ext scenarios compared with the nominal schedule listed by the policy.
While not shown on Table 3, we also include tax credits for other RE technologies in the modeled scenarios. The model representation of the tax credit extensions includes effective PTCs for biopower, geothermal, and hydropower lasting through the 2017–18 solve period to account for the commenced-construction deadline at the end of 2016. A PTC value of 2.3¢/kWh is applied to biopower and geothermal and a PTC of 1.2¢/kWh is applied to new hydropower during this period. No tax credits are assumed for biopower and hydropower after 2018. A geothermal ITC of 10% is modeled for all years after 2018. Another nuance not shown on Table 3 is the ITC option in lieu of the PTC for certain qualifying facilities, including offshore wind. For offshore wind, we include an effective ITC through the 2020 solve period.26
23 We use interpolations when presenting annual results. 24 These assumptions are largely consistent with IRS guidance for commenced-construction provisions in earlier tax credit policies: “Beginning of Construction for Sections 45 and 48: Notice 2015-25,” Internal Revenue Service, U.S. Dept. of the Treasury, accessed January 28, 2016, https://www.irs.gov/pub/irs-drop/n-15-25.pdf. 25 This representation may underestimate the tax credit value, as more projects may be moved forward to gain the higher tax credit value in earlier years. However, we conducted test scenarios and found little impact in RE capacity deployment results when shifting the effective tax credit schedule slightly to account for this behavior. 26 The act specifies a ramp-down schedule for the ITC available to offshore wind wherein a 30% ITC is available in 2016 and reduces by six percentage points annually through 2019. However, the version of ReEDS used in this analysis does not have the ability to model ITC ramp-downs for offshore wind. For the Ext scenarios, we include a full 30% offshore wind ITC for all years from 2016 to 2020, but no new offshore wind capacity is added during this time period by the model. As such, we conclude that a more accurate representation of the ramp-down schedule would yield the same result.

10 This report is available at no cost from the National Renewable Energy Laboratory at www.nrel.gov/publications.
Table 3. Actual and Modeled Schedule of Wind and Solar Tax Credits from the Consolidated Appropriations Act of 2016
Consolidated Appropriations Act of 2016 2015 2016 2017 2018 2019 2020 2021 2022 2023 2024 2025 Future
Wind PTC Full Full 80% 60% 40% 0% 0% 0% 0% 0% 0% 0%
Solar ITC
Utility 30% 30% 30% 30% 30% 26% 22% 10% 10% 10% 10% 10%
Commercial/Third-Party-Owned 30% 30% 30% 30% 30% 26% 22% 10% 10% 10% 10% 10%
Residential Host-Owned 30% 30% 30% 30% 30% 26% 22% 0% 0% 0% 0% 0%
Model Representation 2015–16 2017–18 2019–20 2021–22 2023–24 Future
Wind PTC Full Full 70% 20% 0% 0%
Solar ITC
Utility 30% 30% 30% 28% 16% 10%
Commercial/Third-Party-Owned 30% 30% 30% 24% 10% 10%
Residential Host-Owned 30% 30% 28% 11% 0% 0%
The model representation of the tax credit extensions considers the commenced-construction provision by assuming an additional two years of effective eligibility for utility-scale wind and solar projects and an additional year for commercial PV. Due to annual changes in tax credit values and the two-year model resolution, we apply the average tax credit over the two-year period after accounting for the construction period as the effective tax credit in the models. The model representation of the act also includes effective PTCs for biopower, geothermal, and hydropower lasting through the 2017–18 solve period. A PTC value of 2.3¢/kWh is applied for biopower and geothermal a PTC of 1.2¢/kWh is applied to new hydropower during this period. No tax credits are assumed for biopower and hydropower after 2018. A geothermal ITC of 10% is modeled for all years after 2018.

11 This report is available at no cost from the National Renewable Energy Laboratory at www.nrel.gov/publications.
2.4 Modeling Limitations and Caveats While ReEDS and dSolar represent many aspects of the U.S. electricity system, like all models, they necessitate simplifications. We list some of the key limitations and caveats that result from these simplifications, highlighting those that are particularly relevant for the present analysis.
• System-wide optimization — ReEDS takes a system-wide least-cost perspective that does not necessarily reflect the perspective of individual decision makers, including specific investors, regional market participants, or corporate consumer choice of renewable power; nor does it model contractual obligations or non-economic decisions. In addition, like other optimization models, ReEDS finds the absolute least-cost solution that does not fully reflect real distributions and uncertainties in the parameters; however, the heterogeneity resulting from the high spatial resolution of ReEDS mitigates this to some degree.
• Foresight and behavior — Except for limited foresight of future natural gas prices, model decision-making does not account for anticipated changes to markets and policies. For example, anticipated tax credit expirations have historically led to acceleration of project development. By not including policy foresight and the associated behavior of specific plant developers, the models likely underestimate the year-to-year changes in renewable deployment coinciding with changes in tax credit values; however, the commenced-construction provision mitigates this tendency to some extent.
• Project pipeline — The models incorporate data of planned or under-construction projects, but these data likely do not include all projects in the queue nor do they consider how the recent tax credits might ultimately impact project completion schedules.
• Manufacturing, supply chain, and siting — The models do not explicitly simulate manufacturing, supply chain, or siting and permitting processes. Potential bottlenecks or delays in project development stages for new generation or transmission would not be fully reflected in the results.
• Financing interactions — Financial parameters used in the models reflect long-term historical averages as opposed to current or near-term market conditions. In addition, the models do not fully capture financing interactions with tax credits (Bolinger 2014); however, we do model changes in capital structure for utility-scale wind and solar caused by changes in tax credits (Mai et al. 2015). Other interactions with tax equity investments are not reflected in the analysis.
• Technology learning — Future technology improvements are considered exogenously based on the assumptions presented in Section 2.2. Endogenously including learning-by-doing would likely increase the estimated incremental impact of the tax credit extensions.27
27 Our current method assumes the same RE cost trajectories independent of deployment or scenario. With learning, greater tax credit-driven deployment would yield relatively lower costs than no extension scenarios (or conversely, costs might be higher than assumed in the no extension scenarios) thereby widening the incremental deployment gap between extension and no extension scenarios.

12 This report is available at no cost from the National Renewable Energy Laboratory at www.nrel.gov/publications.
Notwithstanding these limitations—many of which exist in other similar tools—the modeling approach considers complex interactions between numerous different policies and technologies, while ensuring electric system reliability requirements are maintained within the resolution and scope of the models. In doing so, given a set of assumptions we can comprehensively estimate the cost and value of a wide range of technology options to the system, including how tax credits might alter these valuations, and we use the models to generate self-consistent future deployment portfolios.
13 This report is available at no cost from the National Renewable Energy Laboratory at www.nrel.gov/publications.
3 Results Recent growth in installed renewable capacity has been, in part, driven and supported by federal tax credits, state RE policies, consumer demand, renewable technology advancements, and global market conditions. Over the five-year period through 2014, this growth has accelerated; new RE capacity installations grew at an average rate of 10,600 MW per year between 2010 and 2014, compared with about 4,100 MW per year between 2001 and 2009 (DOE 2015b).28 Total RE growth equaled 12,800 MW in 2014 while record-level annual RE installations of 17,600 MW occurred in 2012.29 Most of these additions are composed of new wind and solar, which have therefore captured more federal tax incentives than other RE technologies.
In this section, we present RE deployment estimates from the four scenarios defined in Section 2. We focus on aggregate RE capacity but also present impacts specific to solar and wind, as the greatest absolute impacts occur for these industries. The appendix includes results across a broader range of RE technologies. Estimated electric sector CO2 emissions are also presented along with avoided emissions estimates associated with the tax credit extensions.
3.1 Impact on Renewable Deployment Tax credit extensions are estimated to accelerate renewable capacity deployment, but their longer-term impacts depend on future natural gas prices, among other regulatory and market factors. Figure 1 shows modeled cumulative installed RE capacity in the contiguous U.S. electricity system through 2030 across all four scenarios and compares these trajectories with historical data through 2014. Growth in aggregate installed RE capacity is estimated to continue through 2030 across all four scenarios; however, year-to-year growth rates as well as total 2030 results depend strongly on both assumed natural gas prices and the tax credit extensions.
Under both Base Gas Price scenarios, aggregate RE capacity is estimated to grow significantly over the next 15 years, with average annual installations in this period over both scenarios totaling nearly 18,000 MW per year during this period. This growth results in similar 2030 aggregate RE capacity (slightly over 450 GW) whether or not RE tax credits are extended. However, the paths to reach these 2030 cumulative installed capacities differ markedly depending on tax credit assumptions. Without tax credit extensions, annual RE capacity additions slow during the 2016–2020 period compared to recent (2010–2014) historical trends; the average annual RE additions through 2020 are estimated to be about 8,300 MW per year in the Base Gas Price NoExt scenario. In contrast, with tax credit extensions under base natural gas price assumptions, average annual RE additions during this 2016–2020 time period are estimated to be 18,900 MW per year, exceeding total capacity added during the 2012 historical record year.
28 We present historical and model-estimated future capacity in AC terms for all technologies except PV, which is reported in DC units. This convention is consistent with past ReEDS reporting and is adopted due to uncertainties associated with future inverter loading ratios. One can convert the PV capacity to AC terms by dividing by the inverter loading ratio, which is implicitly assumed to be 1.1 in ReEDS and dSolar, but has been observed to be much higher for newer utility-scale PV plants (Bolinger and Seel 2015). 29 This record in annual installations is through 2014. As of this writing, published estimates of total 2015 RE additions are not yet available.

14 This report is available at no cost from the National Renewable Energy Laboratory at www.nrel.gov/publications.
Figure 1. Cumulative installed renewable capacity by scenario
Renewable energy capacity includes biopower, geothermal, hydropower, solar, and wind technologies.
Under base natural gas price assumptions, incremental impacts of the tax credit extensions—defined as the difference between scenarios with and without tax credit extensions—begin to diminish after 2020. Figure 2 shows how incremental RE capacity between extension and no extension scenarios peaks at 53 GW in 2020 but declines to only about 7 GW by 2030. The likely reasons for this near convergence in cumulative RE capacity in the long term are threefold. First, the value of the tax credits begins to ramp down after 2020 (Section 2.3). Second, with the increasing natural gas prices and declining RE costs, as assumed under the Base Gas Price scenarios, a large amount of RE capacity is found to be cost effective before 2030. According to the modeling analysis, some of that RE capacity is built before 2020 when the tax credit extensions have greatest impact, but much of that capacity is estimated to be installed after 2020 even with more limited tax incentive support.30 Finally, the CPP comes into effect starting in 2022, thereby potentially driving RE capacity additions in both extension and no-extension scenarios.31 We have not evaluated the relative impact of these three drivers, but we expect that each may play a significant role in future RE capacity deployment.
As expected, RE capacity growth is estimated to be lower under lower natural gas price assumptions (Figure 1). Average annual RE capacity additions from 2016 to 2030 in the Low Gas Price NoExt scenario are estimated to be 8,900 MW per year, which is close to but slightly less than recent historical average additions. These additions are estimated to result in 320 GW of total RE installed capacity by 2030. As with the Base Gas Price scenarios, tax credit extensions are found to accelerate RE deployment even with lower natural gas price assumptions. However, unlike the Base Gas Price scenarios, we find that the tax credit extensions have longer-lived impacts on RE deployment. In the Low Gas Price Ext scenario, average annual RE capacity installations are estimated to be 11,300 MW per year over the next 15 years and 2030 cumulative installed capacity is estimated to reach 356 GW. Figure 2 shows
30 Our analysis does not account for learning-by-doing or supply chain impacts that might alter these dynamics, particularly the degree of convergence between the extension and no extension scenarios. 31 We do not model the Clean Energy Investment Program of the CPP nor do we include policy foresight in the model (see Sections 2.2 and 2.4).
0
50
100
150
200
250
300
350
400
450
500
2000 2005 2010 2015 2020 2025 2030
Inst
alle
d R
E C
apac
ity (G
W)
Historical
Base Gas Price Ext
Base Gas Price NoExt
Low Gas Price Ext
Low Gas Price NoExt
Historical (DOE 2015b) Modeled

15 This report is available at no cost from the National Renewable Energy Laboratory at www.nrel.gov/publications.
how with lower natural gas prices, incremental RE capacity (the difference between the scenarios with and without tax credit extensions) peaks in 2022 at slightly lower levels than with base natural gas prices (48 GW versus 53 GW), but declines much more slowly thereafter.32
Figure 2. Difference in cumulative installed RE capacity between extension and no-extension
scenarios
Positive values indicate that there are greater installed RE capacity in the extension scenario relative to the no extension scenario. Renewable energy capacity includes biopower, geothermal, hydropower, solar, and wind technologies.
Figures 1 and 2 show RE capacity in aggregate, including biopower, geothermal, hydropower, solar, and wind; however, tax credit extensions are anticipated to be felt differently by the diverse RE industries. The tax credit extensions enacted by the Consolidated Appropriations Act of 2016 provide greater support for wind and solar technologies than for other RE options; wind and solar tax credits are extended for five years with commenced-construction provisions, whereas tax credits for other RE technologies expire at the end of 2016. We show, in Figure 3, scenario outcomes specifically for solar and wind because the modeling indicates that the tax credit extensions have the greatest impact on these two technologies, and because the wind and solar industries have demonstrated the most deployment growth over the past decade.33 We include deployment results for each RE technology individually in the appendix.
32 RE deployment in the Low Gas Ext and Low Gas NoExt scenarios converge further over the longer run (i.e. beyond 2030). Estimated incremental RE capacity reduces to less than 10 GW by 2040 under the Low Gas scenarios. 33 Note that in Figure 3 solar capacity includes the aggregate of utility-scale CSP and PV as well as rooftop PV capacity. Results for these three solar sectors separately are shown in the appendix. Wind is comprised solely of land-based wind as no offshore wind capacity is deployed in any of the four scenarios by 2030. Existing demonstration and commercial offshore wind projects that have started construction or are at early stages of project development are not included in our plant database and ReEDS does not find new offshore wind capacity to be optimal at any location based on its system-wide least cost framework.
0
10
20
30
40
50
60
2015 2020 2025 2030
Incr
emen
tal I
nsta
lled
RE
Cap
acity
(G
W)
Base Gas Price
Low Gas Price
16 This report is available at no cost from the National Renewable Energy Laboratory at www.nrel.gov/publications.
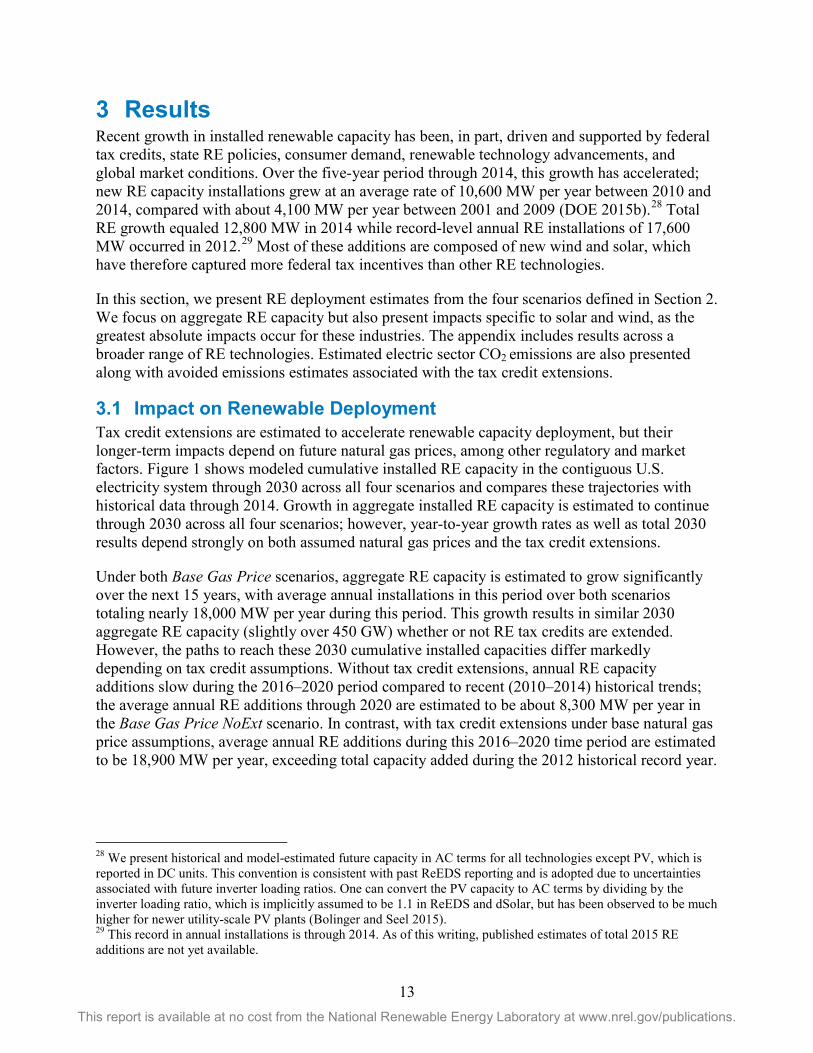
Figure 3. Installed solar (left) and wind (right) capacity by scenario
The rate of growth in new solar capacity is found to be somewhat steady over time across all scenarios and with only minor variations between scenarios. Tax credit extensions are found to support incremental solar deployment in both the Base Gas Price and Low Gas Price scenarios at similar levels. Under both sets of natural gas price assumptions, incremental cumulative solar capacity (the difference between the scenarios with and without tax credit extensions) is at its peak during 2022–2024 at 16–20 GW. These tax credit-driven effects diminish slightly thereafter, but incremental solar capacity of 11–15 GW remains in 2030.
In contrast, growth in new wind is found to be highly sensitive to tax credits in the near term and natural gas prices in the longer term. Tax credit extensions are estimated to drive 45 GW and 29 GW of incremental cumulative 2020 wind installed capacity under the Base Gas Price and Low Gas Price scenarios, respectively. Under the Base Gas Price scenario, any positive impact of tax credit extensions to wind deployment is short-lived, with cumulative installed wind capacity estimated to be nearly identical in the extension and no-extension scenarios by 2030 (~190 GW). The Low Gas Price scenarios result in less wind capacity in 2030 (94–115 GW); however, the effects of the tax credit extensions are estimated to persist beyond 2030.34 With lower natural gas prices, U.S. wind is estimated to experience very limited growth after 2020 with and without tax credit extensions. Therefore, the incremental wind deployment anticipated by 2020 as a result of the tax credit extensions remains largely intact even a decade later.
Differences in modeled behavior between wind and solar, including the greater sensitivity of wind to tax credit extensions, are caused by multiple factors. First, the value of the wind PTC, for instance in reducing levelized costs of energy, is greater than that of the utility PV ITC (Bolinger 2014) based on our cost and performance assumptions (see the appendix). Second, ignoring ramp-down or expiration effects, the investment tax credit for solar declines in absolute monetary value over time as solar capital costs decline (as assumed in our analysis) whereas the wind production tax credit actually increases in value as capacity factors are assumed to 34 A slight reduction in cumulative installed wind capacity is found toward the end of the 2020s in the Low Gas Ext scenario as a result of our assumed 24-year lifetime for wind power plants. Some of this retired capacity is repowered and a limited amount of new wind capacity is installed during this time period; however, on net, a reduction in installed wind capacity is estimated for this scenario. Beyond 2030, increases in installed cumulative capacity are found across all scenarios, including the Low Gas scenarios.
0
40
80
120
160
200
2015 2020 2025 2030
Sola
r Cap
acity
(GW
) Base Gas Price Ext Low Gas Price Ext
Base Gas Price NoExt Low Gas Price NoExt
0
40
80
120
160
200
2015 2020 2025 2030
Win
d C
apac
ity (G
W)
Base Gas Price Ext Low Gas Price Ext
Base Gas Price NoExt Low Gas Price NoExt

17 This report is available at no cost from the National Renewable Energy Laboratory at www.nrel.gov/publications.
improve. Third, the wind “supply curve” is steeper than the solar one, as highest-quality wind resources are more-limited and geographically concentrated. The greater amount of existing and projected near-term wind installed capacity further increases these differences as more of the higher quality resource sites are developed. Finally, the rooftop PV market contributes a large portion of the solar segment (see the appendix), and this market may not be as sensitive to tax credits or other market conditions as adoption is based on avoided retail prices and diffusion behavior. Methodologically, we model rooftop PV deployment using the dSolar consumer adoption model, which, as implemented for our analysis, does not consider the impact of varying natural gas prices or interactions with key policies (e.g., the CPP and state renewable portfolio standards). For example, the extent to which avoided retail electricity costs or net-metered electricity values are impacted by different natural gas prices is not modeled. Based on these differences, one might expect the wind PTC have a greater effect on future wind deployment than the solar ITC would for new solar.
We also note that the tradeoffs between wind and solar in terms of year-to-year capacity additions are partly determined by the different ramp-down schedules of the ITC and PTC (see the appendix). For example, the wind PTC expires completely after 2019 while the utility solar ITC is set at 26% in 2020, 22% in 2021, and 10% thereafter. The later phase out of the solar ITC leads to greater solar capacity additions between 2020 and 2022 compared with wind in the extension scenarios; however, wind capacity is more front-loaded in earlier years during these same scenarios. For example, under the Base Gas Price Ext scenario, annual solar capacity additions between 2020 and 2022 average 8,900 MW per year compared with less than 400 MW of net wind capacity additions per year.35 In contrast, wind capacity additions exceed solar additions prior to 2020 under the same scenarios and during the same period of time under the no-extension scenarios.
Deployment results for solar, wind, and other RE technologies are shown in the appendix. Biopower and hydropower capacity show little sensitivity to the tax credit extensions or to natural gas prices, with limited capacity growth across all modeled scenarios. This result is in part due to the limited extent (two-years) that tax credits are extended for these technologies, the lower value of the tax credits for hydropower and some biopower options, and most importantly, these technologies’ higher costs compared with wind, solar, or natural gas-fired options based on the assumptions used. Across all scenarios, installed geothermal capacity is estimated to grow significantly over the next fifteen years relative to the industry’s starting point; however, absolute growth relative to wind and solar capacity is more limited. We estimate incremental geothermal capacity, as driven by the two-year geothermal PTC extension, to be about 200 MW in 2018, but this incremental boost is estimated to be short-lived. The tax credit extensions are estimated to result in net negative impacts to geothermal capacity during the early 2020s as higher value is provided to solar and wind at the expense of geothermal. By 2030, the tax credit extensions have little impact on installed geothermal capacity.
Figure 4 shows estimated annual penetration from renewables (as a fraction of total generation) in 2020, 2025, and 2030 across all four scenarios. Under the Base Gas Price scenarios, RE penetration reaches 23% by 2020 and grows to 33% by 2030 with the tax credit extensions.
35 Note that based on our model representation of the tax credit extensions, the wind PTC is only at 20% of its full value during the 2022 model solve period (representing 2021–2022).

18 This report is available at no cost from the National Renewable Energy Laboratory at www.nrel.gov/publications.
Without extensions, RE penetration is lower in 2020 (19%) but is nearly identical by 2030. RE penetration levels are lower under the Low Gas Price scenarios, with about 25% of 2030 electricity generation from RE resources with tax credit extensions and 22% without extensions. As with the capacity results shown previously, most of the growth is met by solar and wind. In fact, for the years and scenarios shown, wind and hydropower make up the largest share of RE generation followed by solar. Biopower and geothermal each comprise about 1% in all cases.
Figure 4. Renewable penetration in the Base Gas Price (left) and Low Gas Price (right) scenarios
A great deal of uncertainty exists for all of these estimates, but especially for any technology- or year-specific estimate. While we present quantitative estimates above to highlight the observed behavior in the scenarios, the qualitative trends in projected RE deployment are likely to provide more insight than any individual quantitative value. These trends indicate that the extended tax credits can have a sizeable impact on future RE installations over the next several years, but their longer-term impact are less certain. Moreover, our results suggest that as enacted, the tax credit extensions appear to impact wind deployment more than new solar capacity.
3.2 Impact on CO2 Emissions Figure 5 shows estimated U.S. electric sector CO2 emissions (relative to 2005) across the modeled scenarios. Despite the recent historical trend of declining electric sector emissions, model results show a slight increase in emissions in the near term under base natural gas price assumptions. In particular, in the absence of the tax credit extensions, emissions rise between 2016 and 2020 largely as a result of increased utilization of existing coal-fired power plants. With tax credit extensions, electric sector emissions hit a trough in 2018 and increase slightly thereafter through 2022 as the tax credits phase out and as a result of growth in electricity consumption. From 2022 onward, annual emissions are nearly identical in the two Base Gas Price scenarios (25% below 2005 levels in 2025 and 32% below in 2030), likely because the CPP becomes a primary driver for CO2 emissions. Nonetheless, cumulative avoided emissions—defined by the differences in estimated emissions in the extension and no-extension scenarios—are estimated. From 2016 to 2030, the Base Gas Price Ext scenario results in 540 MMT less CO2 than the no-extension reference scenario (Figure 6).
0%
5%
10%
15%
20%
25%
30%
35%
No Ext Ext No Ext Ext No Ext Ext
2020 2025 2030
Annu
al P
enet
ratio
n
(% o
f tot
al g
ener
atio
n)
Base Gas Price wind solar hydropower geothermal biopower
0%
5%
10%
15%
20%
25%
30%
35%
No Ext Ext No Ext Ext No Ext Ext
2020 2025 2030An
nual
Pen
etra
tion
(%
of t
otal
gen
erat
ion)
Low Gas Price wind solar hydropower geothermal biopower

19 This report is available at no cost from the National Renewable Energy Laboratory at www.nrel.gov/publications.
Figure 5. Electric sector CO2 emissions relative to 2005 emissions by scenario
Historical emissions data are from the EIA’s November 2015 Monthly Energy Review. Emissions include the portion of the electric sector covered by ReEDS only. This excludes emissions from “direct use” facilities, such as combined heat and power, certain on-site generating systems, and other similar facilities.
With lower natural gas prices, different behavior is observed in terms of electric sector CO2 emissions. In both Low Gas Price scenarios, annual emissions decline until 2020, stay nearly flat from 2020 to 2026, and decline further thereafter. For the Low Gas Price NoExt scenario, electric sector CO2 emissions fall to 28% below 2005 levels in 2020 and remain at that level through 2025. Estimated emissions are even lower under the Low Gas Price Ext scenario at 33% below 2005 levels in 2020, and rising slightly to 32% below 2005 levels by 2025. Under these Low Gas Price scenarios, emissions reductions are largely achieved by increases in natural gas-fired generation at the expense of coal-fired generation. In other words, re-dispatch from coal-fired to natural gas-fired units, which has occurred over the past several years, is anticipated to continue under these scenarios.36 Estimated electric sector emissions in 2030 are estimated to be 32% and 36% below 2005 levels for the Low Gas Price NoExt and Low Gas Price Ext scenarios, respectively. The impact of tax credit extensions on cumulative emissions, under lower natural gas price assumptions, are estimated to be substantial, particularly as tax credit-driven RE displaces fossil generation for nearly all years through 2030 and tends to displace a greater share of coal-fired generation. The Low Gas Price Ext scenario results in 1,420 MMT of cumulative (2016–2030) avoided CO2 emissions (Figure 6). In fact, under low natural gas price assumptions, emissions reductions extend beyond 2030.
36 While new natural gas-fired capacity is estimated under the Low Gas Price scenarios, the increase in natural gas-fired generation is achieved largely through increasing electricity production in existing natural gas-fired facilities.
0%
20%
40%
60%
80%
100%
120%
2000 2005 2010 2015 2020 2025 2030
Annu
al C
O2 E
mis
sion
s (%
of 2
005)
Historical
Base Gas Price Ext
Base Gas Price NoExt
Low Gas Price Ext
Low Gas Price NoExt
Historical (EIA) Modeled
20 This report is available at no cost from the National Renewable Energy Laboratory at www.nrel.gov/publications.
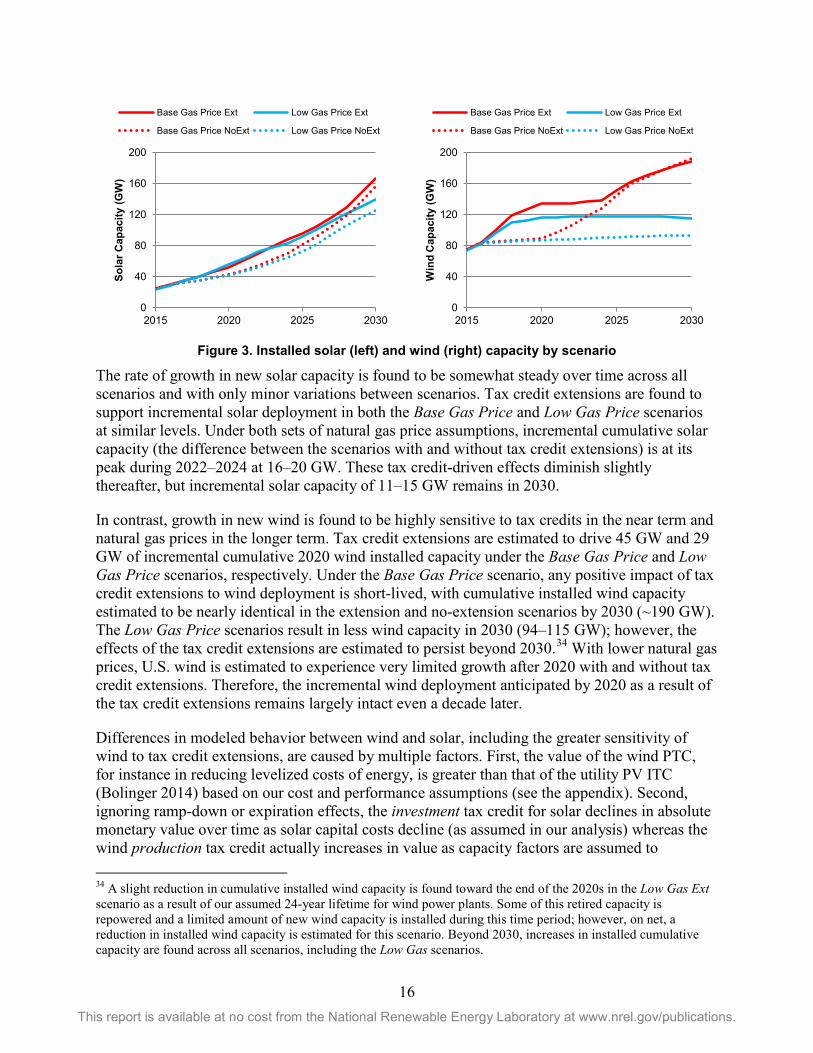
Figure 6. Annual (left) and cumulative (right) avoided CO2 emissions as a result of incremental RE
driven by the tax credit extensions
Avoided emissions are defined as the difference in CO2 emissions between scenarios with and without tax credit extensions. Positive values indicate greater emissions in the scenarios without extensions.
According to the scenarios, tax credit-driven increases in RE displace fossil fuel-based generation, and thereby avoid CO2 emissions. The amount of avoided emissions depends on the mix of fossil fuel displaced, which in turn depends primarily on the relative price of coal and natural gas fuel. Figure 7 shows estimated average natural gas prices and annual natural gas consumption in the U.S. electric sector across the modeled scenarios. As described in Section 2.2, natural gas prices are driven by the underlying natural gas resource, delivery, and demand assumptions from the AEO cases used in our two sets of scenarios (Base Gas Price and Low Gas Price). Natural gas prices are also adjusted endogenously in ReEDS as a function of electric sector natural gas consumption. Figure 7 shows the combined results from these two effects. The largest differences across scenarios are driven by the underlying natural gas resource and supply assumptions. In the Base Gas Price scenarios, delivered natural gas prices increase steadily to a peak of nearly $6.50/MMBtu during the mid-2020s while gas consumption stays relatively flat across all years. In the Low Gas Price scenarios, natural gas prices remain in a narrow range between $4/MMBtu and $4.50/MMBtu for most years while consumption increases steadily through 2030. There are also minor price differences between extension and no extension scenarios with the same underlying natural gas resource assumptions (solid versus dotted lines in Figure 7 [left]). These differences reflect modeled natural gas price-suppression effects from the incremental RE generation.37
37 RE-driven impacts to natural gas producers and consumers have been estimated in other contexts (e.g., DOE 2015a; Wiser et al. 2016), but we have not estimated these impacts in the present analysis.
0
20
40
60
80
100
120
140
160
201620172018201920202021202220232024202520262027202820292030
Annu
al A
void
ed C
O2 E
mis
sion
s (M
MT)
Base Gas Price Low Gas Price
0
200
400
600
800
1,000
1,200
1,400
1,600
201620172018201920202021202220232024202520262027202820292030C
umul
ativ
e Av
oide
d C
O2 E
mis
sion
s (M
MT)
Base Gas Price Low Gas Price

21 This report is available at no cost from the National Renewable Energy Laboratory at www.nrel.gov/publications.
Natural gas prices are found to play a significant role in determining the extent to which CO2 emissions are lower in the scenarios with tax credit extensions as these prices dictate the mix of displaced fossil generation. For example, the ratio of fossil fuel-based generation displaced by tax credit extension-driven incremental RE from 2016 to 2030 is estimated to be about 80:20 natural gas-fired generation to coal-fired generation in the Base Gas Price scenario compared with 30:70 in the Low Gas Price Scenario. In other words, ReEDS estimates that coal is much more likely to be on the margin with lower natural gas prices. These dynamics impact the absolute CO2 emissions estimated in the scenarios as well as the estimated incremental emissions impacts of the RE tax credit extensions.
Figure 7. Model-estimated electric sector natural gas price (left) and consumption (right) by
scenario
Natural gas consumption includes the portion of the electric sector covered by ReEDS only. This excludes “direct use” natural gas consumption from combined heat and power, certain on-site generating systems, and other similar facilities.
$0
$1
$2
$3
$4
$5
$6
$7
$8
2015 2020 2025 2030Nat
ural
Gas
Pric
e (2
015$
/MM
Btu
)
Base Gas Price Ext Low Gas Price Ext
Base Gas Price NoExt Low Gas Price NoExt
0
2
4
6
8
10
12
14
2015 2020 2025 2030
Nat
ural
Gas
Con
sum
ptio
n (Q
uadr
illio
n B
tu)
Base Gas Price Ext Low Gas Price Ext
Base Gas Price NoExt Low Gas Price NoExt

22 This report is available at no cost from the National Renewable Energy Laboratory at www.nrel.gov/publications.
4 Conclusions We estimate that extending federal RE tax credits, as enacted in the Consolidated Appropriations Act of 2016, can boost RE deployment through the early 2020s. However, longer-term deployment effects are less certain because deployment drivers including future natural gas prices, RE cost reductions, and the CPP could play a more substantial role in the 2020s and beyond. More rapid RE growth—driven by the tax credits—can result in significant cumulative CO2 emissions reductions. Further research is needed to understand the implications of the tax credit extensions for RE manufacturing and supply chains, as well as technology advancements through learning and infrastructure needs. We also acknowledge the need to quantify impacts to electricity consumers and taxpayers as well as other impacts to the economy and the environment. Despite these scope limitations, our findings suggest that tax credit extensions can have a measurable impact on future RE deployment and electric sector CO2 emissions.

23 This report is available at no cost from the National Renewable Energy Laboratory at www.nrel.gov/publications.
References Arce, Miguel Pérez de, Enzo Sauma, and Javier Contreras. 2016. “Renewable Energy Policy Performance in Reducing CO2 Emissions.” Energy Economics 54 (February 2016): 272–80. http://dx.doi.org/10.1016/j.eneco.2015.11.024.
Barradale, Merrill Jones. 2010. “Impact of Public Policy Uncertainty on Renewable Energy Investment: Wind Power and the Production Tax Credit.” Energy Policy 38 (12, December 2010): 7698–7709. http://dx.doi.org/10.1016/j.enpol.2010.08.021.
BNEF (Bloomberg New Energy Finance). 2015a. “U.S. Tax Credits: A Colossal Boost for Wind & Solar.”
———. 2015b. “Q2 2015 North American Gas Outlook: Short the Curve.”
Bolinger, Mark. 2014. An Analysis of the Costs, Benefits, and Implications of Different Approaches to Capturing the Value of Renewable Energy Tax Incentives. Berkeley, CA: Lawrence Berkeley National Laboratory. LBNL-6610E.
Bolinger, Mark, and Joachim Seel. 2015. Utility-scale Solar 2015. Berkeley, CA: Lawrence Berkeley National Laboratory. LBNL-1000917.
Burns, John Edward, and Jin-Su Kang. 2012. “Comparative Economic Analysis of Supporting Policies for Residential Solar PV in the United States: Solar Renewable Energy Credit (SREC) Potential.” Energy Policy 44 (May 2012): 217–25. http://dx.doi.org/10.1016/ j.enpol.2012.01.045.
Cole, Wesley, Trieu Mai, Kelly Eurek, Daniel C. Steinberg, and Robert Margolis. 2015. “Considering the Role of Solar Generation under Rate-Based Targets in the EPA's Proposed Clean Power Plan.” Paper presented at Energy Policy Institute's Fifth Annual Energy Policy Research Conference. The Electricity Journal 28 (8, October 2015): 20–28. doi:10.1016/j.tej.2015.09.002.
Comello, Stephen, and Stefan Reichelstein. 2016. “The U.S. Investment Tax Credit for Solar Energy: Alternatives to the Anticipated 2017 Step-Down.” Renewable and Sustainable Energy Reviews 55 (March 2016). http://dx.doi.org/10.1016/j.rser.2015.10.108.
Denholm, Paul, Easan Drury, and Robert Margolis. 2009. The Solar Deployment System (SolarDS) Model: Documentation and Sample Results. Golden, CO: National Renewable Energy Laboratory. NREL/TP-6A20-45832.
DOE (U.S. Department of Energy). 2012. SunShot Vision Study. DOE/GO-102012-3037.
———. 2015a. Wind Vision: A New Era for Wind Power in the United States. DOE/GO-102015-4557.
———. 2015b. 2014 Renewable Energy Data Book. DOE/GO-102015-4724.

24 This report is available at no cost from the National Renewable Energy Laboratory at www.nrel.gov/publications.
EIA (Energy Information Administration). 2015. Annual Energy Outlook 2015. DOE/EIA-0383(2015). Washington, DC: U.S. DOE Energy Information Administration.
———. 2016. Short-term Energy Outlook. January 2016. Washington, DC: U.S. DOE Energy Information Administration. http://www.eia.gov/forecasts/steo/pdf/steo_full.pdf.
Heeter, Jenny, Travis Lowder, Eric O’Shaughnessy, and John Miller. 2015. Implications of the Scheduled Federal Investment Tax Credit Reversion for Renewable Portfolio Standard Solar Carve-Out Compliance. Golden, CO: National Renewable Energy Laboratory. NREL/TP-6A20-64506.
Lantz, Eric, Daniel Steinberg, Michael Mendelsohn, Owen Zinaman, Ted James, Gian Porro, Maureen Hand, Trieu Mai, Jeffrey Logan, Jennie Heeter, and Lori Bird. 2014. Implications of a PTC Extension on U.S. Wind Deployment. Golden, CO: National Renewable Energy Laboratory. NREL/TP-6A20-61663.
Larsen, John, and Whitney Herndon. 2016. “Renewable Tax Extenders: The Bridge to the Clean Power Plan.” Rhodium Group Notes, January 27. http://rhg.com/notes/renewable-tax-extenders-the-bridge-to-the-clean-power-plan.
Logan, Jeffrey, Anthony Lopez, Trieu Mai, Carolyn Davidson, Morgan Bazilian, and Doug Arent. 2013. “Natural Gas Scenarios in the U.S. Power Sector.” Energy Economics 40 (November 2013): 183–95. NREL/JA-6A50-57087. http://dx.doi.org/10.1016/ j.eneco.2013.06.008
Logan, Jeffrey, Kenneth B. Medlock III, and William C. Boyd. 2015. A Review of Sector and Regional Trends in U.S. Electricity Markets: Focus on Natural Gas. Golden, CO: National Renewable Energy Laboratory. NREL/TP-6A50-64652.
Mai, Trieu, David Mulcahy, M. Maureen Hand, and Samuel F. Baldwin. 2014. “Envisioning a Renewable Electricity Future for the United States.” Energy 65 (1, February 2014): 374–86. http://dx.doi.org/10.1016/j.energy.2013.11.029.
Mai, Trieu, Wesley Cole, Venkat Krishnan, and Mark Bolinger. 2015. “Impact of Federal Tax Policy on Utility-Scale Solar Deployment Given Financing Interactions.” Presentation by the National Renewable Energy Laboratory. Golden, CO: National Renewable Energy Laboratory. NREL/PR-6A20-65014.
Mignone, Bryan K., Thomas Alfstad, Aaron Bergman, Kenneth Dubin, Richard Duke, Paul Friley, Andrew Martinez, Matthew Mowers, Karen Palmer, Anthony Paul, Sharon Showalter, Daniel Steinberg, Matt Woerman, and Frances Wood. 2012. “Cost-Effectiveness and Economic Incidence of a Clean Energy Standard.” Economics of Energy and Environmental Policy 1(3): 59–86. http://dx.doi.org/10.5547/2160-5890.1.3.5.
Munsell, Mike. 2015. “Investment Tax Credit Extension Would Increase US Solar Installations 54% Through 2020.” Greentech Media, December 16. http://www.greentechmedia.com/articles/read/investment-tax-credit-extension-will-increase-solar-installations-54-throug.

25 This report is available at no cost from the National Renewable Energy Laboratory at www.nrel.gov/publications.
NREL (National Renewable Energy Laboratory). 2012. Renewable Electricity Futures Study. Hand, M.M.; Baldwin, S.; DeMeo, E.; Reilly, J.M.; Mai, T.; Arent, D.; Porro, G.; Meshek, M.; Sandor, D. eds. 4 vols. Golden, CO: National Renewable Energy Laboratory. NREL/TP-6A20-52409.
Palmer, Karen, Anthony Paul, Matt Woerman, and Daniel C. Steinberg. 2011. “Federal Policies for Renewable Electricity: Impacts and Interactions.” Energy Policy 39 (7, July 2011): 3975-91. http://dx.doi.org/10.1016/j.enpol.2011.01.035.
Roach, Travis. 2015. “The Effect of the Production Tax Credit on Wind Energy Production in Deregulated Electricity Markets.” Economic Letters 127 (February 2015): 86–88. http://dx.doi.org/10.1016/j.econlet.2014.12.017.
Short, Walter, Patrick Sullivan, Trieu Mai, Matthew Mowers, Caroline Uriarte, Nate Blair, Donna Heimiller, and Andrew Martinez, A. 2011. Regional Energy Deployment System (ReEDS). Golden, CO: National Renewable Energy Laboratory. NREL/TP-6A20-46534.
Shrimali, Gireesh, Melissa Lynes, and Joe Indvik. 2015. “Wind Energy Deployment in the U.S.: An Empirical Analysis of the Role of Federal and State Policies.” Renewable and Sustainable Energy Reviews 43 (March 2015): 796–806. http://dx.doi.org/10.1016/j.rser.2014.11.080.
Sigrin, Benjamin, Michael Gleason, Robert Preus, Ian Baring-Gould, and Robert Margolis. Forthcoming. 2016. The Distributed Generation Market Demand Model (dGen): Documentation. Golden, CO: National Renewable Energy Laboratory. NREL/TP-6A20-65231.
Sullivan, Patrick, Wesley Cole, Nate Blair, Eric Lantz, Venkat Krishnan, Trieu Mai, David Mulcahy, and Gian Porro. 2015. 2015 Standard Scenarios Annual Report: U.S. Electric Sector Scenario Exploration. Golden, CO: National Renewable Energy Laboratory. NREL/TP-6A20-64072.
West Virginia Office of the Attorney General. 2016. “Attorney General Morrisey Hails Historic and Unprecedented Victory Against EPA.” Press release, February 9. http://www.ago.wv.gov/pressroom/2016/Pages/Attorney-General-Morrisey-Hails-Historic-and-Unprecedented-Victory-Against-EPA.aspx.
Wiser, Ryan, and Mark Bolinger. 2015. 2014 Wind Technology Market Report. U.S. Department of Energy. DOE/GO-102015-4702.
Wiser, Ryan, Galen Barbose, Jenny Heeter, Trieu Mai, Lori Bird, Mark Bolinger, Alberta Carpenter, Garvin Heath, David Keyser, Jordan Macknick, Andrew Mills, and Dev Millstein. 2016. A Retrospective Analysis of the Benefits and Impacts of U.S. Renewable Portfolio Standards. Lawrence Berkeley National Laboratory and National Renewable Energy Laboratory. NREL/TP-6A20-65005.
Zinaman, Owen, Trieu Mai, Eric Lantz, Rachel Gelman, and Gian Porro. 2014. “ReEDS Modeling of the President's 2020 U.S. Renewable Electricity Generation Goal.” Presentation by the National Renewable Energy Laboratory. Golden, CO: National Renewable Energy Laboratory. NREL/PR-6A20-62077.

26 This report is available at no cost from the National Renewable Energy Laboratory at www.nrel.gov/publications.
Appendix This appendix provides greater details for certain key input assumptions, including solar and wind technology costs, and select model results, including individual renewable technology capacity results and estimated annual net renewable capacity changes by scenario.
Figures A1 and A2 show the implied projected levelized costs of energy (LCOE) for utility-scale PV and land-based wind, respectively, based on the technology and financing assumptions used in the analysis (Section 2.2, Mai et al. 2015). The LCOEs include the estimated future impacts of the federal tax incentives before and after extensions from the Consolidated Appropriations Act of 2016 (see Table 1) as well as assumed changes to technology cost and performance (Section 2.2). Dates shown represent commercial operations dates and take into account the commenced-construction provision. The different lines represent the range of capacity factors driven by regionally varying resource quality modeled in ReEDS. The LCOEs shown do not include regional capital cost multipliers or grid interconnection costs, which are considered in ReEDS. Figure A3 compares the range of utility PV and land-based wind LCOEs when factoring in the new RE tax credit extensions and associated ramp-down schedule.
Figure A1. Estimated implied levelized cost of energy (LCOE) for utility PV before and after tax credit extensions
$-
$20
$40
$60
$80
$100
$120
$140
2015 2020 2025 2030
LCO
E (2
015$
/MW
h)
Utility PV
Worst Quality Resource Medium Quality Resource
Highest Quality Resource
Solid and dotted lines show LCOEs with and without the tax credit extensions, respectively.
27 This report is available at no cost from the National Renewable Energy Laboratory at www.nrel.gov/publications.
Figure A2. Estimated implied levelized cost of energy (LCOE) for land-based wind before and after tax credit extensions
Figure A3. Comparison of estimated utility PV and wind implied LCOEs based on the assumed cost reductions and tax credit schedule from the Consolidated Appropriates Act of 2016.
$-
$20
$40
$60
$80
$100
$120
$140
2015 2020 2025 2030
LCO
E (2
015$
/MW
h)
Land-based Wind
Worst Quality Resource Medium Quality Resource
Highest Quality Resource
Solid and dotted lines show LCOEs with and without the tax credit extensions, respectively.
$0
$20
$40
$60
$80
$100
$120
$140
2015 2020 2025 2030
LCO
E (2
015$
/MW
h)
Utility PV Range
Wind Range
LCOE ranges reflect regional differences in modeled solar and wind resources. Green shades indicate overlap between utility PV and wind LCOE ranges.

28 This report is available at no cost from the National Renewable Energy Laboratory at www.nrel.gov/publications.
Figures A4-A10 present deployment results across all four modeled scenarios for each RE technology individually. (Note the different y-axis ranges in the figures presented.)
Figure A4. Installed biopower capacity by scenario
Figure A5. Installed geothermal capacity by scenario
0123456789
10
2015 2020 2025 2030
Bio
pow
er C
apac
ity (G
W)
Base Gas Price Ext Low Gas Price Ext
Base Gas Price NoExt Low Gas Price NoExt
0123456789
10
2015 2020 2025 2030
Geo
ther
mal
Cap
acity
(GW
)
Base Gas Price Ext Low Gas Price Ext
Base Gas Price NoExt Low Gas Price NoExt

29 This report is available at no cost from the National Renewable Energy Laboratory at www.nrel.gov/publications.
Figure A6. Installed hydropower capacity by scenario
Figure A7. Installed wind capacity by scenario
0102030405060708090
100
2015 2020 2025 2030
Hyd
ropo
wer
Cap
acity
(GW
)
Base Gas Price Ext Low Gas Price Ext
Base Gas Price NoExt Low Gas Price NoExt
0
40
80
120
160
200
2015 2020 2025 2030
Win
d C
apac
ity (G
W)
Base Gas Price Ext Low Gas Price Ext
Base Gas Price NoExt Low Gas Price NoExt

30 This report is available at no cost from the National Renewable Energy Laboratory at www.nrel.gov/publications.
Figure A8. Installed concentrating solar power capacity by scenario
Figure A9. Installed utility PV capacity by scenario
0.0
0.5
1.0
1.5
2.0
2.5
3.0
3.5
4.0
2015 2020 2025 2030
CSP
Cap
acity
(GW
)
Base Gas Price Ext Low Gas Price Ext
Base Gas Price NoExt Low Gas Price NoExt
0102030405060708090
100
2015 2020 2025 2030
Util
ity P
V C
apac
ity (G
W)
Base Gas Price Ext Low Gas Price Ext
Base Gas Price NoExt Low Gas Price NoExt
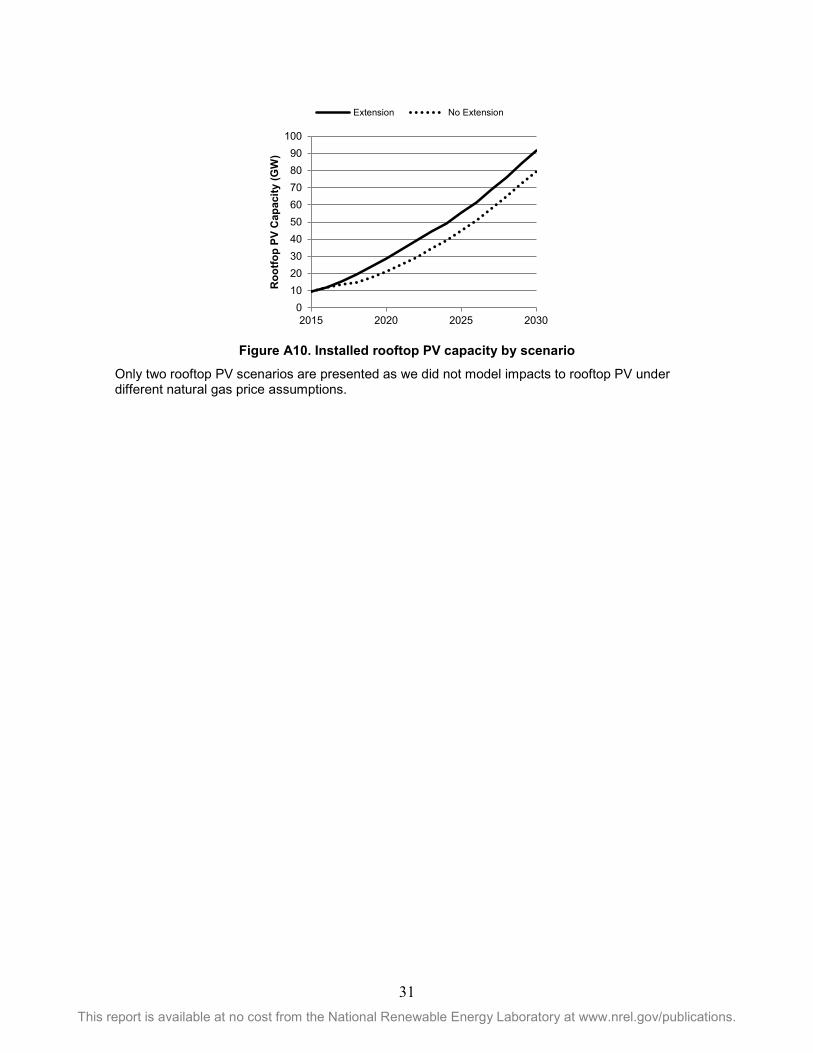
31 This report is available at no cost from the National Renewable Energy Laboratory at www.nrel.gov/publications.
Figure A10. Installed rooftop PV capacity by scenario
Only two rooftop PV scenarios are presented as we did not model impacts to rooftop PV under different natural gas price assumptions.
0102030405060708090
100
2015 2020 2025 2030
Roo
tfop
PV C
apac
ity (G
W)
Extension No Extension

32 This report is available at no cost from the National Renewable Energy Laboratory at www.nrel.gov/publications.
Tables A1 and A2 present estimated net installed capacity change for solar, wind, and “all RE” across Base Gas Price and Low Gas Price scenarios, respectively. Table A3 presents historical annual RE capacity changes from 2001 to 2014 from the 2014 Renewable Energy Data Book (DOE 2015b).38 Values represent net changes in installed capacity from the prior year, wherein the net changes account for retired capacity, repowered capacity, and new greenfield capacity. Negative annual additions reflect net reductions in installed capacity driven by assumed retirements. Values repeat within each two-year period reflecting the two-year solve resolution of the models. Solar capacity includes utility-scale PV and CSP, and rooftop PV. All RE values include biopower, geothermal, hydropower, solar, and wind. Positive values in the “Difference” column reflect greater annual deployment in the extension scenario.
Table A1. Estimated Annual Change in RE Cumulative Installed Capacity in the Base Gas Price Scenarios (MW)
Solar Wind All RE Ext NoExt Difference Ext NoExt Difference Ext NoExt Difference
2016 5,770 5,770 0 9,520 9,520 0 16,510 16,510 0 2017 5,180 2,500 2,680 17,220 1,420 15,800 24,240 5,910 18,330 2018 5,180 2,500 2,680 17,220 1,420 15,800 24,240 5,910 18,330 2019 6,060 3,830 2,230 7,870 1,340 6,530 14,820 6,530 8,290 2020 6,060 3,830 2,230 7,870 1,340 6,530 14,820 6,530 8,290 2021 8,910 5,720 3,190 350 8,080 -7,730 10,170 15,530 -5,360 2022 8,910 5,720 3,190 350 8,080 -7,730 10,170 15,530 -5,360 2023 8,570 8,140 430 1,750 11,330 -9,580 12,120 20,240 -8,120 2024 8,570 8,140 430 1,750 11,330 -9,580 12,120 20,240 -8,120 2025 8,870 10,550 -1,680 12,430 15,870 -3,440 21,630 26,460 -4,830 2026 8,870 10,550 -1,680 12,430 15,870 -3,440 21,630 26,460 -4,830 2027 11,850 13,540 -1,690 7,090 8,140 -1,050 19,200 21,820 -2,620 2028 11,850 13,540 -1,690 7,090 8,140 -1,050 19,200 21,820 -2,620 2029 19,130 18,920 210 5,160 7,660 -2,500 24,820 27,140 -2,320 2030 19,130 18,920 210 5,160 7,660 -2,500 24,820 27,140 -2,320
38 We present historical and model-estimated future capacity in AC terms for all technologies except PV, which is reported in DC terms. This convention is consistent with past ReEDS reporting and is adopted due to uncertainties associated with future inverter loading ratios. One can convert the PV capacity to AC terms by dividing by the inverter loading ratio, which is implicitly assumed to be 1.1 in ReEDS and dSolar, but has been observed to be much higher for newer utility-scale PV plants (Bolinger and Seel 2015).

33 This report is available at no cost from the National Renewable Energy Laboratory at www.nrel.gov/publications.
Table A2. Estimated Annual Change in RE Installed Capacity in the Low Gas Price Scenarios (MW)
Solar Wind All RE Ext NoExt Difference Ext NoExt Difference Ext NoExt Difference
2016 5,520 5,680 -160 9,020 8,840 180 15,590 15,570 20 2017 5,730 2,510 3,220 13,380 1,310 12,070 20,550 5,550 15,000 2018 5,730 2,510 3,220 13,380 1,310 12,070 20,550 5,550 15,000 2019 7,310 3,620 3,690 3,130 960 2,170 11,020 5,350 5,670 2020 7,310 3,620 3,690 3,130 960 2,170 11,020 5,350 5,670 2021 8,440 5,180 3,260 680 610 70 9,920 6,800 3,120 2022 8,440 5,180 3,260 680 610 70 9,920 6,800 3,120 2023 5,570 6,080 -510 120 1,020 -900 6,720 7,720 -1,000 2024 5,570 6,080 -510 120 1,020 -900 6,720 7,720 -1,000 2025 8,710 8,700 10 -220 520 -740 9,410 10,090 -680 2026 8,710 8,700 10 -220 520 -740 9,410 10,090 -680 2027 10,430 12,080 -1,650 370 650 -280 11,730 13,240 -1,510 2028 10,430 12,080 -1,650 370 650 -280 11,730 13,240 -1,510 2029 8,970 9,540 -570 -1,380 400 -1,780 7,940 10,390 -2,450 2030 8,970 9,540 -570 -1,380 400 -1,780 7,940 10,390 -2,450
Table A3. Historical Annual Change in RE Installed Capacity (MW)
Solar Wind All RE 2001 11 1,697 1,573 2002 23 411 868 2003 45 1,667 1,674 2004 58 372 717 2005 79 2,396 2,923 2006 106 2,454 3,009 2007 224 5,237 5,723 2008 298 8,425 9,725 2009 393 9,918 11,047 2010 930 5,112 6,631 2011 1,922 6,649 8,716 2012 3,369 13,089 17,570 2013 5,186 1,102 7,199 2014 6,968 4,772 12,823