impacto del capital privado 2018 - ascri.org · the spanish venture capital & private equity...
TRANSCRIPT

ASOCIACIÓN ESPAÑOLADE CAPITAL, CRECIMIENTOE INVERSION
IMPACTO ECONÓMICO Y SOCIALDEL CAPITAL PRIVADO EN LASOPERACIONES DE MIDDLE MARKETEN ESPAÑA
ECONOMIC AND SOCIAL IMPACT OF PRIVATE EQUITY & VENTURE CAPITAL IN MIDDLE MARKET TRANSACTIONS IN SPAIN
2018

The Spanish Venture Capital & Private Equity Association (AS-CRI) is the industry body that units and represents the sec-tor to the authorities, Government, institutions, investors, en-trepreneurs and media. ASCRI regularly publishes studies and provides statistics and updated information regarding the de-velopment of this industry and its legal and fiscal framework.
ASCRI also organizes a range of activities (training courses, events and round tables) for the members and general public in order to disseminate and reinforce the contribution of the Venture Capital & Private Equity industry for the economy and growth of SMEs in Spain.
ASCRI comprises more than 100 national and international Venture Capital & Private Equity firms, 10 limited partners and 70 service providers, spreading and ensuring the profession-al standards among its members: transparency, good gover-nance and best practice.
Este informe ha sido elaborado por / this report has been produced by:
José Martí Pellón / Universidad Complutense de Madrid
Ángela Alférez / Asociación de Capital, Crecimiento e Inversión (ASCRI)
All rights reserved
ASCRI / webcapitalriesgo.
Este documento puede descargarse de forma gratuita en:
www.ascri.org
www.pwc.es/es/deals.html
www.webcapitalriesgo.com
Diseño y maquetación / Design and layout: Art Factory Comunicación
Impresión / Printing: Grafistaff
La Asociación Española de Capital, Crecimiento e Inversión (ASCRI) es el organismo que representa a la industria del Ven-ture Capital & Private Equity (VC & PE) ante las autoridades, Gobierno, instituciones, inversores, empresarios y medios de comunicación. Publica estudios de forma regular y proporcio-na estadísticas e información actualizada sobre la evolución del sector y su marco legal y fiscal.
La patronal española del VC & PE también organiza una serie de actividades (cursos de formación, eventos y mesas redon-das) para los socios y público en general con el fin de difundir y reforzar la contribución del Capital Privado a la economía y el crecimiento de las pymes en España.
ASCRI agrupa a más de 100 firmas nacionales e internacio-nales de Venture Capital & Private Equity; 70 proveedores de servicios y 10 socios inversores (limited partners); difunde y garantiza los estándares profesionales entre sus miembros: la transparencia, las mejores prácticas y el buen gobierno.

IMPACTO ECONÓMICO Y SOCIALDEL CAPITAL PRIVADO EN LASOPERACIONES DE MIDDLE MARKETEN ESPAÑA
ECONOMIC AND SOCIAL IMPACT OF PRIVATE EQUITY & VENTURE CAPITAL IN MIDDLE MARKET TRANSACTIONS IN SPAIN
2018
ASOCIACIÓN ESPAÑOLADE CAPITAL, CRECIMIENTOE INVERSION
Patrocinado por / Sponsored by: Con la colaboración de/ in collaboration with:
Fundación ICO

Jaime Bergel, Managing Director Spain HIG European Capital Group
Malcolm Lloyd, Socio responsable de Deals en España, EMEA y Global – PwCIgnacio de Garnica, Socio de Deals responsable de Private Equity - PwC
Las conclusiones del presente informe vuelven a demostrar el papel del Capital Privado como claro dina-mizador de las compañías y de la economía española en general. La inversión de Capital Privado no solo impulsa el crecimiento de las empresas, sino que lo acelera, crea más empleo y mejora la rentabilidad
de las mismas. Como factores clave que hacen posible lo anterior caben destacar: la aportación de un asesoramiento experimentado, la profesionalización de los equipos gestores de la cartera de participadas, la apertura a enfoques in-novadores de negocio y la adaptabilidad a un entorno en constante cambio. El modelo implementado por el Capital Privado ha demostrado que funciona en cualquier momento del ciclo económico incluso en períodos de recesión eco-nómica. El Capital Privado es por tanto sinónimo de éxito y por ello desde PwC hemos hecho una decidida apuesta por el sector, conscientes del rol que desempeña en la economía española.
Esta nueva edición del Informe de Impacto Económico y Social del Capital Privado en las operaciones de mid-market en España vuelve a ilustrar con datos reales la importante aportación de las empresas parti-cipadas por los operadores de Capital Privado en España. Esta aportación, que se traduce en los diferen-
tes sectores de la economía tanto en términos de creación de empleo, de crecimiento de las empresas, de incremento de la inversión, es además muy relevantes en entornos económicos favorables y desfavorables, lo que hace del Capital Privado un instrumento ideal para las empresas españolas para asegurar su viabilidad y crecimiento a largo plazo. Des-de HIG Capital queremos agradecer a ASCRI la importante labor que realizan para dar a conocer el sector y su apor-tación a la economía desde su fundación, nos complace poder colaborar en la edición de este informe.

5IMPACTO ECONÓMICO Y SOCIAL DEL CAPITAL PRIVADO EN LAS OPERACIONES DE MIDDLE MARKET EN ESPAÑA 2018 ASCRI
1. Presentación del informe Report Introduction 6
2. Resumen ejecutivo Executive Summary 8
3. El Capital Privado genera empleo de forma consistente Private Equity & Venture Capital consistently creates jobs 18
4. El Capital Privado acelera el crecimiento de las empresas Private Equity & Venture Capital drives business growth 20
5. El Capital Privado mejora la rentabilidad en las empresas Private Equity & Venture Capital increases business profitability 22
6. El Capital Privado fomenta la inversión Private Equity & Venture Capital promotes investment 24
7. El Capital Privado apoya a las empresas en periodos de crisis Private Equity & Venture Capital Provides support to businesses in times of crisis 26
8. El Capital Privado contribuye al crecimiento en diferentes sectores Private Equity & Venture Capital contributes to growth in different sectors 30
9. Ámbito y metodología del estudio Study, Scope and Methodology 36
10. Cuadros detallados del informe Detailed Report Tables 40
ÍNDICE / CONTENTS

6
El año 2017 ha marcado un récord histórico para el Venture Ca-pital & Private Equity en nuestro país. Ha supuesto la confirma-ción de la recuperación y la demostración de que este sector resulta fundamental para los empresarios y las pymes no sólo de España, sino a nivel europeo. La internacionalización y la exportación de las empresas españolas es uno de los ejes bási-cos de nuestra economía y es el momento de impulsarlas, ha-ciéndolas ganar en tamaño y volviéndolas más competitivas.
En ASCRI, asociación formada por los socios gestores, inverso-res y asesores, conformamos el ecosistema que el sector ne-cesita para fomentar la inversión y aportar el capital y el know how que las empresas requieren para crecer y salir a otros mer-cados. Todo ello teniendo en cuenta los factores medioambien-tales, sociales y de gobierno corporativo (ESG), principios a partir de los cuales se deben articular las compañías para estar al día con las tendencias actuales y los compromisos globales.
Este informe evalúa el impacto del Capital Privado en el sec-tor empresarial de España, analizando las inversiones de 10 a 100 millones de euros comprometidas por entidades de Capi-tal Privado en empresas españolas entre los años 2005 y 2012.
PRESENTACIÓN DEL INFORME REPORT INTRODUCTION
1. PRESENTACIÓN DEL INFORME

7IMPACTO ECONÓMICO Y SOCIAL DEL CAPITAL PRIVADO EN LAS OPERACIONES DE MIDDLE MARKET EN ESPAÑA 2018 ASCRI
2017 was a record breaking year for Venture Capital & Private Equity in Spain. Without a doubt, it is a clear sign of recovery for 2017, showing the leading role carried out by this sector for SME's and Entrepreneurs, both in Spain and throughout Eu-rope. The internationalization and exports (manufactured, pro-duced) by Spanish companies is one of the main foundations of Spain's economy and it has reached a point were we must foster growth of these companies by means of business ex-pansion and competitiveness.
ASCRI, as the association of managing partners, Limited Part-ners and advisors, shapes the ecosystem needed in the sector to drive growth of investment and contribute to provide the capital and know-how required for company growth and ex-pansion into new markets. All of these taking into account So-cially Responsible Investing (ESG), on the basis of which com-panies should act in order to remain up to date with global trends and commitments.
This report assesses the impact of Venture Capital & Private Equity on the Spanish business sector, analyzing Venture Cap-ital & Private Equity investments between €10-100MM car-ried out by Spanish companies from 2005 to 2012. This study shows that the financial backing and management support provided by Venture Capital & Private Equity has enabled its portfolio companies to create jobs, while growing faster, more sustainibly and with higher returns, than non-portfolio compa-nies: the effects of Venture Capital & Private Equity on these companies will be a lasting one.
In ASCRI we would like to stress on the role of Venture Capi-tal & Private Equity as an economic growth driver, highlighting the strength of the investments made by this sector, as well as their positive impact on their portfolio companies and, there-fore, on the Spanish economy as a whole.
We would like to express our gratitude to the Sponsors –HIG European Capital Group and PwC– for their trust and confi-dence in ASCRI, Fundación ICO as colaborator of this report, as well as for Prof. José Martí Pellón for his undivided dedication.
Juan Luis Ramírez, ASCRI Chairman
José Zudaire, ASCRI Managing Director
El estudio demuestra cómo el apoyo financiero y en la ges-tión que ofrece el Capital Privado ha permitido a las empresas participadas crear empleo, crecer más y de manera más sos-tenible y ser más rentables que las empresas no participadas. Además, los efectos del Capital Privado sobre estas compa-ñías perduran en el tiempo.
Desde ASCRI queremos trasladar la contribución del Capital Privado como agente dinamizador del entorno económico, po-niendo de relevancia la solidez de las inversiones que se reali-zan desde el sector, así como el impacto positivo que las mis-mas tienen sobre las empresas participadas y por tanto sobre la economía española en su conjunto.
Nuestro agradecimiento a las entidades patrocinadoras de este informe, HIG European Capital Group y PwC por la con-fianza depositada en ASCRI, la colaboración de la Fundación ICO y al Catedrático José Martí Pellón por su dedicación.
Juan Luis Ramírez, Presidente de ASCRI
José Zudaire, Director General de ASCRI

8
INTRODUCCIÓN
Gracias a la financiación proveniente del Capital Privado, su aportación de capital y apoyo en la gestión, las empresas cre-cen en términos de empleo, ventas, beneficios e inversión, tal y como muestran los resultados del presente informe. Estos re-sultados son todavía más positivos cuando se comparan con el grupo de empresas no financiadas por el Capital Privado.
Durante sus más de 30 años de existencia, esta industria ha ex-perimentado un notable desarrollo: Entre 2000 y 2017, el nú-mero de operadores registrados en España ha pasado de 71 a 258, habiendo invertido alrededor de 44.000 millones de eu-ros en más de 7.500 empresas. Al final del año 2017, la carte-
ra de participadas por el sector estaba compuesta por más de 2.760 empresas, el 92% de las cuales son PYMES. Teniendo en cuenta que más del 65% del PIB español está compuesto por PYMES, el sector del Capital Privado se ha convertido en un di-namizador fundamental del sector empresarial.
No obstante, los niveles están todavía lejos de los principales mercados de Capital Privado europeos. En términos de PIB, la inversión de Capital Privado en España se sitúa en el 0,34% frente a la de Francia (0,56%) u Holanda (0,53%)1. Por ello, si-gue siendo necesario el apoyo a este instrumento de financia-ción enfocado principalmente hacía la PYME, con medidas que
RESUMEN EJECUTIVO EXECUTIVE SUMMARY
2. RESUMEN EJECUTIVO

9IMPACTO ECONÓMICO Y SOCIAL DEL CAPITAL PRIVADO EN LAS OPERACIONES DE MIDDLE MARKET EN ESPAÑA 2018 ASCRI
estimulen y consoliden el sector de Capital Privado en España para que alcance los niveles de presencia que tiene en otras economías desarrolladas, y de paso conseguir unas empresas más grandes, más globales y más competitivas, que contribu-yan a un mayor crecimiento de la economía española.
1) “2016 European Private Equity Activity”. Invest Europe, 2017.
INTRODUCTION
Thanks to Private Equity & Venture Capital funding and its con-tribution of funds and management support, companies are growing in terms of employment, sales, profits and investment, as shown in the results of this report. These results are further supported by comparison to companies not funded by Private Equity & Venture Capital.
The Private Equity & Venture Capital industry has undergone incredible growth over its more than 30 years of existence. The number of registered operators in Spain increased from 71 in 2000, to 258 in 2017. Private Equity & Venture Capital has in-vested close to €44,000 million in over 7,500 companies. At the end of 2017, the portfolio of investee companies included more than 2,760 companies, 92% of which were SMEs. Consid-ering the fact that SMEs account for over 65% of the Spanish GDP, the Private Equity & Venture Capital sector has become a key growth driver for these companies.
Nevertheless, levels are still far from those of the primary mar-kets in Europe. Private Equity & Venture Capital investment in Spain accounts for 0.34% of GDP, as compared to France (0.56%) and Holland (0.53%)1. This means that support for this funding instrument, which is primarily focused on SMEs, is still necessary, including measures that stimulate and strengthen the Private Equity & Venture Capital sector in Spain so as to reach a footprint comparable to other developed economies and, in doing so, companies in general will become larger, more globalized and competitive, thus contributing to faster growth of the Spanish economy.
1) "2016 European Private Equity Activity." Invest Europe, 2017.
10
MARCO DEL ESTUDIO2
El estudio “Impacto económico y social del capital privado en las operaciones de middle market en España” se ha enfocado en el conjunto de empresas que recibieron inversión de Capi-tal Privado para financiar su crecimiento y consolidación en-tre 10 millones de euros y 100 millones de euros en el periodo 2005-2012. Se mide la evolución de sus principales indicadores económicos, comparándolos con los obtenidos por un grupo similar de empresas que no recibieron financiación de Capital Privado (de ahora en adelante “grupo de control”3).
Por lo tanto, en este estudio se analizan 186 empresas apoya-das por Capital Privado y 186 empresas que componen el gru-po de control. Los resultados obtenidos se han planteado des-de dos perspectivas analíticas distintas4:
(1) Perspectiva agregada obtenida de todas las empresas con-sideradas de la muestra por una parte, y del grupo de control por otra.
(2) Perspectiva desagreagada, calculando el crecimiento medio por empresa, diferenciando igualmente entre los dos colectivos.
Ambas perspectivas se analizan con una temporalidad a corto plazo, para medir el impacto inmediato de la inversión de ca-pital privado (resultados de los primeros 3 años, una vez rea-lizada la inversión) y por otra la persistencia de su efecto a lo largo del tiempo (crecimiento agregado desde que se realizó la inversión hasta el año 2015, abarcando años con un entorno económico expansivo y años con un entorno recesivo).
2) Para conocer con mayor detalle de la metodología del estudio, consultar el ca-pítulo 9 de este informe.
3) De las 191 empresas que componían la muestra inicial por ser las empresas in-vertidas por el Capital Privado en el periodo (2005-2012), fue posible identificar 186 empresas comparables válidas (grupo de control), no siendo posible encon-trar su correspondiente para 5 empresas de la muestra, por su considerable tama-ño. Los resultados del impacto de las 191 empresas se puede ver en el punto 1 del apartado 10.
4) El detalle estadístico del informe se puede consultar en el apartado 10.
SE HAN ANALIZADO 186 EMPRESAS APOYADAS POR CAPITAL PRIVADO Y 186 EMPRESAS SIN FINANCIACIÓN
DE CAPITAL PRIVADO QUE COMPONEN EL GRUPO DE CONTROL
2. RESUMEN EJECUTIVO

11IMPACTO ECONÓMICO Y SOCIAL DEL CAPITAL PRIVADO EN LAS OPERACIONES DE MIDDLE MARKET EN ESPAÑA 2018 ASCRI
THIS STUDY ANALYZES 186 COMPANIES FUNDED BY PRIVATE EQUITY & VENTURE
CAPITAL AND 186 COMPANIES IN THE CONTROL GROUP
STUDY FRAMEWORK2
The “Economic and Social Impact of Private Equity & Venture Capital in Middle Market Transactions in Spain” study focused on companies receiving Private Equity & Venture Capital in-vestments to fund their growth and consolidation, with invest-ments ranging from €10M–100M in the 2005–2012 period. The performance of key financial indicators was measured and compared to the indicators from a similar group of companies not receiving Private Equity & Venture Capital funding (herein-after, the “control group”)3.
This study analyzes 186 companies funded by Private Equity & Venture Capital and 186 companies in the control group. The results obtained are presented from two different analytical perspectives4:
(1) Aggregate perspective: obtained from all sample compa-nies on the one hand, and from the control group on the oth-er hand.
(2) Disaggregate perspective: calculated as the average per company growth, also differentiated between the two groups.
Both perspectives are analyzed in the short term in order to measure the immediate impact of the Private Equity & Venture Capital investment (results from the first 3 years after the in-vestment), and on the other hand, for its enduring effect over time (aggregate growth from the time the investment was made through 2015, a period which included both years of ex-tensive economic growth and years of recession).
2) See Chapter 9 of this report for an in-depth description of the study methodology.
3) Of the 191 companies in the initial sample of Private Equity & Venture Capital portfolio companies for the period (2005–2012), 186 valid comparable companies were identified (control group), with no comparables being found for 5 of the sam-ple companies due to their large size. The impact results for the 191 companies are provided in Chapter 10.1.
4) See Chapter 10 for statistical information from the report.

12
LOS RESULTADOS GLOBALES CONFIRMAN QUE A LARGO PLAZO LAS EMPRESAS
PARTICIPADAS POR EL CAPITAL PRIVADO CREAN MÁS EMPLEO, CRECEN MÁS
RÁPIDAMENTE E INVIERTEN CON MÁS INTENSIDAD QUE LAS COMPAÑÍAS NO
FINANCIADAS POR ESTE INSTRUMENTO. ESTE CRECIMIENTO SE PRODUCE INCLUSO
EN FASES RECESIVAS DEL CICLO
THE OVERALL RESULTS CONFIRM THAT IN THE LONG-TERM PRIVATE
EQUITY & VENTURE CAPITAL PORTFOLIO COMPANIES CREATE MORE JOBS, GROW FASTER AND INVEST MORE INTENSELY THAN COMPANIES NOT
FUNDED BY THIS INSTRUMENT. THIS GROWTH IS SHOWN EVEN IN RECESSIVE STAGES OF THE CYCLE
PRINCIPALES RESULTADOS
En términos generales la financiación de Capital Privado tuvo un impacto positivo en sus empresas generando un crecimien-to hasta 2015 para su grupo de participadas de:
• 27.000 empleos (29,9% crecimiento agregado)
• 2.708 millones de euros en ventas (22,4% crecimiento agregado)
• 258 millones de euros de EBITDA (19,7% crecimiento agregado)
• 2.236 millones de euros en activos totales (11,6% creci-miento agregado)
Estos crecimientos positivos se refuerzan cuando se compa-ran con los resultados obtenidos por el grupo de control, tal y como muestra la página 13.
5) Resultados obtenidos de la diferencia de crecimientos acumulados hasta 2015 de las diferentes variables del conjunto de participadas por Capital Privado y las del Grupo de Control.
MAJOR FINDINGS
On the whole, Private Equity & Venture Capital funding had a positive impact on its companies, generating growth through 2015 in its portfolio companies, creating:
• 27,000 jobs (29.9% aggregate growth)
• Increasing sales by €2,708M (22.4% aggregate growth)
• EBITDA by €258M (19.7% aggregate growth)
• Total assets by €2,236M (11.6% aggregate growth).
These positive growths become reinforced when compared with the results obtained by the control group, as shown on page 13.
5) Results obtained from the difference in accumulated growth through 2015, for the different variables, for the Private Equity & Venture Capital portfolio companies and the Control Group.
2. RESUMEN EJECUTIVO

13IMPACTO ECONÓMICO Y SOCIAL DEL CAPITAL PRIVADO EN LAS OPERACIONES DE MIDDLE MARKET EN ESPAÑA 2018 ASCRI
+32,75%EMPLEO
+52,36%EBITDA
+18,72%VENTAS
+3,74%ACTIVOSTOTALES
PRINCIPALES RESULTADOS5MAJOR FINDINGS5

14
Las empresas respaldadas por el Capital Privado crearon em-pleo a un ritmo superior al de las demás compañías:
• La creación de empleo en el periodo estudiado del grupo de empresas invertidas por el Capital Privado creció a una media del 7,6% anual, 3 años después de la inversión ini-cial, frente al 2,3% anual del grupo de control.
• Al ampliar el análisis hasta el año 2015, el empleo acu-mulado para todo el periodo creció un 29,9% en las par-ticipadas por el Capital Privado frente a la destrucción de empleo observada en el grupo de control, en una tasa del -2,8%.
• La creación de empleo, por término medio, hasta 2015 se situó en 21 trabajadores por año y empresa en las partici-padas por el Capital Privado, mientras que cada empresa del grupo de control destruyó 1 puesto de trabajo por año.
Las compañías respaldadas por el Capital Privado crecen más rápidamente que las demás compañías:
• Las principales variables financieras registraron resulta-dos positivos 3 años después de entrar la inversión de Capital Privado. El volumen de ventas de las 186 empre-sas participadas por el Capital Privado, creció a una me-dia del +8% anual y su EBITDA y activos totales al +7% anual, ambas magnitudes, frente a la evolución del grupo de control: ventas (+0,8%), EBITDA (-6,4%) y los activos totales (2,8%).
• Al ampliar la referencia hasta el año 2015, y a pesar de in-cluir también años de recesión, las diferencias de los cre-cimientos se refuerzan para todas las variables financieras, aunque especialmente para el EBITDA (19,7% crecimiento agregado de las empresas participadas por el Capital Pri-vado frente a -32,6% del grupo de control)6. Las ventas y los activos totales del grupo de empresas participadas por el Capital Privado, crecieron un 22,4% y un 11,6%, res-pectivamente frente al 3,7% en ventas y 7,9% en los acti-vos totales del grupo de empresas que componen el gru-po de control.
• El crecimiento medio de las ventas por empresa y año, por término medio hasta 2015, se situó en 2,4 millones de euros en las participadas por el Capital Privado frente a 0,4 millones de euros de cada empresa del grupo de con-trol. En términos de EBITDA el resultado es positivo para cada empresa del primer grupo (0,3 millones de euros) frente a una media negativa de -0,2 millones de euros por empresa y año. Para los activos totales se mantiene la mis-ma dinámica: 1,9 millones de euros de crecimiento medio por año en cada empresa participada por el Capital Priva-do frente a 0,69 millones de euros del grupo de control.
6) Para ver todos los resultados, consultar la tabla 2 del apartado 10.
2. RESUMEN EJECUTIVO

15IMPACTO ECONÓMICO Y SOCIAL DEL CAPITAL PRIVADO EN LAS OPERACIONES DE MIDDLE MARKET EN ESPAÑA 2018 ASCRI
Companies backed by Private Equity & Venture Capital creat-ed jobs at a faster rate than the other companies:
• Job creation by Private Equity & Venture Capital portfo-lio companies during the period under review grew at an average rate of +7.6% per annum 3 years after the initial investment, compared to 2.3% per annum in the control group.
• Extending the analysis through 2015, cumulative employ-ment for the period grew by 29.9% in Private Equity & Venture Capital portfolio companies, compared to a -2.8% loss in jobs in the control group.
• On average 21 new jobs per year, per company were cre-ated through 2015 in Private Equity & Venture Capital portfolio companies, as compared to the loss of 1 job per company, per year in the control group.
Companies backed by Private Equity & Venture Capital grew faster than the other companies:
• The key financial variables showed positive results 3 years after the initial Private Equity & Venture Capital invest-ment. Sales volume of the 186 Private Equity & Venture Capital portfolio companies grew 8% per annum, EBITDA and total assets grew 7% per annum both as compared to performance of the control group: sales (+0.8%), EBITDA (-6.4%) and total assets (2.8%).
• By extending the analysis through 2015, despite includ-ing years of recession, the difference in growth increased for all financial variables, in particular for EBITDA (19.7% aggregate growth for Private Equity & Venture Capital portfolio companies compared to -32.6% for the control group)6. Sales and total assets of the Private Equity & Ven-ture Capital portfolio companies grew by 22.4% and 11.6%, respectively, as compared to 3.7% in sales and 7.9% in total assets for the control group companies.
• Sales of Private Equity & Venture Capital portfolio com-panies grew by €2.4M per company, per year on aver-age, through 2015, compared to €0.4M per control group company. In terms of EBITDA, results are positive for each company in the first group (€0.3M) compared to a nega-tive average of -€0.2M per company, per year. Total assets mimic the same development: €1.9M average growth per year for each Private Equity & Venture Capital portfolio company, compared to €0.69M in the control group.
6) See Chapter 10, Table 2 for all of the results.
16
CAPITAL PRIVADO GRUPO DE CONTROL
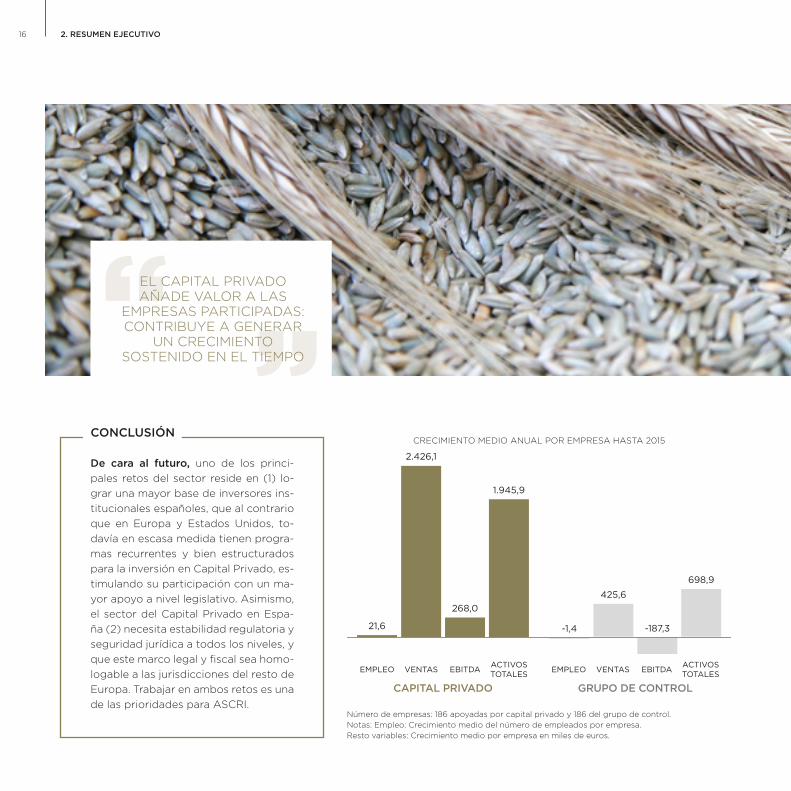
21,6
2.426,1
268,0
1.945,9
-1,4
425,6
-187,3
698,9
EMPLEO VENTAS EBITDA ACTIVOSTOTALES EMPLEO VENTAS EBITDA ACTIVOS
TOTALES
CONCLUSIÓN
De cara al futuro, uno de los princi-pales retos del sector reside en (1) lo-grar una mayor base de inversores ins-titucionales españoles, que al contrario que en Europa y Estados Unidos, to-davía en escasa medida tienen progra-mas recurrentes y bien estructurados para la inversión en Capital Privado, es-timulando su participación con un ma-yor apoyo a nivel legislativo. Asimismo, el sector del Capital Privado en Espa-ña (2) necesita estabilidad regulatoria y seguridad jurídica a todos los niveles, y que este marco legal y fiscal sea homo-logable a las jurisdicciones del resto de Europa. Trabajar en ambos retos es una de las prioridades para ASCRI.
Número de empresas: 186 apoyadas por capital privado y 186 del grupo de control.Notas: Empleo: Crecimiento medio del número de empleados por empresa.Resto variables: Crecimiento medio por empresa en miles de euros.
CRECIMIENTO MEDIO ANUAL POR EMPRESA HASTA 2015
2. RESUMEN EJECUTIVO
EL CAPITAL PRIVADO AÑADE VALOR A LAS
EMPRESAS PARTICIPADAS: CONTRIBUYE A GENERAR
UN CRECIMIENTO SOSTENIDO EN EL TIEMPO

17IMPACTO ECONÓMICO Y SOCIAL DEL CAPITAL PRIVADO EN LAS OPERACIONES DE MIDDLE MARKET EN ESPAÑA 2018 ASCRI
CONCLUSION
One of this sector’s main challeng-es moving forward will be building a larger base of Spanish institutional in-vestors who, unlike in Europe and the United States, only have a few recur-ring, well-structured Private Equity & Venture Capital investment programs, encouraging their participation by pro-viding greater legislative support. The Private Equity & Venture Capital sector in Spain also needs regulatory stabili-ty and legal security at all levels, with a legal and tax framework that is recog-nized in other jurisdictions throughout Europe. Responding to both of these challenges is one of ASCRI’s priorities.
PRIVATE EQUITY & VENTURE CAPITAL ADD VALUE, CONTRIBUTING
TO SHORT- AND LONG-TERM BUSINESS
GROWTH
Number of companies: 186 backed by Private Equity & Venture Capital and 186 in the control group. Notes: Employment: Average growth in the number of employees per company.Other Variables: Average growth per company (in thousands of Euros).
AVERAGE ANNUAL GROWTH (PER COMPANY) THROUGH 2015
WITH PE&VC WITHOUT PE&VC
21.6
2,426.1
268.0
1,945.9
425.6
-187.3
698.9
-1.4
EMPLOYMENT SALES EBITDA TOTALASSETS EMPLOYMENT SALES EBITDA TOTAL
ASSETS

18
EL CAPITAL PRIVADO GENERA EMPLEO DE FORMA PERSISTENTEPRIVATE EQUITY & VENTURE CAPITAL CONSISTENTLY CREATES JOBS
Las empresas respaldadas por el Capital Privado contribuyen a la creación de empleo con mayor intensidad.
De forma agregada, las 186 empresas analizadas que repre-sentan las inversiones de middle market realizadas por el Ca-pital Privado, aumentaron su plantilla tres años después de la inversión inicial en 22.000 nuevos puestos de trabajo, lo que equivale a un ritmo de crecimiento del 7,6% anual, mientras que las 186 empresas comparables tan solo lograron ampliar su plantilla en 5.489 trabajadores (+2,3% de tasa anual). Esto supone que las empresas participadas por Capital Privado crearon cuatro veces más empleo que sus homólogas del gru-po de control.
Desde una perspectiva temporal más amplia (hasta 2015), las 186 empresas que recibieron financiación de Capital Privado aumentaron su plantilla hasta 27.485 trabajadores, con un in-cremento agregado del 30%, frente a la destrucción de 2.000 puestos de trabajo generado en el grupo de control (-2,8% agregado).
El crecimiento medio sobre cada empresa analizada hasta el tercer año se cuantificó en 120 nuevos empleos tras la entra-da del Capital Privado, frente a 29 logrados por el grupo de control.
Esta creación de empleo, además, persiste en el tiempo. Am-pliando el periodo de análisis hasta 2015, cada empresa au-mentó su plantilla en una media de 148 trabajadores frente a una reducción media de 12 empleos en cada empresa del gru-po de control.
Capital Privado Grupo de Control
7,6%
2,3%
29,9%
-2,8%
ANUAL HASTAEL TERCER AÑO
AGREGADOHASTA 2015
120,4
29,5
147,8
-11,6
Capital Privado Grupo de Control
ANUAL HASTAEL TERCER AÑO
AGREGADOHASTA 2015
CRECIMIENTO DEL EMPLEOEN EL CONJUNTO
DE EMPRESAS
CRECIMIENTO MEDIO DE NÚMERO DE TRABAJADORES
POR EMPRESA
Datos para la muestra de 186 empresas representativas de las inversiones realiza-das entre 2005-2012
HASTA 2015, LAS EMPRESAS INVERTIDAS POR EL CAPITAL PRIVADO CREARON EN SU CONJUNTO 27.000 NUEVOS EMPLEOS
FRENTE A LA DESTRUCCIÓN DE 2.000 PUESTOS DE TRABAJO EN LAS EMPRESAS QUE COMPONEN EL GRUPO DE CONTROL
3. EL CAPITAL PRIVADO GENERA EMPLEO DE FORMA PERSISTENTE

19IMPACTO ECONÓMICO Y SOCIAL DEL CAPITAL PRIVADO EN LAS OPERACIONES DE MIDDLE MARKET EN ESPAÑA 2018 ASCRI
Entre 2005 y 2013 la economía española registro una reduc-ción neta de la población ocupada de casi 2,4 millones de tra-bajadores. Y en 2014 seguía 1,4 millones por debajo de la refe-rencia de 2005. Por el contrario, las empresas invertidas por el Capital Privado en middle market entre 2005 y 2012, genera-ron hasta 2015 un total 44.000 empleos más.
LA CREACIÓN DE EMPLEO PERSISTE DESPUÉS DE LA SALIDA DEL INVERSOR,
CREANDO 23 PUESTOS MÁS POR EMPRESA Y AÑO QUE LAS EMPRESAS QUE
NO HAN RECIBIDO FINANCIACIÓN DEL CAPITAL PRIVADO
THROUGH 2015, PRIVATE EQUITY & VENTURE CAPITAL PORTFOLIO
COMPANIES CREATED A TOTAL OF 27,000 NEW JOBS COMPARED TO THE 2,000 JOBS
LOST IN CONTROL GROUP COMPANIES
JOB CREATION CONTINUES EVEN AFTER THE EXIT OF THE INVESTOR, CREATING
23 MORE JOBS PER COMPANY, PER YEAR THAN THEIR COMPARABLES
Companies backed by Private Equity & Venture Capital created more jobs than the control group companies.
In the aggregate, the 186 companies analyzed representing Private Equity & Venture Capital middle market investments increased their workforce, three years after the initial invest-ment, by 22,000 new jobs, representing 7.6% annual growth, compared to the 186 comparables that only increased their workforce by 5,489 workers (+2.3% annual rate). This means that Private Equity & Venture Capital portfolio companies cre-ated four times more jobs than their counterparts in the con-trol group.
Looking at a broader time horizon (through 2015), the 186 companies that received Private Equity & Venture Capital in-vestments increased their workforce by 27,485 workers, repre-senting an aggregate increase of 30%, compared to the 2,000 jobs lost in the control group (-2.8% aggregate).
Average per company growth through year three was quan-tified at 120 new jobs following the Private Equity & Venture Capital investment, compared to the 29 jobs created in the Control Group.
Job creation persists over time. Extending the period analyzed through 2015, each company increased their workforce by an average of 148 workers compared to an average loss of 12 jobs per company in the control group.
Between 2005 and 2013, the Spanish economy experienced a net decrease in the working population of nearly 2.4 million workers, and in 2014, figures remained 1.4 million below the 2005 benchmark level. Conversely, middle market companies receiving Private Equity & Venture Capital investments be-tween 2005 and 2012 generated a total of 44,000 new jobs through 2015.
Data from the 186 sample companies representing investments made between 2005–2012
7.6%
2.3%
29.9%
-2.8%
With PE&VC Without PE&VC
YEARLY THROUGHTYEAR 3
AGGREGATETHROUGHT 2015
With PE&VC Without PE&VC
YEARLY THROUGHTYEAR 3
AGGREGATETHROUGHT 2015
120.4
29.5
147.8
-11.6
GROWTH IN COMPANIES
AVERAGE GROWTH IN NUMBER OF WORKERS (PER COMPANY)
20
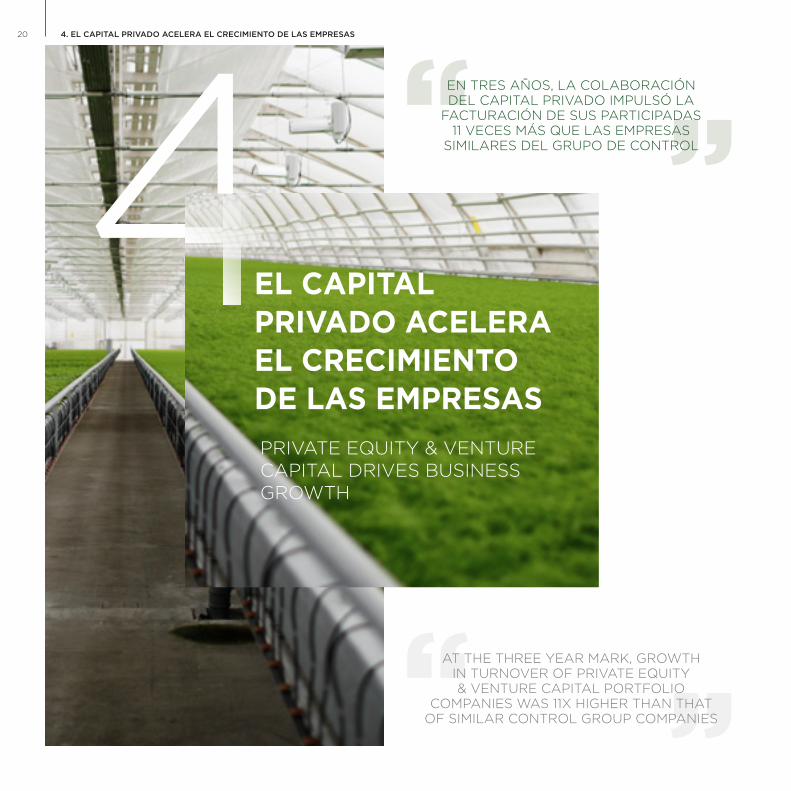
EL CAPITALPRIVADO ACELERAEL CRECIMIENTODE LAS EMPRESAS
AT THE THREE YEAR MARK, GROWTH IN TURNOVER OF PRIVATE EQUITY & VENTURE CAPITAL PORTFOLIO
COMPANIES WAS 11X HIGHER THAN THAT OF SIMILAR CONTROL GROUP COMPANIES
EN TRES AÑOS, LA COLABORACIÓN DEL CAPITAL PRIVADO IMPULSÓ LA
FACTURACIÓN DE SUS PARTICIPADAS 11 VECES MÁS QUE LAS EMPRESAS
SIMILARES DEL GRUPO DE CONTROL
PRIVATE EQUITY & VENTURE CAPITAL DRIVES BUSINESS GROWTH
4. EL CAPITAL PRIVADO ACELERA EL CRECIMIENTO DE LAS EMPRESAS

21IMPACTO ECONÓMICO Y SOCIAL DEL CAPITAL PRIVADO EN LAS OPERACIONES DE MIDDLE MARKET EN ESPAÑA 2018 ASCRI
La inyección de capital y la ayuda en la gestión de la compañía que aportan los fondos de Capital Privado intensifican el crecimiento de las empresas participadas.
De forma agregada, tres años después de la inversión ini-cial, las 186 empresas analizadas incrementaron sus ventas, en 3.180 millones de euros, lo que supone una tasa de crecimiento media anual del 8% anual. En comparación, el grupo de control aumentó sus ventas en tan sólo 279 millones de euros (0,8% anual).
Si se amplía el análisis hasta el año 2015, la facturación agre-gada en el grupo de empresas financiadas con Capital Priva-do, a pesar de la crisis, aumentó en 2.708 millones de euros (equivalente a un incremento agregado del 22,4%), a gran dis-tancia del resultado del conjunto de empresas que componen el grupo de control: 427 millones de euros (3,7% crecimiento agregado).
En términos individuales, cada empresa participada aumen-tó sus ventas en 17,1 millones tres años después de la inver-sión, frente a los 1,5 millones registrados en las empresas del grupo de control. Si se extiende el análisis hasta el año 2015, esta diferencia en el crecimiento de las ventas por empresa en-tre ambos grupos se cuantifica en 12,2 millones de euros por empresa, en promedio, a favor de las invertidas por el Capital Privado7.
The capital injection and business management support provided by Private Equity & Venture Capital strengthened growth of the portfolio companies.
In the aggregate perspective, three years after the initial in-vestment, the 186 companies analyzed increased sales by €3,180 million, representing average annual growth of 8% per annum. In comparison, the control group increased sales by €279 million (0.8% per annum).
Extending the analysis through 2015, aggregate turnover for companies receiving Private Equity & Venture Capital funding grew by €2,708 million (representing an aggregate increase of 22.4%), despite the crisis, and far from the results of the control group companies: €427 million (3.7% aggregate growth).
In individual terms, each portfolio company increased sales by 17.1 million by the third year of the investment, compared to 1.5 million for the control group companies. This difference in per company sales growth between the two groups is quanti-fied at 12.2 million per company, on average, in favor of Private Equity & Venture Capital portfolio companies, if the analysis is extended through 20157.
Capital Privado Grupo de Control
8,1%
0,8%
22,4%
3,7%
ANUAL HASTAEL TERCER AÑO
AGREGADOHASTA 2015
17,1 MM €
1,5 MM€
14,6 MM €
2,3 MM €
Capital Privado Grupo de Control
ANUAL HASTAEL TERCER AÑO
AGREGADOHASTA 2015
8.1%
0.8%
22.4%
3.7%
With PE&VC Without PE&VC
YEARLY THROUGHTYEAR 3
AGGREGATETHROUGHT 2015
€17.1 MM
€1.5 MM
€ 14.6 MM
€ 2.3 MM
With PE&VC Without PE&VC
YEARLY THROUGHTYEAR 3
AGGREGATETHROUGHT 2015
Data from the 186 sample companies representing investments made between 2005–2012
Datos para la muestra de 186 empresas representativas de las inversiones realiza-das entre 2005-2012
SALES GROWTHIN COMPANIES
AVERAGE SALES GROWTH (PER COMPANY)
CRECIMIENTO MEDIO DE LAS VENTAS POR EMPRESA
CRECIMIENTO DE LAS VENTAS DEL CONJUNTO DE EMPRESAS
7) Para mayor detalle, ver tabla 2.3 del apartado 10 7) See Chapter 10, Table 2.3 for further information.

22
EL CAPITALPRIVADO
MEJORA LA RENTABILIDAD
DE LAS EMPRESAS
PRIVATE EQUITY & VENTURE CAPITAL INCREASES
BUSINESS PROFITABILITY
La financiación de las empresas a través del Capital Privado mejora su capacidad para generar beneficios.
Las 186 empresas participadas por Capital Privado incremen-taron su beneficio antes de intereses, impuestos y amortiza-ciones (EBITDA) al tercer año desde la inversión, en 294 mi-llones de euros, a una tasa media del 7% anual. Mientras, el grupo de control registró pérdidas de 200 millones de euros (-6,4% de media anual).
Ampliando el periodo de análisis hasta el año 2015, se com-prueba el efecto de la crisis sobre el EBITDA. En el grupo de empresas apoyadas por el Capital Privado, el EBITDA agrega-
5. EL CAPITAL PRIVADO MEJORA LA RENTABILIDAD DE LAS EMPRESAS

23IMPACTO ECONÓMICO Y SOCIAL DEL CAPITAL PRIVADO EN LAS OPERACIONES DE MIDDLE MARKET EN ESPAÑA 2018 ASCRI
do aumentó en 258 millones de euros (+19,7% sobre la situa-ción de inicio), frente al resultado negativo del EBITDA en 363 millones de euros registrado en el grupo de control (-32,6% menos que al inicio).
Con respecto a los valores medios por empresa, el aumen-to –hasta el tercer año– en las empresas de la muestra de Ca-pital Privado (1,6 millones de euros) contrasta con la pérdida registrada en las empresas del grupo de control (-1,1 millones de euros).
Al ampliar el análisis hasta el año 2015, la diferencia en el cre-cimiento medio del EBITDA entre ambos colectivos aumenta a 3,3 millones de euros por empresa a favor de las empresas participadas por el Capital Privado.
Companies that receive Private Equity & Venture Capital funding are better able to turn a profit.
EBITDA (Earnings Before Interest, Tax, Depreciation and Amor-tization) of the 186 Private Equity & Venture Capital portfolio
EN TÉRMINOS ABSOLUTOS, LA RENTABILIDAD (EBITDA) DE LAS
EMPRESAS PARTICIPADAS POR CAPITAL PRIVADO HA CRECIDO DE MANERA
SOSTENIDA FRENTE A LAS PÉRDIDAS MOSTRADAS POR LAS EMPRESAS
DEL GRUPO DE CONTROL
companies increased by the third year of the investment, by €294 million, at an average rate of 7% per annum, as compared to loss of €200 million recorded in the control group compa-nies (-6.4%per annum on average).
Extending the analysis through 2015, the effect of the crisis on EBITDA was confirmed. Aggregate EBITDA of the companies backed by Private Equity & Venture Capital increased by 258 million (+19.7% from the beginning), compared to the negative EBITDA results of 363 million for the control group (-32.6% from the beginning).
As relates to average value per company, the increases seen through the third year for Private Equity & Venture Capital companies (1.6 million) is in stark contrast to the losses record-ed in the control group (-1.1 million).
By extending the analysis through 2015, the difference in aver-age growth of EBITDA between both groups increased to 3.3 million per company in favor of Private Equity & Venture Capi-tal portfolio companies.
IN ABSOLUTE TERMS, PRIVATE EQUITY & VENTURE CAPITAL INCREASED THE EBITDA OF ITS INVESTEE COMPANIES,
COMPARED TO LOSSES IN SIMILAR COMPANIES FROM THE CONTROL GROUP
7.0%
-6.4%
19.7%
-32.6%
With PE&VC Without PE&VC
YEARLY THROUGHTYEAR 3
AGGREGATETHROUGHT 2015
€ 1.6 MM
€ -1.1 MM
€ 1.4 MM
€ -2.0 MM
With PE&VC Without PE&VC
YEARLY THROUGHTYEAR 3
AGGREGATETHROUGHT 2015
EBITDA GROWTHIN COMPANIES
AVERAGE EBITDA GROWTH (PER COMPANY)
Data from the 186 sample companies representing investments made between 2005–2012
Capital Privado Grupo de Control
7,0%
-6,4%
19,7%
-32,6%
ANUAL HASTAEL TERCER AÑO
AGREGADOHASTA 2015
Capital Privado Grupo de Control
1,6 MM €
-1,1 MM €
1,4 MM €
-2,0 MM €
ANUAL HASTAEL TERCER AÑO
AGREGADOHASTA 2015
CRECIMIENTO DEL EBITDADEL CONJUNTO DE EMPRESAS
CRECIMIENTO MEDIO DEL EBITDA POR EMPRESA
Datos para la muestra de 186 empresas representativas de las inversiones realiza-das entre 2005-2012

24
EL CAPITALPRIVADOFOMENTA LAINVERSIÓNPRIVATE EQUITY & VENTURE CAPITAL PROMOTES INVESTMENT
La financiación de Capital Privado multiplica la inversión de sus participadas lo que permite un aumento de la producción.
En términos agregados, los activos totales de las empresas que contaban con financiación de Capital Privado aumentaron el valor de los activos en 4.460 millones de euros al tercer año de recibir este tipo de inversión, equivalente a un ritmo de cre-cimiento del 7% anual, mientras que el grupo de control los ac-tivos aumentaron en 945 millones de euros (2,8% anual).
Desde una perspectiva temporal –hasta el año 2015–, las em-presas gestionadas por el Capital Privado aumentaron el va-lor de sus activos totales en 2.236 millones de euros (+11,7%), frente a los 859 millones de euros del grupo de control (+7,9% agregado). Los descensos con respecto a la referencia al tercer año son imputables tanto a las amortizaciones como al efec-to de la crisis.
El incremento medio por empresa hasta el tercer año en las participadas por el Capital Privado fue de 24 millones de euros, frente a los 5,1 millones de euros registrados por las no partici-padas. La diferencia en el incremento medio entre ambos gru-pos se reduce (12 millones de euros por empresa en participa-das Capital Privado frente a los 4,5 millones de euros del grupo de control) si ampliamos el periodo de análisis hasta 2015, de-bido al efecto de las amortizaciones.
6. EL CAPITAL PRIVADO FOMENTA LA INVERSIÓN

25IMPACTO ECONÓMICO Y SOCIAL DEL CAPITAL PRIVADO EN LAS OPERACIONES DE MIDDLE MARKET EN ESPAÑA 2018 ASCRI
Capital Privado Grupo de Control
7,2%
2,8%
11,7%
7,9%
ANUAL HASTAEL TERCER AÑO
AGREGADOHASTA 2015
Capital Privado Grupo de Control
24,0 MM €
5,1 MM €
12,0 MM €
4,5 MM €
ANUAL HASTAEL TERCER AÑO
AGREGADOHASTA 2015
EN TRES AÑOS, LOS ACTIVOS TOTALES DE LAS EMPRESAS PARTICIPADAS POR EL CAPITAL PRIVADO AUMENTARON 5 VECES MÁS QUE LAS EMPRESAS DEL
GRUPO DE CONTROL
CRECIMIENTO DE LOS ACTIVOS DEL CONJUNTO DE EMPRESAS
CRECIMIENTO MEDIO DE LOS ACTIVOS POR EMPRESA
Datos para la muestra de 186 empresas representativas de las inversiones realiza-das entre 2005-2012
Data from the 186 sample companies representing investments made between 2005–2012
Private Equity & Venture Capital funding multiplies the investment in its portfolio companies, driving production increases.
In aggregate terms, total assets of companies receiving Private Equi-ty & Venture Capital funding increased by €4,460 million in the third year after receiving the investment, representing annual growth of 7%, compared to an increase of 945 million (2.8% per annum) in the control group.
Looking at a time horizon through 2015, Private Equity & Venture Cap-ital portfolio companies increased the value of their total assets by €2,236 million (+11.7%), compared to €859 million in the control group (+7.9% aggregate). Losses experienced in the third year as compared to the benchmark can be attributed to depreciation and the effects of the crisis.
Average per company growth through year three for Private Equity & Venture Capital portfolio companies totaled €24 million, compared to €5.1 million for non-portfolio companies. Following performance through 2015, the difference in average increase between the two groups fell (12 million per Private Equity & Venture Capital portfolio company compared to 4.5 million for the control group) due to the effect of depreciation.
IN THREE YEARS, TOTAL ASSETS OF PRIVATE EQUITY & VENTURE CAPITAL PORTFOLIO COMPANIES INCREASED 5 TIMES MORE THAN THOSE OF SIMILAR
CONTROL GROUP COMPANIES
ASSETS GROWTHIN COMPANIES
AVERAGE TOTAL ASSETS GROWTH (PER COMPANY)
7.2%
2.8%
11.7%
7.9%
With PE&VC Without PE&VC
YEARLY THROUGHTYEAR 3
AGGREGATETHROUGHT 2015
€ 24.0 MM
€ 5.1 MM
€ 12.0 MM
€ 4.5 MM
With PE&VC Without PE&VC
YEARLY THROUGHTYEAR 3
AGGREGATETHROUGHT 2015

26
Capital Privado Grupo de Control
166,0
-17,2
191,0
-9,0
ANUAL HASTAEL TERCER AÑO
AGREGADOHASTA 2015
EL CAPITAL PRIVADO APOYA A LAS EMPRESAS EN PERIODOS DE CRISISPRIVATE EQUITY & VENTURE CAPITAL PROVIDES SUPPORT TO BUSINESSES IN TIMES OF CRISIS
El Capital Privado implica un apoyo en la gestión que contribuye a crear valor, amortiguar los efectos las recesiones a través de la inversión y buscar nuevos mercados en los que crecer.
En el segmento del middle market, un total de 61 empresas re-cibieron financiación de entidades de Capital Privado después del inicio de la crisis8, en 2009.
EL APOYO EN LA GESTIÓN DEL CAPITAL PRIVADO SE HA DEMOSTRADO COMO UNA HERRAMIENTA EFICAZ PARA EL
MANTENIMIENTO DEL EMPLEO Y AUMENTO DEL CRECIMIENTO EMPRESARIAL DURANTE LA CRISIS FINANCIERA
La presencia del Capital Privado se dejó sentir positivamente en los años siguientes al inicio de la crisis: las empresas que re-cibieron este apoyo gestionaron mucho mejor la situación, lo-grando crear durante los primeros tres años un promedio de 166 nuevos empleos por empresa, frente a los 17 destruidos en cada empresa del grupo de control. La diferencia entre ambos colectivos se amplía aún más al extender el marco temporal hasta 2015.
CRECIMIENTO MEDIOEMPLEO POR EMPRESA
(NÚMERO TRABAJADORES)
7. EL CAPITAL PRIVADO APOYA A LAS EMPRESAS EN PERIODOS DE CRISIS
8) Para mayor detalle ver punto 3 del apartado 10.

27IMPACTO ECONÓMICO Y SOCIAL DEL CAPITAL PRIVADO EN LAS OPERACIONES DE MIDDLE MARKET EN ESPAÑA 2018 ASCRI
Private Equity & Venture Capital is more than just an instrument for funding unlisted companies and making capital injections. It is also an instrument for helping with management, contributing to the creation of company value, cushioning the effects of recessions through the investment and searching for new markets in which the company can grow.
A total of 61 companies received Private Equity & Venture Cap-ital funding in the middle market following the start of the cri-sis8 in 2009.
PRIVATE EQUITY & VENTURE CAPITAL HELPS RETAIN JOBS AND DRIVE GROWTH
IN TIMES OF CRISIS
Private Equity & Venture Capital was scarce in the years fol-lowing the start of the crisis, although the companies that did receive backing were better able to navigate the crisis, thus creating an average of 166 new jobs per company in the first three years, compared to the 17 jobs lost in each control group company. The difference between both groups increases even more when the analysis is extended through 2015.
166.0
-17.2
191.0
-9.0
With PE&VC Without PE&VC
YEARLY THROUGHTYEAR 3
AGGREGATETHROUGHT 2015
AVERAGE EMPLOYMENTPER COMPANY
(NUMBER OF WORKERS)
8) See Chapter 10, Table 3 for further information.

28
En términos de ventas, también se aprecia esta mejoría, a pe-sar de abarcar años de crisis. Cada empresa apoyada por Ca-pital Privado, aumentó al cabo de tres años su facturación en 23,7 millones de euros frente a los 3,3 millones de euros de cada empresa del grupo de control, lo que equivale a 7 veces más, en promedio. Ampliando el análisis hasta 2015, esta dife-rencia se multiplica por cinco en cada una de las participadas frente a las del grupo de control.
La evolución del EBITDA fue positivo tanto en las empresas apoyadas por el Capital Privado como en las empresas del gru-po de control: en las primeras, el crecimiento de esta variable al tercer año de realizarse la inversión en cada empresa partici-pada fue de 3 millones de euros frente a 0,6 millones de euros de las del grupo de control. Al seguir la evolución hasta 2015 esta diferencia de crecimiento se mantiene.
También aumentaron los activos totales de las empresas que contaron con Capital Privado, en 16,7 millones de euros por empresa al tercer año de realizarse la inversión frente a los 3 millones por empresa del grupo de control. Al igual que con el resto de variables, esta dinámica se mantiene a largo plazo (hasta 2015 cada empresa invertida por Capital Privado quin-tuplicó el valor de los activos frente a las empresas del grupo de control).
EL IMPACTO DEL CAPITAL PRIVADO EN LA GESTIÓN DURANTE LA CRISIS
PERDURA EN EL TIEMPO, MOSTRANDO EFECTOS POSITIVOS EN EL CRECIMIENTO
EMPRESARIAL DURANTE LA FASE DE RECUPERACIÓN ECONÓMICA
7. EL CAPITAL PRIVADO APOYA A LAS EMPRESAS EN PERIODOS DE CRISIS
Capital Privado Grupo de Control
16,7 MM €
3,0 MM €
21,9 MM €
4,4 MM €
ANUAL HASTAEL TERCER AÑO
AGREGADOHASTA 2015
CRECIMIENTO MEDIOACTIVOS TOTALES POR EMPRESA
Capital Privado Grupo de Control
3,0 MM €
0,6 MM €
4,6 MM €
1,5 MM €
ANUAL HASTAEL TERCER AÑO
AGREGADOHASTA 2015
CRECIMIENTO MEDIOEBITDA POR EMPRESA
Capital Privado Grupo de Control
23,7 MM €
3,3 MM €
27,7 MM €
5,2 MM €
ANUAL HASTAEL TERCER AÑO
AGREGADOHASTA 2015
CRECIMIENTO MEDIOVENTAS POR EMPRESA

29IMPACTO ECONÓMICO Y SOCIAL DEL CAPITAL PRIVADO EN LAS OPERACIONES DE MIDDLE MARKET EN ESPAÑA 2018 ASCRI
Sales also improved despite the years of crisis. Turnover of companies backed by Private Equity & Venture Capital grew by €23.7 million at the end of three years, compared to €3.3 million per control group company, representing 7 times more growth on average. Extending the analysis through 2015, this difference increased by five times in each portfolio company as compared to the control group.
EBITDA performed positively both in companies backed by Private Equity & Venture Capital and in the control group companies, although growth of this variable in the former three years after the investment was €3 million per portfolio company, as compared to €0.6 million in the control group. Following performance through 2015, this growth difference continues.
Total assets of companies receiving Private Equity & Venture Capital funding grew by €16.7 million per company by year three of the investment, compared to €3 million per control group company. As with the other variables, this trend contin-ues in the long-term (through 2015 the value of the assets of each Private Equity & Venture Capital portfolio company quin-tupled compared to the control group companies).
PRIVATE EQUITY & VENTURE CAPITAL BETTER MANAGED THE CRISIS, DRIVING
GROWTH OF ITS COMPANIES WITH EFFECTS LASTING THROUGHOUT THE
ECONOMIC RECOVERY
€ 23.7 MM
€ 3.3 MM
€ 27.7 MM
€ 5.2 MM
With PE&VC Without PE&VC
YEARLY THROUGHTYEAR 3
AGGREGATETHROUGHT 2015
AVERAGE SALESPER COMPANY
€ 3.0 MM
€ 0.6 MM
€ 4.6 MM
€ 1.5 MM
With PE&VC Without PE&VC
YEARLY THROUGHTYEAR 3
AGGREGATETHROUGHT 2015
AVERAGE EBITDAPER COMPANY
€ 16.7 MM
€ 3.0 MM
€ 21.9 MM
€ 4.4 MM
With PE&VC Without PE&VC
YEARLY THROUGHTYEAR 3
AGGREGATETHROUGHT 2015
AVERAGE TOTAL ASSETSPER COMPANY

30
La inversión del Capital Privado en el segmento de middle market se concentró, fundamentalmente, en el sector de otros servicios (80 empresas) e Industria (53 empresas). El resto de inversiones se repartieron entre el sector del Comercio (24 empresas), el sector primario y de suministros (15 empresas) y el de Tecnologías de la Comunicación (14 empresas).
8.1. SECTOR SERVICIOS
Un total de 80 empresas pertenecientes al sector Otros Servi-cios fueron invertidas por entidades de Capital Privado, situán-dose como la categoría sectorial con mayor peso en las inver-siones de middle market durante el periodo de estudio.
Las empresas del sector Otros Servicios que contaron con el respaldo del Capital Privado crearon en los primeros tres años un promedio de 194 nuevos empleos por empresa, frente a los 46 del grupo de control. La diferencia entre los dos grupos se maximiza al ampliar la referencia hasta el año 2015, con 247
EL CAPITAL PRIVADO Y SU IMPACTO EN DIFERENTES SECTORESPRIVATE EQUITY & VENTURE CAPITAL AND ITS IMPACT ON DIFFERENT SECTORS
8. EL CAPITAL PRIVADO Y SU IMPACTO EN DIFERENTES SECTORES

31IMPACTO ECONÓMICO Y SOCIAL DEL CAPITAL PRIVADO EN LAS OPERACIONES DE MIDDLE MARKET EN ESPAÑA 2018 ASCRI
nuevos empleos creados por empresa, en promedio, por las primeras, frente a los 59 destruidos por las segundas.
Al analizar las ventas, las empresas con financiación de Capital Privado –en la referencia a tres años– aumentaron su factura-ción en una media de 18 millones de euros por empresa, frente a 0,4 millones de euros del grupo de control: esto supone casi 50 veces más que las empresas del grupo de control. Sin em-bargo, el incremento medio por empresa se redujo hasta los 8,5 millones de euros al extender el periodo de análisis hasta el año 2015.
En este sentido, se produjo un suave crecimiento del EBITDA en las empresas apoyadas por Capital Privado, pasando de 0,4 millones de euros hasta el tercer año a 0,7 millones de euros hasta el año 2015. Por el contrario, el valor medio en las empre-sas del grupo de control se situó en un resultado negativo de -1 millón de euros que se amplió hasta -1,6 millones de euros al ampliar el análisis hasta 2015.
A diferencia de los resultados observados en las variables an-teriores, las empresas participadas por Capital Privado en el sector servicios experimentaron una disminución en el valor de sus activos pasando de los 16,6 millones de euros registra-dos al tercer año casi el triple que el de las empresas del gru-po de control a 1,5 millones de euros hasta el año 2015. Como explicación de este retroceso pueden argumentarse tanto las amortizaciones de activos (y del fondo de comercio) como el efecto de la crisis.
HASTA EL AÑO 2015, EL CAPITAL PRIVADO GENERÓ EN LAS EMPRESAS DEL SECTOR
SERVICIOS 247 NUEVOS EMPLEOS POR EMPRESA, EN PROMEDIO FRENTE
A LOS 59 DESTRUIDOS POR EMPRESA DEL GRUPO QUE NO CONTÓ CON ESTE
TIPO DE FINANCIACIÓN
Capital Privado Grupo de Control
194,3
46,2
246,9
-58,8
ANUAL HASTAEL TERCER AÑO
AGREGADOHASTA 2015
Capital Privado Grupo de Control
18,3 MM €
0,4 MM €
8,5 MM €
-4,4 MM €
ANUAL HASTAEL TERCER AÑO
AGREGADOHASTA 2015
Capital Privado Grupo de Control
0,4 MM €
-1,0 MM €
0,7 MM €
-1,6 MM €
ANUAL HASTAEL TERCER AÑO
AGREGADOHASTA 2015
Capital Privado Grupo de Control
16,6 MM €
6,3 MM €
1,5 MM €
11,1 MM €
ANUAL HASTAEL TERCER AÑO
AGREGADOHASTA 2015
EVOLUCIÓN DEL EMPLEOEN EL SECTOR SERVICIOS
(NÚMERO DE EMPLEADOS)
EVOLUCIÓN DELAS VENTAS EN EL SECTOR
SERVICIOS
EVOLUCIÓN DEL EBITDAEN EL SECTOR SERVICIOS
EVOLUCIÓN DE LOS ACTIVOSEN EL SECTOR SERVICIOS

32
As regards sectors, Private Equity & Venture Capital investments were made primarily in the Other Services (80 companies) and Manufacturing (53 companies) sectors, and these chapters will therefore focus on these two sectors. The remainder of the investments were distributed between the Commerce (24 companies), Commodities and Supply (15 companies) and ICT (14 companies) sectors.
8.1. SERVICES SECTOR
A total of 80 companies in the Other Services sector received Private Equity & Venture Capital investments, making it the sector with the largest weighting of middle market invest-ments during the period under review.
Companies in the Other Services sector that were backed by Private Equity & Venture Capital funding created an average of 194 new jobs per company in the first three years, compared to 46 in the control group. By extending the analysis through 2015, the difference between the two groups increases, with 247 new jobs created per company, on average, by the former, as compared to 59 jobs lost by the latter.
As relates to sales, turnover in companies receiving Private Equity & Venture Capital funding grew by an average of €18 million per company as of year three of the investment, com-pared to 0.4 million in the control group, representing nearly 50 times more growth than control group companies. Never-theless, when extending the period through 2015, average per company growth falls to 8.5 million.
EBITDA of companies backed by Private Equity & Venture Capital grew slightly, from 0.4 million through year three to 0.7 million through 2015. To the contrary, control group companies
saw their negative balance increase in both periods (through year three and through 2015).
Unlike the results of the preceding variables, the Private Equi-ty & Venture Capital portfolio companies in the services sector experienced a decrease in value of their assets, from 16.6 mil-lion at year three, almost three times that of the control group companies, to a mere 1.5 million through 2015. A potential ex-planation for this decline could be the depreciation of assets (and goodwill), as well as the effects of the crisis.
8. EL CAPITAL PRIVADO Y SU IMPACTO EN DIFERENTES SECTORES
194.3
46.2
246.9
-58.8
With PE&VC Without PE&VC
YEARLY THROUGHTYEAR 3
AGGREGATETHROUGHT 2015
€ 18.3 MM
€ 0.4 MM
€ 8.5 MM
€ -4.4 MM
With PE&VC Without PE&VC
YEARLY THROUGHTYEAR 3
AGGREGATETHROUGHT 2015
€ 16.6 MM
€ 6.3 MM
€ 1.5 MM
€ 11.1 MM
With PE&VC Without PE&VC
YEARLY THROUGHTYEAR 3
AGGREGATETHROUGHT 2015
€ 0.4 MM
€ -1.0 MM
€ 0.7 MM
€ -1.6 MM
With PE&VC Without PE&VC
YEARLY THROUGHTYEAR 3
AGGREGATETHROUGHT 2015
PERFORMANCE OF EMPLOYMENT IN THE SERVICES SECTOR(NUMBER OF EMPLOYEES)
PERFORMANCEOF SALES IN THE SERVICES
SECTOR
PERFORMANCE OF EBITDAIN THE SERVICES SECTOR
PERFORMANCE OF ASSETSIN THE SERVICES SECTOR

33IMPACTO ECONÓMICO Y SOCIAL DEL CAPITAL PRIVADO EN LAS OPERACIONES DE MIDDLE MARKET EN ESPAÑA 2018 ASCRI
THROUGH 2015, PRIVATE EQUITY & VENTURE CAPITAL CREATED 247 NEW JOBS PER COMPANY IN THE SERVICES SECTOR, ON AVERAGE, AS COMPARED TO THE 59 JOBS LOST IN COMPANIES
WITHOUT THIS TYPE OF FUNDING

34
8.2. SECTOR INDUSTRIA
El segundo sector analizado por su importancia en relación con el número de inversiones por entidades de Capital Privado en el periodo de estudio (53 empresas) fue Industria.
De media, hasta el tercer año, cada empresa participada por Capital Privado en el sector Industria logró aumentar su plan-tilla a un ritmo 13 veces superior al de las empresas del grupo de control. Esta diferencia se hizo aún más evidente al exten-der el análisis hasta 2015: Cada empresa del grupo de control destruyó 18 puestos de trabajo frente a la creación de 92 nue-vos empleos de media en las empresas participadas por el Ca-pital Privado.
Las ventas de cada empresa apoyada por el Capital Privado aumentaron en 27,6 millones de euros, por término medio en la referencia a tres años, lo que equivale a 12 veces la cifra me-dia observada en las empresas del grupo de control. Estos va-lores medios se consolidaron al ampliar el periodo hasta 2015.
El avance en el EBITDA en las empresas que contaron con Ca-pital Privado, contrasta con la negativa evolución en las em-presas del grupo de control. Por término medio, estas últimas terminaron con una reducción del EBITDA de 2,9 millones de euros al ampliar el análisis hasta 2015 frente al crecimiento del EBITDA de las empresas apoyadas por el Capital Privado del 2,7 millones de euros de media por empresa.
El impacto de la inversión de Capital Privado en empresas del sector industrial se manifestó en la considerable diferencia del incremento medio de los activos con respecto a la media del grupo de control en los tres primeros años: Un aumento de 21,9 millones de euros por empresa en las primeras frente a sólo 1 millón en las segundas. Además, el efecto de la crisis y las amortizaciones afectaron menos al grupo de empresas apo-yadas por Capital Privado, que registraron hasta 2015 un cre-cimiento medio de 5,4 millones de euros en sus activos totales por empresa frente a una reducción neta de casi el doble de esta cifra por empresa del grupo de control.
Capital Privado Grupo de Control
2,4 MM €
-1,7 MM €
2,7 MM €
-2,9 MM €
ANUAL HASTAEL TERCER AÑO
AGREGADOHASTA 2015
Capital Privado Grupo de Control
21,9 MM €
1,0 MM €
5,4 MM €
-9,5 MM €
ANUAL HASTAEL TERCER AÑO
AGREGADOHASTA 2015
EVOLUCIÓN DEL EBITDAEN EL SECTOR INDUSTRIA
EVOLUCIÓN DE LOS ACTIVOSEN EL SECTOR INDUSTRIA
103,6
8,0
92,2
-17,9
Capital Privado Grupo de Control
ANUAL HASTAEL TERCER AÑO
AGREGADOHASTA 2015
Capital Privado Grupo de Control
27,6 MM €
2,4 MM €
27,6 MM €
2,3 MM €
ANUAL HASTAEL TERCER AÑO
AGREGADOHASTA 2015
EVOLUCIÓN DEL EMPLEOEN EL SECTOR INDUSTRIA
(NÚMERO DE EMPLEADOS)
EVOLUCIÓN DELAS VENTAS EN EL SECTOR
INDUSTRIA
EL CAPITAL PRIVADO IMPULSALA CREACIÓN DE VALOR EN LAS
EMPRESAS INDUSTRIALES
8. EL CAPITAL PRIVADO Y SU IMPACTO EN DIFERENTES SECTORES
35IMPACTO ECONÓMICO Y SOCIAL DEL CAPITAL PRIVADO EN LAS OPERACIONES DE MIDDLE MARKET EN ESPAÑA 2018 ASCRI
8.2. MANUFACTURING SECTOR
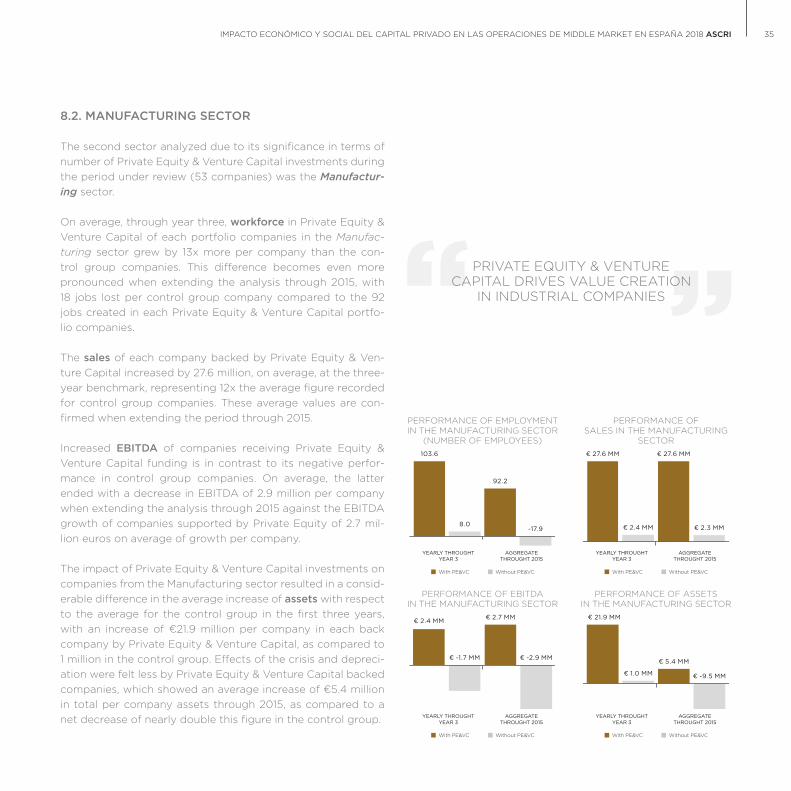
The second sector analyzed due to its significance in terms of number of Private Equity & Venture Capital investments during the period under review (53 companies) was the Manufactur-ing sector.
On average, through year three, workforce in Private Equity & Venture Capital of each portfolio companies in the Manufac-turing sector grew by 13x more per company than the con-trol group companies. This difference becomes even more pronounced when extending the analysis through 2015, with 18 jobs lost per control group company compared to the 92 jobs created in each Private Equity & Venture Capital portfo-lio companies.
The sales of each company backed by Private Equity & Ven-ture Capital increased by 27.6 million, on average, at the three-year benchmark, representing 12x the average figure recorded for control group companies. These average values are con-firmed when extending the period through 2015.
Increased EBITDA of companies receiving Private Equity & Venture Capital funding is in contrast to its negative perfor-mance in control group companies. On average, the latter ended with a decrease in EBITDA of 2.9 million per company when extending the analysis through 2015 against the EBITDA growth of companies supported by Private Equity of 2.7 mil-lion euros on average of growth per company.
The impact of Private Equity & Venture Capital investments on companies from the Manufacturing sector resulted in a consid-erable difference in the average increase of assets with respect to the average for the control group in the first three years, with an increase of €21.9 million per company in each back company by Private Equity & Venture Capital, as compared to 1 million in the control group. Effects of the crisis and depreci-ation were felt less by Private Equity & Venture Capital backed companies, which showed an average increase of €5.4 million in total per company assets through 2015, as compared to a net decrease of nearly double this figure in the control group.
PRIVATE EQUITY & VENTURE CAPITAL DRIVES VALUE CREATION
IN INDUSTRIAL COMPANIES
103.6
8.0
92.2
-17.9
With PE&VC Without PE&VC
YEARLY THROUGHTYEAR 3
AGGREGATETHROUGHT 2015
€ 27.6 MM
€ 2.4 MM
€ 27.6 MM
€ 2.3 MM
With PE&VC Without PE&VC
YEARLY THROUGHTYEAR 3
AGGREGATETHROUGHT 2015
€ 2.4 MM
€ -1.7 MM
€ 2.7 MM
€ -2.9 MM
With PE&VC Without PE&VC
YEARLY THROUGHTYEAR 3
AGGREGATETHROUGHT 2015
€ 21.9 MM
€ 1.0 MM
€ 5.4 MM
€ -9.5 MM
With PE&VC Without PE&VC
YEARLY THROUGHTYEAR 3
AGGREGATETHROUGHT 2015
PERFORMANCE OF EMPLOYMENT IN THE MANUFACTURING SECTOR
(NUMBER OF EMPLOYEES)
PERFORMANCE OFSALES IN THE MANUFACTURING
SECTOR
PERFORMANCE OF EBITDAIN THE MANUFACTURING SECTOR
PERFORMANCE OF ASSETSIN THE MANUFACTURING SECTOR

36
ÁMBITO Y METODOLOGÍADEL ESTUDIOSTUDY SCOPE AND METHODOLOGY
El análisis se centra en las inversiones de 10 a 100 millones de euros comprometidos por entidades de Capital Privado en em-presas españolas entre 2005 y 2012. El universo de inversiones realizadas en España en el periodo considerado, una vez elimi-nada la doble contabilización por sindicación en el mismo año o por inversión en años posteriores, ascendió a 204 empre-sas. De este número, fue posible identificar los datos contables completos de 191, representativas del 93,6% de la población.
Además, se identificaron empresas similares (en sector y ta-maño) a las que fueron objeto de inversión por entidades de Capital Privado con objeto de comparar sus crecimientos ab-solutos y relativos. No fue posible encontrar un comparable válido para 5 de las empresas de la muestra, por su considera-ble tamaño. Por tanto, se encontró una empresa comparable válida para 186 empresas de la muestra, por lo que los análisis comparados se realizan a partir de 186 empresas de la muestra y 186 empresas similares que no fueron participadas por Ca-pital Privado, que constituyen el grupo de control (GC). En el momento de la inversión, las diferencias en las medias en em-pleo, ventas y EBITDA entre ambos grupos no eran estadísti-camente significativas, por lo que constituye un grupo de con-trol válido.
9. ÁMBITO Y METODOLOGÍA DEL ESTUDIO

37IMPACTO ECONÓMICO Y SOCIAL DEL CAPITAL PRIVADO EN LAS OPERACIONES DE MIDDLE MARKET EN ESPAÑA 2018 ASCRI
Para calcular el impacto de las inversiones de middle market se toman dos referencias temporales:
• Desde el año de inversión hasta tres años después.• Desde el año de inversión hasta el año 2015.
Las variables consideradas son:
• Empleo• Ventas• Beneficios antes de intereses, impuestos y amortizaciones
(EBITDA)• Activos totales
Los cálculos realizados se realizan desde varias perspectivas:
• Perspectiva agregada, que se obtiene a partir de los valo-res de inicio y final de las variables analizadas para todas las empresas consideradas, tanto para las empresas de la muestra como para las empresas del grupo de control.
• Perspectiva desagregada, calculando el crecimiento me-dio por empresa, hasta el tercer año o hasta el año 2015, contrastando estadísticamente el nivel de significación de dicho crecimiento a partir de las medias obtenidas. Tam-bién se contrasta la diferencia en el crecimiento con res-pecto a las empresas del grupo de control.
Para el planteamiento agregado, en las tablas se aporta infor-mación sobre:
• Valor agregado inicial del conjunto de las empresas anali-zadas en dicho cuadro, que se corresponde con el año en el que tuvo lugar la inversión.
• Valor agregado al tercer año para el conjunto de empresas analizadas en dicho cuadro.
Si una empresa no existe, o se encuentra en proceso de concurso, extinción o liquidación, al tercer año todas las variables se considera que toman valor nulo en dicho año.
En los casos en los que no fueron depositadas las cuentas anuales en el tercer año, en empresas en las que se cons-tató su actividad, se toman los valores del año anterior disponible.
De igual modo, en el caso de empresas adquiridas por otras, también se toma el último año disponible, evitando la distorsión derivada del tamaño de la entidad adquirente.
• Valor agregado hasta el año 2015 para el conjunto de em-presas analizadas en dicho cuadro, aplicándose el mismo planteamiento expuesto en el párrafo anterior en el caso de las empresas desaparecidas o fusionadas.
• El crecimiento en términos absolutos y relativos hasta el tercer año y hasta 2015.
El desarrollo del análisis se fundamentó en la integración de datos de estas fuentes de información:
• El listado de inversiones de Capital Privado obtenido por ASCRI a través de webcapitalriesgo para la elaboración de las estadísticas del sector de Private Equity y Venture Ca-pital, que difunde ASCRI a través de sus estudios, presen-taciones y página web.
• La base de datos ORBIS para la obtención de los estados contables de las empresas receptoras de las inversiones.
La elaboración de los datos de este estudio la ha rea-lizado el equipo de webcapitalriesgo, con el apoyo de José Martí Pellón, catedrático de Economía Financiera de la Universidad Complutense de Madrid. En la redac-ción de este estudio han participado José Martí Pellón y Ángela Alférez, Directora de estudios de ASCRI.

38
• Disaggregate perspective, calculating the average growth per company through the third year or through 2015, statistically contrasting the level of significance of said growth using the average values obtained. The differenc-es in growth as compared to control group companies are also analyzed.
For the aggregate perspective, the tables provide the follow-ing information:
• Total initial aggregate value of the companies being an-alyzed in the table during the year the investment was made.
Total aggregate value in year three for all companies ana-lyzed in the table.
If a company does not exist or is in insolvency, termination or liquidation as of year three, the value of that company for that year will be considered zero.
If the annual financial statements of the companies receiv-ing investments were not submitted for year three, the val-ue of these companies will be equivalent to the most re-cent values available.
Likewise, if a company is acquired by another company, the last available value will likewise be applied, thus avoid-ing any distortion from the size of the acquiring company.
• Total aggregate value through 2015 for the companies an-alyzed in the table, applying the same approach explained in the previous paragraph for companies that have been dissolved or merged.
• Absolute and relative growth at year three and through 2015.
The analysis focused on VC&PE investments of €10–100 million made in Spanish companies between 2005 and 2012. All the relevant investments made in Spain during the period under review, after eliminating the double counting resulting from syndication in the same year or for investments in subsequent years, totaled 204 companies. Of this number, full accounting data for 191 companies was obtained, representing 93.6% of the population.
Companies similar (by sector and size) to those receiving in-vestments from Private Equity & Venture Capital entities were also identified with a view to comparing their absolute and rel-ative growth. No valid comparable was found for 5 of the sam-ple companies due to their large size. This means that valid comparable companies were found for 186 sample companies, meaning that all comparative analyses were completed based on 186 sample companies and 186 similar companies that were not Private Equity & Venture Capital portfolio companies, and which comprise the Control Group (CG). At the time of invest-ment, the differences in average employment, sales and EBIT-DA between both groups were not statistically significant, making it a valid control group.
The impact of middle market investments is assessed taking into account two time horizons:
• From the year of the investment plus three years.• From the year of the investment through 2015.
The variables considered are:
• Employment• Sales• Earnings before Interest, Tax, Depreciation and Amortiza-
tion (EBITDA)• Total Assets
Calculations are made from various perspectives:
• Aggregate perspective calculated based on the initial and final values of the variables analyzed for all companies un-der review, including companies from the sample and the control group.
9. ÁMBITO Y METODOLOGÍA DEL ESTUDIO

39IMPACTO ECONÓMICO Y SOCIAL DEL CAPITAL PRIVADO EN LAS OPERACIONES DE MIDDLE MARKET EN ESPAÑA 2018 ASCRI
The results of this study has been carried out by web-capitalriesgo, with the support of José Martí Pellón, Professor of Financial Economics from the Com-plutense University of Madrid. In the elaboration of this study have participated José Martí Pellón and Ángela Alférez, Research Director at ASCRI.
The analysis was completed based on information obtained from the following sources:
• The list of Private Equity & Venture Capital investments obtained by webcapitalriesgo in collaboration with ASCRI in order to develop statistics for the Private Equity and Venture Capital sector, and which are published by ASCRI through its studies, presentations and websites.
• ORBIS database for obtaining the financial statements of investee companies.

40 10. CUADROS DETALLADOS DEL INFORME
1. CRECIMIENTOS ABSOLUTOS Y RELATIVOS HASTA EL TERCER AÑO Y HASTA 2015 PARA TODA LA MUESTRA ANALIZADA ABSOLUTE AND RELATIVE GROWTH AT YEAR THREE AND THROUGH 2015 FOR ALL ANALYZED SAMPLE COMPANIES
Hasta 3er añoThrough Year 3
Hasta año 2015Through 2015
VariableVariable
Año 0Year 0
Año 3Year 3
20152015
VariaciónChange
% anualper annum
VariaciónChange
% agregadoaggregate
Empleo / Employment 152 187 196 34 7,00% 44 28,58%
Ventas / Sales 16.499 20.978 22.265 4.479 8,34% 5.766 34,95%
EBITDA / EBITDA 1.564 1.846 1.898 282 5,69% 334 21,39%
Activos totales / Total Assets 22.748 28.636 27.010 5.889 7,98% 4.263 18,74%
Número de empresas: 191 / Number of companies: 191Datos contables en millones de euros. Empleo en miles de trabajadores. / Accounting data in millions of Euros. Employment in thousands of Euros.Nota: Los crecimientos en empleo y en ventas son muy significativos estadísticamente, tanto hasta el tercer año como hasta el año 2015. El crecimiento en activos totales es altamente significativo hasta el tercer año. / Note: Growth in employment and sales are highly statistically significant through year three and through 2015. Growth in total assets is highly significant through year three.
CUADROS DETALLADOSDEL INFORMEDETAILED REPORT TABLES
41IMPACTO ECONÓMICO Y SOCIAL DEL CAPITAL PRIVADO EN LAS OPERACIONES DE MIDDLE MARKET EN ESPAÑA 2018 ASCRI
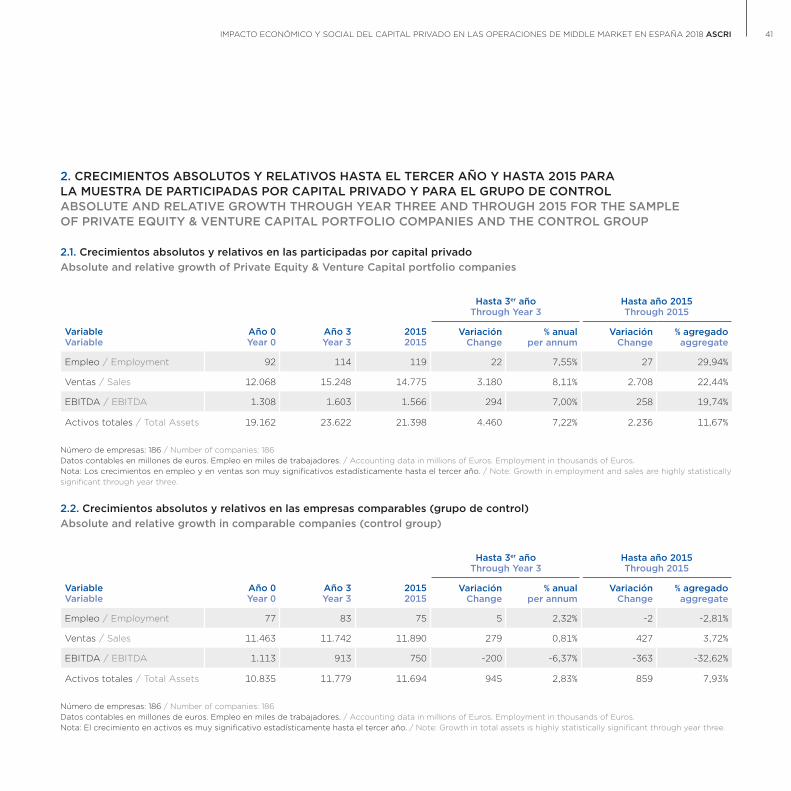
2. CRECIMIENTOS ABSOLUTOS Y RELATIVOS HASTA EL TERCER AÑO Y HASTA 2015 PARA LA MUESTRA DE PARTICIPADAS POR CAPITAL PRIVADO Y PARA EL GRUPO DE CONTROL ABSOLUTE AND RELATIVE GROWTH THROUGH YEAR THREE AND THROUGH 2015 FOR THE SAMPLE OF PRIVATE EQUITY & VENTURE CAPITAL PORTFOLIO COMPANIES AND THE CONTROL GROUP
2.1. Crecimientos absolutos y relativos en las participadas por capital privado Absolute and relative growth of Private Equity & Venture Capital portfolio companies
Hasta 3er añoThrough Year 3
Hasta año 2015Through 2015
VariableVariable
Año 0Year 0
Año 3Year 3
20152015
VariaciónChange
% anualper annum
VariaciónChange
% agregadoaggregate
Empleo / Employment 92 114 119 22 7,55% 27 29,94%
Ventas / Sales 12.068 15.248 14.775 3.180 8,11% 2.708 22,44%
EBITDA / EBITDA 1.308 1.603 1.566 294 7,00% 258 19,74%
Activos totales / Total Assets 19.162 23.622 21.398 4.460 7,22% 2.236 11,67%
Número de empresas: 186 / Number of companies: 186Datos contables en millones de euros. Empleo en miles de trabajadores. / Accounting data in millions of Euros. Employment in thousands of Euros.Nota: Los crecimientos en empleo y en ventas son muy significativos estadísticamente hasta el tercer año. / Note: Growth in employment and sales are highly statistically significant through year three.
2.2. Crecimientos absolutos y relativos en las empresas comparables (grupo de control) Absolute and relative growth in comparable companies (control group)
Hasta 3er añoThrough Year 3
Hasta año 2015Through 2015
VariableVariable
Año 0Year 0
Año 3Year 3
20152015
VariaciónChange
% anualper annum
VariaciónChange
% agregadoaggregate
Empleo / Employment 77 83 75 5 2,32% -2 -2,81%
Ventas / Sales 11.463 11.742 11.890 279 0,81% 427 3,72%
EBITDA / EBITDA 1.113 913 750 -200 -6,37% -363 -32,62%
Activos totales / Total Assets 10.835 11.779 11.694 945 2,83% 859 7,93%
Número de empresas: 186 / Number of companies: 186Datos contables en millones de euros. Empleo en miles de trabajadores. / Accounting data in millions of Euros. Employment in thousands of Euros.Nota: El crecimiento en activos es muy significativo estadísticamente hasta el tercer año. / Note: Growth in total assets is highly statistically significant through year three.

42 10. CUADROS DETALLADOS DEL INFORME
2.3. Contraste estadístico de la diferencia en el crecimiento medio acumulado por empresa entre ambos grupos Statistical contrast in the difference in average cumulative per company growth between groups
Capital privadoVenture Capital & P. Equity
Grupo de controlControl Group
VariablesVariables
MediaAvg.
Des. Tip.Std. Dev.
MediaAvg.
Des. Tip.Std. Dev.
DiferenciaDifference
Sig.Sig.
Tercer año / Year 3
Empleo / Employment 120,4 500,6 29,5 237,2 90,9 ***
Ventas / Sales 17,1 59,5 1,5 36,3 15,60 **
EBITDA / EBITDA 1,6 12,9 -1,1 10,0 2,66 **
Activos totales / Total Assets 24,0 74,3 5,1 35,3 18,90 ***
Año 2015 / Year 2015
Empleo / Employment 147,8 1.060,5 -11,6 458,5 159 *
Ventas / Sales 14,6 102,9 2,3 76,3 12,26
EBITDA / EBITDA 1,4 19,0 -2,0 15,8 3,34 *
Activos totales / Total Assets 12,0 149,3 4,5 83,9 7,49
Número de empresas: 186 apoyadas por capital privado y 186 del grupo de control. / Number of companies: 186 backed by Private Equity & Venture Capital and 186 in the control group.Notas: / Notes:
Empleo: Crecimiento medio del número de empleados por empresa. / Employment: Average growth in the number of employees per company.Resto variables: Crecimiento medio por empresa en millones de euros. / Other Variables: Average growth per company (in millions of Euros).* Diferencia en medias estadísticamente significativa al 10%. / * Difference in statistically significant averages at 10%.** Diferencia en medias estadísticamente significativa al 5%. / ** Difference in statistically significant averages at 5%.*** Diferencia en medias estadísticamente significativa al 1%. / *** Difference in statistically significant averages at 1%.

43IMPACTO ECONÓMICO Y SOCIAL DEL CAPITAL PRIVADO EN LAS OPERACIONES DE MIDDLE MARKET EN ESPAÑA 2018 ASCRI
2.4. Contraste estadístico de la diferencia en el crecimiento medio anual por empresa hasta 2015 entre ambos grupos Statistical contrast in the difference in average annual per company growth through 2015 between both groups
Capital privadoVenture Capital & P. Equity
Grupo de controlControl Group
VariablesVariables
MediaAvg.
Des. Tip.Std. Dev.
MediaAvg.
Des. Tip.Std. Dev.
DiferenciaDifference
Sig.Sig.
Hasta el año 2015 / Through 2015
Empleo / Employment 21,6 132,1 -1,4 54,9 23,0 **
Ventas / Sales 2.426,1 13.337,6 425,6 9.618,9 2.000,5 *
EBITDA / EBITDA 268,0 2.455,58 -187,3 2.019,6 455,2 *
Activos totales / Total Assets 1.945,9 17.819,7 698,9 11.084,1 1.247,1
Número de empresas: 186 apoyadas por capital privado y 186 del grupo de control. Number of companies: 186 backed by Private Equity & Venture Capital and 186 in the control group.Notas: Notes:
Empleo: Crecimiento medio del número de empleados por empresa. / Employment: Average growth in the number of employees per company.Resto variables: Crecimiento medio por empresa en millones de euros. / Other Variables: Average growth per company (in millions of Euros).* Diferencia en medias estadísticamente significativa al 10%. / * Difference in statistically significant averages at 10%.** Diferencia en medias estadísticamente significativa al 5%. / ** Difference in statistically significant averages at 5%.*** Diferencia en medias estadísticamente significativa al 1%. / *** Difference in statistically significant averages at 1%.
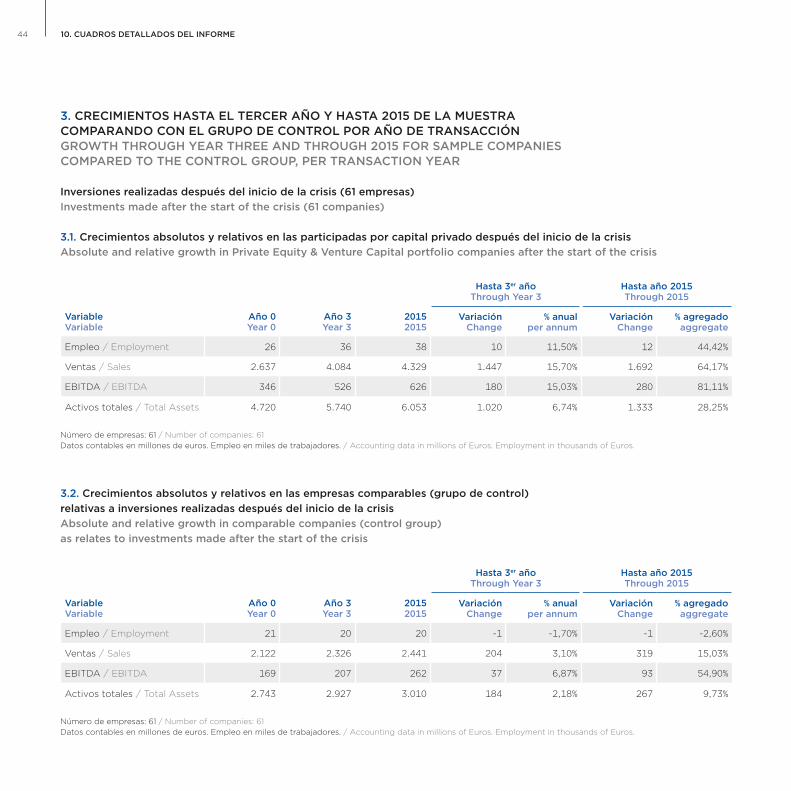
44 10. CUADROS DETALLADOS DEL INFORME
3. CRECIMIENTOS HASTA EL TERCER AÑO Y HASTA 2015 DE LA MUESTRA COMPARANDO CON EL GRUPO DE CONTROL POR AÑO DE TRANSACCIÓN GROWTH THROUGH YEAR THREE AND THROUGH 2015 FOR SAMPLE COMPANIES COMPARED TO THE CONTROL GROUP, PER TRANSACTION YEAR
Inversiones realizadas después del inicio de la crisis (61 empresas) Investments made after the start of the crisis (61 companies)
3.1. Crecimientos absolutos y relativos en las participadas por capital privado después del inicio de la crisis Absolute and relative growth in Private Equity & Venture Capital portfolio companies after the start of the crisis
Hasta 3er añoThrough Year 3
Hasta año 2015Through 2015
VariableVariable
Año 0Year 0
Año 3Year 3
20152015
VariaciónChange
% anualper annum
VariaciónChange
% agregadoaggregate
Empleo / Employment 26 36 38 10 11,50% 12 44,42%
Ventas / Sales 2.637 4.084 4.329 1.447 15,70% 1.692 64,17%
EBITDA / EBITDA 346 526 626 180 15,03% 280 81,11%
Activos totales / Total Assets 4.720 5.740 6.053 1.020 6,74% 1.333 28,25%
Número de empresas: 61 / Number of companies: 61Datos contables en millones de euros. Empleo en miles de trabajadores. / Accounting data in millions of Euros. Employment in thousands of Euros.
3.2. Crecimientos absolutos y relativos en las empresas comparables (grupo de control) relativas a inversiones realizadas después del inicio de la crisis Absolute and relative growth in comparable companies (control group) as relates to investments made after the start of the crisis
Hasta 3er añoThrough Year 3
Hasta año 2015Through 2015
VariableVariable
Año 0Year 0
Año 3Year 3
20152015
VariaciónChange
% anualper annum
VariaciónChange
% agregadoaggregate
Empleo / Employment 21 20 20 -1 -1,70% -1 -2,60%
Ventas / Sales 2.122 2.326 2.441 204 3,10% 319 15,03%
EBITDA / EBITDA 169 207 262 37 6,87% 93 54,90%
Activos totales / Total Assets 2.743 2.927 3.010 184 2,18% 267 9,73%
Número de empresas: 61 / Number of companies: 61Datos contables en millones de euros. Empleo en miles de trabajadores. / Accounting data in millions of Euros. Employment in thousands of Euros.

45IMPACTO ECONÓMICO Y SOCIAL DEL CAPITAL PRIVADO EN LAS OPERACIONES DE MIDDLE MARKET EN ESPAÑA 2018 ASCRI
3.3. Contraste estadístico de la diferencia en el crecimiento medio acumulado por empresa entre ambos grupos Statistical contrast in the difference in average cumulative per company growth between groups
Capital privadoVenture Capital & P. Equity
Grupo de controlControl Group
VariablesVariables
MediaAvg.
Des. Tip.Std. Dev.
MediaAvg.
Des. Tip.Std. Dev.
DiferenciaDifference
Sig.Sig.
Tercer año / Year 3
Empleo / Employment 166,0 493,1 -17,2 147,9 183,3 ***
Ventas / Sales 23,7 46,8 3,3 25,6 20,4 ***
EBITDA / EBITDA 3,0 9,5 0,6 5,0 2,3 *
Activos totales / Total Assets 16,7 41,7 3,0 26,6 13,7 **
Año 2015 / Year 2015
Empleo / Employment 191,0 658,2 -9,0 178,0 199,9 **
Ventas / Sales 27,7 58,6 5,2 31,3 22,5 ***
EBITDA / EBITDA 4,6 12,2 1,5 8,0 3,1
Activos totales / Total Assets 21,9 57,6 4,4 37,8 17,5 **
Número de empresas: 61 apoyadas por capital privado y 61 del grupo de control. / Number of companies: 61 backed by Private Equity & Venture Capital and 61 in the con-trol group.Notas: / Notes:
Empleo: Crecimiento medio del número de empleados por empresa. / Employment: Average growth in the number of employees per company.Resto variables: Crecimiento medio por empresa en millones de euros. / Other Variables: Average growth per company (in millions of Euros).* Diferencia en medias estadísticamente significativa al 10%. / * Difference in statistically significant averages at 10%.** Diferencia en medias estadísticamente significativa al 5%. / ** Difference in statistically significant averages at 5%.*** Diferencia en medias estadísticamente significativa al 1%. / *** Difference in statistically significant averages at 1%.

46 10. CUADROS DETALLADOS DEL INFORME
4. CRECIMIENTOS HASTA EL TERCER AÑO Y HASTA 2015 DE LA MUESTRA CON GRUPO DE CONTROL EN LOS SECTORES MÁS REPRESENTATIVOS GROWTH THROUGH YEAR THREE AND THROUGH 2015 FOR SAMPLE COMPANIES COMPARED TO THE CONTROL GROUP IN THE MOST REPRESENTATIVE SECTORS
Otros servicios (80 empresas) Other services (80 companies)
4.1. Crecimientos absolutos y relativos en las participadas por capital privado Absolute and relative growth of Private Equity & Venture Capital portfolio companies
Hasta 3er añoThrough Year 3
Hasta año 2015Through 2015
VariableVariable
Año 0Year 0
Año 3Year 3
20152015
VariaciónChange
% anualper annum
VariaciónChange
% agregadoaggregate
Empleo / Employment 55 71 75 16 8,63% 20 35,80%
Ventas / Sales 4.718 6.185 5.398 1.467 9,45% 681 14,43%
EBITDA / EBITDA 425 454 481 29 2,20% 56 13,24%
Activos totales / Total Assets 8.159 9.483 8.281 1.325 5,14% 122 1,50%
Número de empresas: 80 / Number of companies: 80Datos contables en millones de euros. Empleo en miles de trabajadores. / Accounting data in millions of Euros. Employment in thousands of Euros.
4.2. Crecimientos absolutos y relativos en las empresas comparables (grupo de control) Absolute and relative growth in comparable companies (control group)
Hasta 3er añoThrough Year 3
Hasta año 2015Through 2015
VariableVariable
Año 0Year 0
Año 3Year 3
20152015
VariaciónChange
% anualper annum
VariaciónChange
% agregadoaggregate
Empleo / Employment 50 54 45 4 2,40% -5 -9,39%
Ventas / Sales 4.584 4.615 4.236 31 0,22% -348 -7,59%
EBITDA / EBITDA 430 346 302 -83 -6,95% -128 -29,73%
Activos totales / Total Assets 4.316 4.817 5.221 501 3,73% 905 20,96%
Número de empresas: 80 / Number of companies: 80Datos contables en millones de euros. Empleo en miles de trabajadores. / Accounting data in millions of Euros. Employment in thousands of Euros.

47IMPACTO ECONÓMICO Y SOCIAL DEL CAPITAL PRIVADO EN LAS OPERACIONES DE MIDDLE MARKET EN ESPAÑA 2018 ASCRI
4.3. Contraste estadístico de la diferencia en el crecimiento medio acumulado por empresa entre ambos grupos Statistical contrast in the difference in average cumulative per company growth between groups
Capital privadoVenture Capital & P. Equity
Grupo de controlControl Group
VariablesVariables
MediaAvg.
Des. Tip.Std. Dev.
MediaAvg.
Des. Tip.Std. Dev.
DiferenciaDifference
Sig.Sig.
Tercer año / Year 3
Empleo / Employment 194,3 685,8 46,2 342,1 148,2 *
Ventas / Sales 18,3 59,9 0,4 29,7 18,0 **
EBITDA / EBITDA 0,4 12,6 -1,0 10,4 1,4 No
Activos totales / Total Assets 16,6 47,2 6,3 35,4 10,3 No
Año 2015 / Year 2015
Empleo / Employment 246,9 1.532,5 -58,8 642,4 305,6 *
Ventas / Sales 8,5 112,7 -4,4 51,4 12,9
EBITDA / EBITDA 0,7 19,8 -1,6 12,4 2,3
Activos totales / Total Assets 1,5 119,4 11,1 89,2 -9,6
Número de empresas: 80 apoyadas por capital privado y 80 del grupo de control. / Number of companies: 80 backed by Private Equity & Venture Capital and 80 in the control group.Notas: / Notes:
Empleo: Crecimiento medio del número de empleados por empresa. Employment: Average growth in the number of employees per company.Resto variables: Crecimiento medio por empresa en millones de euros. Other Variables: Average growth per company (in millions of Euros).* Diferencia en medias estadísticamente significativa al 10%. / * Difference in statistically significant averages at 10%.** Diferencia en medias estadísticamente significativa al 5%. / ** Difference in statistically significant averages at 5%.*** Diferencia en medias estadísticamente significativa al 1%. / *** Difference in statistically significant averages at 1%.

48
Industria (53 empresas) Manufacturing (53 companies)
4.4. Crecimientos absolutos y relativos en las participadas por capital privado Absolute and relative growth of Private Equity & Venture Capital portfolio companies
Hasta 3er añoThrough Year 3
Hasta año 2015Through 2015
VariableVariable
Año 0Year 0
Año 3Year 3
20152015
VariaciónChange
% anualper annum
VariaciónChange
% agregadoaggregate
Empleo / Employment 19 25 24 5 8,65% 5 25,25%
Ventas / Sales 4.013 5.449 5.465 1.436 10,74% 1.453 36,20%
EBITDA / EBITDA 539 661 680 122 7,05% 141 26,22%
Activos totales / Total Assets 6.106 7.208 6.375 1.102 5,69% 269 4,40%
Número de empresas: 53 / Number of companies: 53Datos contables en millones de euros. Empleo en miles de trabajadores. / Accounting data in millions of Euros. Employment in thousands of Euros.
4.5. Crecimientos absolutos y relativos en las empresas comparables (grupo de control) Absolute and relative growth in comparable companies (control group)
Hasta 3er añoThrough Year 3
Hasta año 2015Through 2015
VariableVariable
Año 0Year 0
Año 3Year 3
20152015
VariaciónChange
% anualper annum
VariaciónChange
% agregadoaggregate
Empleo / Employment 15 15 14 0 0,96% -1 -6,52%
Ventas / Sales 3.651 3.776 3.772 125 1,13% 121 3,33%
EBITDA / EBITDA 349 257 197 -92 -9,69% -152 -43,64%
Activos totales / Total Assets 3.725 3.777 3.221 52 0,46% -504 -13,53%
Número de empresas: 53 / Number of companies: 53Datos contables en millones de euros. Empleo en miles de trabajadores. / Accounting data in millions of Euros. Employment in thousands of Euros.

49IMPACTO ECONÓMICO Y SOCIAL DEL CAPITAL PRIVADO EN LAS OPERACIONES DE MIDDLE MARKET EN ESPAÑA 2018 ASCRI
4.6. Contraste estadístico de la diferencia en el crecimiento medio acumulado por empresa entre ambos grupos Statistical contrast in the difference in average cumulative per company growth between groups
Capital privadoVenture Capital & P. Equity
Grupo de controlControl Group
VariablesVariables
MediaAvg.
Des. Tip.Std. Dev.
MediaAvg.
Des. Tip.Std. Dev.
DiferenciaDifference
Sig.Sig.
Tercer año / Year 3
Empleo / Employment 103,6 339,4 8,0 61,0 95,6 **
Ventas / Sales 27,6 57,5 2,4 31,7 25,2 ***
EBITDA / EBITDA 2,4 13,1 -1,7 7,3 4,2 **
Activos totales / Total Assets 21,9 63,7 1,0 35,6 20,9 **
Año 2015 / Year 2015
Empleo / Employment 92,2 467,4 -17,9 135,9 110,0 *
Ventas / Sales 27,6 89,7 2,3 76,5 25,3
EBITDA / EBITDA 2,7 20,9 -2,9 19,0 5,5
Activos totales / Total Assets 5,4 144,6 -9,5 82,1 15,0
Número de empresas: 53 apoyadas por capital privado y 53 del grupo de control. / Number of companies: 53 backed by Private Equity & Venture Capital and 53 in the con-trol group.Notas: / Notes:
Empleo: Crecimiento medio del número de empleados por empresa. / Employment: Average growth in the number of employees per company.Resto variables: Crecimiento medio por empresa en millones de euros. / Other Variables: Average growth per company (in millions of Euros).** Diferencia en medias estadísticamente significativa al 5%. / ** Difference in statistically significant averages at 5%.*** Diferencia en medias estadísticamente significativa al 1%. / *** Difference in statistically significant averages at 1%.
5. INVERSIONES NUEVAS ENTRE 10 Y 100 MILLONES DE EUROS Y REPRESENTATIVIDAD DE LA MUESTRA NEW INVESTMENTS BETWEEN €10 AND 100 MILLION THAT ARE REPRESENTATIVE OF THE SAMPLES
Variable / Variables 2005 2006 2007 2008 2009 2010 2011 2012 Total
Inversión (M€)Investment (€M) 598,4 1.484,2 1.052,2 809,1 587,0 311,7 436,7 527,2 5.806,6
Universo (empresas)Universe (companies) 25 44 41 24 20 13 20 17 204
Muestra (empresas)Sample (companies) 21 44 41 22 17 13 20 13 191
Representación (%) Representation (%) 84,0% 100,0% 100,0% 91,7% 85,0% 100,0% 100,0% 76,5% 93,6%


Príncipe de Vergara 55, 4ºD28006 Madrid
Tel: (+34) 91 411 96 17www.ascri.org
ASOCIACIÓN ESPAÑOLADE CAPITAL, CRECIMIENTOE INVERSION
Patrocinado por / Sponsored by: Con la colaboración de/ in collaboration with:
Fundación ICO