impact of transposable elements on genome structure and
TRANSCRIPT
RESEARCH Open Access
Impact of transposable elements ongenome structure and evolution in breadwheatThomas Wicker1†, Heidrun Gundlach2†, Manuel Spannagl2, Cristobal Uauy3, Philippa Borrill3,Ricardo H. Ramírez-González3, Romain De Oliveira4, International Wheat Genome Sequencing Consortium5,Klaus F. X. Mayer2,6, Etienne Paux4 and Frédéric Choulet4*
Abstract
Background: Transposable elements (TEs) are major components of large plant genomes and main drivers ofgenome evolution. The most recent assembly of hexaploid bread wheat recovered the highly repetitive TE space inan almost complete chromosomal context and enabled a detailed view into the dynamics of TEs in the A, B, and Dsubgenomes.
Results: The overall TE content is very similar between the A, B, and D subgenomes, although we find no evidencefor bursts of TE amplification after the polyploidization events. Despite the near-complete turnover of TEs since thesubgenome lineages diverged from a common ancestor, 76% of TE families are still present in similar proportionsin each subgenome. Moreover, spacing between syntenic genes is also conserved, even though syntenic TEs havebeen replaced by new insertions over time, suggesting that distances between genes, but not sequences, areunder evolutionary constraints. The TE composition of the immediate gene vicinity differs from the core intergenicregions. We find the same TE families to be enriched or depleted near genes in all three subgenomes. Evaluationsat the subfamily level of timed long terminal repeat-retrotransposon insertions highlight the independent evolutionof the diploid A, B, and D lineages before polyploidization and cases of concerted proliferation in the AB tetraploid.
Conclusions: Even though the intergenic space is changed by the TE turnover, an unexpected preservation is observedbetween the A, B, and D subgenomes for features like TE family proportions, gene spacing, and TE enrichment near genes.
Keywords: Transposable elements, Wheat genome, Genome evolution, LTR retrotransposons, Polyploidy, Triticum aestivum
BackgroundTransposable elements (TEs) are ubiquitous componentsof genomes and one of the major forces driving genomeevolution [1]. They are classified into two classes: retro-transposons (class 1), transposing via reverse transcriptionof their messenger RNA (mRNA), and DNA transposons(class 2), representing all other types of elements [2]. TEsare small genetic units with the ability to make copies ofthemselves or move around in the genome. They do notencode a function that would allow them to be maintainedby selection across generations; rather, their strategy relies
on their autonomous or non-autonomous amplification.TEs are subject to rapid turnover, are the main contribu-tors of intraspecific genomic diversity, and are the mainfactor explaining genome size variations. Thus, TEs repre-sent the dynamic reservoir of the genomes. They are epi-genetically silenced [3], preventing them from long-termmassive amplification that could be detrimental. The dy-namics of TEs in genomes remains unclear, and it wassupposed that they may escape silencing and experiencebursts of amplification followed by rapid silencing. Theirimpact on gene expression has also been documented inmany species (for a review, see [4]). In addition, they playa role at the structural level, as essential components ofcentromeric chromatin in plants [3, 5]. Plant genomes aregenerally dominated by a small number of highly repeated
* Correspondence: [email protected]†Thomas Wicker and Heidrun Gundlach contributed equally to this work.4GDEC, INRA, UCA (Université Clermont Auvergne), Clermont-Ferrand, FranceFull list of author information is available at the end of the article
© The Author(s). 2018 Open Access This article is distributed under the terms of the Creative Commons Attribution 4.0International License (http://creativecommons.org/licenses/by/4.0/), which permits unrestricted use, distribution, andreproduction in any medium, provided you give appropriate credit to the original author(s) and the source, provide a link tothe Creative Commons license, and indicate if changes were made. The Creative Commons Public Domain Dedication waiver(http://creativecommons.org/publicdomain/zero/1.0/) applies to the data made available in this article, unless otherwise stated.
Wicker et al. Genome Biology (2018) 19:103 https://doi.org/10.1186/s13059-018-1479-0

families, especially class I Gypsy and Copia long ter-minal repeat retrotransposons (LTR-RTs) [6–10]. Mostof our knowledge about TE dynamics and their impacton gene expression in complex plant genomes comesfrom maize [10–14]. At the whole genome level,Makarevitch et al. have shown that four to nine maizeTE families, including all major class I superfamilies(Gypsy, Copia, long interspersed nuclear elements(LINEs)), and DNA transposons, are enriched (morethan twofold) in promoters of genes being up-regulatedin response to different abiotic stresses [15]. This studyalso suggested that TEs are a major source of allelicvariations explaining differential response to stress be-tween accessions.The genome of bread wheat (Triticum aestivum L.),
one of the most important crop species, has also under-gone massive TE amplification with more than 85% ofit being derived from such repeat elements. It is an allo-hexaploid comprising three subgenomes (termed A, B,and D) that have diverged from a common ancestoraround 2–3 million years ago (Mya) (according to mo-lecular dating of chloroplast DNA [16]) and hybridizedwithin the last half million years. This led to theformation of a complex, redundant, and allohexaploidgenome. These characteristics make the wheat genomeby far the largest and most complex genome that hasbeen sequenced and assembled into near-completechromosomes so far. They, however, also make wheat aunique system in which to study the impact of TE ac-tivity on genome structure, function, and organization.Previously only one reference sequence quality
wheat chromosome was available, which we annotatedusing our automated TE annotation pipeline (CLAR-ITE) [17, 18]. However, it was unknown whether theTE content of chromosome 3B was typical of all wheatchromosomes and how TE content varied between theA, B, and D subgenomes. Therefore, in this study, weaddress the contribution of TEs to wheat genomeevolution on a chromosome-wide scale. We report onthe comparison of the three A-B-D subgenomes interms of TE content and proliferation dynamics. Weshow that, although rounds of TE insertions/deletionshave completely modified the TE space since A-B-Ddiverged, the proportion of each TE family remainedstable between subgenomes. In addition, the specificTE landscape in the direct vicinity of genes is verysimilar between the three subgenomes. Our resultsstrongly suggest that TEs play a role at the structurallevel likely under selection pressure. We also identi-fied TE families that are over-represented inpromoters compared to the rest of the genome but didnot reveal a strong association between particular TEfamilies and nearby gene expression pattern or astrong stress-response association.
Results and discussionTE content and distribution along the 21 bread wheatchromosomesBuilding from a decade-long effort from the wheatgenomics community, we used the accumulatedknowledge about TEs to precisely delineate the TErepertoire of the 21 chromosomes based on a similaritysearch with a high-quality TE databank: ClariTeRep[17] which includes TREP [19]. This represents 3050manually annotated and curated TEs carried by thethree subgenomes and mainly identified on bacterialartificial chromosome (BAC) sequences obtained dur-ing map-based cloning or survey sequencing projects,especially on chromosome 3B [20]. CLARITE was usedto model TEs in the sequence and their nested inser-tions when possible [17]. This led to the identificationof 3,968,974 TE copies, belonging to 505 families, andrepresenting 85% of RefSeq_v1.0. Overall, the TE pro-portion is very similar in the A, B, and D subgenomes,as they represented 86%, 85%, and 83% of the sequence,respectively. However, the sizes of the subgenomesdiffer: with 5.18 Gb, the B subgenome has the largestassembly size, followed by the A subgenome (4.93 Gb)and the smaller D subgenome (3.95 Gb). The repetitivefraction is mostly dominated by TEs of the class IGypsy and Copia and class II CACTA superfamilies;other superfamilies contribute very little to overallgenome size (Table 1, Fig. 1a).At the superfamily level, the A, B, and D subgenomes
have similar TE compositions (Fig. 1a). The smaller size ofthe D subgenome (~ 1 Gb smaller than A and B) is mainlydue to a smaller amount of Gypsy (~ 800 Mb less; Fig. 1a).The A and B subgenomes differ in size by only 245 Mb(~ 5%), and nearly half of this (106 Mb) is not due toknown TEs but rather to low copy sequences. Since theamount of coding DNA is very conserved (43, 46, and44 Mb, respectively), this difference is mainly due to partsof the genome that remained un-annotated so far. Thisun-annotated portion of the genome may contain degen-erated and unknown weakly repeated elements.Similar to other complex genomes, only six highly
abundant TE families represent more than half of the TEcontent: RLC_famc1 (Angela), DTC_famc2 (Jorge),RLG_famc2 (Sabrina), RLG_famc1 (Fatima), RLG_famc7(Sumana/Sumaya), and RLG_famc5 (WHAM), while 486families out of 505 (96%) each account for less than 1%of the TE fraction. In terms of copy number, 50% (253)of the families are repeated in fewer than 1000 copies atthe whole genome level, while more than 100,000 copieswere detected for each of the seven most repeated fam-ilies (up to 420,639 Jorge copies).Local variations of the TE density were observed
following a pattern common to all chromosomes: the TEproportion is lower (on average 73%) in the distal
Wicker et al. Genome Biology (2018) 19:103 Page 2 of 18

regions than in the proximal and interstitial regions (onaverage 89%). However, much stronger local variationswere observed when distributions of individual TE fam-ilies were studied. Figure 1b shows TE distributionsusing chromosome 1A as a representative example. Dis-tributions for selected TE families on all chromosomesare shown in Additional file 1: Figures S1–S11. Themost abundant TE family, RLC_famc1 (Angela) wasenriched towards telomeres and depleted in proximal re-gions. In contrast, highly abundant Gypsy retrotranspo-sons RLG_famc2 (Sabrina, Fig. 1b) and RLG_famc5(WHAM, not shown) were enriched in central parts ofchromosome arms and less abundant in distal regions.CACTA TEs also showed a variety of distribution pat-terns. They can be grouped into distinct clades depend-ing on their distribution pattern, as suggested earlierbased on chromosome 3B TE analyses [17]. Families ofthe Caspar clade [21] are highly enriched in telomericregions, as is shown for the example of the DTC_famc1(Caspar) whereas DTC_famc2 (Jorge) showed the oppos-ite pattern (Fig. 1b).Centromeres have a specific TE content. Previous stud-
ies on barley and wheat reported that the Gypsy familyRLG_famc8.3 (Cereba) is enriched in centromeres [22,23]. It was speculated that Cereba integrase can targetcentromere-specific heterochromatin due to the presenceof a chromodomain that binds specifically to centromerichistones [24]. We found that wheat Cereba elements are
concentrated in centromeric regions but absent from therest of the genome (Fig. 1b, Additional file 1: Figure S8),as are their closely related subfamilies RLG_famc8.1 andRLG_famc8.2 (Quinta). We identified new TE familiesthat are also highly enriched in centromeres. The familyRLG_famc39 (Abia) is a relative of Cereba, although thereis very little sequence DNA conservation between the two.However, at the protein level, Cereba is its closesthomolog. Abia and Cereba have an extremely similardistribution (Fig. 1b, Additional file 1: Figures S8 and S9).Interestingly, on chromosome 6A Cereba is moreabundant, while on 3B, Abia is more abundant, suggestingthat the two TE families are competing for the centro-meric niche. Abia seems to be a wheat-specific TE family,as it was not present in the recently published barleygenome [25]. A recent study on the barley genome re-ported on a novel centromeric Gypsy family called Abiba[21]. We identified a homolog in wheat: RLG_famc40(Abiba), with two distinct subfamilies RLG_famc40.1 andRLG_famc40.2, corresponding to the putatively autono-mous and non-autonomous variants. Abiba is enriched incentral parts of chromosomes but with a broader spread-ing compared to Abia and Cereba (Additional file 1:Figures S10 and S11). At a higher resolution, we identifiedlarge tandem arrays of Cereba and Abia elements thatcorrespond to the high k-mer frequencies observed at thecentromeres (Fig. 2d), which might be the signature offunctional centromeres (Additional file 1: Figure S12).
Table 1 Proportion of TE superfamilies in the A, B, and D subgenomes and at the whole genome level. Proportions are expressedas the percentage of sequences assigned to each superfamily relatively to the genome size. TIR terminal inverted repeat
A B D Complete genome
Class 1 LTR retrotransposons
Gypsy (RLG) 50.9% 46.8% 41.4% 46.7%
Copia (RLC) 17.5% 16.2% 16.3% 16.7%
Unclassified LTR-RT (RLX) 2.6% 3.5% 3.7% 3.2%
Non-LTR retrotransposons
LINE (RIX) 0.82% 0.96% 0.93% 0.90%
SINE (RSX) 0.01% 0.01% 0.01% 0.01%
Class 2 DNA transposons
CACTA (DTC) 12.8% 15.5% 19.0% 15.5%
Mutator (DTM) 0.30% 0.38% 0.48% 0.38%
Unclassified with TIRs (DTX) 0.21% 0.20% 0.22% 0.21%
Harbinger (DTH) 0.15% 0.16% 0.18% 0.16%
Mariner (DTT) 0.14% 0.16% 0.17% 0.16%
Unclassified class 2 (DXX) 0.05% 0.08% 0.05% 0.06%
hAT (DTA) 0.01% 0.01% 0.01% 0.01%
Helitrons (DHH) 0.00% 0.00% 0.00% 0.00%
Unclassified repeats (XXX) 0.55% 0.85% 0.63% 0.68%
Genes and non TE-related DNA 13.9% 15.3% 16.8% 15.2%
Wicker et al. Genome Biology (2018) 19:103 Page 3 of 18

Similarity and variability of the TE content between the A,B, and D subgenomesA genome-wide comparative analysis of the 107,891high-confidence genes predicted along the A, B, and Dsubgenomes (35,345, 35,643, and 34,212, respectively) wasdescribed in detail in [26]. It revealed that 74% of the genesare homeologs, with the vast majority being syntenic. Thus,gene-based comparisons of A-B-D highlighted a strongconservation and collinearity of the genes between thethree genomes. However, outside the genes and their im-mediate surrounding regions, we found almost no sequenceconservation in the TE portions of the intergenic regions(Fig. 2a). This is due to the “TE turnover” [27], whichmeans that intergenic sequences (i.e., sequences that arenot under selection pressure) evolve through rounds of TEinsertions and deletions in a continuing process: DNA isproduced by TE insertions into intergenic regions and
removed by unequal crossovers or deletions that occurduring double-strand repair [28]. Previous studies showedthat this process occurs at a pace implying that intergenicsequences are completely turned over within a few millionyears [27, 28]. Consequently, we found practically noconserved TEs (i.e., TEs that were inserted in the commonancestor of the A, B, and D genome donors). Thus,although the repetitive fraction in A, B, and D genomes ismostly composed of the same TE families (see below), theirindividual insertion sites and nesting patterns are com-pletely different.Analysis of the k-mer content of RefSeq_v1.0 showed
that 20-mers occurring 100× or more cover around 40%of the wheat genome sequence (Fig. 2c). For 60-mers, thisvalue decreases to only 10%. This pattern was stronglysimilar between subgenomes, although a slight differencewas observed: repeated k-mers covered a larger proportion
a b
Fig. 1 TE composition of the three wheat subgenomes and examples of chromosomal distributions. a Stacked histograms representing the contributionof each TE superfamily to the three subgenomes. Un-annotated sequences are depicted in white and coding exons (accounting only the representativetranscript per gene) in orange. b Distribution of TE subfamilies along wheat chromosome 1A (as a representative of all chromosomes). The full datasetsare shown in Additional file 1: Figures S1–S11. The TE distribution is shown in 30-Mb windows along chromosomes. TE abundance per 30-Mb windowis shown as a heat-map and as a bar plot. The x-axis indicates the physical position in Mb, while the y-axis indicates the number of kb the TE familycontributes to each 30 Mb. The total contribution in Mb of the respective TE family to the chromosome is depicted at the left
Wicker et al. Genome Biology (2018) 19:103 Page 4 of 18

of the subgenome D >A > B. This lower proportion ofrepeats in the B subgenome is also obvious using aheat-map of 20-mer frequencies (Fig. 2d), showing thatthe B genome contains a smaller proportion of high copynumber perfect repeats.We then compared the A, B, and D subgenomes at the
TE family level. We did not find any TE families (account-ing > 10 kb) that are specific for a single subgenome or
completely absent in one subgenome (only two cases ofsubgenome-specific tandem repeats were found:XXX_famc46/c47). More surprisingly, the abundance ofmost TE families is similar in the A, B, and D subgenomes.Indeed, among the 165 families which represent at least1 Mb of DNA each, 125 (76%) are present in similar pro-portions in the three subgenomes; i.e., we found less than atwofold change of the proportion between subgenomes.
a b
c d
Fig. 2 Variability and similarity of the repeat composition of the three wheat subgenomes. a Example of sequence alignment of three homeologousregions of ca. 300 kb on chromosomes 3A (from 683.185 to 683.435 Mb), 3B (from 723.440 to 723.790 Mb), and 3D (from 546.330 to 546.700 Mb).Genes red boxes, TEs blue boxes. Sequences sharing > 90% identity over more than 400 bp are represented by red (+/+ strand matches) and blue (+/−strand matches) areas. It shows the high conservation between homeologous genes and collinearity between A-B-D, and it shows the absence of TEsin syntenic positions while intergenic distances tend to be similar between homeologs. Similarities observed between TEs are not collinear and thusstrongly suggest independent insertions, in the three subgenomes, of TEs from the same family instead of homeologous relationships. b Proportionsof the 20 most abundant TE families comprising the hexaploid wheat genome depicted as fractions of A, B, and D subgenomes. For each family,the A-B-D fractions are represented in green, violet, and orange, respectively. 1 RLC_famc1 (Angela WIS); 2 DTC_famc2 (Jorge); 3 RLG_famc2 (SabrinaDerami Egug); 4 RLG_famc1 (Fatima); 5 RLG_famc7 (Erika Sumana Sumaya); 6 RLG_famc5 (WHAM Wilma Sakura); 7 RLG_famc3 (Laura); 8 RLG_famc4(Nusif); 9 RLG_famc11 (Romana Romani); 10 RLG_famc10 (Carmilla Ifis); 11 RLC_famc3 (Claudia Maximus); 12 RLG_famc13 (Latidu); 13 RLG_famc6(Wilma); 14 RLG_famc9 (Daniela Danae Olivia); 15 RLC_famc2 (Barbara); 16 DTC_famc1 (Caspar Clifford Donald Heyjude); 17 RLG_famc14 (Lila); 18RLG_famc15 (Jeli); 19 RLG_famc8 (Cereba Quinta); 20 DTC_famc6 (TAT1). c k-mer-defined proportion of repeats of the subgenomes. Cumulativegenome coverage of 20- and 60-mers at increasing frequencies. Around 40% of each subgenome assembly consists of 20-mers occurring > = 100times. At the 60-mer level the D subgenome has the highest and B the lowest proportion of repeats. d Distribution of 20-mer frequencies acrossphysical chromosomes. The B subgenome has the lowest overall proportion of repeats
Wicker et al. Genome Biology (2018) 19:103 Page 5 of 18

Figure 2b represents the proportions of the 20 most abun-dant families in the three subgenomes which account for84% of the whole TE fraction. Their proportion is close tothe relative sizes of the three subgenomes: 35%, 37%, 28%for A, B, D, respectively. This highlighted the fact that notonly are the three subgenomes shaped by the same TE fam-ilies, but also that these families are present in proportionsthat are conserved. Consistent with this, we identified only11 TE families (7%) that show a strong difference (i.e., morethan a threefold change in abundance) between two subge-nomes, representing only 2% of the overall TE fraction.Thus, despite the near-complete TE turnover that has
occurred independently in the A-B-D diploid lineages(Fig. 2a), and although TEs have transposed and prolifer-ated very little since polyploidization (0.5 Mya, see below),the TE families that currently shape the three subgenomesare the same, and more strikingly, their abundanceremained very similar. We conclude that almost all fam-ilies ancestrally present in the A-B-D common ancestorhave been active at some point and their amplification hascompensated their loss by deletion, thus suggesting adynamic in which families are maintained at equilibriumin the genome for millions of years. This evolutionaryscenario differs from the model where TEs evolve bymassive bursts of a few families leading to rapid diversifi-cation [29]. For example, Piegu et al. showed that an amp-lification burst of a single retrotransposon family led to anear doubling of the genome size in Oryza australiensis[30]. In wheat, by contrast, many TE families contributeto the genome diversification, as suggested for plants withvery large genomes (> 30 Gb) [31].Strong differences in abundance between the A, B, and
D genomes were observed at the subfamily level (Fig. 3).For example, the highly abundant RLC_famc1 (Fatima)family has diverged into at least five subfamilies (1.1 to1.5). Only RLC_famc1.1 contains potentially functionalreverse transcriptase (RT) and integrase (INT) genes,while RLC_famc1.4 and RLC_famc1.5 contain gag andprotease open reading frames (ORFs). RLC_famc1.2 andRLC_famc1.3 appear to be non-autonomous, as they donot contain any intact ORFs. We suggest that RLC_famc1.1provides functional RT and INT proteins, while proteaseand GAG are provided by other subfamilies. Theircontrasted abundance revealed that RLC_famc1.4 andRLC_famc1.5 proliferated specifically in the B and A line-ages, respectively (Fig. 3a).In total, we identified 18 different subfamilies (belonging
to 11 different families) which show subgenome-specificover- or under-representation (Table 2). Here, we onlyconsidered TE families that contribute more than 0.1% tothe total genome and are at least threefold over- orunder-represented in one of the subgenomes. Thisillustrated that these 11 highly abundant families did notshow a bias between A-B-D at the family level, but are
composed of several subfamilies that were differentiallyamplified in the three diploid lineages. The CACTA familyDTC_famc10.3 (Pavel) is much more abundant in the Dsubgenome than in the A and B subgenomes (Add-itional file 1: Figure S1). Interestingly, the Pavel subfamilyalso seems to have evolved a preference for inserting closeto centromeres in the D subgenome, while this tendencyis not obvious in the A and B subgenomes (Fig. 3b).Generally, subfamilies were enriched in a single genome(Table 2). In only four cases, a subfamily was depleted inone subgenome while abundant at similar levels in theother two. Three of these cases were found in the D sub-genome. This is consistent with the smaller D subgenomesize, and differences in highly abundant elements contrib-ute to this difference.
Dynamics of LTR retrotransposons from the diploidancestors to the hexaploidThe largest portion of plant genomes with size over 1Gb consists of LTR-RTs. Intact full-length elements rep-resent recently inserted copies, whereas old elementshave experienced truncations, nested insertions, andmutations that finally lead to degenerated sequencesuntil they become unrecognizable. Full-length LTR-RTs(flLTR-RTs) are bordered by two LTRs that are identicalat the time of insertion and subsequently diverge by ran-dom mutations, a characteristic that is used to deter-mine the age of transposition events [13]. In previousgenome assemblies, terminal repeats tended to collapse,which resulted in very low numbers of correctly recon-structed flLTR-RTs (triangles in Additional file 1: FigureS13). We found 112,744 flLTR-RTs in RefSeq_v1.0 (Add-itional file 1: Table S1, Figure S13), which was in linewith the expectations and confirmed the linear relation-ship between flLTR-RTs and genome size within thePoaceae. This is two times higher than the number offlLTR-RTs assembled in TGAC_v1 [32], while almost noflLTR-RTs were assembled in the 2014 gene-centric draftassembly [33].We exploited this unique dataset to gain insights into
the evolutionary history of hexaploid wheat from atransposon perspective. flLTR-RTs are evenly distributedamong the subgenomes, with on average 8 elements perMb (Additional file 1: Table S1). Among them, there weretwo times more Copia (RLC) than Gypsy (RLG) elements,although Gypsy elements account for 2.8× more DNA.This means that the proportion of young intact elementsis higher for the Copia superfamily than for the Gypsysuperfamily. Indeed, the median insertion ages for Copia,Gypsy, and RLX (unclassified LTR-RTs) are 0.95, 1.30, and1.66 million years (Myr). RLXs lack a protein domain, pre-venting a straightforward classification into Gypsy orCopia. The missing domains can most likely be accountedfor by their older age and, thus, their higher degree of
Wicker et al. Genome Biology (2018) 19:103 Page 6 of 18

degeneration. RLX elements are probably unable to trans-pose on their own, but the occurrence of such very re-cently transposed elements suggests that they arenon-autonomous, as described for the Fatima subfamilies(Fig. 3a). Between the A and B subgenomes, all flLTR-RTmetrics are very similar, whereas the D subgenome standsout with younger insertions. In any case, age distributionsof flLTR-RTs show that most of the identified full-lengthelements inserted after the divergence of the three subge-nomes, thereby reflecting the genomic turnover that hasremoved practically all TEs that were present in theA-B-D ancestor (see above).
We analyzed the chromosomal distributions of theflLTR-RTs (Additional file 1: Figure S14). The whole set ofelements is relatively evenly scattered along the chromo-somes with high density spots in the distal gene-rich com-partments. The most recent transpositions (i.e., copieswith two identical LTRs) involved 457 elements: 257Copia, 144 Gypsy, and 56 RLXs. They are homogeneouslydistributed along the chromosomes (Additional file 1:Figure S14B), confirming previous hypotheses stating thatTEs insert at the same rate all along the chromosome butare deleted faster in the terminal regions, leading togene-rich and TE-depleted chromosome extremities [17].
Fig. 3 Distribution of different subfamilies in the A, B, and D subgenomes. a Distribution of RLC_famc1 (Fatima) retrotransposons. Group 6 chromosomeswere chosen as representative for the whole genome. A phylogenetic tree of the different subfamilies is shown at the left. For the construction of thephylogenetic tree, the LTR sequences were used (internal domains between RLC_famc1.1 and the other subfamilies are completely different, as onlyRLC_famc1.1 contains reverse transcriptase and integrase genes). Bootstrap values (100 repetitions) are indicated. Sequence organization and gene contentof the individual subfamilies are shown to the right of the tree. Chromosomal distributions are shown at the right in bins of 50 Mb as heat-maps and barplots to indicate absolute numbers. The y-axis indicates the total number of kb that is occupied by the respective subfamily in each bin. The most recentlydiverged subfamilies RLC_famc1.4 and RLC_famc1.5 show strong differences in abundance in different subgenomes. b Examples of TE subfamilies thathave strongly differing copy numbers in the A, B, and D subgenomes. Again, only a single group of homeologous chromosomes isshown (see Additional file 1: Figures S1–S3 for the other chromosomes). Abundance is shown in 30-Mb windows
Wicker et al. Genome Biology (2018) 19:103 Page 7 of 18

The current flLTR-RT content is the outcome of twoopposing forces: insertion and removal. Therefore, wecalculated a persistence rate, giving the number ofelements per 10,000 years that have remained intact overtime, for the 112,744 flLTR-RTs (Fig. 4a). It revealedbroad peaks for each superfamily, with maxima rangingfrom 0.6 Mya (for Copia in the D subgenome) to 1.5Mya (for RLX in the A and B subgenomes). The Dsubgenome contained on average younger flLTR-RTscompared to A and B, with a shift of activity by 0.5 Myr.Such peaks of age distributions are commonly inter-preted in the literature as transposon amplificationbursts. We find the “burst” analogy misleading, becausethe actual values are very low. For wheat, it represents amaximal rate of only 600 copies per 10,000 years. Amore suiting analogy would be the formation of moun-tain ranges, where small net increases over very longtime periods add up to very large systems. In the mostrecent time (< 10,000 years), after the hexaploidizationevent, we did not see any evidence in our data for thepopular “genomic shock” hypothesis, postulating imme-diate drastic increases of transposon insertions [34–36].For the A and B subgenomes, a shoulder in the persist-ence curves around 0.5 Mya (Fig. 4a), the time point oftetraploidization, was observed. We suggest thatcounter-selection of harmful TE insertions was relaxedin the tetraploid genome; i.e., the polyploid could
tolerate insertions which otherwise would have been re-moved by selection in a diploid.To elucidate the TE amplification patterns that have
occurred before and after polyploidization, we clusteredthe 112,744 flLTR-RTs based on their sequence identity.The family level was previously defined at 80% identityover 80% sequence coverage (80/80 clusters) [2]. Wealso clustered the flLTR-RTs using a more stringentcutoff of 90/90 and 95/95 to enable classification at thesubfamily level (Fig. 4b). The 80/80 clusters were largeand contained members of all three subgenomes. Incontrast, the 90/90 and 95/95 clusters were smaller, anda higher proportion of them are specific to one subge-nome. To trace the polyploidization events, we definedlifespans for each individual LTR-RT subfamily as theinterval between the oldest and youngest insertion(Fig. 4c). Subfamilies specific to either the A or Bsubgenome amplified until about 0.4 Myr, which is con-sistent with the estimated time of the tetraploidization.Some of the D subgenome-specific subfamilies insertedmore recently, again consistent with the very recenthexaploidization.These results confirmed that the three subgenomes
were shaped by common families present in the A-B-Dcommon ancestor that have amplified independently inthe diploid lineages. They evolved to give birth to differ-ent subfamilies that, generally, did not massively amplify
Table 2 TE subfamilies that show differences in abundance between subgenomes
CLARITE name TREP namea A/Bb A/Dc B/Dd Comment Genomee
DTC_famc14 DTC_Pavel 1.9 0.4 0.2 Enriched D
DTC_famc8 DTC_TAT4 0.8 0.3 0.4 Enriched D
RLC_famc1.7 RLC_Angela_A 3.9 1.0 0.2 Depleted B
RLC_famc1.8 RLC_Angela_B 0.2 0.6 2.9 Enriched B
RLC_famc3.2 RLC_Claudia 1.9 4.1 2.2 Enriched A
RLG_famc1.2 RLG_Fatima_E 0.8 3.8 4.7 Enriched A
RLG_famc1.4 RLG_Fatima_C 0.2 3.9 20.9 Enriched B
RLG_famc1.5 RLG_Fatima_B 2.5 76.6 30.1 Enriched A
RLG_famc10.2 RLG_Carmilla 1.5 9.6 6.6 Enriched B
RLG_famc10.3 RLG_Ifis 0.9 0.2 0.3 Enriched D
RLG_famc15 RLG_Jeli 1.0 3.3 3.4 Depleted D
RLG_famc3.1 RLG_Laura_B 1.0 4.8 5.0 Depleted D
RLG_famc3.4 RLG_Laura_A 1.0 5.3 5.3 Depleted D
RLG_famc7.2 RLG_Erika 4.9 2.0 0.4 Enriched A
RLG_famc7.3 RLG_Sumaya 2.9 4.1 1.4 Enriched A
RLG_famc7.4 RLG_Sumana 0.2 0.9 4.1 Enriched B
RLG_famc9.2 RLG_Daniela 0.6 7.1 11.0 Enriched B
RLX_famc4 Unnamed 0.5 0.2 0.5 Enriched DaName under which the family was previously described and/or stored in the TREP databasebcdRatio of abundance between subgenomeseSubgenome in which abundance or distribution of the respective TE families differs
Wicker et al. Genome Biology (2018) 19:103 Page 8 of 18

after polyploidization and, thus, are specific to one sub-genome. To confirm this hypothesis, we explored thephylogenetic trees of the three largest 90/90 clusterscolor-coded by subgenome (Fig. 5 and Additional file 1:Figures S15–S17 for more details). The trees show oldersubgenome-specific TE lineages which have proliferatedin the diploid ancestors (2–0.5 Mya). However, theyoungest elements (< 0.5 Mya) were found in cladesinterweaving elements of the A and B subgenomes, cor-responding to amplifications in the tetraploid. Suchcases involving the D subgenome were not observed,showing that flLTR-RTs from D have not yet transposedin large amounts across the subgenomes since the birthof hexaploid wheat 8000–10,000 years ago. We furthernoticed several incidences in the trees where D lineageswere derived from older B or A lineages, but not the
reverse. This may be explained by the origin of the Dsubgenome through homoploid hybridization between Aand B [37].There are two proposed models of propagation of TEs:
the “master copy” model and the “transposon” model[38]. The “master copy” model gives rise to highly unbal-anced trees (i.e., with long successive row patterns)where one active copy is serially replaced by another,whereas the “transposon” model produces balanced treeswhere all branches duplicate with the same rate [39]. Tobetter discern the tree topologies, we plotted trees withequal branch length and revealed that the three largesttrees (comprising 15% of flLTR-RTs) are highly unbal-anced (Additional file 1: Figure S18), while the smallertrees are either balanced or unbalanced (Additional file 1:Figure S19). Taken together, both types of tree topologies
Fig. 4 Insertion time frames of wheat LTR retrotransposons. a Persistence rate in number of elements per 10,000 years that have remainedintact until now (meaning they have not been removed or truncated over time). The D subgenome has younger flLTR-RTs, the curves for allsuperfamilies are shifted by ~ 0.5 Myr. The shoulder at 0.5 Myr in the A and B subgenomes could reflect a decrease in removal rates after thetretraploidization. b Comparison of different cluster stringencies. y-axis: subgenome specificity of the clusters, e.g., “ABD” has members from allthree subgenomes, “AB” only from A and B; x-axis: log cluster size; the color coding gives the number of clusters; the circle area corresponds tothe number of elements. The family clustering at 80% identity over 80% mutual coverage generates large clusters, but has a low proportionof subgenome-specific clusters. The 90/90 subfamily level cluster set with a high number of subgenome-specific clusters and three large ABDclusters was used for further analyses. c Lifespan of subfamilies containing only either A, B, or D members. The line thickness represents clustersize. Lineages unique to the A or B subgenome occur only down to ~ 0.5 Myr, confirming the estimated time point for the tetraploidization.However, D subgenome-unique lineages kept on proliferating, a clear sign for a very recent hexaploidization
Wicker et al. Genome Biology (2018) 19:103 Page 9 of 18

exist in the proliferation of flLTR-RTs, but there is a biastowards unbalanced trees for younger elements, suggest-ing that TE proliferation followed the “master copy”model.
In summary, our findings give a timed TE atlas depict-ing detailed TE proliferation patterns of hexaploid wheat.They also show that polyploidization did not trigger burstsof TE activity. This dataset of well-defined transposon
Fig. 5 LTR retrotransposon footprints in the evolution of hexaploid wheat. a Evolution of the wheat genome with alternative scenarios andtimescales. The dotted rectangles and * time values represent the scenario of A and B giving rise to the D subgenome by homoploid hybridization[37]. The left timescale is based on another estimate based on the chloroplast genome evolution [16]. The dotted horizontal arrows represent theunidirectional horizontal transposon transfers observed in this study. b Phylogenetic tree of the largest 90/90 cluster (6639 copies). c Top2 cluster(5387 copies), d Top3 cluster (4564 copies). The leaves of the tree are colored by the subgenome localization of the respective elements. Themajority of the amplifications took place in the diploid ancestors evidenced by the single colored propagation lineages. Each tree contains one orseveral younger regions with interweaving A and B insertions (marked by ABAB). These younger proliferations only started in the AABB tetraploid,where the new elements inserted likewise into both subgenomes. The joining of the D genome was too recent to have left similar traces yet.The gray asterisks mark D lineages that stem from a B or A lineage
Wicker et al. Genome Biology (2018) 19:103 Page 10 of 18
lineages now provides the basis to further explore the fac-tors controlling transposon dynamics. Founder elementsmay help us obtain better insights into common patternswhich could explain how and why amplification starts.
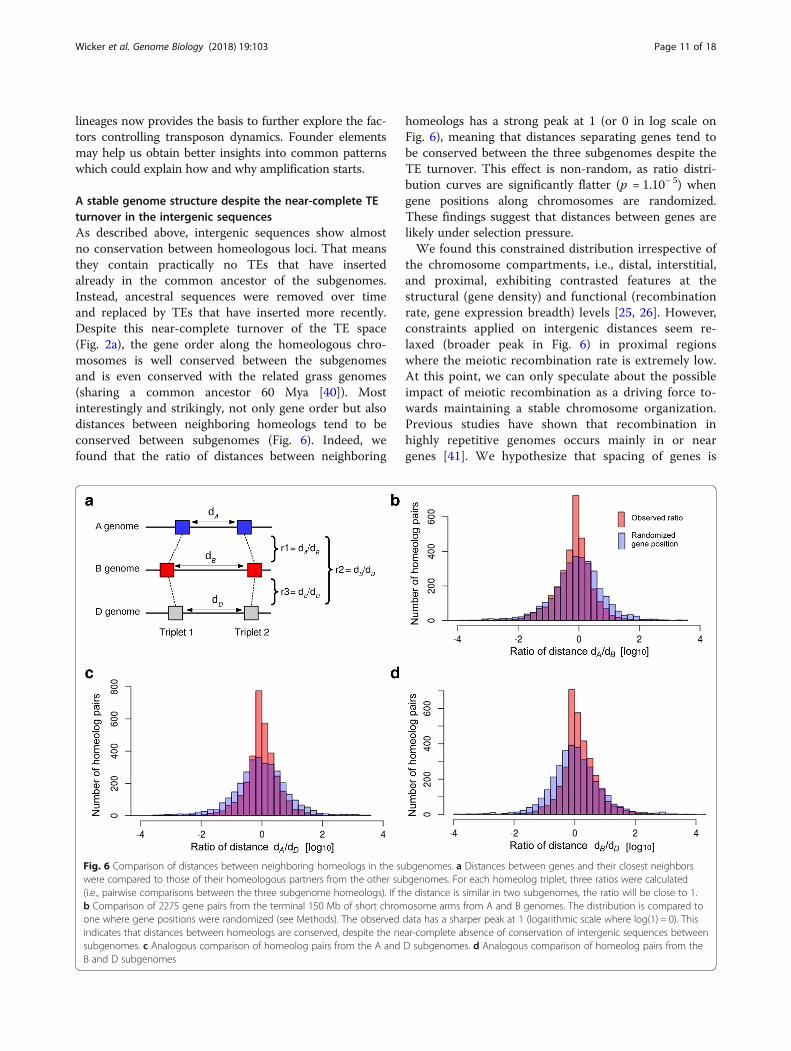
A stable genome structure despite the near-complete TEturnover in the intergenic sequencesAs described above, intergenic sequences show almostno conservation between homeologous loci. That meansthey contain practically no TEs that have insertedalready in the common ancestor of the subgenomes.Instead, ancestral sequences were removed over timeand replaced by TEs that have inserted more recently.Despite this near-complete turnover of the TE space(Fig. 2a), the gene order along the homeologous chro-mosomes is well conserved between the subgenomesand is even conserved with the related grass genomes(sharing a common ancestor 60 Mya [40]). Mostinterestingly and strikingly, not only gene order but alsodistances between neighboring homeologs tend to beconserved between subgenomes (Fig. 6). Indeed, wefound that the ratio of distances between neighboring
homeologs has a strong peak at 1 (or 0 in log scale onFig. 6), meaning that distances separating genes tend tobe conserved between the three subgenomes despite theTE turnover. This effect is non-random, as ratio distri-bution curves are significantly flatter (p = 1.10− 5) whengene positions along chromosomes are randomized.These findings suggest that distances between genes arelikely under selection pressure.We found this constrained distribution irrespective of
the chromosome compartments, i.e., distal, interstitial,and proximal, exhibiting contrasted features at thestructural (gene density) and functional (recombinationrate, gene expression breadth) levels [25, 26]. However,constraints applied on intergenic distances seem re-laxed (broader peak in Fig. 6) in proximal regionswhere the meiotic recombination rate is extremely low.At this point, we can only speculate about the possibleimpact of meiotic recombination as a driving force to-wards maintaining a stable chromosome organization.Previous studies have shown that recombination inhighly repetitive genomes occurs mainly in or neargenes [41]. We hypothesize that spacing of genes is
Fig. 6 Comparison of distances between neighboring homeologs in the subgenomes. a Distances between genes and their closest neighborswere compared to those of their homeologous partners from the other subgenomes. For each homeolog triplet, three ratios were calculated(i.e., pairwise comparisons between the three subgenome homeologs). If the distance is similar in two subgenomes, the ratio will be close to 1.b Comparison of 2275 gene pairs from the terminal 150 Mb of short chromosome arms from A and B genomes. The distribution is compared toone where gene positions were randomized (see Methods). The observed data has a sharper peak at 1 (logarithmic scale where log(1) = 0). Thisindicates that distances between homeologs are conserved, despite the near-complete absence of conservation of intergenic sequences betweensubgenomes. c Analogous comparison of homeolog pairs from the A and D subgenomes. d Analogous comparison of homeolog pairs from theB and D subgenomes
Wicker et al. Genome Biology (2018) 19:103 Page 11 of 18

preserved for proper expression regulation or properpairing during meiosis. Previous studies on introgres-sions of divergent haplotypes in large-genome grassessupport this hypothesis. For instance, highly divergenthaplotypes which still preserve the spacing of geneshave been maintained in wheats of different ploidylevels at the wheat Lr10 locus [42].
Enrichment of TE families in gene promoters is conservedbetween the A, B, and D subgenomesThe sequences flanking genes have a very distinct TEcomposition compared to the overall TE space. Indeed,while intergenic regions are dominated by large TEs suchas LTR-RTs and CACTAs, sequences surrounding genesare enriched in small TEs that are usually just a few
hundred base pairs in size (Fig. 7). Immediately upstreamand downstream of genes (within 2 kb), we identifiedmostly small non-autonomous DNA transposons of theHarbinger and Mariner superfamilies, referred to as Tour-ist and Stowaway miniature inverted-repeat transposableelements (MITEs), respectively [43], SINEs, and Mutators(Fig. 7). At the superfamily level, the A, B, and D subge-nomes exhibit the same biased composition in genesurrounding regions (Additional file 1: Figure S20). Wethen computed, independently for each subgenome, theenrichment ratio of each TE family that was present in thepromoter of protein-coding genes (2 kb upstream of thetranscription start site (TSS)) compared to their overallproportion (in copy number, considering the 315 TE fam-ilies with at least 500 copies). The majority (242, 77%)
Fig. 7 TE landscape surrounding genes. Genes from the three subgenomes were treated separately. For all genes, the 10 kb upstream of thetranscription start site (TSS) and 10 kb downstream of the transcription end site were analyzed. Abundance of the different TE families wascompiled for all genes of each subgenome. The plots include only those superfamilies that are specifically enriched near genes and which areotherwise less abundant in intergenic sequences
Wicker et al. Genome Biology (2018) 19:103 Page 12 of 18

showed a bias (i.e., at least a twofold difference in abun-dance) in gene promoters compared to their subgenomeaverage, confirming that the direct physical environmentof genes contrasts with the rest of the intergenic space.Considering a strong bias, i.e., at least a threefold over- orunder-representation in promoters, we found 105 (33%)and 38 (12%) families, respectively, that met this thresholdin at least one subgenome. While it was previously knownthat MITEs were enriched in promoters of genes, here weshow that this bias is not restricted to MITEs but ratherinvolves many other families. Again, although TEs thatshaped the direct gene environment have insertedindependently in the A, B, and D diploid lineages, theirevolution converged to three subgenomes showing verysimilar TE composition. To go further, we showed thatthe tendency of TE families to be enriched in, or excludedfrom, promoters was extremely conserved between the A,B, and D subgenomes (Fig. 8), although TEs are notconserved between homeologous promoters (insertedafter A-B-D divergence), except for a few cases of retainedTEs (see below). In other words, when a family is over- orunder-represented in the promoter regions of one subge-nome, it is also true for the two other subgenomes. Wedid not find any family that was enriched in a gene pro-moter in one subgenome while under-represented in genepromoters of another subgenome.Superfamily is generally but not always a good indicator
of the enrichment of TEs in genic regions (Fig. 8). Forinstance, 83% (25/30) of the LINE families areover-represented in the promoter regions, while none ofthem is under-represented (considering a twofold change).We confirmed that class 2 DNA transposons (especiallyMITEs) are enriched in promoters, while Gypsy retrotran-sposons tend to be excluded from the close vicinity ofgenes. Indeed, among the 105 families strongly enrichedin promoters (threefold change), 53% (56) are from class 2and 21% (22) are LINEs, and only 5% (5) are LTR-RTs.Contrary to Gypsy, Mutator, Mariner, and Harbinger, fam-ilies belonging to CACTA and Copia superfamilies do notshare a common enrichment pattern: some TE familiescan be either over- or under-represented in promoters(Fig. 8). This confirmed previous results about CACTAsannotated along the 3B chromosome [17], revealing that apart of the CACTA families is associated with genes whilethe other follows the distribution of Gypsy. Our resultsshowed that this is also true for Copia.Thus, the TE turnover did not changed the highly orga-
nized genome structure. Given that not only proportions,but also enrichment patterns, remained similar for almostall TE families after A-B-D divergence, we suggest thatTEs tend to be at the equilibrium in the genome, withamplification compensating their deletion (as described in[29]), and with families enriched around genes havingremained the same.
No strong association between gene expression andparticular TE families in promotersWe investigated the influence of neighboring TEs on geneexpression. Indeed, TEs are so abundant in the wheatgenome, that genes are almost systematically flanked by aTE in the direct vicinity. The median distance between thegene TSS and the closest upstream TE is 1.52 kb, and themedian distance between the transcription termination site(TTS) and the closest downstream TE is 1.55 kb, while theaverage gene length (between TSS and TTS) is 3.44 kb.The density as well as the diversity of TEs in the vicin-ity of genes allow us to speculate on potential relation-ships between TEs and gene expression regulation. Weused the gene expression network built by [26] basedon an exhaustive set of wheat RNA-seq data. Geneswere clustered into 39 expression modules sharing acommon expression profile across all samples. We alsogrouped unexpressed genes to study the potential influ-ence of TEs on neighbor gene silencing. For each gene,the closest TE upstream was retrieved, and we investi-gated potential correlations through an enrichmentanalysis (each module was compared to the full geneset). Despite the close association between genes andTEs, no strong enrichment for a specific family was ob-served for any module or for the unexpressed genes.We then studied the TE landscape upstream of wheat
homeolog triplets, focusing on 19,393 triplets (58,179genes) with a 1:1:1 orthologous relationship between A,B, and D subgenomes. For each triplet, we retrieved theclosest TE flanking the TSS and investigated the level ofconservation of flanking TEs between homeologs. For75% of the triplets, the three flanking TEs belong tothree different families, revealing that, even in the closevicinity of genes, TEs are in majority not conservedbetween homeologs due to rapid turnover. This suggeststhat most TEs present upstream of triplets were notselected for by the presence of common regulatoryelements across homeologs. However, for 736 triplets(4%), the three homeologs are flanked by the sameelement, constituting a conserved noncoding sequence(CNS), suggesting that part of this element is involved inthe regulation of gene expression. These TE-derivedCNSs are on average 459 bp, which is three timessmaller than the average size of gene-flanking TEfragments (on average 1355 bp), suggesting that only aportion of the ancestrally inserted TEs are under selec-tion pressure. They represent a wide range (149 differentfamilies) of diverse elements belonging to all the differ-ent superfamilies.The majority of homeolog triplets have relatively similar
expression patterns [26, 44], contrary to what was foundfor older polyploid species like maize [45]. In syntheticpolyploid wheat, it was shown that repression of D subge-nome homeologs was related to silencing of neighbor TEs
Wicker et al. Genome Biology (2018) 19:103 Page 13 of 18
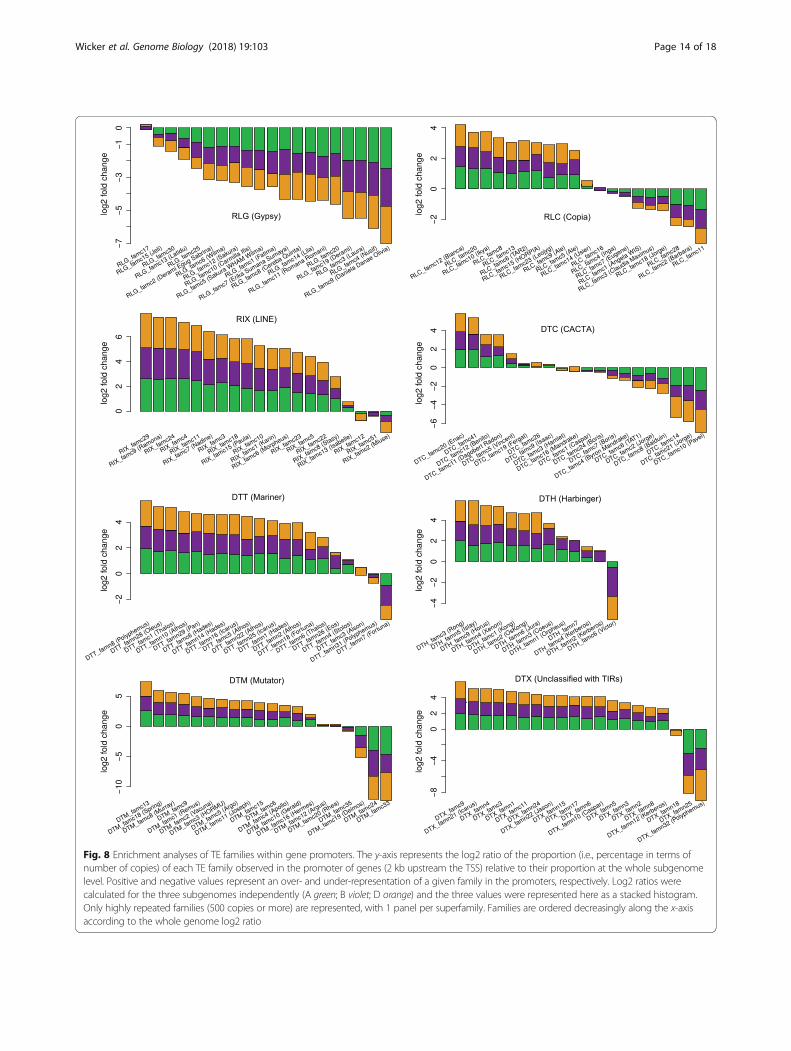
Fig. 8 Enrichment analyses of TE families within gene promoters. The y-axis represents the log2 ratio of the proportion (i.e., percentage in terms ofnumber of copies) of each TE family observed in the promoter of genes (2 kb upstream the TSS) relative to their proportion at the whole subgenomelevel. Positive and negative values represent an over- and under-representation of a given family in the promoters, respectively. Log2 ratios werecalculated for the three subgenomes independently (A green; B violet; D orange) and the three values were represented here as a stacked histogram.Only highly repeated families (500 copies or more) are represented, with 1 panel per superfamily. Families are ordered decreasingly along the x-axisaccording to the whole genome log2 ratio
Wicker et al. Genome Biology (2018) 19:103 Page 14 of 18

[46]. Thus, we focused on triplets for which two copiesare coexpressed while the third is silenced. However,enrichment analysis did not reveal any significant enrich-ment of specific TE families in promoters of the silencedhomeologs. We also examined transcriptionally dynamictriplets across tissues [44]. Again, no TE enrichment inpromoters was observed. These results suggest that recentchanges in gene expression are not due to specific familiesrecently inserted in the close vicinity of genes.
ConclusionsThe chromosome-scale assembly of the wheat genomeprovided an unprecedented genome-wide view of theorganization and impact of TEs in such a complex genome.Since they diverged, the A, B, and D subgenomes haveexperienced a near-complete TE turnover, although poly-ploidization did not massively reactivate TEs. This turnovercontrasted drastically with the high level of gene synteny.Apart from genes, there was no conservation of the TEspace between homeologous loci. But surprisingly, TEfamilies that have shaped the A, B, and D subgenomes arethe same, and unexpectedly, their proportions and intrinsicproperties (gene-prone or not) are quite similar despitetheir independent evolution in the diploid lineages. Thus,TE families are somehow at equilibrium in the genomesince the A-B-D common ancestor. These novel insightscontradict the previous model of evolution with amplifica-tion bursts followed by rapid silencing. Our results suggesta role of TEs at the structural level. TEs are not just “junkDNA”; our findings open new perspectives to elucidatetheir role in high-order chromatin arrangement, chromo-some territories, and gene regulation.
MethodsTE modeling using CLARITEThe Triticum aestivum cv. Chinese Spring genomesequence was annotated as described in [26]. Briefly, twogene prediction pipelines were used (TriAnnot: developedat GDEC Institute [INRA-UCA Clermont-Ferrand] andthe pipeline developed at Helmholtz Center Munich[PGSB]), and the two annotations were integrated (pipe-line established at Earlham Institute [47]) to achieve asingle high-quality gene set. TE modeling was achievedthrough a similarity search approach based on theClariTeRep curated databank of repeated elements [48],developed specifically for the wheat genome, and with theCLARITE program that was developed to model TEs andreconstruct their nested structure [17]. ClariTeRepcontains sequences present in TREP, i.e., a curated libraryof Triticeae TEs from all three subgenomes (originatingfrom BACs sequenced during map-based cloning orsurvey sequencing projects) and TEs manually annotatedin a previous pilot study of chromosome 3B [20]. For theannotation, we used the ClariTeRep naming system,
which assigns simple numbers to individual families andsubfamilies; e.g., RLG_famc1.1 and RLG_famc1.2 aresubfamilies of RLG_famc1. Since many TE families havebeen previously named, we provided this previous namein parentheses.
Detection and characterization of full-length LTRretrotransposonsIdentification of flLTR-RTs was based on LTRharvest[49]. For RefSeq_v1.0, LTRharvest reported 501,358non-overlapping flLTR-RT candidates under the follow-ing parameter settings: “overlaps best -seed 30 -minlenltr100 -maxlenltr 2000 -mindistltr 3000 -maxdistltr 25000-similar 85 -mintsd 4 -maxtsd 20 -motif tgca -motifmis1 -vic 60 -xdrop 5 -mat 2 -mis -2 -ins -3 -del -3”. Allcandidates where annotated for PfamA domains withhmmer3 [50] and stringently filtered for canonicalelements by the following criteria: (1) presence of atleast one typical retrotransposon domain (RT, RH, INT,GAG); (2) removal of mis-predictions based on incon-sistent domains, e.g., RT-RH-INT-RT-RH; (3) Absenceof gene-related Pfam domains; (4) strand consistencybetween domains and primer binding site; (5) tandemrepeat content below 25%; (6) long terminal repeat size<= 25% of the element size; (7) N content < 5%. Thisresulted in a final set of 112,744 high-quality flLTR-RTs.The Copia and Gypsy superfamilies were defined bytheir internal domain ordering: INT-RT-RH for RLC andRH-RT-INT for RLG [2]. When this was not possible,the prediction was classified as RLX. The 112,744flLTR-RTs were clustered with vmatch dbcluster [51] atthree different stringencies: 95/95 (95% identity over95% mutual length coverage), 90/90, and 80/80, as fol-lows: vmatch “-dbcluster 95 95 -identity 95 -exdrop 3-seedlength 20 -d”, “-dbcluster 90 90 -identity 90-exdrop 4 -seedlength 20 -d” and “-dbcluster 80 80-identity 80 -exdrop 5 -seedlength 15 -d”. Subgenomespecificity of clusters was defined by the following deci-sion tree: (1) assignment of the respective subgenome if> = 90% of the members were located on this subge-nome; (2) assignment to two subgenomes if membersfrom one subgenome < 10%, e.g., AB-specific if D mem-bers < 10%; (3) Assignment of the remaining clusters asABD common. Muscle was used for multiple alignmentsof each cluster [52] in a fast mode (-maxiters 2 -diags1).To build phylogenetic trees, we used tree2 from themuscle output which was created in the second iterationwith a Kimura distance matrix, and trees were visualizedwith ete3 toolkit [53]. The date of flLTR-RT insertionswas based on the divergence between the 5′ and 3′LTRs calculated with emboss distmat, applying theKimura 2-parameter correction. The age was estimatedusing the formula: age = distance/(2*mutation rate) witha mutation rate of 1.3*10–8 [13]. The lifespan of an
Wicker et al. Genome Biology (2018) 19:103 Page 15 of 18
individual LTR-RT subfamily was defined as the 5th to95th percentile interval between the oldest and youngestinsertions. The densities for the chromosomal heat-mapswere calculated using a sliding window of 4 Mb with astep of 0.8 Mb.
Comparative analysis of distances separating neighborgenes between homeologous chromosomesFor the comparison of distances separating neighbor genes,homeologous triplets located in the three chromosomalcompartments (distal, interstitial, and proximal; Add-itional file 1: Table S2) were treated separately. This wasdone because gene density is lower in interstitial and prox-imal regions, and because the latter show a lack of geneticrecombination. Furthermore, we considered only tripletswhere all three homeologous genes are found on thehomeologous chromosomes. Comparison of homeologousgene pairs from distal regions was done in two ways, bothof which yielded virtually identical results. Distances weremeasured from one gene to the one that follows down-stream. However, there were many small local inversionsbetween the different subgenomes. Thus, if a gene on the Bor D subgenome was oriented in the opposite directioncompared to its homeologous copy in the A subgenome, itwas assumed that that gene is part of a local inversion.Therefore, the distance to the preceding gene on thechromosome was calculated. The second approach wasmore stringent, based only on triplets for which all threehomeologs are in the same orientation in the three subge-nomes. The results obtained from the two approaches wereextremely similar, and we presented only the results fromthe second, more stringent, approach. For the control data-set, we picked a number of random positions along thechromosomes that is equal to the number of homeologs forthat chromosome group. Then, homeologous gene identi-fiers were assigned to these positions from top to bottom(to preserve the order of genes but randomize the distancesbetween them). This was done once for all three chromo-somal compartments. Histograms of the distributions ofthe distance ratios between homeologs were produced withrstudio (rstudio.com). The significance of the differencesbetween the largest group of actual and randomized genepositions (peak of the histogram) was established with achi-square test.
Analyses of TEs in the vicinity of genes and enrichmentanalysesWe developed a Perl script (gffGetClosestTe.pl [54]) to re-trieve gene-flanking TEs from the feature coordinates in theGFF file. It was used to extract the closest TE on each sideof every predicted gene (considering “gene” features thatinclude untranslated regions). It was also used to extract allpredicted TE copies entirely or partially present within 2 kb
upstream of the “gene” start position, i.e., the TSS. Enrich-ment analyses were then automated using R scripts.
Enrichment of TE families in gene promoters (2 kbupstream)Independently for the three subgenomes, we retrieved allTE copies present within 2 kb upstream of the TSSs of allgene models and calculated the percentage of the numberof copies assigned to every family (%famXpromoter). We alsocalculated the percentage of the number of copies of eachfamily at the whole subgenome level (%famXwhole_subgenome).One enrichment log2 ratio was calculated for each A, B,and D subgenome using the formula log2(%famXpromoter/%famXwhole_subgenome). Only families accounting for 500copies or more in the whole genome were considered.
TE families and expression modulesHere, we retrieved the closest TE present in 5′ of the TSSfor all genes and calculated the percentage of each TEfamily for each expression module and the unexpressedgenes (considered as a module), and compared them to thepercentage observed for the whole gene set using theformula log2(%famXgenes_moduleX/%famXall_genes). The log2ratio was calculated only for expression modules represent-ing at least 1000 coexpressed genes, and we consideredonly log2 ratio values for families accounting for 500 copiesor more. A similar approach was taken for the 10% stable,80% middle, and 10% dynamic genes as defined by [44].
Comparison of TE families in the promoter of homeologsHere, we also retrieved the closest TE in 5′ of every geneand identified homeologous triplets for which the closestelement in 5′ belongs to the same family for the threecopies. For that, we developed a Perl script (getTeHomeo-logs.pl [54]) in order to integrate the information ofhomeologous genes and the data of the closest TE in 5′ ofgenes. Only “1–1-1” homeologs were considered.
Additional files
Additional file 1: Tables S1 to S2, Figures S1 to S20. (PDF 2879 kb)
Additional file 2: Reviewer reports and Author’s response to reviewers.(DOCX 30 kb)
AbbreviationsCNS: Conserved non-coding sequence; flLTR-RT: Full-length long terminalrepeat retrotransposon; INT: Integrase; LINE: Long interspersed nuclearelement; LTR: Long terminal repeat; MITE: Miniature inverted-repeat transpos-able element; ORF: Open reading frame; RH: Ribonuclease H;RT: Retrotransposon; SINE: Short interspersed nuclear element;TE: Transposable element; TSS: Transcription start site; TTS: Transcriptiontermination site
FundingThe research leading to these results has received funding from the FrenchGovernment managed by the Research National Agency (ANR) under theInvestment for the Future programme (BreedWheat project ANR-10-BTBR-
Wicker et al. Genome Biology (2018) 19:103 Page 16 of 18

03), from FranceAgriMer (2011–0971 and 2013–0544). This work was alsosupported by the UK Biotechnology and Biological Sciences ResearchCouncil (BBSRC) through grants (BB/P016855/1, BB/P013511/1, and BB/M014045/1). TW was funded by the University of Zurich. KFXM, HG, andMS would like to acknowledge funding from the German Federal Ministryof Food and Agriculture (2819103915) and the German Ministry of Educationand Research (de.NBI 031A536).
Availability of data and materialsIn terms of data availability, IWGSC RefSeq_v1.0 assembly [55], gene andTE annotation [56], as well as related data are available on the IWGSC DataRepository hosted at URGI [57] and the source code of perl scripts developedfor this study [54]. The raw sequencing data is in the Sequence Read Archiveunder accession number SRP114784 [58].
Review historyThe reviewer reports with the author’s response to the reviewers areavailable as Additional file 2.
Authors’ contributionsTW, HG, and FC conceived and designed the study. FC coordinated thestudy. TW performed analyses of TE distribution along chromosomes,comparisons of intergenic distances between subgenomes, centromeric TEanalyses, and also analyzed the TE landscape around genes. HG carried outthe k-mer analyses and the flLTR-RT identification, dating, clustering, andphylogenetic analyses. FC carried out the A-B-D comparisons of TE families,enrichment analyses in gene promoters, comparisons between homeologs,and association with expression profiles. CU, RHRG, and PB built the RNA-seq-based gene expression network. TW, HG, and FC wrote the manuscript.RDO contributed text and figures for the manuscript. MS, CU, RHRG, PB,KFXM, RDO, and EP provided comments and corrections on the manuscript.All authors read and approved the final manuscript.
Ethics approval and consent to participateNot applicable.
Consent for publicationNot applicable.
Competing interestsThe authors declare that they have no competing interests.
Publisher’s NoteSpringer Nature remains neutral with regard to jurisdictional claims inpublished maps and institutional affiliations.
Author details1Department of Plant and Microbial Biology, University of Zurich, Zurich,Switzerland. 2PGSB Plant Genome and Systems Biology, Helmholtz CenterMunich, German Research Center for Environmental Health, Neuherberg,Germany. 3Department of Crop Genetics, John Innes Centre, NorwichResearch Park, Colney, Norwich NR4 7UH, UK. 4GDEC, INRA, UCA (UniversitéClermont Auvergne), Clermont-Ferrand, France. 5IWGSC, 2841 NE MarywoodCt, Lee’s Summit, MO 64086, USA. 6School of Life Sciences, TechnicalUniversity Munich, Munich, Germany.
Received: 25 January 2018 Accepted: 11 July 2018
References1. Feschotte C, Jiang N, Wessler SR. Plant transposable elements: where
genetics meets genomics. Nat Rev Genet. 2002;3:329–41.2. Wicker T, Sabot F, Hua-Van A, Bennetzen JL, Capy P, Chalhoub B, Flavell A,
Leroy P, Morgante M, Panaud O, et al. A unified classification system foreukaryotic transposable elements. Nat Rev Genet. 2007;8:973–82.
3. Hollister JD, Gaut BS. Epigenetic silencing of transposable elements: a trade-off between reduced transposition and deleterious effects on neighboringgene expression. Genome Res. 2009;19:1419–28.
4. Feschotte C. Transposable elements and the evolution of regulatorynetworks. Nat Rev Genet. 2008;9:397–405.
5. Talbert PB, Masuelli R, Tyagi AP, Comai L, Henikoff S. Centromericlocalization and adaptive evolution of an Arabidopsis histone H3variant. Plant Cell. 2002;14:1053–66.
6. International Barley Genome Sequencing Consortium, Mayer KF, Waugh R,Brown JW, Schulman A, Langridge P, Platzer M, Fincher GB, Muehlbauer GJ,Sato K, et al. A physical, genetic and functional sequence assembly of thebarley genome. Nature. 2012;491:711–6.
7. International Rice Genome Sequencing Project. The map-based sequence ofthe rice genome. Nature. 2005;436:793–800.
8. Mayer KF, Martis M, Hedley PE, Simkova H, Liu H, Morris JA, Steuernagel B,Taudien S, Roessner S, Gundlach H, et al. Unlocking the barley genome bychromosomal and comparative genomics. Plant Cell. 2011;23:1249–63.
9. Paterson AH, Bowers JE, Bruggmann R, Dubchak I, Grimwood J, Gundlach H,Haberer G, Hellsten U, Mitros T, Poliakov A, et al. The Sorghum bicolorgenome and the diversification of grasses. Nature. 2009;457:551–6.
10. Schnable PS, Ware D, Fulton RS, Stein JC, Wei F, Pasternak S, Liang C, ZhangJ, Fulton L, Graves TA, et al. The B73 maize genome: complexity, diversity,and dynamics. Science. 2009;326:1112–5.
11. Baucom RS, Estill JC, Chaparro C, Upshaw N, Jogi A, Deragon JM,Westerman RP, Sanmiguel PJ, Bennetzen JL. Exceptional diversity, non-random distribution, and rapid evolution of retroelements in the B73 maizegenome. PLoS Genet. 2009;5:e1000732.
12. Fu H, Dooner HK. Intraspecific violation of genetic colinearity and itsimplications in maize. Proc Natl Acad Sci U S A. 2002;99:9573–8.
13. SanMiguel P, Gaut BS, Tikhonov A, Nakajima Y, Bennetzen JL. The paleontologyof intergene retrotransposons of maize. Nat Genet. 1998;20:43–5.
14. Swigonova Z, Bennetzen JL, Messing J. Structure and evolution of ther/b chromosomal regions in rice, maize and sorghum. Genetics. 2005;169:891–906.
15. Makarevitch I, Waters AJ, West PT, Stitzer M, Hirsch CN, Ross-Ibarra J,Springer NM. Transposable elements contribute to activation of maizegenes in response to abiotic stress. PLoS Genet. 2015;11:e1004915.
16. Middleton CP, Senerchia N, Stein N, Akhunov ED, Keller B, Wicker T, Kilian B.Sequencing of chloroplast genomes from wheat, barley, rye and theirrelatives provides a detailed insight into the evolution of the Triticeae tribe.PLoS One. 2014;9:e85761.
17. Daron J, Glover N, Pingault L, Theil S, Jamilloux V, Paux E, Barbe V, Mangenot S,Alberti A, Wincker P, et al. Organization and evolution of transposableelements along the bread wheat chromosome 3B. Genome Biol. 2014;15:546.
18. Choulet F, Alberti A, Theil S, Glover N, Barbe V, Daron J, Pingault L, SourdilleP, Couloux A, Paux E, et al. Structural and functional partitioning of breadwheat chromosome 3B. Science. 2014;345:1249721.
19. University of Zurich. TREP. 2016. http://botserv2.uzh.ch/kelldata/trep-db/.20. Choulet F, Wicker T, Rustenhlz C, Paux E, Salse J, Leroy P, Schlub S, Le Paslier
MC, Magdelenat G, Gonthier C, et al. Megabase level sequencing revealscontrasted organization and evolution patterns of the wheat gene andtransposable element spaces. Plant Cell. 2010;22:1686–701.
21. Wicker T, Schulman A, Tanskanen J, Spannagl M, Twardziok S, Mascher M,Springer NM, Li Q, Waugh R, Li C, et al. The repetitive landscape of the5,100 Mbp barley genome. Mob DNA. 2018; in press
22. Li B, Choulet F, Heng Y, Hao W, Paux E, Liu Z, Yue W, Jin W, Feuillet C,Zhang X. Wheat centromeric retrotransposons: the new ones take a majorrole in centromeric structure. Plant J. 2013;73:952–65.
23. Presting GG, Malysheva L, Fuchs J, Schubert I. A Ty3/gypsy retrotransposon-like sequence localizes to the centromeric regions of cereal chromosomes.Plant J. 1998;16:721–8.
24. Chatterjee AG, Leem YE, Kelly FD, Levin HL. The chromodomain of Tf1integrase promotes binding to cDNA and mediates target site selection.J Virol. 2009;83:2675–85.
25. Mascher M, Gundlach H, Himmelbach A, Beier S, Twardziok SO, Wicker T,Radchuk V, Dockter C, Hedley PE, Russell J, et al. A chromosome conformationcapture ordered sequence of the barley genome. Nature. 2017;544:427–33.
26. International Wheat Genome Sequencing Consortium. Shifting the limits inwheat research and breeding using a fully annotated reference genome.Science. 2018. https://doi.org/10.1126/science.aar7191.
27. Vitte C, Panaud O. LTR retrotransposons and flowering plant genomesize: emergence of the increase/decrease model. Cytogenet GenomeRes. 2005;110:91–107.
28. Buchmann JP, Matsumoto T, Stein N, Keller B, Wicker T. Inter-speciessequence comparison of Brachypodium reveals how transposon activitycorrodes genome colinearity. Plant J. 2012;71:550–63.
Wicker et al. Genome Biology (2018) 19:103 Page 17 of 18

29. Bennetzen JL. Transposable elements, gene creation and genomerearrangement in flowering plants. Curr Opin Genet Dev. 2005;15:621–7.
30. Piegu B, Guyot R, Picault N, Roulin A, Sanyal A, Kim H, Collura K, Brar DS,Jackson S, Wing RA, Panaud O. Doubling genome size withoutpolyploidization: dynamics of retrotransposition-driven genomic expansionsin Oryza australiensis, a wild relative of rice. Genome Res. 2006;16:1262–9.
31. Kelly LJ, Renny-Byfield S, Pellicer J, Macas J, Novak P, Neumann P, Lysak MA,Day PD, Berger M, Fay MF, et al. Analysis of the giant genomes of Fritillaria(Liliaceae) indicates that a lack of DNA removal characterizes extremeexpansions in genome size. New Phytol. 2015;208:596–607.
32. Clavijo BJ, Venturini L, Schudoma C, Accinelli GG, Kaithakottil G, Wright J,Borrill P, Kettleborough G, Heavens D, Chapman H, et al. An improvedassembly and annotation of the allohexaploid wheat genome identifiescomplete families of agronomic genes and provides genomic evidence forchromosomal translocations. Genome Res. 2017;27:885–96.
33. IWGSC. A chromosome-based draft sequence of the hexaploid bread wheat(Triticum aestivum) genome. Science. 2014;345:1251788.
34. Feldman M, Levy AA. Allopolyploidy—a shaping force in the evolution ofwheat genomes. Cytogenet Genome Res. 2005;109:250–8.
35. Yaakov B, Meyer K, Ben-David S, Kashkush K. Copy number variationof transposable elements in Triticum-Aegilops genus suggestsevolutionary and revolutionary dynamics followingallopolyploidization. Plant Cell Rep. 2013;32:1615–24.
36. Eilam T, Anikster Y, Millet E, Manisterski J, Feldman M. Nuclear DNA amountand genome downsizing in natural and synthetic allopolyploids of thegenera Aegilops and Triticum. Genome. 2008;51:616–27.
37. Marcussen T, Sandve SR, Heier L, Spannagl M, Pfeifer M, International WheatGenome Sequencing Consortium, Jakobsen KS, Wulff BB, Steuernagel B,Mayer KF, Olsen OA. Ancient hybridizations among the ancestral genomesof bread wheat. Science. 2014;345:1250092.
38. Brookfield JF, Johnson LJ. The evolution of mobile DNAs: when willtransposons create phylogenies that look as if there is a mastergene? Genetics. 2006;173:1115–23.
39. Le Rouzic A, Payen T, Hua-Van A. Reconstructing the evolutionary history oftransposable elements. Genome Biol Evol. 2013;5:77–86.
40. International Brachypodium Initiative. Genome sequencing and analysis ofthe model grass Brachypodium distachyon. Nature. 2010;463:763–8.
41. Darrier B, Rimbert H, Balfourier F, Pingault L, Josselin AA, Servin B, Navarro J,Choulet F, Paux E, Sourdille P. High-resolution mapping of crossover eventsin the hexaploid wheat genome suggests a universal recombinationmechanism. Genetics. 2017;206:1373–88.
42. Isidore E, Scherrer B, Chalhoub B, Feuillet C, Keller B. Ancient haplotypesresulting from extensive molecular rearrangements in the wheat A genomehave been maintained in species of three different ploidy levels. GenomeRes. 2005;15:526–36.
43. Bureau TE, Wessler SR. Stowaway - a new family of inverted repeat elementsassociated with the genes of both monocotyledonous and dicotyledonousplants. Plant Cell. 1994;6:907–16.
44. Ramírez-González R, Borrill P, Lang D, Harrington SA, Brinton J, Venturini L,Davey M, Jacobs J, Van Ex F, Pasha A, et al. The transcriptional landscape ofpolyploid wheat. Science. 2018. https://doi.org/10.1126/science.aar6089.
45. Pophaly SD, Tellier A. Population level purifying selection and gene expressionshape subgenome evolution in maize. Mol Biol Evol. 2015;32:3226–35.
46. Li A, Liu D, Wu J, Zhao X, Hao M, Geng S, Yan J, Jiang X, Zhang L, WuJ, et al. mRNA and small RNA transcriptomes reveal insights intodynamic homoeolog regulation of allopolyploid heterosis in nascenthexaploid wheat. Plant Cell. 2014;26:1878–900.
47. Venturini L, Caim S, Kaithakottil G, Mapleson DL, Swarbreck D.Leveraging multiple transcriptome assembly methods for improvedgene structure annotation. bioRxiv. 2017; https://doi.org/10.1101/216994.
48. CLARITE, github.com/jdaron/CLARI-TE/.49. Ellinghaus D, Kurtz S, Willhoeft U. LTRharvest, an efficient and flexible
software for de novo detection of LTR retrotransposons. BMCBioinformatics. 2008;9:18.
50. Eddy SR. Accelerated profile HMM searches. PLoS Comput Biol. 2011;7:e1002195.51. vmatch. www.vmatch.de.52. Edgar RC. MUSCLE: multiple sequence alignment with high accuracy and
high throughput. Nucleic Acids Res. 2004;32:1792–7.53. Huerta-Cepas J, Serra F, Bork P. ETE 3: reconstruction, analysis, and
visualization of phylogenomic data. Mol Biol Evol. 2016;33:1635–8.54. biotools. https://github.com/fchoulet/biotools.
55. IWGSC, RefSeq_v1.0 Assembly. https://urgi.versailles.inra.fr/download/iwgsc/IWGSC_RefSeq_Assemblies/v1.0/.
56. IWGSC, RefSeq_v1.0 Annotations. https://urgi.versailles.inra.fr/download/iwgsc/IWGSC_RefSeq_Annotations/v1.0/.
57. URGI IWGSC Data Repository. https://wheat-urgi.versailles.inra.fr/Seq-Repository.
58. IWGSC, raw sequencing data. https://www.ncbi.nlm.nih.gov/sra/?term=SRP114784.
Wicker et al. Genome Biology (2018) 19:103 Page 18 of 18