impact of parental stress on asthma management behaviors
TRANSCRIPT

University of Massachusetts BostonScholarWorks at UMass Boston
Graduate Doctoral Dissertations Doctoral Dissertations and Masters Theses
12-31-2015
Impact Of Parental Stress On AsthmaManagement Behaviors And Health Outcomes: ALongitudinal Analysis Of Inner City School-AgedChildrenAmanda Constance GreenUniversity of Massachusetts Boston
Follow this and additional works at: http://scholarworks.umb.edu/doctoral_dissertations
Part of the Nursing Commons
This Open Access Dissertation is brought to you for free and open access by the Doctoral Dissertations and Masters Theses at ScholarWorks at UMassBoston. It has been accepted for inclusion in Graduate Doctoral Dissertations by an authorized administrator of ScholarWorks at UMass Boston. Formore information, please contact [email protected].
Recommended CitationGreen, Amanda Constance, "Impact Of Parental Stress On Asthma Management Behaviors And Health Outcomes: A LongitudinalAnalysis Of Inner City School-Aged Children" (2015). Graduate Doctoral Dissertations. Paper 241.

IMPACT OF PARENTAL STRESS ON ASTHMA MANAGEMENT BEHAVIORS
AND HEALTH OUTCOMES: A LONGITUDINAL ANALYSIS OF INNER CITY
SCHOOL-AGED CHILDREN.
A Dissertation Presented
by
AMANDA CONSTANCE GREEN
Submitted to the Office of Graduate Studies, University of Massachusetts Boston,
in partial fulfillment of the requirements for the degree of
DOCTOR OF PHILOSOPHY
December 2015
Nursing Program

© 2015 by Amanda Constance Green
All rights reserved

IMPACT OF PARENTAL STRESS ON ASTHMA MANAGEMENT BEHAVIORS
AND HEALTH OUTCOMES: A LONGITUDINAL ANALYSIS OF INNER CITY
SCHOOL-AGED CHILDREN
A Dissertation Presented
by
AMANDA CONSTANCE GREEN
Approved as to style and content by:
____________________________ Laura L. Hayman, Professor Chairperson of Committee ____________________________ Jerry Cromwell, Lecturer Member ____________________________ Wanda Phipatanakul, Associate Professor Harvard Medical School Member
_____________________________ Haeok Lee, Program Director PhD Program in Nursing
_____________________________ Rosanna DeMarco, Chairperson Department of Nursing
iv
ABSTRACT
IMPACT OF PARENTAL STRESS ON ASTHMA MANAGEMENT BEHAVIORS
AND HEALTH OUTCOMES: A LONGITUDINAL ANALYSIS OF INNER CITY
SCHOOL-AGED CHILDREN
December 2015
Amanda Constance Green. B.S.N., Oakland University M.S.N., Boston College
Ph.D., University of Massachusetts Boston
Directed by Professor Laura Hayman
Background. Asthma is a prevalent chronic condition with excess disease burden
in school-aged, minority children from low income inner-city communities.
Conceptualized within a nursing and socio-ecological framework, the purpose of this
secondary analysis of a prospective study of inner-city school-aged children with asthma
(School Inner-City Asthma Study [SICAS]) was to examine associations between
characteristics of children and parents, parents stress, parent asthma management

v
behaviors (AMB) and child asthma outcomes, including emergency (ED) visits for
asthma, missed school and asthma control.
Methods. The sample included 351 school-aged children (7.9 years old, SD= 1.9
years; 53.0% male; 95.7% minority). Parents reported their own perceived stress
(Perceived Stress Scale) and AMBs (national guidelines) at baseline; child asthma
outcomes were measured quarterly at follow-up. Generalized estimation equations were
used due to the repeated quarterly wave nature of the data.
Results. The majority of parents (63.5%) reported moderate to high stress.
Controlling for other participant characteristics, income and education were directly
related to parent stress in this inner-city population. Parent stress also had a direct
positive effect on child ED visits for asthma (OR=1.68, p=.014), which persisted when
potential mediators were added to the model. Poor parent AMB of missing routine
appointments (OR=2.32, p=.025) and pests in the home (OR=1.51, p=.001) also raised
the likelihood of ED visits.
Parents who missed their child’s healthcare appointments and have pests in their home
were both more likely to live in an unmaintained neighborhood (OR=7.6, p=.001;
OR=1.8, p=.002) and have more family members in their home (OR=5.0, p=.01; OR=2.0,
p=.000).
Conclusions. Parents with high stress and who reside with large families in
unmaintained neighborhoods are at higher risk for not performing AMBs that support the

vi
best outcomes for their child with asthma. Low income and educational attainment raise
parental stress that leads to costly ED visits for inner city children. Clinical interventions
to facilitate increased routine visits and policy change for inner-city household pest
control will help reduce ED visits related to asthma. Research on the implementation
science of these interventions and role of parent stress on the effectiveness of these
interventions in the inner-city population is necessary.

vii
TABLE OF CONTENTS ABSTRACT ....................................................................................................................... iv LIST OF FIGURES ............................................................................................................ x LIST OF TABLES ............................................................................................................. xi CHAPTER Page
1. INTRODUCTION .................................................................................................. 1 Background and Significance ..................................................................... 1 Purpose and Aims ....................................................................................... 2 Operational Definitions ............................................................................... 3 Significance ................................................................................................. 5 Conceptual Theoretical Empirical Framework ........................................... 9
2. REVIEW OF THE LITERATURE ...................................................................... 14 Asthma Development and Expression ...................................................... 14 Asthma Severity and Asthma Control ...................................................... 15 Medical Treatment .................................................................................... 16 Asthma Management Domains with Specific Parent Management Behaviors .................................................................................................. 17 Assessment and Monitoring Domain ........................................................ 18 Medications Domain ................................................................................. 19 Education Domain .................................................................................... 19 Environmental Domain ............................................................................. 21 Barriers to Adoption of Asthma Management Domains .......................... 22 Necessity of Parent Role in Asthma Management ................................... 23 Challenges to Parent Directed Asthma Management in an Inner-City Setting ....................................................................................................... 25 Inner-city Challenges to Parent Asthma Management ............................. 28 Transportation ........................................................................................... 28 Asthma Care Plan and Asthma Specialist ................................................. 29 Tobacco Use and Financial Stress ............................................................ 30 Primary Care Appointments ..................................................................... 31 Parent Management Interventions and Reducing Acute Care in the Inner-City ............................................................................................................ 31 Parent Psychological Distress and Management Behaviors ..................... 34 Parent Stress Affecting Asthma versus other Chronic Disease ................ 34 Psychological Distress in Parents affecting Management Behaviors and Outcomes .................................................................................................. 35 Demographic Challenges and Parent Stress ............................................. 38 Parent Stress and Demographics on Asthma Prevalence .......................... 40 Global Measure of Stress: Perceived Stress .............................................. 42 Parent stress and Child Asthma Symptoms or Inflammatory Markers ..... 43 A Psychosocial Pathway through Parent Management Behaviors ........... 43 Parent stress and Parent Management Behaviors ..................................... 45

viii
Parent stress and Child ED visits .............................................................. 46 Summary ................................................................................................... 48 The Problem .............................................................................................. 48 Rationale for Included Variables in Full Model ....................................... 49 Gaps in Literature ..................................................................................... 50 Contributions of the Analyses ................................................................... 52
3. RESEARCH DESIGN AND METHODS ............................................................ 55 Study Design ............................................................................................. 55 The School Inner-city Asthma Study (SICAS) ......................................... 56 Secondary Data Analysis of SICAS ......................................................... 58 Path Model ................................................................................................ 60 Human Subjects Considerations ............................................................... 66 Measurement Instruments ......................................................................... 67 SICAS Parent Management Questions ..................................................... 73 Statistical Methods .................................................................................... 81 Univariate and bivariate analyses ............................................................. 81 Multivariate Analyses of Longitudinal Panel (Cohort) Data Analysis ..... 82 Generalized Estimation Equations ............................................................ 83 Hierarchical Regression ............................................................................ 83
4. STUDY RESULTS ............................................................................................... 90 Descriptive Results ................................................................................... 90 Sample Description ................................................................................... 90 Bivariate Analyses .................................................................................... 93 Bivariate Analysis of Independent Variables and Parent Management Behaviors (Aim 3) ..................................................................................... 96 Bivariate Correlation Matrix ..................................................................... 99 Multivariate Analysis with Researcher Directed Step-wise Regression . 100 Summary of Aims 1 and 2 Models ......................................................... 111 Parent Management Models (Aim 3) ...................................................... 117 Summary of Aim 3 Models ..................................................................... 122
5. DISCUSSION AND CONCLUSIONS .............................................................. 128 Study Overview ...................................................................................... 128 Comparison with national sample and with other inner-city asthma study. ................................................................................................................. 129 Aim 1 Analyses and Interpretation of the Findings ................................ 131 Aim 2a Analyses and Interpretation of the Findings .............................. 134 Aim 2b Analyses and Interpretation of the Findings .............................. 138 Aim 2c Analyses and Interpretation of the Findings: Psychosocial Pathways ................................................................................................. 139 Alternate Pathways to ED visits ............................................................. 142 Asthma Severity and Medication Administration on the Main Outcomes ................................................................................................................. 145 Parent Role in Medication Adherence .................................................... 147 Assisting Parents in Obtaining Asthma Control ..................................... 150

ix
Parent and Child Characteristics on Parent Management Behaviors ...... 151 Aim 3 Analyses and Interpretation of the Findings ................................ 151 Conclusions ............................................................................................. 155 Implications for Practice ......................................................................... 158 Implications for Future Research ............................................................ 159 Qualitative Research ............................................................................... 159 Quantitative Research ............................................................................. 160 Cost Savings ............................................................................................ 164 Implications for Policy ............................................................................ 164 Limitations .............................................................................................. 169 Conclusion .............................................................................................. 171 Funding ................................................................................................... 173
REFERENCE LIST ........................................................................................................ 175

x
LIST OF FIGURES
Figure Page
1. Conceptual-‐Theoretical-‐Empirical Model .............................................................. 10
2. School Inner-‐City Asthma Study Annual Schema ................................................ 57
3. Conceptual-‐Theoretical-‐Empirical Model Linked with Path Model ............ 61
4. Path Model for Main Outcomes of ED Visits and School Absenteeism ...... 86
5. Path Model for Main Outcome of Child Asthma Control .................................. 86
6. Parent Stress Model Path Diagram ............................................................................ 87
7. Parent Medication Administration Behavior Model Path Diagram ............ 87
8. Parent Environment Behavior Model Path Diagram ......................................... 88
9. Parent Assessment & Monitoring Behavior Model Path Diagram ............... 88
10. Parent Education Behavior Model Path Diagram ............................................... 89
11. Inhaled Corticosteroid Decision Tree ...................................................................... 92
12. Childhood Asthma Stakeholder Matrix ................................................................ 166
13. Public Health Organizations, Public Health Departments and Professional Organizations Stakeholder Matrix .......................................................................... 168

xi
LIST OF TABLES
Table Page
1. Instruments for Measuring Asthma Management .................................................. 196
2. Child and Parent Demographic Questions .................................................................. 199
3. 4-‐Item Perceived Stress Scale (PSS4) ........................................................................... 201
4. Environmental Management Questions ...................................................................... 202
5. Medication Management Questions .............................................................................. 203
6. Assessment and Monitoring Management Questions ........................................... 204
7. Educational Management Questions ............................................................................ 205
8. Asthma Knowledge Questions ......................................................................................... 206
9. School’s Role in Asthma Management .......................................................................... 207
10. Emergent or Unscheduled Visit Outcome Score ...................................................... 208
11. Asthma Therapy Assessment Questionnaire (ATAQ) Control Section .......... 209
12. National Asthma Education and Prevention Program (NAEPP) Guideline Assessing Asthma Control ................................................................................................. 210
13. National Asthma Education and Prevention Program (NAEPP) Guideline Asthma Control Composite Score ................................................................................... 211
14. Missed School Outcome Score ......................................................................................... 212
15. Variable Description Summary Table .......................................................................... 213
16. Characteristics of School-‐aged Participants (N=351) ........................................... 215
17. Characteristics of Parent Participants (N=351) ....................................................... 216
18. Child and Parent Characteristics by Parent Stress (N=351) .............................. 217
19. Inhaled Corticosteroid (ICS) Decision Tree Tables ................................................ 218

xii
20. Parent Stress and Asthma Knowledge by Parent Management Behaviors .. 220
21. Parent and Home Environment Characteristics by Environmental Management Behaviors ...................................................................................................... 221
22. Child and Parent Characteristics by Having an Asthma Action Plan .............. 222
23. Child and Parent Characteristics, AMBs and Child Asthma Outcomes by Emergency Visits for Asthma ........................................................................................... 223
24. Child and Parent Characteristics, AMBs and Child Asthma Outcomes by Missed School due to Asthma ........................................................................................... 225
25. Child and Parent Characteristics, AMBs and Child Asthma Outcomes by Asthma Control ....................................................................................................................... 227
26. Odds Ratios of Characteristics and Mediating Variables with ED Visits in Multivariate Analysis ........................................................................................................... 229
27. Correlation Matrix of Independent and Dependent Variables .......................... 230
28. Odds Ratios of Characteristics and Mediating Variables with Missed School in Multivariate Analysis ........................................................................................................... 232
29. Odds Ratios of Characteristics and Mediating Variables with Asthma Control in Multivariate Analysis ...................................................................................................... 233
30. Odds Ratios of Characteristics and Mediating Variables with Parent Stress in Multivariate Analysis ........................................................................................................... 234
31. Odds Ratios of Characteristics with Medication Administration in Multivariate Analysis ........................................................................................................... 235
32. Odds Ratios of Characteristics with Missed Appointments in Multivariate Analysis ...................................................................................................................................... 236
33. Odds Ratios of Characteristics with Having an Asthma Action Plan in Multivariate Analysis ........................................................................................................... 237
34. Odds Ratios of Characteristics with Pests in Home, Passive Smoke and Smokers in Home in Multivariate Analysis ................................................................ 238
35. Odds Ratios of Characteristics and Mediating Variables with Emergency Department Visits in Multivariate Analysis in a Lagged Model ........................ 239
36. Sensitivity Test of Parent Stress in ED Visit Model ................................................. 240

xiii
37. ATAQ Continuous Asthma Control Model and Maximum Symptom Models ....................................................................................................................................................... 241

1
CHAPTER ONE
INTRODUCTION
Background and Significance
Asthma currently affects an estimated 10.7 percent of school-aged children who are 5
to 17 years of age and residing in the United States ((Statistics., 2013). This rate is 28%
greater than US adult asthma prevalence of 7.7 percent (L. J. Akinbami, Moorman, & Liu,
2011). Despite the medical advances in treatment, there is still a high rate of morbidity,
mortality, urgent or emergent health care use and school absences due to this chronic
condition (L. Akinbami, 2006; Organization, 2013; Statistics, 2012). The National
Asthma Education and Prevention Program (NAEPP) defines asthma as a complex and
chronic disorder of the airways that involves interactions between chronic inflammation
of the lungs, airway obstruction and bronchial hyper-responsiveness (Program, 2007).
The Global Initiative for Asthma (GINA) asserts that according to clinical studies,
asthma can be controlled effectively by interventions that suppress and reverse these
interactions (Asthma., 2012). These interventions are performed in various settings,
including the hospital, the clinic and the home setting (GINA, 2006). However,
knowledge of the impact of parent stress on the management behaviors they perform for
their children is limited, especially in the inner-city population. The Institute of Medicine
highlights psychosocial variables that may affect disease management as a critical area

2
targeted for research (Medicine, 2002). Minimal research attention has focused on
addressing the impact of parent perceived stress on their child’s asthma outcomes,
especially in the inner-city population.
Purpose and Aims
Conceptualized within a nursing and sociological framework, the purpose of this
secondary analysis of a prospective study focused on inner-city school-aged children with
asthma (School Inner-City Asthma Study (SICAS)) was to examine associations between
characteristics of inner city children and parents parent stress, parent asthma management
behaviors and child asthma outcomes, including emergency visits for asthma, school
absenteeism, and asthma control
Specifically, this study was designed to:
1. Examine characteristics of the child and parents’ home and social environments
and their associations with asthma control, urgent or emergent asthma visits and school
absenteeism.
2a. Examine which parent or child characteristics lead to higher stress in parents
of children with asthma.
2b. Examine the association of parent stress on the child’s emergent asthma visits,
school absenteeism, and asthma control.
2c. Explore the pathways of parent stress on parent management behaviors that
affect the child’s emergent asthma visits, school absenteeism, and asthma control.
3. Examine the effects of child and parent characteristics on the parent
management behaviors performed.

3
Operational Definitions
Data used in the secondary analysis of the SICAS study is from parent report at
baseline with the main outcomes extending through four follow-up time points. In the
SICAS, children were followed for 1 year, with a total of 5 annual cohorts recruited from
inner-city schools in a large urban area in the Northeast (Phipatanakul et al., 2011). Self-
report data from parents included demographic information, home and neighborhood
environment, parent perceived stress and questions pertinent to the child’s asthma.
Inner-city home and social environment variables measured include the child’s
characteristics of age, gender race, health insurance, type of transportation, exposure to
passive smoke, and the parent’s characteristics of education, income and employment,
marital status, housing, number of people in the home, number of children in the home,
number of smokers in the home, and perceived maintenance of the neighborhood they
live in.
Parent stress was measured using the Perceived Stress Scale, where perceived
stress is defined as “the degree of which situations in one’s life are appraised as stressful”
(S. Cohen, Kamarck, & Mermelstein, 1983) (p.385). A global stress level more likely
affects a person’s illness process than specific live events that have occurred (S. Cohen et
al., 1983). A shortened Perceived Stress Scale with four items was previously validated
and used in SICAS.
Asthma control was measured by the Asthma Therapy Assessment Questionnaire
(ATAQ), which includes seven questions about the child’s asthma symptoms,

4
consequences of asthma like missed school and activity interference, parent’s perception
of their child’s asthma control and quick-acting medication use. It is viewed as a
validated tool that measures children’s control and management by clinicians in order to
identify children at risk for adverse outcomes (Skinner et al., 2004).
Urgent or emergent healthcare visits were defined as parent report of child’s
unscheduled healthcare visits related to asthma and occurring within the last year.
School absenteeism was defined as parent report of child’s missed school days
attributed to asthma and occurring within the last year.
Parent management behaviors were conceptualized as parent actions on the
child’s behalf to assist in controlling their child’s asthma condition. Parent management
behaviors measured reflect the four domains of asthma management described in the
national guidelines (NAEPP): assessing and monitoring asthma, controlling
environmental factors related to asthma, pharmacologic therapy and education for
partnership in asthma care (Program, 2007). Not missing or skipping scheduled routine
healthcare visits for asthma reflects the parent’s role in assessment and monitoring of the
child’s condition. Eliminating passive smoke exposure, smokers in the home and pests in
the home reflect the parent’s role in controlling the home environment. Medication
adherence by administering their child’s preventive controller inhaler daily or some days
reflects the parent’s role in pharmacologic therapy. Lastly, having an asthma action plan
(AAP), or a written treatment plan for asthma, is both the parent’s and healthcare
provider’s role in the management domain of education and partnership.

5
Significance
Healthcare use and Missed Learning. According to data from the Centers for
Disease Control and Prevention’s (CDC) 2009 National Hospital Ambulatory Medical
Care Survey, asthma causes approximately 774,000 emergency room visits for children
under 15 years old a year (Association, 2012). Also, according to data from the CDC’s
National Hospital Discharge Survey, 1995-2010, asthma is the third highest cause of
hospitalization of children (Association, 2012). The CDC’s National Health Interview
Survey found asthma caused 10.5 million missed school days for children ages 5-17 in
2008, and increased to 14.4 million missed school days in 2011 (L. J. Akinbami et al.,
2011; Association, 2012). The World Health Organization has asserted that childhood
asthma is responsible for many disability-adjusted life years lost and a substantial amount
of medical costs (Organization., 2007).
Emergency department (ED) visit reduction for children with asthma remains
elusive (Program, 2007). Data from the National Health Interview Survey indicate that
minority children have higher prevalence rates of asthma compared to all children with
asthma, with 16.4% of African American children and 17.7% of children of Puerto Rican
descent, and an even more pronounced difference at or below the poverty level (Statistics,
2012). Measuring ED use and school absenteeism are outcomes used by national surveys
commissioned by CDC ask parents and patients about these outcomes because of their
importance in knowing the burden of asthma as a disease (L. J. Akinbami et al., 2011).
Understanding the effect parent management behaviors, as well as parent
sociodemographic and psychosocial variables, on ED visits and missed school for

6
children with asthma was explored to provide insight for possible future interventions to
mitigate use of the ED for asthma care and children missing school due to asthma
symptoms, thus reducing healthcare costs and increasing academic success.
Lack of asthma control and medication management. While national clinical
guidelines for asthma management are available, national implementation is varied. Data
from a nationally representative sample of children with asthma from the Behavior Risk
Factor Surveillance System Asthma Call Back Survey, reported between 17.1% to 33.7%
of children per state who either used asthma medication, had asthma symptoms, or had a
healthcare provider visit for asthma in the last year were taking corticosteroids for long-
term asthma symptom relief, while 43.1% to 63.1% of these children per state had an
asthma attack (Statistics, 2012). Children who need medications to control their asthma
are not receiving or taking them, even though over half (52.7%) have had an asthma
episode warranting this treatment for prevention of future attacks (Control, 2012).
Children are suffering from preventable symptoms by not taking necessary treatment.
Healthcare Provider Role and Parent Role in Management. Effective
treatment that reduces symptoms and utilization of emergency services are incorporated
into professional guidelines (Program, 2007). The Global Initiative for Asthma (GINA)
and the National Institutes of Health (NIH) believe that the problems from asthma would
be averted if guidelines for asthma management are followed (Asthma, 2012; Program,
2007). The National Heart Lung Blood Institute (NHLBI) has developed asthma
management guidelines through expert review of current literature, which include four
domains of management (Program, 2007). Healthy People 2020 prioritized reducing

7
hospitalizations and ED visits related to asthma and increasing the use of the NAEPP
guidelines in asthma management (2020., 2014).
The clinician role in the national asthma management guidelines is clearly defined
under each of the four asthma management domains (Program, 2007), including
assessing and monitoring asthma, education for partnership in asthma care, controlling
environmental factors related to asthma and pharmacologic therapy. The healthcare
provider assists in assessment and monitoring of the child’s asthma by assessing the
child’s asthma control using physical exam and pulmonary function testing. The
healthcare provider presents education for the management of the child’s asthma by
giving the patient and family a written asthma action plan, as well as teaching basic
knowledge about asthma and its treatment. Healthcare providers can provide skin testing
to determine the patient’s sensitivity to allergens in order to assist in effective
environmental management. Lastly, the healthcare provider prescribes pharmacologic
therapy to assist in the prevention and treatment of asthma symptoms.
The Global Initiative for Asthma (GINA) recommends that healthcare providers
include parents in management and emphasize the need for collaboration for successful
self-management of asthma (Asthma., 2012). However, the role of the parents in asthma
management is currently less defined comparatively to the healthcare provider’s role.
Constructing a clear role for parents in asthma management is crucial for managing the
child’s asthma at home, as well as in assisting the clinician in effective asthma
management. While healthcare providers potentially counsel parents regarding asthma
management behaviors in each of the domains, they cannot replace the parent’s role of

8
action in these domains. For example, healthcare providers do prescribe treatment, but
they do not buy the medication at the pharmacy or administer it regularly at home.
Healthcare providers do monitor the child’s symptoms in clinic, but cannot when the
child is at home. Healthcare providers do tell parents what allergens the child is sensitive
to, but cannot change the child’s environment where they live. The healthcare provider
reminds parents to use the written asthma action plan, but cannot be present to assist with
its use when needed at home.
Healthcare providers educate patients throughout their patient’s disease process,
from diagnosis through to achieving asthma control. The importance of these behaviors
which only parents are able to implement is currently not clearly communicated to
parents by healthcare providers. For example, in a national sample of combined data
(2006-2010), only 40% parents of children with active asthma (use asthma medications,
have asthma symptoms, or have healthcare provider visits for asthma in the last year)
were reported have heard from their healthcare provider recommendations to change their
home environment to assist in managing their child’s asthma (Control, 2012). Also, there
is a similar low rate in providing the most agreed upon educational intervention for
asthma management; the asthma action plan (AAP). Only 45.4% of parents of children
with active asthma were given an AAP (Control, 2012). If AAPs are used with less than
half of the children who need them nationally, than the importance of the other parent
management behaviors are even less likely to be discussed by healthcare providers.
Examining the impact of these parent management behaviors in the inner-city population
on children’s asthma outcomes was performed in this secondary analysis.

9
Conceptual Theoretical Empirical Framework
Orem’s Self-care Framework and Bandura’s Social Cognitive Theory have been
used to guide and inform the research. The Self-Care Framework focuses on patients' and
nurses’ deliberate actions to meet self-care needs (Fawcett & Desanto-Madeya, 2013).
Self-care activities are actions that support overall health, and self-management behaviors
are an aspect of self-care activities that support the management of disease. The Social
Cognitive Theory (SCT), developed with a key component of self-efficacy by Bandura in
1977, describes behavior change as a process influenced by personal characteristics, the
environment, and human behavior (Institute., 2005). The SCT explains human behavior
in the interaction between cognitive and environmental influences on behavior, and their
reciprocal determinism.
Dependent Care. Children need management behaviors to be performed for the
management of their condition; however, they may not be physically or cognitively
capable of carrying out these behaviors without parental assistance and guidance. Thus,
parents and guardians play an instrumental role in insuring their children’s appropriate
asthma management behaviors. The concept of dependent care is described by Orem
(1987) as an “activity performed by responsible adults for socially dependent family
members,” (Orem, 1987) (p. 212). Self-management for children with asthma has already
been described in the literature as “the behaviors that people with asthma and their family
members perform to lessen the impact of this chronic illness,” purporting management
behaviors as combined efforts or actions in a family (Shegog et al., 2001) (p.50).

10
Figure 1. Conceptual-Theoretical-Empirical Model
Antecedents. A conceptual-theoretical-empirical (CTE) structure was created for
management behaviors related to parents of children with asthma (Figure 1). Basic
conditioning factors and dependent-care agency power components are represented by
the theoretical concept of antecedents, which are the sociodemographic characteristics of
the parents and children with asthma. These include child characteristics and parent
characteristics. Child characteristics include child age, gender, race, health insurance, and
asthma severity. Parent characteristics include parent gender, parent race, income,
education, marital status, housing, people in home, neighborhood and transportation.
These characteristics represent the environmental influences on behavior and cognition in
Bandura’s SCT.

11
Self-efficacy and perceived stress. Self-efficacy, a part of the cognitive aspect
that influences behavior in the SCT, is an exercise of control (Bandura, 1997). The
perceived stress scale measures the amount of control a person believes they have over
their life (Cohen, 1977). The NIH recommends that self-efficacy can be measured by
using Cohen’s Perceived Stress Scale, where psychological stress is an “adaptive capacity
overload” (Toolbox). Self-efficacy, as a middle range concept stemming from dependent
care agency, represents the parent’s beliefs of their capability to control aspects in their
life, which influences their behaviors. For parents of children with asthma, their
perceived stress would influence the asthma management behaviors they do or do not
perform. Dependent-care agency is represented by Bandura’s concept of self-efficacy,
which measures parent stress using the Perceived Stress Scale.
Attributes. The concept of self-management behavior reflects the concept of self-
care by representing activities initiated and performed to support health, with self-
management behaviors are only specific to managing disease (Ryan & Sawin, 2009). In
the same way, the CTE middle-range concept of parent asthma management behaviors
includes only behaviors related to asthma management, while more broad concepts of
self-care or dependent-care in Orem’s Self-care Framework are not considered for this
analysis. Parent asthma management behaviors represent Orem’s dependent-care concept
and Bandura’s self-regulation theoretical concept, and include all four categories of
asthma management identified by the NAEPP. These categories include the assessment
and monitoring domain, environment domain, medication domain, and education domain
(Program, 2007).

12
Each of the domains has a variable or multiple variables that measure a parent’s
role in asthma management. The assessment and monitoring domain is measured by
skipped primary care appointments. The environment domain is measured by the number
of types of pests in the home, people who smoke in the house and known child’s passive
smoke exposure. The medication domain is measured by the frequency of administration
of a controller medication. While there is no direct education management measurement
performed by parents, the availability of an asthma action plan for the child is a co-
management behavior of both healthcare providers and parents. Healthcare providers
need to offer this plan and parents need to actively use the plan or ask for written
information related to the child’s treatment plan. These behaviors are each related to the
parent’s role in managing the child’s asthma.
Consequences. The concept of dependent care deficits is represented by the
theoretical concept of consequences and measured by the control section of the Asthma
Therapy Assessment Questionnaire and other commonly measured outcomes, such as
unscheduled healthcare visits and school absenteeism. The empirical methods will be
expanded upon further in Chapter 3.
Dependent-care Deficit. Orem discusses how a dependent-care deficit leads to
negative outcomes. Dependent-care deficits are recognized when dependent care agency
power components do not support dependent-care enough to meet the therapeutic
dependent-care demands for disease management to occur. In other words, if the
antecedents (child and parent sociodemographic characteristics, inner-city environment
and parent stress) do not support or allow the management behaviors (parent management

13
behaviors related to the child’s asthma) to occur, then a dependent-care deficit will be
evident, leading to negative consequences (uncontrolled asthma, unscheduled asthma
visits and missed school).

14
CHAPTER TWO
REVIEW OF THE LITERATURE
This secondary analysis was designed to examine associations between
characteristics of inner-city children and parents, parent stress, parent asthma
management behaviors and child asthma outcomes, including emergency visits for
asthma and school absenteeism. This chapter includes a review of literature on childhood
asthma and parent asthma management behaviors, as well as a review, critique and
synthesis of literature on parent stress related to child chronic disease, asthma outcomes,
and parent management behaviors. This review of the literature provides a context for the
secondary analysis performed, which addressed current gaps in the literature and the
national call for more in-depth studies examining psychosocial variables that impact the
management of this presently uncontrolled disease.
Asthma Development and Expression
The National Heart, Lung, and Blood Institute (NHLBI) convened an expert panel
to create asthma diagnosis and disease management guidelines. Using the latest scientific
evidence, they present a definition of asthma, the pathophysiology and environmental
influences, diagnosis, and recommendations for the management of asthma (Program,
2007). The panel defines asthma as a chronic disorder of airway inflammation. Clinical
characteristics of asthma are recurring symptoms, underlying inflammation, bronchial

15
hyper-responsiveness and airway obstruction (Program, 2007). Genetic patterns and
phenotypes of this disorder are still undergoing evaluation. Phenotypes include
intermittent asthma, persistent asthma, severe asthma, exercise-associated, and aspirin-
sensitive, with all types manifesting airway inflammation (Program, 2007).
Asthma Severity and Asthma Control
Asthma severity was first defined in the NAEPP guidelines in 1991 as a
classification of asthma into different categories base on symptoms, frequency of
exacerbations, school attendance, with exercise tolerance and pulmonary function tests
also influencing the severity assessment (Yawn, Brenneman, Allen-Ramey, Cabana, &
Markson, 2006). These assessments happen before medication is initiated, with severity
typically measured in the clinical setting at the start of therapy (Yawn et al., 2006). The
only objective measure for asthma severity is a pulmonary function test (PFT), which
measures the largest amount of air exhaled forcibly from the largest amount of air inhaled
(FVC) with the amount of air forcibly exhaled in the first second (FEV1) (Program,
2007). Lung function is measured by forced expiratory volume (FEV) and forced vital
capacity (FVC), with the ratio of these two measures calculated for an objective rating
(Program, 2007).
Asthma control, however, uses similar assessments as asthma severity, yet they
take place after treatment is initiated. Both international and national guidelines agree;
determining the degree of a child’s symptoms, or asthma control, is necessary to modify
asthma therapy (Asthma., 2012; Program, 2007). Asthma control is a “short-term

16
evaluation of the adequacy of patient management and determines the need for clinical
intervention” and is “a function of underlying severity plus the adequacy of management”
(Vollmer, 2004). Asthma control can be measured by asthma symptoms, lung function,
acute care use and quality of life, with patients who have controlled asthma exhibiting
fewer symptoms, less acute care use, increased lung function or increased quality of life.
Asthma control is often a patient or parent reported measure and some questionnaires are
meant to assist clinicians in discerning the need for additional asthma management
(Yawn et al., 2006). In the secondary analysis, asthma control was measured using the
NAEPP guidelines as well as a validated tool for asthma control.
Medical Treatment
Children ages 5-11 years have specific guidelines for their medical management
(Program, 2007). Pharmaceutical treatment depends on the severity of the child’s asthma.
This is measured using current symptoms, nighttime awakenings, interference with
normal activity, lung function and exacerbations requiring short-acting medication
therapy for quick relief and if any corticosteroid use is needed (Program, 2007). If a
child’s severity is intermittent, then a short-acting inhaler is given, and if severity is
persistent, a long-acting relief inhaler is given as well. Even if a child with more severe
asthma is well-controlled with few symptoms, they are more prone to asthma attacks
(Program, 2007). For this reason, controlling for asthma severity is important when
looking at outcomes. In the secondary analysis, asthma severity is controlled for in
multivariate analysis with the main outcomes of unscheduled healthcare visits, school
absenteeism and asthma control.

17
Assessment and monitoring of child’s symptoms can prevent an asthma attack.
These indications include the frequency of symptoms, nighttime awakenings, inhaler
medication for symptoms control, and interference with activity (Program, 2007). For an
acute exacerbation, the most common early respiratory symptoms are episodic coughing,
shortness of breath, or wheezing (GINA, 2006). Parents monitoring their child’s asthma
symptoms can help them anticipate uncontrolled asthma and give the appropriate
medications for treatment or avoid environmental allergens that may worsen their child’s
symptoms. Asthma action plans (AAPs) are written treatment plans for patients with
asthma. AAPs assist parents identify which symptoms may lead to an attack, remind
them to monitor their child’s lung function with a peak flow monitor, remind parents of
which environmental allergens to stay away from or eliminate, instruct parents on which
inhaler to give and how often depending on the child’s symptoms, and when their child’s
symptoms or lung function warrant going to the emergency department. The secondary
analysis determined whether or not a parent was given an AAP.
Asthma Management Domains with Specific Parent Management Behaviors
Asthma management behaviors are actions taken to control asthma. These actions
are necessary as asthma is a chronic, incurable disease. The global guidelines for asthma
management stress the importance of active participation of both the healthcare provider
and patient, or parent in the case of a child with asthma, for effective asthma management
(Asthma., 2012). The goal of asthma management is asthma control, normal pulmonary
function levels, normal activity levels, to prevent mortality and to prevent side effects of
medications (Asthma., 2012). As previously mentioned, the national guidelines from the

18
NHLBI are based on evidence review and synthesis conducted by an expert panel
(Program, 2007). These guidelines are based on the best evidence available, either tested
in randomized control trials or quasi-experimental research. Expert consensus is used for
guidelines where strong evidence is limited, and these guidelines are not strongly stated.
Four essential components of asthma management frame the recommended guidelines.
The four domains for asthma management are assessment and monitoring,
pharmacological therapy, education and control of environmental factors (Program,
2007).
Assessment and Monitoring Domain
The assessment and monitoring domain includes initial assessment, periodic
assessment and referral to an asthma specialist (Program, 2007). Asthma symptoms are
manageable if recognized early on, communicated and treated (Program, 2007). Routine
visits can help identify ongoing symptoms or pulmonary function that is not optimal and
adjust treatment to prevent worsening of the condition. Parents need to bring children to
their primary care provider or an asthma specialist regularly for monitoring. A
randomized control study performed by the NHLBI Childhood Asthma Research and
Education Network sought to examine what features of children will determine which
medication would be most effective. This study with 144 children 6-17 years old with
mild to moderate asthma revealed that monitoring the child’s pulmonary function using
FEV1 should inform healthcare provider’s choice on which controller medication to
prescribe (Szefler et al., 2005). Parents bringing their children to a healthcare provider for
a healthcare appointment to monitor their child’s pulmonary function, and not related to a

19
current asthma exacerbation, is an important assessment and monitoring domain parent
management behavior. In this analysis (SICAS), missing routine visits, which assist with
assessment and monitoring of the child’s symptoms, was examined in relation to child
asthma outcomes.
Medications Domain
The medications domain includes prescribed medications as well as
complementary and alternative medicines, and managing asthma exacerbations (Program,
2007). Anti-inflammatory medications have shown in rigid clinical trials and in common
clinical settings that they are an essential component to asthma management (Program,
2007). Systemic steroids have shown to decrease inflammation, ED visits and
hospitalizations (Altamimi et al., 2006; Qureshi, Zaritsky, & Poirier, 2001; Rachelefsky,
2003; Scarfone & Friedlaender, 2003). Parents who assist their children in regularly
taking anti-inflammatory medications, which require daily administration, are performing
the necessary medication domain asthma management behavior. This current analysis
(SICAS) measured this domain’s management by how often the child is given their anti-
inflammatory (ICS) medication, whether it is daily, sometimes, with symptoms only or
never.
Education Domain
The education domain includes regular review of information pertaining to
asthma, a written AAP and an active partnership between provider and family (Program,
2007). It has been known for several decades that parental asthma knowledge has been
associated with greater adherence to management regimen and decreased unplanned

20
healthcare visits and hospitalizations (Brook, Mendelberg, & Heim, 1993). Clinicians
recognize this need and ideally integrate parental asthma self-management education into
the child’s care for asthma, as an area health service in Australia has done successfully
(Burns, Gray, & Henry, 2008).
Brown and colleagues’ systematic literature review of parent asthma management
suggests early recognition of symptoms by parents is associated with prevention of
asthma exacerbations(N. Brown, Gallagher, Fowler, & Wales, 2010). Results of a
descriptive study of 100 parents of children with persistent asthma and a mean age of 4.4
years (SD= 2.1) conducted by Butz and colleagues supports these findings indicating that
only 42% (N: 40/96) gave their children asthma medication when asthma medication was
warranted with the symptom of coughing (Butz et al., 2004). The ability of parent to
assess child’s symptoms is essential in management, because young children may not be
able to recognize or verbalize their symptoms adequately (Butz et al., 2004). Written
treatment plans help with recognizing symptoms where medication administration is
necessary, and only 39% of these children had an asthma action plan (Butz et al., 2004).
As poor adherence is associated with treatment failure, a review of adherence
measurements for children with chronic illness recommended written treatment plans as a
solution (Quittner, Modi, Lemanek, Ievers-Landis, & Rapoff, 2008). A parent utilizing an
AAP given to them by a healthcare provider is a fulfillment of the parent educational
asthma management behavior. However, healthcare providers need to give AAPs for
parents to use in order for parents to fulfill this behavior. The secondary analysis
examined whether or not a child has an AAP and its relationship to the child’s outcomes.

21
Environmental Domain
The environmental domain includes avoiding inhalant allergens and irritants,
while controlling comorbid conditions (Program, 2007). In a retrospective survey of
parents of children 8 years or younger in ICS therapy, Ranganathan and colleagues
reported that a home environment with either a household member smoking, furry pets in
the home or a damp or moldy environment was significantly more likely to be found in
households of children with difficult to control asthma (N=41/57, 73%) than children
with well-controlled asthma (5/23, 22%, p<.0001) (Ranganathan, Payne, Jaffe, &
McKenzie, 2001). In a randomly selected nationwide sample of 896 children 2 to 12
years old with asthma, Cabana and colleagues found that 82% (N=582/717) of parents
who could identify a trigger of their child’s asthma reported attempting to change their
environment to benefit their child’s asthma (Cabana et al., 2004). However, just over half
(51%) of the environmental interventions parents had reported were not consistent with
the national guidelines and were likely not beneficial in preventing asthma symptoms in
their child, revealing a continued need for education and prioritization of environmental
interventions for parents (Cabana et al., 2004).
While pest elimination is the responsibility of parents, extermination can be
difficult to keep allergen levels low. Gergen and colleagues showed in an inner-city
extermination intervention (NCICAS), extermination only had a short period of
effectiveness and allergen levels remained high enough to cause asthma symptoms in
children with asthma (Gergen et al., 1999). Gergen found that treatment in all rooms
would be needed and may need to happen over time to decrease the allergen levels in the

22
homes. Also, prevention of reinfestation techniques is recommended, especially in
apartments or multiple unit buildings (Gergen et al., 1999).
Teaching children to avoid tobacco smoke has shown to be effective in self-
management (J. V. Brown, Avery, Mobley, Boccuti, & Golbach, 1996). However, Wong
and colleagues reported in a descriptive study of child-parent dyads that parents were
able to assess more accurately than children the amount of indoor smoking that occurs,
giving parents the responsibility to monitor their child’s environment at home (Wong,
Bernaards, Berman, Jones, & Bernert, 2004). Therefore, parents have a major part to play
in detecting and protecting their children from environmental allergens that exacerbate
their asthma. Environmental domain management behaviors that parents perform are
providing a low tobacco exposure and low pest exposure home environment for their
child with asthma. This secondary analysis examined the home environment management
behaviors of child tobacco exposure, smokers in the home and pests in the home.
Barriers to Adoption of Asthma Management Domains
Adoption of management behavior recommendations for each asthma
management domain by both clinicians and parents is needed. These clinical guidelines
for asthma specific management are written for clinician use, yet necessary for use by
parents of children with asthma as well. However, the guidelines’ complexity and high
quantity of educational messages are barriers for clinicians effectively communicating
these management domains to parents. Because of these barriers, education performed by
healthcare providers is commonly focused primarily on medication administration and
seldom includes other domains. In a qualitative study of 40 inner-city, minority families

23
who have a child with asthma, healthcare provider education was reported to focus on
medications and not about symptom prevention or self-management, with 8% of parents
receiving written materials (Yoos et al., 1997). This secondary analysis examined each of
parent asthma management domains to determine the influence of parent management
behaviors on the child’s asthma outcomes, controlling for asthma medication
administration.
Necessity of Parent Role in Asthma Management
Cognitive, psychosocial and motor capabilities affect children’s ability to manage
their asthma, and, as a result, parents continue to be primarily responsible for asthma
management through adolescence (Ayala et al., 2006; N. Brown et al., 2010; Program,
2007). While children have a role in asthma management, it is relatively minor compared
to parents’ influence on asthma management. In a qualitative study of 61 caregivers of
children with asthma and 15 nurses, Brown and colleagues observed that five year old
children can only perform 11% of asthma self-management behaviors by themselves and
need adult assistance or supervision for the other skills (J. V. Brown et al., 1996).
Overall, evidence suggests that parents of children with asthma appear to
understand their role in medication administration. In a qualitative study of 18 parents of
children and adolescents with asthma 2-18 years old, parents’ beliefs, knowledge and
attitudes towards anti-inflammatory medication use was explored. Peterson and
colleagues found that parents, commonly mothers, direct the asthma management of their
children, “including medication administration, healthcare provider visits, management
and communication with school and daycare and other activities outside of the home”

24
(Peterson-Sweeney, McMullen, Yoos, & Kitzman, 2003) (p.50). They add that routine
visits with their PCP or asthma specialist would likely increase the parents’ knowledge
and improve outcomes (Peterson-Sweeney et al., 2003). A qualitative study using focus
groups with 50 middle school children with asthma with a mean age of 12.5 years old
(SD= 1.05), explored asthma management barriers and developmental issues. Ayala and
colleagues found that adolescents were gaining more autonomy in asthma management
from parents in the area of medication management, though parents continued to be
involved in reminders to take medication and other aspects of medication management
(Ayala et al., 2006).
These qualitative studies on parent versus child management behaviors suggest
that parents direct the management of their child’s asthma, while children actually
perform a very small percent of behaviors, including adolescents. For this reason, this
secondary analysis was designed to measure parent management behaviors, and not
children’s, to determine what management behaviors are associated with improved
asthma outcomes.
Parents who are non-adherent in administering their child’s asthma medications
do not likely realize the importance of their role. A qualitative study examining the
barriers to adherence to guideline-based care found that parents misjudge their child’s
ability to manage their asthma on their own. In a study of 20 parents of children 2-12
years old with asthma, in-depth interviews were performed after one year of
electronically monitored adherence of their child’s medication use (Klok, Lubbers,
Kaptein, & Brand, 2014). Reasons for non-adherence to medications measured

25
objectively by electronic monitoring were reported as unawareness of non-adherence by
parents and healthcare providers, a lack of parental drive to obtain high adherence and
ineffective parent problem solving. Klok and colleagues found that parents placed
excessive responsibility for medication adherence on children. Similarly, in a study of 30
African American caregivers and children 6 to 14 years old with asthma, only 7% had
effective metered dose inhaler skills, yet 93% were taking their inhalers on their own
(Winkelstein et al., 2000). Without parental supervision, these children had inadequate
inhalation techniques (Winkelstein et al., 2000). Parents may be unaware of their child’s
medication adherence and may be unaware of their child’s poor inhalation techniques,
pointing to the child’s need for parent directed medication management. As non-
adherence in medication administration may demonstrate a lack of parent understanding
of their role in asthma management or parents who experience stress relinquish this
responsibility to children, this secondary analysis examined parent psychosocial variables
(such as stress, knowledge and beliefs) on medication management and asthma outcomes.
Challenges to Parent Directed Asthma Management in an Inner-City Setting
Low-income, urban families experience stress related to many stressors from their
environment and may not be equipped to overcome these stressors in order to have a
sense of control. Socioeconomic, housing, neighborhood violence and other stressors
may be unique to the urban environment, causing “urban stress” (Quinn, Kaufman,
Siddiqi, & Yeatts, 2010b). This psychological stress is a “social pollutant” that could be
caused by acute and chronic housing stressors in the urban environment, leading to
biological changes or behaviors that impact health (Quinn et al., 2010b). This secondary

26
analysis was designed to explore potential stressors from the inner-city environment and
their effect on the psychological stress experience of parents of children with asthma, as
well as provide insight to into the connection between the parents’ stress responses and
their asthma management behaviors.
National Inner-City Study of School-Aged Children and their Caretakers
The National Cooperative Inner-City Asthma Study (NCICAS) sought to explore
the factors that contribute to asthma morbidity in children in the inner city with an
intervention of asthma counselors coordinating asthma care with a home environment
control program. This intervention included two group sessions for parents and one
individualized session related to asthma knowledge and healthcare provider
communication, gave parents pillow and mattress covers to control dust, and sent
healthcare providers blank asthma action plans, national guidelines, a spacer and a peak
flow meter (Evans et al., 1999). This multi-center study enrolled 1,528 children and their
caregivers visiting the ED or clinic from eight major cities across the US, with 398 of the
visits related to acute symptoms of asthma (Kattan et al., 1997). Children were 4 to 9
years old, 73.5% were African American, 19.5% Hispanic, and 7% white or other race
(Wade et al., 1997). 73.1% of children were enrolled in Medicaid, 65.7% went to the ED
for asthma at some point in the last year. Parents had many living challenges, with 61%
of households had <$15,000 annual income, 77% of parents were not married and only
66.7% of mothers or caretaker completed high school (Kattan et al., 1997). Parent stress
was measured using the PERI Life Events Scale, which is a non-global measure of stress,
revealing a high amount of life events in the last 12 months (mean 8.16, SD 6.36,

27
N=1,515) (Wade et al., 1997). Also, parent psychological symptoms were exceedingly
high (BSI Global Severity Index level of 56.02 versus norm of 50), with 50% of the same
reached clinical severity. However, children in this inner-city population had a similar
rate of behavior problems as the general population (50 versus 57.3%) (Wade et al.,
1997).
The individual life events scale (PERI Life Events Scale) reveals that parent stress
is likely from urban poverty unrelated to the child’s chronic disease, with a high amount
of undesirable life events (8 events within a 12 month period). This study reveals that in
the inner-city population, multiple life stressors and not the child’s chronic illness likely
explain parent stress. Wade also recognized that these psychological difficulties likely
impair the parent’s ability to effectively manage their asthma (Wade et al., 1997). The
authors acknowledged these psychological difficulties may affect parent’s ability for
asthma management and called for more small, in-depth studies to examine this possible
link (Wade et al., 1997).
Unscheduled asthma visits per year approached significance in the second year
for the intervention group compared to the control group (difference: –0.35, 95% CI, –
0.72, 0.03, p= .075) (Evans et al., 1999). An analysis of ED visits related to the parent’s
stress was not performed. Parents of children with asthma reported 39% of homes had
one or more people smoking, with 48% of the children’s urinary cotinine samples had
more than 30 ng/mg (Kattan et al., 1997). The researchers recognized that the sample
likely had higher morbidity than a population sample due to recruitment from medical
facilities, with 17.1% of children hospitalized in the last year (Kattan et al., 1997). While

28
pest elimination is the responsibility of parents, even extermination can be difficult to
minimize allergen levels. Gergen and colleagues showed that the NCICAS intervention
of extermination only had a short period of effectiveness and allergen levels remained
high enough to cause asthma symptoms in children with asthma (Gergen et al., 1999).
Families in the inner-city have a difficult time controlling pests in the home (Gergen et al.,
1999).
Asthma counselors in this NCICAS intervention described above were flexible to
help families address non-asthma related needs to “reduce distractions in the family’s
life”, which enabled them to focus on the child’s asthma concerns (Evans et al., 1999).
This secondary analysis examined the likelihood of non-asthma related concerns inducing
parent stress, which negatively affects their attention toward their child’s asthma
management, hypothesized to reduce asthma management behaviors and cause negative
child asthma outcomes.
Inner-city Challenges to Parent Asthma Management
Transportation
A qualitative study with interviews of 33 school nurses who work in urban public
schools on barriers to care include a lack of asthma knowledge related to asthma as a
chronic which requires ongoing care, as well as parent difficulty retrieving their children
from school children who are having an attack if they have public transportation (Forbis,
Rammel, Huffman, & Taylor, 2006). A qualitative study with in-depth interviews of 38
parents in an impoverished urban environment on asthma management revealed a lack of
personal transportation (Grineski, 2008). Parents having public insurance are more likely

29
than parents with private insurance to have a lack of transportation. Taking the bus was
reported as a time consuming method (Grineski, 2008). Difficult transportation was also
discussed as a barrier to obtaining prescriptions (Grineski, 2008). These qualitative
studies on parent management reveal that transportation, as well as a lack of asthma
knowledge, are barriers to child asthma control. In the current analysis (SICAS) the role
of transportation and asthma knowledge were examined with asthma outcomes and
parent management behavior.
Asthma Care Plan and Asthma Specialist
In a descriptive study of 220 African American and Latino parents of children
with asthma, 68% reported incomes below the poverty level, 83% had Medicaid, 83%
were single and 75% had high school preparation or less (Flores et al., 2009). Results
indicated that low socioeconomic status (SES) affects the child’s asthma morbidity and
medical care (Flores et al., 2009). African-Americans were more likely than Latinos to
use emergency departments for routine asthma care (68% vs. 44%; p < 0.01), adjusting
for SES, caregiver’s educational attainment, and asthma severity. Low SES was
associated with greater odds of having an asthma attack (OR: 1.6, 95% CI: 1.1-2.3), and
lower odd of having an asthma care plan (OR: 0.6, 95% CI: 0.4, 0.9), adjusting for having
an asthma specialist. Low SES also was associated with half the odds of having an
asthma specialist (OR: 0.5, 95% CI: 0.2, 0.95). Having an asthma specialist increased the
odds (OR: 5.0, 95% CI: 2.2, 11.3) of having a written treatment plan, adjusted for SES,
caregiver’s educational attainment, and asthma severity (Flores et al., 2009).
This secondary analysis examined the likelihood of parents who are below a low-

30
income threshold of $25,000 annual household income in having routine asthma care and
a written treatment plan. The relationship between annual household income and parent
management behaviors such as routine healthcare visits and having a written treatment
plan was clarified by examining the association between routine care and a written
treatment plan, controlling for socioeconomic status (Flores et al., 2009) and other
demographic variables.
Tobacco Use and Financial Stress
A semi-structured interview study with African American parents of children with
asthma found that even though parents of children with asthma know that smoking is not
good for their child’s asthma, child smoke exposure continued due to barriers to tobacco
cessation (Halterman et al., 2007). The main barrier found was parents’ need for smoking
to assist in reducing their stress (Halterman et al., 2007). Specifically, financial stress was
a trigger associated with continued tobacco use. Even though parents made efforts to
reduce their amount of tobacco use around their children, they persisted due to their stress,
addiction, and a lack the knowledge to reduce their child’s passive smoke exposure
(Halterman et al., 2007). Even though this study was on African American parents only,
parent tobacco use and child smoke exposure are an aspect of parent environment
management behaviors and are anticipated to be barriers to asthma control and poor
asthma outcomes. In the secondary analysis, passive smoke exposure of children and
number of adults who smoke in the home were measured and examined in relation to
asthma outcomes, controlling for other demographic variables.

31
Primary Care Appointments
Qualitative interviews with 14 children with asthma and their 14 parents revealed
aspects of relationships with healthcare providers that were barriers to management.
Parents of children with asthma believed that a “lack of continuity” among healthcare
providers is a barrier to asthma management. Parents who use urgent care to take care of
their child’s asthma problems are more likely to have a lack of continuity, where parent’s
commented that urgent care provides quick treatment, while primary care investigating
the treatment plan (Buford, 2004). This secondary analysis examined the role of routine
asthma care on asthma control and asthma outcomes, including urgent care or emergency
department visits for asthma.
Parent Management Interventions and Reducing Acute Care in the Inner-City
Three interventional RCTs of parent asthma education management interventions
did not produce significant change in the main outcome of interest, emergency
department or urgent care visits. A randomized trial of an educational self-management
intervention of a tailored written action plan and an education summary was administered
at four urban pediatric emergency department sites for 464 families of children with
asthma (Sockrider et al., 2006). This intervention significantly increased the amount of
routine asthma healthcare visits 9 months after in the intervention group (OR: 1.85; 95%
CI: 1.05–3.39); however, ED visits and missed school was not significantly different
between intervention and usual care groups (Sockrider et al., 2006).
An RCT for parents of inner-city children with asthma 2-10 years old with
Medicaid insurance using a lay coaching intervention for 18 months (N=120) or usual

32
care (N=121) revealed an impact on several management behaviors (Nelson et al., 2011).
The intervention, related to asthma management at home and a collaborative relationship
with a healthcare provider, did not significantly reduce ED visits (RR= .98, 95% CI .85-
1.12) or hospitalizations (RR .99, 95%CI 0.59-1.14) compared to usual care. However,
parents who had the intervention were more likely to bring their child for an asthma
monitoring visit (RR: 136, 95% CI 1.05-1.75) and a non-asthma related PCP visit (RR
1.47, 95%CI 1.04-2.08) (Nelson et al., 2011).
Education management support by either of these two interventions increased
routine care but did not decrease main outcome of ED visits. Examining the relationship
between routine care and ED visits was a part of the current analysis (SICAS).
Modifying these monitoring visits will likely affect ED visits if measured longitudinally.
This secondary analysis of children with asthma was performed from a study that
longitudinally followed parents and their children for 1 year and provided insight into the
use of routine care on the outcome of ED use. The hypothesis of this secondary analysis
was that assessment and monitoring parent management, measured by routine care,
reduces the need or likelihood of a child going to the ED for asthma.
An RCT with a community sample of 362 parents of children with persistent
asthma ages 5 to 12 years old, where 4 key behaviors were targeted: using controller
medications, administering albuterol when noticing symptoms requiring it, have written
treatment plan and having a collaborative relationship with the PCP, all of which reflect
the NAEPP’s guidelines for care (Garbutt et al., 2010). While the coaching was tailored
based on the parent’s readiness to change (Transtheoretical model), there was no other

33
parent-specific characteristic consideration done in the intervention. Garbutt’s telephone
coaching intervention, described in the education management domain, did not reduce the
mean number of urgent visits (difference, 1.15; 95% CI, 0.82 to 1.61), but did decrease
the number of children with very poor asthma in the control group compared to usual
care (difference, 0.34; 95% CI, 0.21 to 0.48) (Garbutt et al., 2010). This intervention did
not affect unscheduled visits, but did improve asthma control. Again, it is possible that
affecting ED use could be seen if there is a longer follow-up period is possible. However,
it is also possible that these interventions did not include key components to effectiveness,
such as considering psychosocial or cultural aspects that may affect their effectiveness…
Taken together, these three statistically well-powered interventions did not affect
the main outcome they intended to change, ED or urgent care visits, however, they did
positively affect other supportive self-management behaviors. Measuring whether parent
psychosocial characteristics independent of demographics and education level, such as
parent stress and knowledge, were not examined in these interventions. What remains to
be clarified is whether parent stress or other psychological characteristics are mitigating
the effectiveness of these interventions of parent management on the outcome of interest.
This secondary analysis examined the impact of stress on parent asthma management
behaviors and their influence on the main outcome of emergency department visits.
The APA EBA Task Force performed a self-report instrument review related to
treatment adherence. The task force strongly recommended that future research should
focus on measuring the barriers to disease management and knowledge related to

34
treatment (Quittner et al., 2008). A barrier for parent management of chronic disease in
their children is parent stress.
Parent Psychological Distress and Management Behaviors
Parent psychological distress can affect management behaviors or actions parents
provide for their children in a general population. In a descriptive study of 400 parents of
preschool children, maternal depressive symptoms measured by the Mental Health
Inventory were associated with lower routine dental care in children (p=.001), brushing
teeth less than twice a day (p=.04), low discipline consistency (p=.005) and low parenting
confidence (p<.001) (Kavanaugh et al., 2006). However, routine child healthcare and
immunization administration was not significantly different between mothers with or
without depressive symptoms (Kavanaugh et al., 2006). Understanding what parent
management behaviors are affected by parent psychological distress and to what extent
this affects the child’s outcomes is necessary for furthering future interventional research.
The current study was designed in part to address this goal.
Parent Stress Affecting Asthma versus other Chronic Disease
One study explored the levels of stress of parents of children with asthma
compared with parents of children with other chronic disease, further exploring a possible
link between parent stress and the disease of asthma. A cross sectional study of parents of
children with chronic disease (N=425) who are primarily Caucasian, have moderate
income and are married, examined the relationship between parent stress and chronic
illness (Hullmann et al., 2010). The types of chronic illness included asthma (N=97), type
1 diabetes (N=143), cystic fibrosis (N=58) and cancer (N=109). Parent stress, measured

35
by the Parenting Stress Index/Short Form (PSI/SF), was significantly negatively
correlated with annual income (B=-.25, p<.01) and positive correlated with parent-
reported perceived child vulnerability (B=.41, p<.01) in zero-order correlations.
Differences between the disease groups was determined using a one-way ANCOVA with
the PSI/SF as the dependent variable and diabetes, cancer, asthma and cystic fibrosis and
annual family income entered as covariates. Parents of children with asthma reported
significantly more parent stress (Mean PSI/SF score= 77.8, SD= 2.1) than parents of
children with cystic fibrosis (M= 71.7, SD= 2.7) and parents of children with cancer (M=
69.2, SD=2.0), but was not significantly different than parents of children with type 1
diabetes (M=75.7, SD= 1.7) (Hullmann et al., 2010). This study revealed that parents of
children with asthma do have significantly more stress than some chronic diseases, but
not others (and that there are variations in stress levels of parents between chronic
diseases) in homogenous, moderate income populations. However, this study did not
control for any other possible factors that explain stress other than annual family income
and type of diagnosis. In this secondary analysis of a low-income, diverse, inner-city
children and their parents, parent stress is not thought to have originated from the fact
that the child has asthma, but is influenced by other common sources of stress in an
inner-city setting, such as financial, social or environmental sources.
Psychological Distress in Parents affecting Management Behaviors and Outcomes
Several studies examined the link between parent depressive symptoms and
asthma related outcomes, such as asthma related quality of life and ED visits, as well as
management behavior medication administration. Szabo and colleagues examined the

36
role of depression and health outcomes in a Hungarian sample of 7 to 17 year old
children with asthma (N=108) and their parents (Szabó, Mezei, Kovári, & Cserháti, 2010).
The control group consisted of 27 child/parent dyads, including children with chronic
renal conditions 7 to 18 years old. There were no significant between-group differences
in parent depression (Beck Depression Inventory) (asthma: 7.73 depressive points, SD
6.69; chronic renal disease: 9.61 points, SD 9.8). However, both groups had significantly
more depression than the general population (5.24 points, SD 7.43, p<.01). Children with
parents reporting more depressive symptoms had no significant difference in their
psychological score than children of parents reporting less depressive symptoms (Child
Depression Inventory score 9, range 0-29; CDI score 8, range 0-22, p=.79) (Szabó et al.,
2010). This indicates that the children’s psychological score, specifically measured as
child depression, was not influenced by their parent’s psychological score. Also, the
parents psychological score was not related to their quality of life measured by the
Juniper Pediatric Asthma Quality of Life Questionnaire, indicating that their depression
may not affect their QOL related to their child’s asthma (Szabó et al., 2010). This finding
assisted in guiding the pathway in this secondary analysis, with parent psychological
distress influencing parent actions, and not parent psychological distress influencing child
psychological distress, leading to worse outcomes.
In a prospective descriptive study of inner-city minority mothers of children with
asthma (N=158, mean age 7.9 years, SD 2.2 years), Bartlett and colleagues found
differences in medication administration among children of mothers with high and low
depressive symptoms (Bartlett et al., 2004). Over half of the children were prescribed a

37
daily anti-inflammatory controller inhaler (56.5%). In bivariate analyses, mothers with
high depression were more likely to be unemployed (p< .001) and have lower income
(p=.004). Bivariate analyses also indicated that mothers with more depressive symptoms
were significantly more likely to feel unable to stop an asthma attack at home (p=.009)
and their healthcare provider was less likely to explain what asthma medications are for
and how to use them (p=.003). Also, children who have mothers with more depressive
symptoms have problems taking medications (p=.009); they frequently forget to take
medications (p=.005), and they forget to take medications 2 or more days in the past 2
weeks (p=.014). The overall association of depression and adherence measures was weak
(r= .253 to .172, p < .05). Linear regression was used to examine the influence of
maternal depression and other factors on ED use 6 months after baseline. Controlling for
child age, household income, and asthma morbidity, maternal depressive symptoms was
significantly associated with ED visits (regression coefficient: .032, 95% CI .005-.058,
β .182, p=.019), as well as asthma symptoms in the last 6 months (regression
coefficient: .024, 95% CI .009-.040, β .234, p=.003). However, a follow-up of self-
reported medication adherence at six months was not significant in this model (Bartlett et
al., 2004).
The study did not include parent beliefs about asthma-management practices in
the ED model, which leaves the question as to what their impact on this outcome is for
this population. Parent depression had a direct effect on ED visits, controlling for
exogenous variables (Bartlett et al., 2004). While medication adherence did not impact
ED visits controlling for maternal psychological distress, there was a short 6 month

38
window to capture whether children had an ED visit or not. The outcome for ED visits is
optimally measured for 1 year due to seasonal variability related to rhinovirus infections
that exacerbate asthma or seasonal allergic rhinitis. Also, there were very few
demographic variables controlled for, possibly explaining some of the maternal distress
and explaining some of the variance in the medication adherence variable. This
secondary analysis filled these gaps by examining parent psychological distress of stress
and its influence on asthma management behaviors like medication administration
adherence and the outcome of ED visits, following children for one year and controlling
for relevant demographic variables.
Demographic Challenges and Parent Stress
Several studies examining demographic characteristics related to parent stress,
such as parent gender, education, marital status, and income. In a retrospective study of
383 children with chronic illness, where 90 (23.5%) had asthma, parent marital status,
parent income and parent stress were examined (Mullins et al., 2011). The full sample
was primarily Caucasian, middle income and married. Single mothers in this study were
more likely to be from a minority group and have lower income than married mothers (X2
(1): 28.97, p< .001; X2 (6): 146.32, p< .001, respectively). Parent stress was measured
using the short form of the Parenting Stress Index. In bivariate analysis, a direct
relationship between marital status and parents stress was found (β: -.14, p=.01).
However, the relationship was attenuated and became insignificant (p>.05) when
controlling for parent income. Parent income mediated the relationship between marital
status and parenting stress (z=-3.72, p<.001) (Mullins et al., 2011).

39
In a related study with a smaller sample of homogenous, moderate-income
parents of children with asthma, gender, age, income and duration of illness were not
significantly associated with parent stress in bivariate analyses (N: 60 children with
asthma out of 231 with chronic disease) (Carpentier, Mullins, Wolfe-Christensen, &
Chaney, 2008). Parent gender and income were significantly associated with parent stress
in a hierarchical regression with parent stress as the outcome (β= -.290, p< .05; β= -.359,
p< .01, respectively), with lower income and female gender associated with higher stress,
controlling for parent age and an Attributional Style Questionnaire score. As length of
illness was not significantly related to stress (β=-.028, n.s.), the relationship between
living with a child with asthma and parent stress was not supported (Carpentier et al.,
2008).
The parent demographic variables of parent marital status, household income and
parent gender are associated with parent stress in the parents of children with asthma
population in moderate-income, homogenous populations. Parent stress in an inner-city
population is higher than moderate-income populations. The NCICAS inner-city study
measured a significant amount of stressful life events of these parents in the last 12
months (mean 8.16, SD 6.36, N=1,515). What remains to be clarified are any differences
in the type of demographic variables that influence parent stress in the inner-city
population than a moderate-income population. This secondary analysis examined the
relationship between parent marital status, household income and parent gender with
parent stress in an inner-city population.

40
A well educated and high income population in an inner-city in India also
reported parent education had an impact on parent perceived stress (Rastogi, Gupta, &
Kapoor, 2009). A cross-sectional study measured parent education, medication
management and perceived stress of parents of children with asthma (mean age 5.7 years,
SD 2.7 years) in a well-educated, urban population in India (N= 134) (Rastogi et al.,
2009). Parent education was negatively correlated with parent stress, as those without
graduate education were twice as likely to have high stress (.28/.138= 2.02). 60% of
parents acknowledged daily use of preventive asthma medication was useful to prevent
symptoms, only 42% were on inhaled steroids at the time. 40% of this sample reported to
miss school related to asthma and only 6.7% had an asthma action plan, with 8% having a
problem with their school being equipped with rescue medication (Rastogi et al., 2009).
Parent perceived stress was reported to not limit adherence to controller medication
adherence or physical activity, however it was unclear what testing was done to reach this
conclusion. This well educated, high-income population residing in an inner city in India
may not have the same barriers to asthma management as a racially diverse, high stress
inner-city population in North America. This secondary analysis tested these
relationships in a larger sample with longitudinal data, in a diverse inner-city population.
Parent Stress and Demographics on Asthma Prevalence
In a secondary analysis that sought to determine if family stress influences asthma
development by age 4, parent stress was associated with asthma onset (Klinnert, Kaugars,
Strand, & Silveira, 2008). A diverse population of families of children with asthma
starting age 9-24 months was followed to age 4 (N= 98). An analysis was conducted

41
using baseline questionnaires given in a nurse home visitor intervention. The family
stress measurement included life events (21 items of possible stressful live events in the
last year), unwanted thoughts, marital conflict and unsafe neighborhood. While this stress
measurement measures stressful events or symptoms of stress, like unwanted thoughts,
they are not specifically measuring how the parent perceives stress. Children with asthma
(N=58) were significantly more likely to be in an unsafe neighborhood than children
without asthma (N=40) (p=.02) (Klinnert et al., 2008). However, life events, martial
conflict and unwanted thoughts were not associated with asthma onset.
No significant differences were observed in family stress as reported by married
versus single parents (Klinnert et al., 2008). Family stress was significant in predicting
asthma prevalence at age 4 when controlling for maternal mental health (p=.05), but
became insignificant when controlling for maternal demographics such as race, marital
status, and prenatal smoke exposure, illness severity and hospitalization (OR 1.07, p=.13).
Single parents and a minority racial/ethnic group of either African American or Hispanic
were significantly associated with a child having asthma at age 4 (OR=2.74, p=.04; p=.05
respectively), controlling for other parent characteristics, parent stress, illness severity
and hospitalizations. Illness severity was also significantly associated with asthma
diagnosis (OR 1.79, 95% CI 1.02-3.29, p=.05) (Klinnert et al., 2008).
Family stress was significant in predicting asthma prevalence not controlling for
other variables, but the relationship was mediated by parent race and marital status,
including other demographics. Unsafe neighborhood was significantly related to asthma
onset, but family stress was not associated with asthma onset. Being a single parent and

42
from a minority group were significantly related to asthma prevalence, controlling for
other demographics. These findings guided the analytic methods of the secondary
analysis performed, with the inclusion of neighborhood, parent marital status and
race/ethnicity groups in the analysis of parent stress and child asthma outcomes.
Global Measure of Stress: Perceived Stress
Perceived stress is a global measure of stress and defined as “the degree to which
situations in one’s life are appraised as stressful” (S. Cohen et al., 1983) (p.385). A
global stress level more likely affects a person’s illness process than the specific live
events that have occurred (S. Cohen et al., 1983). Self-ratings of event stressfulness better
predict health-related outcomes than looking only at events (S. Cohen et al., 1983). High
perceived stress occurs when overall life stress is threatening and there is insufficient
resources for the person to cope with the stressors.
A global measure of stress captures how a person is experiencing their stress, or
whether they feel like they have any control in the circumstances of their life. A life
events measure counts the number of potentially stressful events, yet does not capture
how the person is perceiving stress or its influence on their sense of control in their life
(Islam et al., 2011). This is especially relevant when examining whether stress impacts
asthma management behaviors, or decisions that parents do or do not do based on the
level of control they experience. Also, an intervention to address perception of stress and
not the actual life events themselves, would be more effective if it was known which
management behaviors perceived stress influences and which child asthma outcomes.

43
This secondary analysis measures perceived stress of parents and examines its effect on
parent management behaviors and child asthma outcomes.
Parent stress and Child Asthma Symptoms or Inflammatory Markers
In the first year of life, prenatal parental stress has been shown to impact a child’s
chance of wheezing (Wood et al., 2011). The Urban Environment and Childhood Asthma
study, a birth cohort of 560 babies, revealed that maternal stress (measured by the
External Stress Score) measured prenatally predicted multiple days of wheezing in the
first year of life (measured every 3 months) (Wood et al., 2011). Parent stress has been
shown to increase the risk of a child developing asthma.
However, the relationship between parent stress and child asthma symptoms is
unclear, especially after in-utero or early life exposures. A survey of 682 low-income
urban parents of children with diagnosed and undiagnosed asthma explored urban
housing stressors, including financial stressors of paying bills, for their impact on a
parents’ psychological stress. These factors were found to increase the risk of asthma
symptoms, including activity intolerance and waking up at night, and unscheduled
medical visits for children with asthma (Quinn, Kaufman, Siddiqi, & Yeatts, 2010a).
These stressors do have an impact on child asthma symptoms, yet the pathway is not
clear regarding the mechanism of influence on the child’s health.
A Psychosocial Pathway through Parent Management Behaviors
Unknown psychosocial pathway. Controlling for child asthma severity and
medications, a study measuring parent perceived stress partially explained the child’s
inflammatory processes, yet did not find a link between parent stress and child anxiety. In

44
a longitudinal study of children and adolescents 9 to 18 years of age with asthma (N=50)
and healthy controls (N=33), parent stress measured using the 10 item PSS was
associated with greater increases in the child’s IL-4 production (B= .29, p=.019) (Wolf,
Miller, & Chen, 2008). Asthma control was measured using the NAEPP guidelines, and a
serum specimen of immune response protein interleukin 4 (IL-4) and eosinophilic catonic
protein (ECP). Multiple regression explaining ECP in visit 2 controlled for the ECP level
in visit 1, severity variables, medications, diagnosis of asthma, stress, and interaction of
group (asthma or healthy) and parent stress. Parent stress explained some of the variance
in child’s inflammatory measures of ECP by 7.2% and IL-4 by 7.6% over 6 months,
while controlling for all other variables (Wolf et al., 2008). This variation of the
inflammatory measures over a six month period of time could be a problem for children
with asthma, yet were not linked to any other child asthma outcomes, such as symptoms,
healthcare visits or school absenteeism.
Wolf found that parent stress and depressive symptoms affect the child’s
inflammatory markers or physiological functioning. However, inflammatory markers did
not fluctuate with altered child psychological state. An editorial by Buseke-Kirshbaum
supports the conclusion that Wolf and colleague’s data does not support- a pathway with
parent stress working through child’s stress to affect inflammation (Buske-Kirschbaum,
2008). Similarly, Szabo also notes that parent stress and child psychological functioning
are not associated (Szabó et al., 2010). Szabo and colleagues examined the role of
depression and health outcomes in a Hungarian sample of 7 to 17 year old children with
asthma (N=108) and their parents. Children with parents reporting more depressive

45
symptoms had no significant difference in their psychological score than children of
parents reporting less depressive symptoms (measured by the Child Depression Inventory
score 9), indicating that the children’s psychological score, child depression, was not
influenced by their parent’s psychological score. Also, the parents’ psychological score
was not related to the child’s quality of life related to asthma.
The lack of an association between child anxiety and parent stress points to an
alternate pathway between parent stress and biological mechanisms that does not include
the child’s psychological state, such as through parent management behaviors (Buske-
Kirschbaum, 2008). There is a call for longitudinal studies examining the link between
family functioning and disease processes in children (Buske-Kirschbaum, 2008).
Identifying these parent factors, both psychological and behavioral, can assist in the
development of new psychological intervention strategies to assist in improving the
health of children with chronic disease. This analysis was designed in part to address this
gap in existing evidence.
Parent stress and Parent Management Behaviors
Psychosocial distress has been associated with general management behaviors in
parents. For example, maternal depression is associated with lower parent discipline,
confidence and dental care (Kavanaugh et al., 2006). More specifically, parent stress and
parent depression have been linked to asthma-specific management behaviors.
A randomized control study of inner-city African American parents revealed a
relationship between lower parent stress and higher medication adherence (Celano et al.,
2011). Parent stress was negatively associated with overall asthma management (r=-.41,

46
p= .006), including a medication adherence subscale (r=-.39, p< .01) (Celano, Klinnert,
Holsey, & McQuaid, 2011). However, a more diverse sample, including Hispanic parents,
is missing. Minimal data exist that focus on diverse populations and address barriers to
child asthma management related to parent stress, especially inner-city “urban stress”,
encompassing household and neighborhood factors. Similarly, a prospective descriptive
study of inner-city minority mothers of children with asthma revealed that mothers who
had more depressive symptoms had children with lower medication adherence, as well as
a positive association with higher child asthma symptoms and ED use at follow-up
(Bartlett et al., 2004).
In an similar inner-city population in the Northeast, stress and parent management
behaviors of medication administration and smoking attenuated part of the effect of
exposure to violence and number of symptom days (Wright et al., 2004). However, the
effects of parent stress and management behaviors on each other and on child symptom
days were not examined. These associations between parents stress on management
behaviors to affect child asthma outcomes is understudied.
Parent stress and Child ED visits
Children are taken to the ED for asthma for biological and behavioral reasons.
Biologically, the child is having asthma symptoms that warrant immediate attention.
Behaviorally, an adult needs to recognize that the child has these symptoms, is aware that
help is needed and to transport the child to the ED, or to elicit assistance for
transportation. However, different stressors can influence a parent’s decision to bring the
child to the ED. Financial stress, or cost sharing of medical care for asthma, may

47
influence a parent’s decision. Low income families who had their care covered were
more likely to take their child to their routine visits and to the ED (Fung et al., 2014). The
relationship between parent stress on parent management behaviors of child routine
appointments and child ED visits as a main outcome were examined in this analysis.
Understanding how parent stress affects these financial decisions of bringing the
child to the ED is needed. In a sample of children recruited in the ED, single parents were
shown to be 34% more likely to have psychological distress (measured by the 6 item
Kessler 6 scale) (Moncrief, Beck, Simmons, Huang, & Kahn, 2014). Children returning
to the ED within a year were significantly more likely to be in a single-parent household,
with this relationship driven by household income. Parent characteristics, such as marital
status, will be explored for influence on parent stress and main outcomes of asthma
symptoms and ED visits.
Controlling for exogenous variables, parent depression was found to a have a
direct effect on ED visits in an inner-city population (elementary schools from two urban
areas) (Bartlett et al., 2004). However, there were a lack of characteristics explored that
could contribute to parent stress and it’s influence on ED visits. Also, ED visits was
captured in a short 6-month time frame. The biological aspect of asthma symptoms and
the behavioral aspect of parent decision and asthma management were not explored.
Further exploration of the relationship between parent psychosocial distress and ED visits
is needed.

48
Summary
The purpose of this secondary analysis was to examine the relationship between
parent perceived stress, parent management behaviors of asthma and asthma control in
school-aged children. A summary of the gaps identified in the literature, the contributions
of this analysis and a response to a national call for research is given.
The Problem
Current asthma management by parents and clinicians nation-wide does do not
meet the national guideline recommendations. Specifically, despite advances in treatment
of asthma, children are still going to the emergency department for treatment of acute
exacerbations. Clinicians are not providing written asthma management plans (AAPs) or
performing environmental allergen teaching at optimal rates. Parents are not giving
controller corticosteroid medications to children who clinically require this treatment or
addressing adverse exposures in their home adequately. GINA emphasizes collaboration
between parents and healthcare providers for child asthma management, and recommends
parents be a part of the management care planning (Asthma., 2012). The IOM highlights
psychosocial issues as critical areas for targeted research due to their likely effect on
disease management (Medicine, 2002) (p.11). Understanding the barriers to asthma
management in inner-city families, including psychosocial factors such as psychological
distress or parent stress, is essential for the development of effective approaches to
management and treatment.
Currently the literature is limited in addressing the relationship between parent
stress of children with asthma, parent management behaviors and children’s asthma

49
outcomes. Specifically, minimal data exist that focus on diverse populations and address
barriers to child asthma management related to parent stress, especially inner-city “urban
stress”, encompassing household and neighborhood factors.
Rationale for Included Variables in Full Model
Parent Management Behaviors. Each of the parent management behaviors
examined were based on the national guideline’s recommendations for asthma
management. While these guidelines are written for healthcare provider use, examining
the educational messages related to asthma management for patients and parents of
children with asthma determined which parent management behaviors to focus on for the
analysis. The assessment and monitoring domain was measured by parents who were able
to keep routine, non-emergent healthcare appointments for their child's asthma. The
medication domain was measured by the frequency of the parents administering or
assisting their children in administering their anti-inflammatory (ICS) controller
medication. The education domain was represented by whether the parent has an AAP or
not, which is a collaborative management behavior between the healthcare provider and
the parent. The environmental domain was represented by whether the children were
exposed to passive tobacco smoke, the number of smokers in the home and number of
types of pests in the home.
Asthma knowledge, beliefs and self-efficacy. Parents do not always recognize
their role in asthma management, leading to non-adherence to recommended treatment
guidelines. Non-adherence in medication administration, regular assessment, and
controlling the home environment may demonstrate a lack of parent understanding,

50
beliefs or knowledge related to asthma and their role in asthma management. Parent
knowledge, beliefs, and self-efficacy related to medication management were examined.
Inner city challenges in this population that may affect parent management of
their child’s asthma management were explored. Specifically, the influence of
transportation, asthma knowledge, household income, environmental exposures and other
sociodemographic variables were examined related to current asthma management
literature.
Gaps in Literature
Aim 1. There were minimal child, parent and inner-city characteristics explored
or controlled for related to parent stress and parent management behavior literature
related to child asthma outcomes. Inner-city challenges related to asthma management
were explored, but were often not included in parent stress and child asthma outcomes
literature. Findings from asthma prevalence study guided the analytic methods of the
secondary analysis performed, with the inclusion of neighborhood, parent marital status
and race/ethnicity groups in the analysis of parent stress and child asthma outcomes in
children who were already diagnosed with asthma (Klinnert et al., 2008).
Aim 2a. Parent stress has been examined in qualitative literature, but there is a
lack of exploration in quantitative analyses related to what has caused the parent stress.
There is often an assumption that it is the child’s condition that causes stress in the
parents, however this is less likely in the inner-city population. However, other inner-city
influences likely affect the inner-city population’s stress levels and have yet to be
explored in this population. Several studies examining demographic challenges related to

51
parent stress, such as parent gender, education, marital status, and income. What remains
to be clarified are any differences in the type of demographic variables that influence
parent stress in the inner-city population than a moderate-income population.
A portion of the parent’s stress may be related to the child’s asthma (Hullman
2010). However, it is worth noting that this stress of parents may not influence the child’s
psychological distress, causing inflammation (Szabó et al., 2010; Wolf et al., 2008). This
secondary analysis examined child asthma severity in the parent stress model to examine
the influence of the disease on parent’s stress for parents who have children diagnosed
with asthma.
Aim 2b and 2c. Parent stress and asthma outcomes have been explored. Parent
depression had a direct effect on ED visits, controlling for exogenous variables (Bartlett
et al., 2004). The study controlled for few variables that may influence parent stress and
there was a short 6-month time period for measuring outcomes.
There is a lack of literature examining the mechanism that links parent stress to
child asthma outcomes. As Wolf (Wolf et al., 2008) (2008) and Buseke-Kirshbaum
(2009) point out, there is no indication of an association between parent stress levels and
child anxiety levels, leading to the question of whether there is a psychosocial reason for
the connection of parent stress and child outcomes. Szabo also notes that parent
psychosocial distress and child psychological functioning are not associated (Szabó et al.,
2010). A call for longitudinal studies examining the link between family functioning and
the atopic disease process in children is addressed by this analysis.

52
Aim 3. In an inner-city population of parents of children with asthma who
reported stress, number of household members was significantly associated with asthma
management (Celano et al., 2011). There is a moderate amount of literature examining
what inhibits parents from performing medication administration regularly, such as
parent depression reduces medication administration adherence (Bartlett et al., 2004).
However, there is less information on what demographic variables influence the other
management behaviors of routine healthcare appointments, home environment
management and obtaining an AAP from the healthcare provider.
Routine visits were positively associated with the parent management score
(Celano et al., 2011). However, demographic variables that influence this relationship
were not explored. Demographic variables that influence whether parents are performing
home environmental behaviors such as pest management, reducing passive smoke
exposure and smokers in the home, as well as demographic variables influencing whether
or not parents obtain an AAP, have not been examined in the literature.
Contributions of the Analyses
To address the gaps in the parent stress literature, this analysis sought to examine
relationship of financial, and environmental or social sources of stress in the parents of
children with asthma population. Also, the need to examine parent psychological distress
of stress and its influence on asthma management behaviors like medication adherence,
healthcare visits with PCP or asthma specialist, and a home environment without
negative exposures and the outcome of ED visits over a long period of one year was met
in this analysis (Celano et al., 2011). Also, determining if parent and environmental

53
characteristics explain parent stress’s role in the child’s symptoms in a population of
children with asthma, as they do for asthma prevalence, was examined (Klinnert et al.,
2008). Also, environmental variables were rarely used in the literature and were explored
in this analysis.
Specifically to the inner-city population, this study examined parent
characteristics of gender, race, marital status and household income, and their association
with parent stress, controlling for asthma severity (Celano et al., 2011; Klinnert et al.,
2008). Higher parent stress is negatively associated with medication adherence in one
inner-city population (Celano et al., 2011) and was tested in this analysis.
Minimal data exist regarding control for social and environmental factors in
studies examining the link between parent stress and child symptoms or outcomes. More
research attention devoted to measurements of neighborhood, home and parent
characteristics and designed to explore the relationship of parent stress and child asthma
control is needed, and the current study examined variables that measure these
characteristics.
Studies could not find the link between child psychological measurements and
parent psychological measurements (Szabó et al., 2010; Wolf et al., 2008), examining
other influences of parent psychological distress, including stress, on child asthma
outcomes is called for. The authors call for longitudinal studies to better understand the
link between family functioning and atopic disease processes in children. This study was
designed in part to fulfill that role.
54
A randomized control study with African American parents (98%) revealed a
relationship between lower parent stress and higher medication adherence (Celano et al.,
2011). However, a more diverse sample, including Hispanic parents, is missing. This
analysis will explore parent perceived stress’ influence on asthma management behaviors
using a diverse sample. Also, an analysis using longitudinal data is beneficial to measure
the effect of stress on management and management on asthma outcomes. This analysis
of parent perceived stress related to parent asthma management behaviors and asthma
outcomes was designed to add unique and important information central to the pathway
of influence of parent stress on child asthma outcomes in order to catalyze behaviors that
promote good health outcomes. Defining this pathway will provide insight for possible
future interventions to mitigate use of the ED for asthma care and children missing school
due to asthma symptoms, thus reducing healthcare costs and increasing academic success.

55
CHAPTER THREE
RESEARCH DESIGN AND METHODS
Longitudinal analysis of major outcomes for children with asthma is minimal, as
well as studies controlling for important mediators of parent stress in a child’s
environment—such as inner-city environment and parent management behaviors. This
secondary analysis was conducted using existing data from a prospective, correlational
study with a longitudinal design. The sample is unique, with substantial racial and ethnic
diversity from an inner-city population of school-aged children and their parents. The
methods used to test these hypotheses are discussed, including the study design, original
study description, human subjects consideration, survey instruments used, dependent and
explanatory variables included—along with transformations, and statistical methods used.
Statistical methods employed in this secondary analysis included univariate and bivariate
analyses, multivariate analyses with hierarchical regression, and generalized estimation
equations for longitudinal outcome data.
Study Design
The data for the secondary analysis is from a prospective, correlational study that
followed subjects quarterly for one year, and was conducted for five years. The analysis
uses sociodemographic, inner-city environment, parent psychosocial and management
behavior data that were measured at baseline each year, and the main outcome of interest;

56
emergent healthcare use, school absenteeism and asthma control measures, measured
quarterly each year.
The School Inner-city Asthma Study (SICAS)
The Asthma Clinical Research Center at Boston Children’s Hospital, Harvard
Medical School conducted a 5 year prospective, NIH/NIAID funded longitudinal study,
“School Inner-city Asthma Study” (SICAS) (Principal Investigator, Phipatankul)
(Phipatanakul et al., 2011). This descriptive correlational study sought to evaluate if
allergens or mold in a classroom increases the risk of asthma morbidity in inner-city
children with asthma over 1 year. The target population for the SICAS study are inner
city children who attend inner-city metropolitan schools, are between 5 and15 years old
and come from English or Spanish-speaking families. The sampling frame included
children with asthma in selected classrooms in selected schools from Spring 2008 to
Spring 2012, totaling 38 schools and 400 children over five years. The recruitment goal
was to enroll 100 students with asthma per year from 8-10 unique schools, repeated
annually for 5 years. The survey population was parents of school-aged children with
asthma from inner-city schools in a major urban area in the Northeast, United States.
The schools were selected from within an inner-city area in the Northeast by
recruitment of school principals’ participation. Convenience sampling was necessary due
to the need for principal participation, yet racially and socioeconomically heterogeneous
areas of the city were successfully recruited. Children in classrooms of participating
schools were given a screening survey for their parent’s to complete and return.
Classrooms with the highest rate of completed forms were entered into the study. The

57
students who had asthma in the classrooms were enrolled in the study and had a baseline
assessment at Children’s Hospital Boston.
Inclusion and exclusion criteria. Children were included if they were entering
grades 1-8 the following school year, attending one of the classrooms that were permitted
to have classroom environment sampling, were able to provide assent if appropriate and
guardian able to give informed consent. Also, children were required to have asthma (by
healthcare provider diagnosis) and wheezing in previous 12 months or taking daily
medicines for asthma or an unscheduled medical visit for asthma in the last year.
Children were excluded if they had significant pulmonary diseases other than asthma, had
cardiovascular disease with daily medication, were taking a beta blocker, or were unable
to follow through with study procedures (Phipatanakul et al., 2011).
Figure 2. School Inner-City Asthma Study Annual Schema
Baseline and Follow-up Data. Basic sociodemographic data were collected with
the recruitment survey. A baseline questionnaire was used to collect information from
parents on their children’s asthma symptoms, asthma control, their family’s home, time

58
outdoors, the child’s health, food allergies, asthma outcomes, medical care, medications,
adherence to asthma therapy, parents’ perceived stress, child’s sleep and television use,
and their neighborhood. Vacuumed dust samples in the child’s home were taken at
baseline. School environmental assessment with inspection surveys, school
environmental dust sampling, school fungal spore sampling, and air pollution sampling
were also performed. Follow-up assessments, which included the home environment, as
well as many questions from the original baseline questionnaire at 3, 6, 9, and 12 months
(Figure 2). The follow-up survey included information on the child’s time outdoors,
home environment, medication use, asthma symptoms, asthma control, asthma outcomes,
asthma teaching done at their last appointment, adherence to asthma therapy, the child’s
sleep and television use, and their neighborhood.
Sample. 351 children completed a baseline visit and 298 (84.9%) had at least one
follow-up visit, with 251 (71.5%) children completing all follow-up visits. The sample of
children are highly diverse, with 35% African American and 37% Hispanic, which
reflects an inner-city population. A national sample from the National Cooperative Inner-
City Asthma Study was even more ethnically diverse, with 73.5% African American and
19.5% Hispanic (Kattan et al., 1997). The public schools in the inner-city area have 36%
African American students and 40% Hispanic students (BPS, 2013), which reflects the
SICAS population racially and ethnically.
Secondary Data Analysis of SICAS
The aims of the secondary data analysis were to:

59
1. Examine characteristics of the child and parents’ home and social environments
and their associations with asthma control, urgent or emergent asthma visits and school
absenteeism.
2a. Examine which parent or child characteristics lead to higher stress in parents
of children with asthma. 2b. Examine the association of parent stress on the child’s
emergent asthma visits, school absenteeism, and asthma control. 2c. Explore the
pathways of parent stress on parent management behaviors that affect the child’s
emergent asthma visits, school absenteeism, and asthma control.
3. Examine the effects of child and parent characteristics on the parent
management behaviors performed.
Aim 1 was addressed using bivariate analyses examining the gross effects of child
and parent characteristics and the inner-city environment, looking for expected trends
noted in the literature. Multivariate regression was performed for the main outcomes of
emergent healthcare use, school absenteeism and asthma control. The coefficients of the
characteristics were examined after other relevant mediators are introduced into the
models, focusing on characteristics that are significant in explaining multiple outcomes.
Also, zero-order correlations from the correlation matrix were used to inform the
interpretation of changes in coefficients noted when new variables were stepped into the
regression models.
Aim 2 similarly was addressed using bivariate analyses and multivariate analyses
linking characteristics and mediators with main outcomes. Specifically, aim 2a was
examined using bivariate analyses between characteristics and parent stress, and a logistic

60
regression model examining characteristics’ effects on parent stress as the main outcome.
Aim 2b. Bivariate analyses between parent stress and the main outcomes were performed,
as well as examining the effect of parent stress on the main outcomes in the regression
models. Aim 2c. Bivariate analyses between parent stress and parent management
behaviors, as well as between parent management behaviors and the main outcomes, was
performed. Multivariate tables including parent characteristics, management behaviors
and main outcomes were added for clarification on variables of interest. Multivariate
hierarchical regression models using GEE (cluster analysis model) were performed for
the main outcomes, and the interaction between variables were examined as they were
stepped in by the researcher—with zero-order correlations assisting in their interpretation.
Aim 3 parent management behaviors were examined as the main outcomes in
logistic regression models using baseline data only, with relevant parent and child
characteristics tested for significance. Characteristics that affected multiple outcomes
significantly were examined further.
Path Model
It was hypothesized that parent perceived stress affects parent management
behaviors, which influences the child’s asthma control and then their emergent healthcare
use or school attendance (Figure 3).

61
Figure 3. Conceptual-Theoretical-Empirical Model Linked with Path Model
Exogenous variables. The exogenous variables of child and parent characteristics
are on the left side of the diagram. Even though there are no relationships shown between
these variables for the path model, reciprocal influences may exist. However, they are

62
likely not influenced by any of the endogenous variables in the model. The relationships
between the exogenous variables in affecting the main outcomes are explored more in
Aim 1.
Parent stress. Parent stress is hypothesized to be positively associated with
parents who are not married, have >5 people in the home and who take public
transportation. These variables represent an inner-city environment, which includes less
social support due to single parent marital status, possible increased responsibility at
home with a higher number of children or adults in home, and inconvenience and
unpredictability in with public transportation. Parent stress is likely negatively associated
with parent income and education, with parents who have graduated high school and
those who have regular employment or an annual household income greater than 25K
have greater financial stability with a predicted lower stress level.
Asthma severity. Child characteristics are hypothesized to be positively
associated with asthma severity. Children who are older are more likely to be diagnosed
with asthma and have received an inhaler, with their asthma severity more likely to be
determined. Children who are minorities are more likely to have higher asthma severity.
As Medicaid insurance can be a proxy for socioeconomic status, children who are
covered by this insurance may also be more likely to have higher asthma severity.
Medication adherence. Parent stress is likely negatively associated with
medication adherence, as parents who feel they have less control in their lives may be
less likely to prioritize administering their child’s medication regularly as high of a
priority as other life concerns. Asthma severity is positively associated with medication

63
adherence, as children with higher severity are more likely to have been prescribed and
given more medications and teaching related to the importance of medication adherence,
whether in the emergency or routine healthcare setting. Missing an appointment is
negatively associated with medication administration, since parents who go to their
child’s routine appointments are more likely to have been taught about the necessity of
medications in controlling their child’s condition, had their medications updated based on
the assessment done at the appointment and given a new prescription. Also, parents who
go to a routine appointment are more likely to receive an asthma action plan, which
discusses they type, dose and frequency of medication administration that is necessary,
increasing the likelihood of a parent administering their child’s medication regularly.
Assessment and monitoring. Parent stress is likely positively associated with
missing routine appointments, with parents who feel that they have less control over their
lives have made other needs take priority in their schedule or have a less flexible
schedule that inhibits them attend a routine visit for their child’s asthma.
Education. Missing healthcare appointments is hypothesized to have a negative
association with having an AAP. Parents who do not make it to appointments are less
likely to have an AAP due to less exposure to healthcare professionals that may provide
treatment support for parent management of their child’s asthma. There is no direct
relationship hypothesized between parent stress and having an AAP due to the shared
responsibility with the healthcare provider.
Home environment. Parent stress is likely positively associated with a negative
home environment, including pests in the home, smokers in the home and passive smoke

64
exposure. Parents who are stressed likely do not make additional effort to remove
negative exposures due to other concerns that are prioritized. Employment and education
are negatively associated with negative household exposures because of the likelihood of
living in a residence that potentially newer, well maintained, or managed well, that is
more likely to be pest free. Also, financial strain has been shown to lead to increased
smoke exposure, so a higher income may lead to a lower likelihood of smokers in the
home or passive smoke exposure. The relationship between housing type and negative
exposures is unclear, as parents who live in an apartment building may be more likely to
have pest infestation due to the size of the building structure, yet maintenance by the
owner may take care of pests, while pest exposure in a house may more likely be related
to parent actions. Parents who are not married or have more people in the home are
positively associated with a negative home environment, as parents who are single have
less support at home to make changes at home related to reduce pests, and those with
more people in the home are more likely to a person who smokes (and more chaos in the
home to keep certain places clean in order to prevent pests). Parents and children who are
more likely to take public transportation are less likely to be able to afford good housing
and may be a more specific type of socioeconomic variable, which likely had a negative
association with negative household exposures. Season is positively associated with pests,
as pests are more likely to vary depending on the time of year, with warmer seasons
increasing the likelihood of pests in homes.
Main outcomes of ED visits and school absenteeism. The probability of an ED
visit is positively associated with parent stress. When parents who perceived themselves

65
has having less control in their lives are less likely to notice problems in their child’s
asthma until it needs to be addressed in an emergent way, due to the severity of the
child’s symptoms. Other priorities may distract parents from being able to proactively
monitor their child’s symptoms, or perform any of the preventive management behaviors.
A direct, positive association between parent stress and the main outcome of ED visits is
predicted due to the convenience of emergency departments being accessible any time of
day, without any scheduling or planning required. Having a negative home environment
is positively associated with main outcomes of ED visits and missed school due to the
child having an inflammatory response and asthma symptoms due to the exposures in the
home, increasing the likelihood of the necessity of emergent healthcare use or children
staying home from school due to these symptoms. Medication administration is
negatively associated with going to the ED or missing school, as parents who administer
their child’s medication regularly decrease the inflammatory response in their child’s
body, which reduces likelihood of severe symptoms necessitating going to the ED or
missing school. Parents who miss appointments related to their child’s asthma are less
likely to have an accurate assessment of their child’s symptoms or up to date medications
that effectively control their child’s inflammatory processes in their body, increasing the
likelihood of severe asthma symptoms that necessitate going to the ED or missing school.
Transportation has a direct negative association with ED visits, as people who
walk or take public transportation are less likely to go to the ED or miss school than those
who have a car because of the greater difficulty getting to the ED in terms of time and

66
feasibility of exertion of a child with severe asthma symptoms or of picking children up
from school if they are sick.
Main outcomes of asthma control. Asthma control is a positive outcome, where
the relationships between parent management behaviors related to medication
administration, missing appointments and home environment have the opposite sign of
association than they did when associated with negative outcomes of ED visits or school
absenteeism. Living in a well-maintained neighborhood has a positive relationship with
asthma control, as having less negative exposures such as poor buildings and or feeling
unsafe likely reduces more poor environmental exposures or urban stress that has a
negative effect on asthma control. Lastly, parent stress does not have a direct link with
asthma control, as its influence is hypothesized to work through parent management
behaviors.
Human Subjects Considerations
The Children’s Hospital, Boston, and the Brigham and Women’s Hospital
Investigational Review Board approved the SICAS study. The Research, Assessment,
and Evaluation Division and Facilities Management Department of the Boston Public
Schools also approved the SICAS study. The investigator was added to the study through
successfully submitting an amendment to the Children’s Hospital, Boston, and the
Brigham and Women’s Hospital Investigational Review Board. The University of
Massachusetts Boston’s Institutional Review Board granted an exemption for the analysis.

67
Measurement Instruments
A conceptual-theoretical-empirical structure was created for self-management
behaviors related to parents of children with asthma (Figure 1). Empirical methods to
measure the concepts of antecedents to management behaviors, management behaviors
and consequences of management behaviors were selected. Antecedents to management
behaviors for parents of children with asthma was identified as demographic
characteristics of the sample, parent perceived stress of parents, and parent asthma
knowledge questions, which are captured using the SICAS baseline questionnaire items
and the Perceived Stress Scale (PSS) (S. Cohen et al., 1983). Management behaviors
specific to parents of children with asthma were identified in the literature and were
captured throughout the SICAS baseline and follow-up questionnaires. Consequences of
management behaviors include asthma control and the asthma-related outcomes of ED
visits and missed school. These were captured using the control section of the Asthma
Therapy Assessment Questionnaire (ATAQ) (Skinner et al., 2004), using the NAEPP
guidelines for control (Program, 2007) and outcome-related questions in the SICAS
baseline and follow-up questionnaires.
Demographics
Demographic variables were ascertained from the baseline questionnaire (Table 2).
Child characteristics include the child’s age, gender, race or ethnic group, health
insurance, and asthma severity. The child’s age is a continuous measure of number of
years old, converted from the child’s date of birth given at baseline. For description of the
sample and bivariate analysis, the child age variable was made dichotomous, “0” are

68
children ages 4 to 6 for children who are not school-aged and “1” are children ages 7 to
13, who are school-aged. Child gender is dichotomous, with “0” as male and “1” as
female. Child race originally had seven categories including White, Black, Hispanic,
Haitian/Creole, Asian, Native American, Mixed, Other, which was reduced to four
categories due to a low response rate in four categories (Haitian/Creole, Asian, Native
American and other), which were added to the “Mixed” category. During descriptive
analysis, it was found the African American, Hispanic, and other categories had similar
rates to each other (acting similarly in multivariate analysis as well), so these were added
to become a “minority” category and the White category was kept as the reference group.
The child’s health insurance name was recorded and were categorized into fiver groups,
including Managed care, Medicaid, Medicaid Managed care, Private (employer) and
cannot be determined. Isolating Medicaid and Medicaid managed care to determine if this
population and its asthma care are any different from those with other types of insurance,
these two categories were combined and the other categories were combined to become
the reference group.
Asthma severity. Parents were also asked to bring in their asthma medications to
the baseline visit with a monetary incentive, where staff at baseline wrote down the
names of the medications brought. These include "Aerobid", "Advair", "Budesonide",
"Pulmicort", "Asmanex", "Flovent", "Fluticasone", and "Fluticasone Proponate". The
variable for having ICS in hand was created by someone on the team putting a “1” for if
they brought an inhaler that was an ICS (and not a rescue inhaler) and a “0” if the parent
did not. Both of these variables can be seen as severity measures, as the child has been

69
prescribed an ICS inhaler or the parent has an ICS inhaler with them shows their need to
be taking medication as a reflection of their past symptoms being determined as moderate
to severe by a healthcare provider who wrote the prescription. Children without ICS
inhalers commonly have intermittent asthma that do not require ICS medication
administration everyday, were not determined as having moderate to severe asthma by a
healthcare provider yet or parents do not remember the child ever having this prescription.
Parent characteristics obtained at baseline were gender, race or ethnicity,
education, household employment, household income, parent perceived stress, housing,
neighborhood, marital status, people living together in the home, adults living in the
home, children living in the home, transportation. Parent gender was kept dichotomous,
with “0” as male and “1” as female. Parent race was categorized the same as child race
for the same reasons. Parent education was originally a continuous variable, ranging from
0 to 16 for the highest number of years in school of either the head of the household or
themselves, selecting the highest number of years. This variable was then made
dichotomous, with “0” as <12 years and representing did not graduate high school, and
“1” as >= 12 years, representing graduating high school or having a GED. Household
employment was originally asked as the number of people in the household with a paying
job and this continuous variable was made dichotomous by keeping “0” as no one and “1”
as >=1 adult with a paying job in the household. Household income was asked
categorically, with 10 categories each having a $10K range, starting at “<$15,000” and
ending at “> $95,000”. For descriptive purposes, this variable was made dichotomous by
the 50th percentile, with one half of the households making <$25K as “0” and the other

70
half >=$25K as “1”. During multivariate analysis it was noted that the employment and
income variables had very similar coefficients and it was decided to combine these two
variables by making a dichotomous variable of “1” as employed or income >=$25K, and
“0” with unemployed and income <$25K.
Parents were asked what type of house the child lives in, with five categories. Three
categories were related to houses, one was apartment building and one as “other”. A
dichotomous variable was constructed for descriptive purposes, with “0” combining the
three house categories and “1” combining the apartment and other categories. Parent’s
agreement of whether or not their neighborhood’s homes were well maintained had four
categorical options with “definitely yes”, “mainly yes”, “mainly no” and “definitely no”,
which were transformed into a dichotomous variable of “0” yes and “1” no.
Transportation was asked about how the child gets to school, with six categories;
personal car, city bus, school bus, subway, walk and other. For descriptive purposes this
variable was made dichotomous, with “0” as personal car and the other categories as “1”
which is largely comprised as the school bus and walk categories. “0” is thought of as an
easily accessible mode of transportation for the child and family, and “1” is considered
public transportation or walking. Parent marital status originally had five categories of
married, divorced, single, widowed, separated and other. This was made dichotomous
with “0” as married and “1” with all the other categories, the majority being single. The
first iteration of this variable was made categorical with “0”married “1” single and “2”
other with all other categories, “1” and “2” had very similar coefficients in the
multivariate analysis and were combined. The number of people in the home was

71
originally continuous, ranging from 2 to 12. Several dichotomous variations of this
variable were tried, with a final selection of “0” as <=4 and “1” >4 with “0” more likely
being a traditional nuclear family and “1” with more adults or children in the home.
Similarly, the number of children in the home and the number of adults in the home were
also asked with a continuous number and both variables were made dichotomous, with “0”
being one person and “1” being two or more people for each variable.
Season. Season adjusts for seasonal allergens and rhinoviruses. While it is not
commonly adjusted for in the literature, it effects the child’s symptoms related to asthma,
and was controlled for in another pediatric inner-city asthma study (Busse et al., 2011).
The four season variables are for a restricted cubic spline of days since school started, all
of them together adjusting for season. The restricted spline requires all four variables and
is applicable to baseline and all follow-up observations.
Parent Stress using the Parents’ Perceived Stress Scale
Parent stress was ascertained on the baseline questionnaire using the 4-item
Perceived Stress Scale (PSS4) (Table 3).
The instrument. The Perceived Stress Score has demonstrated in prior research
adequate reliability (Chronbach’s alpha= 0.88) and validity (Sheldon Cohen, 1988). The
PSS has been used in school-aged children, young adults with asthma, adults with asthma
and parents of infants (Kimura, Yokoyama, Kohno, Nakamura, & Eboshida, 2009; Milam
et al., 2008; Wisnivesky, Lorenzo, Feldman, Leventhal, & Halm, 2010; Wright, Cohen,
Carey, Weiss, & Gold, 2002). Parent perceived stress, measured by the PSS, of 496
parents of infants at 2-3 months predicted wheeze at 14 months of life (Wright et al.,

72
2002). A Japanese version of the PSS (JPSS) was used in 695 young adults ages 20-44
years old, and did not correlate with asthma severity, but did show a strong association
with a mental component of a health survey (SF-8) and moderate correlation with quality
of life (AQ20) (Kimura et al., 2009). 326 inner-city adults with asthma who had high
stress measured by the PSS also had worse asthma control (ACQ), quality of life related
to asthma (AQLQ) and medication adherence (MARS) (Wisnivesky et al., 2010).
A four-item Perceived Stress Scale (PSS4) has been used in a population of
children ages 5-7 and was significantly associated with wheezing in school-aged children
(Milam et al., 2008). Validation for both the four-item and fourteen-item scales were
done when they were created, with a population of college students for the fourteen-item
scale and tobacco cessation participants for the four-item scale (S. Cohen et al., 1983).
The four-item scale has been validated on a low literacy adult population with asthma
(Sharp, Kimmel, Kee, Saltoun, & Chang, 2007) and used with parents of children with
asthma (Islam et al., 2011).
This analysis. The four-item Perceived Stress Scale (PSS4) was used at baseline in
the whole sample of children enrolled in the SICAS study. The four questions are related
to how the parents feel they are in control of things in their life, their feelings of
confidence in handling problems, their feeling of whether things were going their way or
not and their feelings about their ability to overcome difficulties (Table 3). The four-item
scale consists of Likert-scale items with a 5 number range, with a score from 0 to 4.
Questions two and three are reverse coded because their score has a negative relationship
with stress, making all questions unilaterally measure stress. A sum of the item scores

73
creates a composite score ranging from 0 to 16, with 0 being no stress and 16 being the
highest stress. Islam and colleagues dichotomized the score, with less than or equal to 4
being low stress and greater than 4 as high stress (Islam et al., 2011). Similarly,
dichotomizing the score for descriptive purposes was done (Table 15).
SICAS Parent Management Questions
Questions related to parent management of their child’s asthma are present
throughout the baseline and follow-up questionnaires, including environmental
management (Table 4), medication management (Table 5), assessment and monitoring
management (Table 6), and education management (Table 7). .
Environmental Management
Parent management of the home environment has three components, including
passive smoke exposure, number of smokers in the home and pests in the home (Table 4).
Cigarette smoke is a well-known trigger for asthma attacks. Passive smoke exposure for
the child was rated using five categories of how frequently the child is around people
who smoke, including never, rarely, several times a month, several times a week and
daily. This variable was made dichotomous, with never or rarely being “0” and several
times a month to daily being “1”.
The number of people who smoke in the child’s house is an indicator of how much
smoke is present in the child’s home environment, whether the child is present while
someone is smoking in the home or is exposed to the smoke allergen on the objects inside
the home measures the child’s exposure in the home. This continuous variable was made
dicohotomous with “0” being no smokers” and “1” having at least one smoker living in

74
the home after more than one smoker’s coefficients were not very different from having
only one smoker. Pests in the home are triggers for asthma. Parents were asked what
pests were in the home, including mice or rats, cockroaches, lady bugs and bed bugs,
with “0” being none and “1” being “present” for each type of pest. Then the types of
pests were added together for a continuous variable of types of pests in the home, ranging
from 0 to 4. For descriptive purposes this variable was made dichotomous, with “0” as no
pests and “1” at least one type of pest in the home.
Medication Management
Giving the child preventive medication like an ICS inhaler is used to help control
the child’s asthma. Whether the child has an ICS prescription or not and whether parents
administer their child’s ICS medication were determined as a part of medication
management (Table 5).
Parents were asked if the child was ever prescribed ICS at baseline, with a
dichotomous option of “0” no and “1” yes. Parents were then asked if the child takes the
medication now, with five categories of “never takes it”, “only takes it when having
symptoms”, “used to take it, but not now”, “takes it some days, but not other days” and
“takes it everyday”. This variable was made dichotomous with children who take ICS
everyday or somedays as “1”, which is seen as having medication adherence, and
children who take it only with symptoms or not at all as”0” as non-adherent to their ICS
medication.
Assessment and Monitoring Management
The assessment and monitoring management question is related to consistent

75
follow-up related to the child’s asthma. While healthcare providers monitor the children’s
asthma, parents have a role in getting their child there for their visits. Parents were asked
if they had any problems with getting to an appointment, either related to transportation
or inconvenient clinic hours open, and if it was because of these problems they missed
the appointment (Table 6). This was a dichotomous variables, with “0” no skipping
appointments and “1” as skipped appointments.
Educational Management
The education domain is related to parents receiving asthma education. While this
may be thought of as the provider’s role toward the parent, it is a shared responsibility to
have an asthma action plan in place. The healthcare provider should initiate and the
parent can choose to use it or ask for an updated version with treatment changes. There is
also a role for the parent to be attentive during the visit and solicit a need for teaching.
Parents were asked whether or not they have been given separate written instructions to
use to assist with their child’s asthma symptoms, with a dichotomous score of “1” yes
and “0” no (Table 7).
Antecedents of Parent Asthma Knowledge and Self-efficacy
Several individual questions originally from the Asthma Therapy Assessment
Questionnaire (ATAQ) were asked related to asthma knowledge (Table 8). Parent
knowledge about asthma was determined by asking if they believe the child’s
medications can control their asthma, assessing whether parents understand the function
of asthma medications (K8). Parents who do not think so or are not sure likely do not
fully understand the role of the child’s asthma medication. If a parent said “no” or was

76
unsure, they were categorized as “0” for not knowledgeable and those who thought the
statement was true was categorized as “1” for knowledgeable. The ATAQ instrument
scores these questions in this way, placing “unsure” with “no”.
Lack of self-efficacy. Self-efficacy is a belief in what you are able to do makes a
difference in the intended goal. Merriam-Webster’s definition is “the power to produce a
desired result or effect” (2015). Parents are asked if they feel that asthma medications do
not really work (L8), with “1” as yes and “0” as no. Parent answer the question related to
their belief that the medications they give their children will produce the desired effect of
controlling their child’s asthma symptoms. In other words, the question examines
whether parents have self-efficacy related to the medication management their child is
receiving. If a parent answers “yes”, they are lacking the self-efficacy to help control
their child’s asthma with the medications they are given.
Lack of asthma knowledge. Parents who admitted to believing their child was
“all better” before finishing the prescription by agreeing yes “1” or disagreeing with no
“0” likely show a lack of knowledge about asthma medications (L7). ICS medications
need to be given regardless of symptoms and rescue medications are given only if the
child has symptoms. Any steroids given should not be stopped until the prescription is
done. So, parents who feel that their child’s medication is only for symptoms may be
more at risk for not giving the child their ICS medications regularly.
School’s Role in Asthma Management
At baseline, parents were asked if their child had any problems at school with
having their medication administered, with “1” as an answer of yes and “0” as no (Table

77
9).
Emergency Visits for Asthma (ED Visits)
ED visits, or unscheduled visits for asthma, were asked at baseline and all follow-
up time periods, and ascertained by asking parents several consecutive questions (Table
10). These include if parents went for a medical visit for their child in the last year
(baseline) or the last 3 months (follow-up), the reason for the visit (six categories,
including asthma, pneumonia, respiratory/lung function, influenza, anaphylaxis or other)
and if the visit was scheduled at least 24 hours before the appointment to discern whether
it was scheduled/non-emergent or unscheduled/emergent (Table 8). If a child did have a
visit related to asthma, then the continuous data remained the same as the scheduled
question variable for an “unscheduled asthma visit,” and a “scheduled asthma visit" or
"other type of visit" or an "unscheduled other type of visit” as “0”. This variable was
made dichotomous, with at least one “unscheduled asthma visit” as a “1” and other as “0”.
For descriptive univariate and bivariate analysis which use the number of children
enrolled at baseline, a maximum unscheduled asthma visit variable was created with
children who have ever had an unscheduled asthma visit, or “ED visit”, during baseline
or follow-up and giving them a “1”, while children who never had an ED visit during
baseline or follow-up were kept as “0”. In the multivariate analyses, ED visit was kept
dichotomous with variation in baseline and all follow-up periods.
Asthma Control with the Asthma Therapy Assessment Questionnaire
The instrument. The Asthma Therapy Assessment Questionnaire (ATAQ) is a
previously validated tool that measures children’s control and management by clinicians

78
in order to identify children at risk for adverse outcomes (Skinner et al., 2004). Skinner
and colleagues (2004) performed a tool validation study for the ATAQ using 434 parents
of children with asthma recruited from three managed care organizations. The children
with asthma were primarily male and Caucasian sample with worsening asthma in the
last 6 months. Asthma control was significantly associated with measures of physical
health, psychosocial health, resource use and family impact. Shared decision making
(related to HCP and management plans) was shown to be significantly associated with
symptoms and parental satisfaction. Internal consistency and construct validity were
shown. Some limitations to this study were a cross-sectional sample and a low response
rate (49%).
This analysis. The ATAQ control section was ascertained in baseline and all
follow-up time periods (Table 11). The control section of the ATAQ indicates the amount
of asthma control within the last 4 weeks. It includes seven questions about symptoms
and consequences of asthma. Five questions related to symptoms, missed school, and
daily activity interference are dichotomized, with a score of 0 or 1. Two questions related
to parent’s perception of asthma control and quick-acting medication use have a 5 point
scale, but are scored dichotomously with a 0 or 1. The scores are then summed for a total
score ranging from 0 to 7, with typically 0 indicating no control problems and 7
indicating all 7 control problems (Skinner 2004). However, for this analysis, the score
was coded so that 0 indicated control problems and 7 indicates no control problems, or
“asthma control”. Diette and colleague’s scores categorized as 0 (0: no control problems),
1 (1-3: those who did not have composite hospitalization, ED/urgent care visit or doctor

79
visit), and 2 (4-7: those who did have one of those unscheduled visits) (Diette 2009).
Total scores have been categorized in this study to reflect Diette’s categories in reverse
order, with 0 (0-3: those who did have one of those unscheduled visits), 1 (4-6: those who
did not have composite hospitalization, ED/urgent care visit or doctor visit), and 2 is (7:
no control problems). Similarly, this analysis has categorized the ATAQ control score in
this way for descriptive purposes, yet with the largest number indicating no control
problems (2) and the smallest value (0) indicating control problems (Table 15).
For descriptive univariate and bivariate analysis, which uses the number of children
enrolled at baseline, a minimum asthma control variable was created. The child’s lowest
asthma control score in either baseline or any of the follow-up periods was kept, for
comparison with other variables. Since 350 of the 351 fit the two lowest categories of
asthma control, the one student was dropped and the variable with “0” as very
uncontrolled asthma and “1” of “uncontrolled asthma” was kept these analysis. For the
multivariate analyses, asthma control was kept as categorical, with variation possible in
the baseline and all follow-up periods.
Alternative Measure of Asthma Control Using National Guidelines
The National Heart, Lung, and Blood, Institute, along with the National Asthma
Education and Prevention Program, has developed their own guidelines on what
constitutes asthma control (Table 12) (Program, 2007). Accordingly, asthma control takes
into account patient’s symptoms, nighttime awakenings, interference with normal activity,
short-acting beta2-agonist (SABA) use for symptom control, and lung function measured
by FEV1 and/or FVC. Children ages 5-11 have well-controlled asthma with symptoms

80
<= 2 days per week, nighttime awakenings <= once per month, no interference with
normal activity and SABA use <= 2 days per week (Program, 2007). Children ages 5-11
have not well-controlled asthma or very poorly controlled asthma with more frequent
symptoms, nighttime awakenings, interference with activity or SABA use (Program,
2007). The variables of symptoms days, night symptoms, activity limitation and short
acting bronchodilator (SABA) use were used to develop a composite score of asthma
control using these guidelines (Table 13). The score places children in three categories,
depending on their degree of symptoms and SABA use, including well controlled asthma
(2), not well controlled asthma (1) and poorly controlled asthma (0). A minimum asthma
control score was created for univariate and bivariate analyses, similarly to the ATAQ
Control variable, yet all three categories were maintained.
Another measure with maximum number of days a child has had symptoms in the
last 2 weeks was examined (Table 13B). Three questions related whether a child was
wheezing, had limited activity and waking up because of symptoms, was asked of the
parents, with an expected continuous answer of number of days child had experienced
each in the last 2 weeks. Combining the maximum number of days a child has
experienced symptoms made a continuous score.
School Absenteeism for Asthma
Missed school days due to asthma are measured by a continuous scale at baseline
and all follow-up time periods (Table 14). Missed school days was also dichotomized
into 0 for no missed school and 1 for any missed school due to asthma in the last 3
months for descriptive purposes as well. For descriptive univariate and bivariate analysis,

81
which use the number of children enrolled at baseline, a maximum school days missed
variable was created with children who have ever missed school days related to asthma
during baseline or follow-up and categorized them a “1”, while children who never
missed school for asthma during baseline or follow-up were kept as “0”. In the
multivariate analyses, missed school was kept dichotomous with variation possible in
baseline and all follow-up periods.
Statistical Methods
All data were analyzed using STATA 12.1.
Univariate and bivariate analyses
Descriptive statistics were used to describe parent and child characteristics,
including the child’s age, child’s gender, parent gender, child’s race, income, and health
insurance. Each variable was tested for distribution and possible errors. Secondly,
pairwise correlations were computed to explore associations between exogenous
variables and parent management behaviors. Parents who skip their child’s asthma
appointments, who have an ICS inhaler in hand, and administer their child’s ICS inhaler
some days or everyday were described related to their asthma knowledge variables and
parent perceived stress with pairwise correlations. Environmental management variables
of people smoking in the home, the child exposed to passive smoke and pests present in
the home were also described using pairwise correlations with housing and neighborhood
variables. Pairwise correlations between independent variables (endogenous and
exogenous) and the outcomes of interest, including ED visits, missed school and asthma
control were computed to examine if significant existed. Sensitivity analysis was

82
performed with several independent categorical variables to isolate the most meaningful
categorical grouping. Lastly, a correlation matrix was computed to further guide the
univariate and bivariate comparisons made and the multivariate analyses.
Multivariate Analyses of Longitudinal Panel (Cohort) Data Analysis
The primary outcome in the multivariate analyses was ED visits, with secondary
outcomes of asthma control and school absenteeism due to asthma. Due to the repeated
measures on the same subjects, Generalized Estimation Equations (GEE) were used for
analysis of the full dataset, with baseline and all follow-up data. The unit of analysis in
these models was child per quarter, as each subject has 4 time points of follow-up data
collected every 3 months (four time periods, five points of data collection with baseline
and 4 follow-ups). For models with main outcomes that were “unrepeated” in nature,
such as parent stress, logistic regression was performed using baseline data.
For a longitudinal analysis, data needs to be oriented in a cross-sectional nature,
with a large number of patients and few time points. Ideally, there is a balanced sample of
all patients in all periods. However, patients may not complete all follow-up time points,
so this is not true for every patient. Patient heterogeneity dominates the estimation of
relationships, however the degrees of freedom will be reduced based on the variability of
the relationships between variables. The equation below shows the repeated t waves of
inputs with separate αi functions, with i-shifts constant
Pb[ED visit]it = αi + βZi + φ parent stressi + εit
Fixed effects are given αi for each patient unique shift in Yit. Least squares dummy
variables (LSDV) that are established with ordinary least squares (OLS) are an

83
unbalanced option. F test to see if the variance of two populations is equal between
simple variables (LSDV R2 (0-1,281)) is not ideal. We do not have fixed effects.
Random effects assume that patients are a random sample of a larger population.
Yit = α + βACit + υi + εit : Σ[υi] = 0; Σ[υi2] = συ2
Pb[ED visit]it = αi + βZi + φ parent stressi + εit : Σ[φ parent stressi] = 0;
Σ[φ parent stressi 2] = σ φ parent stress
2
Random effects assume random drawing and pooled data. Random effects are done in
STATA using mixed-random modeling, which takes into account repeated waves. Using
random effects for this analysis is beneficial because it preserves degrees of freedom.
Generalized Estimation Equations
Generalized Estimation Equations (GEE) is a method of estimation of regression
model parameters for correlated data, and are used for analyzing clustered longitudinal
data. As this secondary analysis used data of subjects over time, clustering the data of
each child is necessary. In other words, each child is an independent cluster, with
multiple observations over time on one child (Shults, Ratcliffe, & Leonard, 2007). GEE
is from the generalized linear models family, where linear, logistic and Poisson
regression, which have a link function that characterizes the relationship of the mean
response to covariates and the specification of a variance function that relates the
variance of the outcomes as a function of the mean.
Hierarchical Regression
Hierarchical regression was performed to explain the primary and secondary
outcomes, as well as parent management behaviors. For the main outcomes of emergent

84
asthma visits, school absenteeism, and asthma control, exogenous and endogenous
variables were stepped into the models in the same order.
Main Outcome Model Steps
1. Pb[ED visit1]it = αi + βZi2 + εit
Exogenous variables are stepped in, including parent and child characteristics and season
variables. The neighborhood variable is stepped in the asthma control model due to its
possible association.
2. Pb[ED visit]it = αi + βZi + φ parent stressi + εit
Parent stress is stepped in.
3. Pb[ED visit]it = αi + βZi + φ parent stressi + θ asthma severity/treatmenti + εit
Child asthma severity measured by prescribed ICS treatment and currently have an ICS
inhaler.
4. Pb[ED visit]it = αi + βZi + φ parent stressi + θ asthma severity/treatmenti + δ
medication administration behaviorit + εit
Asthma severity variables were stepped in separately from the medication parent
management behavior to isolate the impact of regular ICS administration on the main
outcome.
5. Pb[ED visit]it = αi + βZi + φ parent stressi + θ asthma severity/treatmenti + δ
medication administration behaviorit + κ environment behaviorsit3 + εit
1 can be substituted for other main outcomes of school absenteeism or asthma control 2 Z= exogenous variables (child and parent characteristics, season) 3 The variable of smokers in the home does not have repeated waves.

85
Environmental behaviors of pests in the home, smokers in the home and passive smoke
exposure are stepped in.
6. Pb[ED visit]it = αi + βZi + φ parent stressi + θ asthma severity/treatmenti + δ
medication administration behaviorit + κ environment behaviorsit + ρ assessment
behaviori + εit
The negative parent assessment and monitoring behavior of the missing their child’s
asthma appointment is stepped in.
7. Pb[ED visit]it = αi + βZi + φ parent stressi + θ asthma severity/treatmenti + δ
medication administration behaviorit + κ environment behaviorsit + ρ assessment
behaviori + σ educational behavior + εit
The educational behavior of the asthma action plan is a collaborative behavior of both
healthcare providers and parents. This behavior is added to the model last in order to
examine the model in the previous step with parent-initiated behaviors only, without any
additional effect of a healthcare provider behavior in order to isolate the effect of parent
only behaviors on the main outcome.
Aims 1 and 2 Path Models for Main Outcomes

86
Figure 4. Path Model for Main Outcomes of ED Visits and School Absenteeism
Pb[ED visit or school absenteeism]it = αi + βZi + φ parent stressi + θ asthma
severity/treatmenti + δ medication administration behaviorit + κ environment behaviorsit +
ρ assessment behaviori + σ educational behaviori + φ asthma knowledgei + ψ asthma
controlit + εit
Figure 5. Path Model for Main Outcome of Child Asthma Control

87
Pb[asthma control]it = αi + βZi + φ parent stressi + θ asthma severity/treatmenti + δ
medication administration behaviorit + κ environment behaviorsit + ρ assessment
behaviori + σ educational behaviori + φ asthma knowledgei + εit
Aim 2a Path Model for Parent Stress
Figure 6. Parent Stress Model Path Diagram
Pb[Parent stress]i = αi + βZi + φ asthma knowledgei + εit
Aim 3 Path Models for Parent Management Behaviors
Parent medication administration behavior.
Figure 7. Parent Medication Administration Behavior Model Path Diagram
Pb[medication administration behavior]it = αi + βZi + φ parent stressi + θ asthma
severity/treatmenti + κ environment behaviorsit + ρ assessment behaviori + σ educational
behaviori + φ asthma knowledgei + εit

88
Parent environmental behavior.
Figure 8. Parent Environment Behavior Model Path Diagram
Pb[environment behaviors]it = αi + βZi + φ parent stressi + εit
Parent assessment & monitoring behavior.
Figure 9. Parent Assessment & Monitoring Behavior Model Path Diagram
Pb[assessment behavior]i = αi + βZi + φ parent stressi + θ asthma severity/treatmenti + φ
asthma knowledgei + εit

89
Parent educational behavior.
Figure 10. Parent Education Behavior Model Path Diagram
Pb[educational behavior]it = αi + βZi + φ parent stressi + θ asthma severity/treatmenti + ρ
assessment behaviori + φ asthma knowledgei + εit

90
CHAPTER FOUR
STUDY RESULTS
Descriptive Results
Sample Description
Child characteristics. 351 school-aged children and their parents completed a
baseline visit and 335 (95.4%) had at least one follow-up phone call, with 251 (71.5%)
parents completing all follow-up phone calls. The mean age of the children was 7.9 years
(1.9 SD), ranging from 4 to 13 years. The sample of children are highly diverse, with
34% (N=120) African American and 38% (N=133) Hispanic children, 4% (N=15)
Caucasian children and 24% (N=83) other races, which reflects an inner-city population.
Most children are on Medicaid or Medicaid Managed Care health insurance (N=255/342,
74.6%). When looking at a child’s lowest score of asthma control using the ATAQ
instrument from baseline and all follow-up periods, only one child had no control
problems, with 59% (N=208/350) having uncontrolled asthma and 40% (N=142/350)
having very uncontrolled asthma. Also, only 19.7% (N=69) had well controlled asthma,
measured using the NAEPP guidelines. However, only 62.2% (N=217) of parents
reported their children were ever prescribed an ICS inhaler to control their asthma. This
reveals at least 18.1% of children with asthma who currently have uncontrolled asthma

91
but have never been prescribed an ICS inhaler ((1-.622)-.197= .181). 47.7% (N=165) of
the children went to the ED or urgent care due to their asthma and 65.5% (N=230) missed
school due to asthma at baseline or during the year of the study.
Parent characteristics. The majority of parents are mothers (N=337, 97.6%),
minorities (N=327, 93.4%) and have completed high school (N=284, 80.9%) (Table 17).
Most households have an annual income of less than $45,000 (N=212, 73.1%), half are
less than $25,000 (N=145, 50.0%) and 23.1% (N=81) do not have someone in their
household employed in a regular job and have less than $25,000 per year of annual
income. Many parents reported moderate to high levels of stress (N=223, 63.5%), with a
PSS score of five or greater. Most parents are unmarried (N=246, 70.1%), but live in a
house (N=218, 62.3%), have more than 2 adults living in their home (N=223, 63.5%),
and more than 2 children living in their home (N=284, 80.9%). It is unknown whether the
adults in the home are intergenerational family members or partners, where there may be
more variation in the families than the traditional nuclear family. Some parents report the
houses in their neighborhood are not well maintained (N=68, 20.9%). The majority of
children walk, ride a bike or take public transportation to school (N=239, 68.1%), with
the rest of parents using a personal car to drop off their children. Environment exposures
at home include tobacco smoke exposure and pest allergens for a moderate number of
children in this study. 33% (N=116) of the children’s households have at least one
smoker in the home, and 35% (N=123) of children have daily to several times a month
passive smoke exposure noticed by their parents. 67.2% (N=236) have at least one type

92
of pest reported in their home. Pests include mice or rats (N=177, 50.6%), cockroaches
(N=76, 21.6%), lady bugs (N=61, 17.4%) and bed bugs (N=24, 6.9%).
Approximately half of parents brought their child’s ICS medication with them at
baseline (N=183, 52.1%). Of those whom have ICS prescribed and in hand, 55.9%
(N=95/170) use it daily, 8.8% (N=15/170) use it some days, 26.5% (N=45) use it with
symptoms and 8.8% (N=15) do not take it (Figure 11). Parents report problems with
medication administration; such as any problem their child has taking medication (N=30,
9.6%), not having a schedule for taking medications (N=62, 20.1%) and children refusing
to take medication (N=40, 12.8%). Parents also reported barriers to getting to medical
appointments related to scheduling or getting time off work and transportation (N=42,
12%) and some parents reported skipping appointments for these reasons (N=24, 6.8%).
Figure 11. Inhaled Corticosteroid Decision Tree

93
Parent asthma knowledge was overall high, with 83.8% (N=294) of parents said
they believed the child’s medications could control their child’s asthma. Also, only
19.6% (N=60/306) of parents feel that medications do not work to control their child’s
asthma (self-efficacy). However, 46.3% (N=137/296) of parents say they stop giving
their child their medicine early if they feel better. This does show a lack of knowledge, as
stopping any prescription early is not beneficial and asthma medication needs to be given
on an ongoing basis as instructed. One third (N=123/349, 35.2%) of parents do not have
an asthma action plan and 16.1% (N=46/285) report problems with their child’s school
giving their child medication.
Bivariate Analyses
Bivariate Analysis of Independent Variables and Main Outcomes (Aim 1, Aim 2b
and Aim 2c)
Demographics (Aim1). Sample characteristics were compared with the outcomes
of interest, ED visits, missed school, and asthma control (Tables 23-25). Except for
child’s age and parent’s race, there were no significant between group (children who
used the ED versus those who did not) differences in sociodemographic
characteristics. Younger children ages 4-6 were 1.9 times more likely to be brought to
the ED than older children (p=.013). Parents who are African American, Hispanic or
another race were 3.4 times more likely to bring their child to the ED than Caucasian
parents. Except for transportation, child and parent characteristics were not correlated
with child school absenteeism. Children who ride in their parent’s car were 1.7 times
more likely to miss school (p = .038). Household income, maintenance of the

94
neighborhood and parent marital status were significantly associated with asthma control.
Children from households with no one employed or had an annual income less than
$25,000 were 1.7 times more likely to have very uncontrolled asthma (p=.036). Children
were also more likely to have very uncontrolled asthma if their parents are not married
(OR=1.8, p=.000) and if the houses in their neighborhood are not well maintained
(OR=1.8, p =.015).
Parent stress (Aim 2b). Parents with moderate to high stress were 1.5 times more
likely to bring their child to the ED for asthma (p=0.069) than parents with low stress.
Parents who have a personal car were 1.64 times more likely to bring their child to the
ED than parents of children who take the bus or walk (p=0.032). Neither missed school
or asthma control was associated with parent stress.
Asthma severity and ICS inhaler use (Aim 2c). A child prescribed ICS is 2.1
times more likely to go to the ED for asthma (p=0.000), 1.6 times more likely to miss
school because of asthma (p = .045) and 1.5 times more likely to have very uncontrolled
asthma (p = .056) than those not prescribed ICS, showing prescription of a controller
inhaler to indicate a higher severity of asthma than others. Parents who have ICS readily
available are 2.6 more likely to bring their child to the ED than those who do not, likely
also accounting for severity by the degree of need in having the medication available
(p=0.000). Similarly, children were 2.0 times more likely to miss school (p= .003) and
1.8 times more likely to have very uncontrolled asthma (p= .008) when their parents had
ICS readily available.

95
Parent management behaviors (Aim 2c). Taking the ICS inhaler was not
associated with going to the ED, missed school or asthma control with the unadjusted
variables. The assessment and monitoring, as well as the environment management
variables were not significantly associated with ED visits in the unadjusted bivariate
analysis. Missing appointments was not significantly associated with going to the ED or
missing school with the unadjusted models. However, children who miss an asthma
appointment are 3.2 times more likely to have very uncontrolled asthma (p = .007).
Environmental variables of smokers in the home, the child’s passive smoke
exposure and pests in the home were all significantly associated with (or approached
significance) the child missing school and having very uncontrolled asthma in the
unadjusted bivariate analysis. In the unadjusted analyses, children who had pests in their
home were 1.9 times more likely to have very uncontrolled asthma (p = .021) and 1.7
times more likely to miss school (p = .059). Also, smokers in the home was significantly
associated with children’s missing school and approached significance in being
associated with asthma control, with children being 1.7 times more likely to have their
children miss school (p= .032) and 1.5 times more likely to have very uncontrolled
asthma (p=.089). Children with passive smoke exposure were 1.8 times more likely to
miss school (p = .015) and 1.5 times more likely to have very uncontrolled asthma (p
= .067).
Asthma knowledge and self-efficacy. Parents who feel that asthma medications
do not work (self-efficacy) were 2.0 times more likely to have very uncontrolled asthma

96
(p= .020), 2.1 times more likely to go to the ED (p= .013), and 2.4 times more likely to
miss school (p = .015).
Outcomes. Children who have very uncontrolled asthma were 2.3 times more
likely to go to the ED (p = .000) (Table 6) and children who go to the ED are 3.6 times
more likely to miss school (p = .000) (Table 7).
Bivariate Analysis of Independent Variables and Parent Stress (Aim 2a)
Parent stress was partially explained by several demographic variables noted in
the correlation matrix and are explored using bivariate tables (Table 18), including parent
education, employment and income. Parents who make less than $25,000 annually were
1.8 times more likely to have moderate to high stress. Parents who are not employed were
1.7 times more likely to have moderate to high stress. Parents who did not complete high
school were 2.1 times more likely to have moderate to high stress.
Bivariate Analysis of Independent Variables and Parent Management Behaviors
(Aim 3)
Asthma severity and medication administration. Prescription of ICS for child
by healthcare provider, parents having the medication and parent administration of the
medication were described (Table 19). Children who were prescribed ICS medication
(N=217/349, 62.2%) were most likely to have parents with ICS in hand (N=170/216,
78.7%). Just more than half of parents with ICS in hand were administering the
medication every day (95/170, 55.9%) and a small amount administering some days
(N=15, 8.8%). Over a quarter of parents with ICS in hand administered with symptoms
(N=45, 26.5%) and some did not administer at all (N=15, 8.8%). The majority of parents

97
who did not have ICS on hand did not administer ICS (N=30, 65.2%). Over a third of the
parents who have children with determined asthma severity, as indicated by having
persistent enough asthma to be prescribed an ICS inhaler, and who also have the ICS
inhaler in hand were not giving the medication (N=15, 8.8%) or were not administering
the medication correctly by only giving when symptoms are present (N=45, 26.5%).
Administering ICS medication irregularly, evidently due to a misunderstanding of its use
and not access to the medication, is problematic and likely prevents children from having
controlled asthma.
Children initially prescribed ICS did not have better asthma control than children
who were not prescribed (considered less severe) at the beginning of the study (Table
19c). Also, none of the children who did not have ICS therapy initiated—who were
thought to have lower severity—actually maintained well-controlled asthma throughout
the year (Table 19d, with baseline and follow-up results). When examining each
observation per child every 3 months over one year, children with higher severity did
have less controlled asthma than those who were not prescribed (Table 19d). Only 3.5%
of the observations on children who were not prescribed ICS and thought to have low
asthma severity reported well-controlled asthma (N=18). ICS medication was not given
regularly enough (Table 19b) to have an effect on the child’s symptoms. It is also likely
that more children have asthma requiring ICS therapy because of their uncontrolled
asthma at baseline and throughout the study (Table 19c and 19d).
Parent stress and asthma knowledge by parent management behaviors.
Parent characteristics of stress and asthma knowledge were described in bivariate

98
analyses with parent assessment and monitoring, medication, and education management
behaviors due to the hypothesized relationship between these variables (Table 20). While
missing appointments for asthma was reported at a low rate (6.8%), 12% of parents
admitted barriers to keeping asthma appointments and is possibly larger than this if report
bias may be present when asking this question, as skipping appointments may be
perceived as negative. Parents with moderate to high stress were 6.9 times more likely to
skip asthma appointments. Parents with less asthma knowledge were more 3.6 times
more likely to skip asthma appointments (it is also possible if parents skip asthma
appointments, parents are less likely to have asthma knowledge). Parents with more
asthma knowledge were 3.1 times more likely to have ICS in hand.
Parents with asthma knowledge were 6.7 times more likely to have their child
take their ICS inhaler some days or everyday (p = .007). Parents who had an asthma
action plan are 4.4 times more likely to give their child their ICS medication some days
or everyday (p = .000). Parents who believe that they do not need to give a child all of
their prescription were 2.3 times less likely to give their child their ICS inhaler some or
everyday (p = .001).
Parent and home environment characteristics by environment management
behaviors. Parent income, education, and other home characteristics were examined
with their environment management behaviors at home (Table 21). Households who do
not have anyone employed or have an annual income of less than $25,000, the child with
asthma is 1.6 times more likely to have passive smoke exposure (p = .049). Having two
or more adults in the home approached significance with a 1.5 times greater likelihood of

99
smokers in the home (p = .085). Living in a neighborhood with homes that were not well
maintained showed a 5.8 increase in likelihood of having pests in the home (p = .000).
Having pests in the home was associated with having 5 or more people in the home (OR=
2.5, p = .002), as well as 2 or more children in the home (OR= 2.0, p = .018).
Parent and child characteristics by the shared educational behavior of
having an asthma action plan. Parent and child characteristics were compared with
having an asthma action plan, where recognizing those at risk for not receiving an AAP
or parents who are unaware of receiving one at some point in their child’s care (Table 22).
Parents who did not complete high school were 2.3 times more likely to not have an
asthma action plan (p = .002). Child health insurance approached significance in having
an AAP, where children with Medicaid insurance were 1.6 times more likely to not have
an asthma action plan (p = .081).
Bivariate Correlation Matrix
Using full data from baseline and all follow-up periods, a correlation matrix of
primary study variables was constructed (Table 27). The outcome variable ED visits has
many significant relationships with both exogenous and endogenous variables. Not
controlling for other variables, ED visits are significantly correlated with younger
children, parents who are minorities, parents who are not married, all seasons of the year,
not taking the bus or walking (check-changes signs in multiple regression model), having
high stress, not having people at home who smoke, having pests in the home, having an
ICS prescribed, having an ICS in hand, missing doctor appointments, taking ICS
(changes sign in multiple regression). Higher parent stress was significantly correlated

100
with going to the ED (correlation coefficient 0.063, p<0.05), as well as having older
children, parents being Caucasian, male, having lower income, being unemployed, not
graduating high school, having Medicaid insurance, being single, having smokers in the
home, having more than four people in home, passive smoke exposure, pests in the home,
an ICS prescription, missing appointments, take ICS, live in a house, have problems
taking medicines and reside in a neighborhood with unmaintained homes.
These significant correlation coefficients with ED visits, parent stress,
demographic and parent management variables necessitated an exploration of the
pathways that lead to ED visits due to asthma using multivariate analysis.
Multivariate Analysis with Researcher Directed Step-wise Regression
Hierarchical regression was performed to explain the primary and secondary
outcomes, as well as parent management behaviors. These models assist in further
addressing the aims of this analysis. Aim 1 was designed to examine the characteristics of
the child and parents’ home and social environments and their associations with asthma
control, urgent or emergent asthma visits and school absenteeism. Aim 2a was designed
to examine which parent or child characteristics lead to higher stress in parents of
children with asthma. Aim 2b was designed to examine the association of parent stress on
the child’s emergent asthma visits, school absenteeism, and asthma control. Aim 2c was
designed to explore the pathways of parent stress on parent management behaviors that
affect the child’s emergent asthma visits, school absenteeism, and asthma control. Lastly,
aim 3 was designed to examine the effects of child and parent characteristics on the

101
parent management behaviors performed. Each of the study’s aims was addressed
throughout the explanation of the regression models, with aims 1 and 2 found under the
primary and secondary outcome models and aim 3 under the parent management
behavior models.
ED Visit Step-wise Model
Emergency visits controlled for sociodemographics and season, then perceived
stress, medication use, and asthma management behaviors were then stepped in (Table
26).
Step 1 (Aim 1). Child and parent demographic and season indicators were first
added to the model to predict the likelihood of a child going to the ED related to asthma.
This logistic model was estimated with 1,281 child-quarter observations using
Generalized Linear Estimation (GEE) methods.4 Coefficients in Step 1 reflect gross
effects of included variables before controlling for other mediating variables. None of the
demographic variables were significant in independently affecting the child’s use of the
ED. The child’s minority status approached significance related to ED use (OR=3.59,
p=.060). The parent’s marital status becomes significant, with parents who are not
married being 65% more likely to bring their child to the ED that parents who are married
(OR = 1.65, 1.655-1.00 = 65.5, p = .033). Children who walk or take the bus to school, as
4 The general STATA commands for the models are: .xtset subjid visited .xtgee EDvisitDI Z where “subjid visited” indicate the child and quarter visit, respectively, EDvisitDI identifies those with at least 1 ED visit during a quarter, and Z is a vector of explanatory variables.

102
expected, are 41.2% (OR = -0.588, 0.588-1.00 = 41.2; p = .01) less likely to go to the ED
than parents who drive their children in a personal car.
Step 2 (Aim 2b). After controlling for child characteristics, parent characteristics
and season, parents with moderate to high stress are 67.7% more likely to take their
children to the ED (OR=1.677, p=.014). The addition of stress increased the significance
of child’s minority status by 13.4% (4.069/3.588-1) with a negative zero-order correlation
between parent stress and minority status of -0.0269, where children who are minorities
have a 4.1 times greater likelihood of going to the ED (p = .041).
Step 3 (Aim 2c). Whether the child was ever prescribed an ICS inhaler or the
parent brought one to the first Children’s Hospital visit were stepped in as proxy for
severity of asthma disease. Parents with ICS on hand were 4.2 times more likely to bring
their children to the ED than parents who do not have ICS on hand (p = .000), reflecting
high asthma severity. The addition of the two asthma severity variables decreased the
effect of a child’s minority status by 13.8% (OR = 3.5, 1-3.53/4.069, p = .065). The zero-
order correlation of prescribed ICS with children who are minorities is +0.033 (Table 27),
which, when multiplied by ICS logit coefficient reflects the “bias”, or lower OR for
minority children with ICS prescribed is controlled for. The decrease in the OR of
minority children in going to the ED with the introduction of asthma severity reveals that
it is not minority race, but asthma severity, that drives the probability of a child going to
the ED in the model.
Step 4 (Aim 2c). Parents who administered ICS medications some days or
everyday were 40% less likely to go to the ED (OR=0.60, 1.0-0.60= 0.40, p=.041) than

103
parents who administer mediation irregularly or not at all, controlling for asthma severity
(and having access to the treatment on hand). Regular administration of ICS had a
positive relationship with ED visits with a zero order coefficient of 0.083, and a negative
relationship with going to the ED when controlling for asthma severity and all other
variables in the model this far.
Step 5 (Aim 2c). Home environment variables of smokers in the home and pests
in the home were significantly associated with ED visits (p=.000 for both), with passive
smoke exposure’s influence on ED visits approaching significance (OR=1.48, p=.087).
Smokers in the child’s home reduce the child’s chances of going to the ED 47.7% (OR=
0.523, 1-.523 = .477, p = .000), which was an unexpected finding. Smoke exposure in the
home did not have a protective effect on negative asthma outcomes in the literature; in
fact, the variable smokers in the home was usually associated positively with negative
asthma outcomes. Smoking in the home environment may have a social rather than a
pathophysiological rationale for having a negative association with going to the ED. This
effect of smokers in the home on main outcomes was examined with asthma control and
school absenteeism models. Pests in the home increase the likelihood of children going to
the ED by 61% (OR= 1.609, p=.000), as hypothesized.
Controlling for these environmental variables decreases the “bias” present in the
housing variable and decreased the OR by 21% (1-.65718/.8313=20.95), revealing that
children who live in houses were 34.3% more likely to go to the ED (OR= .657, 1-.657=
34.3, p=.049) than children who live in apartments. The zero-order correlation between
living in an apartment and having pests is high: +.135 (Table 27). Those who live in

104
houses are more likely to have pests, both of which increased the likelihood of children
going to the ED for asthma.
Step 6 (Aim 2c). Controlling for child and parent characteristics, including
transportation, parent stress, and child asthma severity, parents who missed their child’s
medical appointment were 2.3 times more likely to take their child to the ED than those
who do not skip (p = .017). The addition of missing an asthma appointment reduces the
significance of the association between parent stress and ED visits by 5.7% (1-
1.728/1.832) (p = .011), revealing that this management behavior of missing
appointments partially mediates the role of parent stress on this child asthma outcome.
Step 7 (Aim 2c). The collaborative education management variable of having an
AAP was not significant in affecting ED visits (OR=.87, p=.526). Housing, marital status,
transportation, parent stress, asthma severity, medication administration, smokers in the
home, pests in the home and missed appointments all remained significant in the final
model, controlling for all other variables.
Step 8 (Aim 1). The addition of asthma knowledge and a lack of asthma self-
efficacy were not significant in the model (OR=.600, p=.164; OR=1.05, p=.486).
However, their addition changed the exogenous variables single marital status (OR=2.1,
p=.006) and child minority race (OR=7.1, p=.036) to become significant, while housing
in an apartment building became insignificant in the model (OR=.697, p=.115).
Step 9 (Aim 1). Asthma control was included in the model to examine its effect
on going to the ED for asthma, as well as its effect on the other exogenous and
endogenous variables. Well controlled asthma and uncontrolled asthma were negatively

105
correlated with the outcome (OR=.367, p=.000; OR=.061, p=.008) , with very
uncontrolled asthma as the comparison group. Surprisingly, parent management
behaviors of missed appointments, smokers in the home and pests in the home remained
significant over and above the child’s asthma control in predicting the probability of a
child going to the ED for asthma. However, the parent management behavior correlations
with ED visits reduced slightly, with missed appointments the most at 14.6% (1-
2.323/2.719=14.6%), but remaining significant (OR=2.3, p=.025). The more uncontrolled
the child’s asthma, the higher the likelihood to go to the ED. There is a possibility that
there is a subpopulation in the very uncontrolled asthma population that were more likely
to go to the ED than others in that category and the ATAQ measure does not capture this
group.
Minority child race, single parent status, transportation, asthma severity, smokers
in the home, pests in the home, missed appointments all remain significant.
School Absenteeism Step-wise Model
Parent and child characteristics, season, child severity and parent stress were
added first to the model, then parent asthma management behaviors, asthma knowledge,
asthma self-efficacy, and asthma control were stepped in (Table 28). This logistic model
is estimated with 1,271 child-quarter observations using Generalized Linear Estimation
(GEE) methods.
Aim 1 and Aim 2b. Coefficients in Step 1 reflect gross effects of included
variables before controlling for other mediating variables. The marital status variable
approached significance in independently being associated with missed school, with

106
45.4% of children more likely to miss school if their parent is not married (OR = 1.454, p
= .059). Neither the child’s age, gender, race nor the parent’s employment, education,
housing, people in the home, health insurance, or transportation had an independent
effect on the child missing school. Children with higher asthma severity were 2.3 times
more likely to have their child miss school (OR=2.28, p=.000), measured by ICS in hand.
Parents with moderate to high stress were not more likely to have children miss
school (related to asthma) than parents with low stress (OR= 1.02, p=.495). This was
expected as parent stress had a low and insignificant zero-order correlation with the
outcome (Table 27).
Steps 1, 2, 3 and 4 (Aim 2c). Children taking ICS medication some days or
everyday was not associated with missed school (OR=.79, p=.279). Passive smoke
exposure, smokers in the home and pests in the home were insignificantly related to
missing school. Parents who skip their child’s medical appointment were 2.2 times more
likely to miss school (OR=2.17, p=.021). This reduces stress’s effect on missing school
by 65.2% (1-.032/.092), as stress became even more insignificantly related to missed
school. The variable of children having an AAP was not significantly related to missing
school (OR=.87, p=.444).
Step 5 (Aim 2c). A lack of parent knowledge of asthma medications significantly
increased the child’s chance of missing school by 51% (OR = 1.51, p = .054), with
asthma knowledge not being significantly associated (p=.091, not shown in model).
Missed appointment’s significance is reduced by 7.1% with the addition of asthma
knowledge in the model (1-1.8641/2.0067= .071), yet still trended towards significance

107
(OR=1.86, p=.074). Asthma severity remains significant as a moderating variable.
Parents who were not married approached significance in being more likely to keep
children home than parents who are married (OR=1.43, p=.097).
Asthma Control Step-wise Model (ATAQ)
There were a small number of children with continually controlled asthma
(N=1/351, 0.3%) (Table 16), with a low number of total observations of children with
asthma control at baseline or any follow-up time point (N= 54/1354, 4.0%). The
difference between children with very uncontrolled asthma at any quarter (N=222/1354,
16.4%) from those that have controlled asthma was also examined. This distinction is
clinically significant due to those with very uncontrolled asthma having worse outcomes,
with a 2.3 times higher chance of going to the ED (OR=2.3, p=.000) and a 17.3 times
higher chance of missing school (p=.000), not controlling for other variables (Table 25).
Parent and child characteristics, season, child severity and parent stress were
added first to the model, then parent asthma management behaviors, asthma knowledge
and asthma self-efficacy were stepped in (Table 29). This logistic model was estimated
with 1,212 child-quarter observations using Generalized Linear Estimation (GEE)
methods.
Aim 1 and Aim 2b. Coefficients in Step 1 reflect gross effects of included
variables before controlling for other mediating variables. Girls were 68% more likely to
have better controlled asthma than boys (OR=1.68, p=.008). Parents who were employed
or had an annual income > 25K are 59% were more likely to have children with well
controlled asthma (OR=1.59, p=.040). Parents who were not married were 49.7% more

108
likely to have children who have very uncontrolled asthma (OR=.503, 1-.503=.497,
p=.007). Children who resided in a less maintained neighborhood were 39.3% less likely
to achieve better controlled asthma (OR=.607, 1-.607= .393, p=.019). Children who were
not driven by car to school were 47.0% more likely to have better asthma control
(OR=1.47, p=.059). Children with higher asthma severity, measured by parents having
ICS for their child in hand, were 59.4% less likely to have asthma control (OR= .4065, 1-
.4065=.594, p=.000).
Parent stress was not significantly correlated with asthma control when stepped
into the model (OR=1.182, p=.408). Also, child gender, parent marital status, parent
income and neighborhood remained significant related to asthma control.
Step 1, 2, 3 and 4 (Aim 2c). Parent who administered ICS medications regularly
had children who were not significantly more likely to have better controlled asthma
(OR=1.47, p=.119). When stepped into the model, home environmental exposures such
as passive smoke, smokers in the home, and pests in the home did not differ significantly
between children with very uncontrolled asthma and those with better controlled asthma.
Parents who missed appointments for their child’s asthma were 55% less likely to have
children with better asthma control (OR= .445, 1-.445=.555, p=.018). The variable,
parents who had an AAP was not statistically more likely to have better controlled
asthma.
Step 5 (Aim 1). Parents with asthma knowledge were twice as likely to have
children with more controlled asthma, controlling for all other variables (OR=2.03,
p=.022). A lack of asthma knowledge (L8) was not significant in the model (.7557,

109
p=.255, not shown). Adding asthma knowledge to the model reduced the neighborhood’s
effect on asthma control by 13.8% (.6851/.6018-1= .138), making it insignificant. There
is a negative zero-order correlation between asthma knowledge and neighborhood of -
0.1145, making this finding expected. Child gender also became insignificant (OR=1.41,
p=.088), with a 3.8% reduction in significance with asthma knowledge added (1-
1.4082/1.4642= .038). SES, marital status, transportation, asthma severity measured by
ICS in hand and missed appointments all remained significantly associated with asthma
control, controlling for all other exogenous and endogenous variables.
Parent Stress Step-wise Model
Child and parent demographic and season indicators were added first to the model
to predict the likelihood of a parent having moderate to high stress, then child asthma
severity, parent self-efficacy and parent knowledge were added to the model (Table 30).
This logistic model is estimated with 302 baseline child observations using logistic
regression. Parent and child characteristics that were thought to influence parent stress
were entered into the model.
Step 1 (Aim 2a). Child characteristics of age and gender did not significantly
influence parent stress. Parent gender was omitted in the analysis due to too few
observations of male parents. The parent characteristic of race was entered and was not
significantly associated with parent stress, controlling for child characteristics and parent
socioeconomic status. Both parent education and socioeconomic status significantly
affected parent stress, with parents who had household income of greater than $25,000 or
regular employment having a 50.5% less chance (OR=0.495, 1-.495=.505, p=.021) and

110
parents who graduated high school having a 49.9% less chance of having moderate to
high stress (OR=0.501, p=.034). The addition of parent characteristics of housing, marital
status, number of people in the home and the child’s health insurance type were not
significant in influencing parent stress. However, the addition of these characteristics
reduced the significance of socioeconomic status by 10.4% (0.543/0.495-1= .104, p=.06).
This change was expected, as there were strong negative zero-order correlations between
single parent status and socioeconomic status (-.258), and Medicaid health insurance and
socioeconomic status (-.319) (Table 27). Transportation by bus or walking was not
significant in affecting parent stress or any other variables in the model. Neighborhood of
the parents’ residence was added to the parent stress model and was trending towards
significance in having an association with ED visits (OR: 1.701, p=.095). The addition of
neighborhood to the model increased the socioeconomic status variable and significantly
affected parent stress (OR=.486, p=.037). Unmaintained neighborhood had a negative
zero-order correlation of -.064 with employment and greater than $25,000 per year—
defined as socioeconomic status, which influenced the significance of SE in the model.
The addition of neighborhood into the model increased socioeconomics’ effect by 11%
(1-0.486/0.546) (OR=.486, p=.037). Negative correlation between neighborhood and
employment (-0.0636) in the zero-order correlation, which reduces the socioeconomic
coefficient on stress controlling for neighborhood, which means those who are
unemployed and have income <$25,000 income are even more likely to have stress. The
number of subjects dropped from 327 to 302 with the addition of neighborhood, likely
because of sensitivity to this question by parents, so this estimate is likely conservative.

111
Step 2. Asthma severity was not significantly associated with parent stress. While
the zero-order correlation between severity and stress was positive for both ICS
prescription (0.08) and ICS in hand (0.09), controlling for child and parent characteristics
reduced this relationship to insignificance. This reveals that child and parent
characteristics, which include demographics and inner-city social variables, explain
parent stress in this population, not the child’s asthma condition.
Steps 3 and 4. Adding asthma knowledge to the model mitigated the influence of
parent education on parent stress by 6.0% (0.519/0.490-1=.0598) (OR=0.416, p=.132).
However, the addition of lack of asthma knowledge did not mitigate the influence of
education (OR=1.614, p=.184). Asthma knowledge could be a proxy for other types of
knowledge or awareness that is broader than knowledge about medications only. These
insignificant results of asthma severity and asthma knowledge on parent stress support
the hypothesis that asthma is a small aspect of parent stress in this inner-city population,
due to financial and/or other stressors.
Summary of Aims 1 and 2 Models
Aim 1. Four child and parent characteristics (N=4/12, 33.3%) were found to be
significant in explaining at least one main outcome in the final models of ED visits and
asthma control, with none significant in the final school absenteeism model. Parent
marital status and transportation were significant in both main outcomes of asthma
control and ED visits, and remained significant in these models after all the endogenous
variables were added to the models. Parents who had single marital status were 46.4%
less likely to have children with better controlled asthma (OR=.5364, 1-.536=.464,

112
p=.022) (Table 29) and 73.2% more likely to bring their child to the ED (OR= 1.732,
p=.017) (Table 26). This approached significance in explaining school absenteeism
(OR=1.43, p=.097). However, the variable, single parents, was not seen as significantly
less likely to have children with poorer asthma control with the continuous ATAQ model
and maximum symptom days (Table 40. Taking the bus or walking was associated with
increased control in asthma (OR=1.546, p=.039) (Table 29) and decreased the risk of
going to the ED (OR=.509, p=.001) (Table 26). However, there was no relationship
between taking the bus or walking in the continuous ATAQ asthma control model or
maximum symptom days (Table 40). It is possible that child gender and parent marital
status are only significant in association with very uncontrolled children with asthma
rather than overall asthma control in children (Table 29 and Table 40).
Controlling for other parent and child characteristics, the variable children who
are minorities were more likely to use the ED than Caucasian children (OR=3.6, p=.060),
and the relationship became significant when parent stress was added to the model
(OR=4.07, p=.041) and when asthma control was added to the model (OR=6.61, p=.042)
(Table 26). Child minority status approached significance in predicting school
absenteeism (OR=2.79, p=.113). Controlling for baseline characteristics, and also after
parent management behaviors and asthma knowledge were added, parents who have an
annual household income of greater than $25,000 or regular employment were 82.0%
more likely to have children with better asthma control (OR=1.73, p=.020) (Table 29).
This relationship was also observed to approach significance in the continuous ATAQ
model (OR=1.25, p=.075) (Table 37).
113
Asthma knowledge mediates child gender and neighborhood in asthma
control model. Controlling for other child and parent characteristics, child gender was
significant in explaining asthma control (OR=1.68, p=.008), but the significant
correlation was decreased by 3.8% when parent asthma knowledge was added to the
model (OR=1.408, 1-1.408/1.464=.038, p=.088). Similarly, neighborhood was significant
independently with asthma control (OR=0.602, p=.022), but adding asthma knowledge to
the model reduced its effect on asthma control by 13.8% (OR=.685, 1-.6851/.6018= .138,
p=.103). This reduction was expected, as the variable of neighborhood had a moderate,
negative zero-order correlation with asthma knowledge of -.10. Also, neighborhood was
not significant for overall asthma control by continuous measure or symptom days (Table
37).
Aim 2a; explaining parent stress. In this inner-city sample of parents of children
with asthma, there were a high number with moderate to high stress as measured by the
4-item Perceived Stress Scale (N=223, 63.5%) (Table 17), In bivariate analysis, moderate
to high parent stress was negatively correlated with parent employment and income over
$25,000 (OR = 0.49, p=.013), parent education of high-school graduate or higher
(OR=0.48, p=0.019) and male parent gender (p=.030) (Table 18). Eight of 351 parents
(2.3%) were fathers and all eight had moderate to high stress. Because of this observation,
parent gender was omitted from the multivariate regression analysis. Controlling for all
other variables in the parent stress model, parent education (OR= .416, p= .037) and
parent income (OR=.416, p=.021) remained significant with parent stress in the
multivariate regression analysis. Also, living in a neighborhood that is not well

114
maintained approached significance in correlation with parent stress, in both the bivariate
analysis (OR = 1.67, p=.084) and multivariate analysis (OR = 1.7, p=.095).
Aim 2b; parent stress on main outcomes. Parents who had moderate to high
stress had a 50% higher chance of taking their child to the ED than parents with low
stress (p=0.069) (Table 23). Controlling for socio-demographics and parent management
behaviors, parent stress was significant in explaining ED visits of children with asthma
(OR= 1.73, p=.011). Parent stress remained significant when each parent management
behavior introduced in the model. However, parent stress did not affect school
absenteeism or asthma control in bivariate analysis or regression models.
Aim 2c; parent stress’s effect on parent management behaviors in main
outcome models. Comparing the effect of parent stress on a parent management behavior,
the parent management behavior on ED visits and then if the management behavior
influences parent stress’s effect on ED visits was reported. Also, examining the parent
management behaviors’ effect on the main outcomes was examined.
Routine visits and parent stress. Stress influenced the parent management
behavior of routine visits, with bivariate analysis showing parents with moderate to high
stress were 6.9 times more likely to miss appointments than parents with low stress
(OR=6.9, p=.003) (Table 20). Parents with stress are 5.3 times more likely to miss routine
appointments than those with low stress, controlling for sociodemographic characteristics
and child asthma severity (Table 33). In the ED model, parents who missed routine visits
for their child’s asthma were 2.5 times more likely to go to the ED than those who kept
their routine visits (OR=2.50, p=.011) (Table 26). Parents missing their child’s routine

115
asthma appointments mediated the role of stress on ED visits by 5.5% while controlling
for other parent management behaviors, revealing that stress is a reason why parents
missed routine appointments and influenced whether the child went to the ED for asthma
(1-1.73/1.83=.546) (Table 26). This change was expected, as the zero-order correlation
between missed appointments and parent stress was +.12 (Table 27).
Routine appointments and main outcomes. Missing the child’s routine
appointments was significantly correlated with all of the main outcomes. Missing
appointments was associated with being 51.6% less likely to have more controlled
asthma (OR=.484, 1-.445=.516, p=.018), 4.4 times more likely of having another
symptom day (OR=4.426, p=.018), twice as likely to go to the ED (OR=2.50, p=.011),
and twice as likely to miss school (OR=2.00, p=.042).
Medication administration and parent stress. Parents with moderate to high
stress were 58% more likely to have their children take ICS medications regularly, either
some days or everyday (OR=1.58, p=.058) (Table 20). There was no effect of parent
stress on regular medication administration in the medication administration behavior
model (1.358, p=.354) (Table 31). Controlling for parent and child characteristics, season,
and other management behavior variables, the variable parents who administer the child’s
asthma medications regularly was negatively associated with going to the ED (OR=0.61,
p=.049), (Step 6, Table 26), but it’s effect on ED visits was mediated by having an
asthma action plan (OR=.630, p=.070) (Step 7, Table 26). The effect of taking ICS
regularly did strengthen the relationship between stress and ED visits by 4.7%
(1.77/1.689-1), revealing a relationship between parent stress and medication
116
administration (zero order correlation=.12), with parents who experience more stress less
likely to regularly administer their child’s asthma medication, controlling for other
variables (Table 26).
Medication administration and main outcomes. The variable parents who
administer the child’s asthma medications regularly was negatively associated with going
to the ED (OR=0.612, p=.049) without AAP in the model (Table 26). The zero order
correlation between AAP and medication administration (labeled “take ICS”) was
moderate at +.19 (Table 27). The multicollinear association between having an AAP and
taking ICS in the ED visit model is likely explained by parents who had and used an AAP
were aware of the appropriate frequency to administer the medication, and more likely to
administer medications regularly.
Home environment variables and parent stress. Parent stress influenced
passive smoke exposure in children, controlling for child and parent characteristics
(OR=1.65, p=.037) (Table 37). This relationship was expected, with stress and passive
smoke having a zero-order correlation of +0.11. However, passive smoke was not
significantly related to ED visits in the full ED model (Table 26) and parent stress was
only impacted 3.4% when home environment variables were added to the ED model
(1.832157/1.77081= .034) (Table 26). Stress did not significantly influence parent
management of smokers in the home or pests in the home in bivariate or regression
analysis (Table 21 and Table 26).
Home environment variables and main outcomes. The variable, parents who
had other family members in the home that smoke, did not affect the child’s asthma

117
control (or maximum symptoms), yet decreased the likelihood of the child going to the
ED by 45.4% (OR=.546, 1-.5461=.454 p=.001). While smoker in the home does not
appear to affect asthma symptoms, yet is associated with bringing a child to the ED, this
relationship between smokers in the home and not going to the ED likely reveals a lack of
recognition of the child’s need to go to the ED if their asthma is not under control by
parents who smoke, not that the smoke influences the child’s symptoms independently of
asthma severity and other variable included in the asthma control model. Parent report of
estimated frequency of child passive smoke exposure was not associated with any of the
main outcomes of child ED visits, school absenteeism or asthma control. Controlling for
all other variables, pests in the home were associated with ED visits (OR=1.51, p=.001),
but not asthma control or school absenteeism.
Educational management behavior and parent stress. In bivariate and
multiple regression analysis in the main outcome models, parent stress did not
significantly influence parents having an AAP and the AAP did not affect any of the
main outcomes.
Child asthma severity and main outcomes. Having ICS in hand by parents is a
measure of asthma severity and significantly affects all the main outcomes. Asthma
severity increases the risk for going to the ED (OR=5.82, p=.000), increases the risk for
missing school (OR=2.52, p=.000) and decreases the likelihood of having more
controlled asthma (OR=0.36, p=.000).
Parent Management Models (Aim 3)
Medication Administration Model (Take ICS)

118
Parent and child demographics, parent stress, child asthma severity and parent
management behaviors of missed appointment and having an asthma action plan were
first entered into the parent medication administration model, then parent asthma
knowledge, self-efficacy and beliefs about stopping asthma medications were added into
the second model (Table 31).
Model 1. None of the demographic variables were independently associated with
medication administration. Parents who had an asthma action plan were 2.6 times more
likely to have their children take ICS (OR = 2.6, p = .012). Asthma action plans do give
clear instructions on which medications the child have been prescribed and when to take
them.
Model 2. The addition of several asthma knowledge questions related to
medication use provided additional insight on what is associated with medication
administration. Parents who had asthma knowledge (who believe that ICS medications
can control asthma) were 15.2 times more likely for the children to have asthma control
(OR = 15.2, p = .010). This association was expected, as the zero order correlation
between taking ICS and asthma knowledge was +0.18. Parents who lacked asthma
knowledge by reporting they stop giving the child medications when their child’s asthma
was “better” were 65.0% less likely to have their children take their medications some
days or everyday (OR = .350, p = .004). Parents with self-efficacy, who believe
administering their child’s asthma medication assists in their child’s asthma control were
3.4 times more likely to administer their child’s medication regularly (OR=3.4, p=.025).
Miss Appointments Model

119
Parent and child demographics were first entered into the missed child asthma
appointments model, then parent asthma knowledge and self-efficacy were added into the
second model (Table 32).
Model 1. Parents who had other people living in their home were 5.8 times more
likely to skip appointments (OR = 5.89, p = .003). Parents who lived in a less maintained
neighborhood were 6.8 times more likely to skip appointments (OR = 6.75, p = .001).
Parents who had stress were 5.3 times more likely to skip appointments (OR = 5.34, p
= .042).
Model 2. The effect of parent stress, the number of people who live in the home
and the neighborhood remain significant with the addition of parent asthma knowledge
and self-efficacy. The addition of asthma knowledge reduced the variance in the child’s
insurance variable, with insurance increasing in significance by 21.8% (1-
11.495/9.437=.218). Parents who had children covered by Medicaid insurance were 11.5
times more likely to have missed appointments than children covered by other insurance
companies, controlling for income, employment, and other demographic variables
(OR=11.5, p=.038).
It is not clear what factor of Medicaid insurance would influence parents to miss
appointments, so it is likely an aspect of parents who have children enrolled that might
explain this association. Insurance type may be a more refined measurement of
socioeconomic status and parents with this type of insurance may not have the same
amount of employment flexibility to come to their child’s appointments. However, when
the variable, children in the household was substituted for number of people in the

120
household, insurance was not significant in explaining missed school. Children in home
were likely the explanation of missed school; children with Medicaid insurance are more
likely to have more children in the home.
Asthma Action Plan Model
Parent and child demographics were first entered into the asthma action plan
model, then parent asthma knowledge and self-efficacy were added into the second
model (Table 33).
Model 1. Parent education was significantly correlated with having an AAP. This
relationship remained significant when asthma knowledge was included in the model. It
is possible that parents may not recognize that they have been given an AAP, yet the
question to parents is clear about receiving written instructions. More likely, healthcare
providers may not give parents of children with asthma a written plan if they believe it
will not help parents. This judgment made by healthcare providers is plausible because of
a perceived literacy problem or perceived lack of interest in written materials. Children
who have more severe asthma also are more likely to have an AAP, as predicted.
Children with higher severity of asthma may trigger the healthcare provider to see the
need for providing the parent with an AAP due to the severity of the child’s medical
condition, as well as the child being more likely to have gone to the ED or a healthcare
visit multiple times, increasing the likelihood of obtaining an AAP at one of the visits.
Model 2. With the addition of parent asthma knowledge and self-efficacy,
transportation increased in significance with having an AAP by 20.9% (OR=1.956, 1-
1.956/1.618=.2089, p=.049). Children who took the bus or walked were 1.9 times more

121
likely to have an AAP, controlling for missed appointments and asthma knowledge. The
inclusion of asthma knowledge and self-efficacy reduced the significance of asthma
severity on obtaining an AAP by 21.1% (OR= 2.13, 1-2.129/2.696= .211, p=.057), yet
remained significant. While asthma knowledge was not significant in explaining parents
obtaining an AAP, it reduced the effect of asthma severity on having an AAP.
Further examination of the AAP model revealed that the addition of parent
reported ED visits to the model reduces the significance of transportation (OR=1.898,
p=.062, not shown). This finding suggests that transportation affects ED visits,
supporting the notion that parents often receive asthma action plans in the ED, and that
transportation is a barrier to ED visits as well as trending on significant in affecting
parents receiving asthma action plans.
Pests in Home, Passive Smoke Exposure and Smokers in Home Models
Parent environment management behaviors of pests in the home, passive smoke
exposure to their children and having smokers in their home were examined in separate
models, which included parent and child characteristics, as well as parent stress in each
(Table 34).
Pests in the home model. Homes with more than 5 people were twice as likely to
have pests in the home (OR = 2.00, p = .000), controlling for housing type and other
demographic variables. Parents who lived in a neighborhood that they believe is not well
maintained were 1.8 times more likely to have pests in their home (OR = 1.79, p = .002).
Parents with higher education were 39.1% less likely to have pests in their home than
parents who have low education (OR = .609, p = .044).

122
Parents who were employed or had an income greater than $25,000 per year
approached significance and were 34.8% less likely to have pests in the home (OR = .652,
p = .066), controlling for housing type. The variable, people living in apartments,
approached significance in association with pests in the home, indicating they are 1.4
times more likely to have pests than those who live in houses (OR = 1.37, p = .094).
Passive smoke model. Parents with moderate to high stress were 1.65 times more
likely to report their child was exposed to passive smoke than parents with low stress
(OR = 1.65, p = .037). Parents who were Caucasian were 54.2% more likely to be
exposed to passive smoke (OR=.4580, 1-.4580= .542, p=.072). This finding is
marginally significant.
Smokers in the home model. Parents who lived in homes where people smoke
were 2.1 times more likely to not be married (OR = 2.08, p = .023). Also, these parents
were 2.6 times more likely to have Medicaid insurance if they had other smokers living in
their home (OR = 2.61, p = .005). Child enrollment in public health insurance is likely
another estimate of socioeconomic status, in addition to the employment and income
variable, and assists in refining the measure of SES, revealing this relationship of lower
income households and smokers in the home. Neither housing type nor number of people
in the home independently affected if there were smokers present or not.
Summary of Aim 3 Models
Missed appointments and pests in the home. Two groups, those who had a
large family (>4 people) and living in an unmaintained neighborhood, both increased the
likelihood of children missing appointments and having pests in their homes. Parents

123
were 5.0 times more likely to miss their child’s appointments if they had more than four
people in their home (OR=4.99, p=.012) and were 7.6 times more likely to miss them if
they lived in an unmaintained neighborhood (OR: 7.61, p=.001) (Table 32). Also, parents
were 5.2 times more likely to miss appointments if they had moderate to high stress
(OR=5.20, p=.050) (Table 32). Parents were twice as likely to have pests in the home if
they had more than four people living in the house (OR=2.00, p=.000), controlling for
housing type and other exogenous variables, as well as 1.8 times more likely to have
pests if living in an unmaintained neighborhood (OR: 1.79, p=.002) (Table 34). Also,
parents with higher education had a 39.1% lower likelihood of having pests in their home
(OR=.609, 1-.609=.391, p=.044), controlling for income and other exogenous variables
(Table 34). While the number of people living in a home, which likely represents a
child’s family, and the neighborhood lived in, are both difficult to change, the behaviors
of missing appointments and pests in the home are modifiable.
Passive smoke and smokers in the home. Parent stress increased the likelihood
of passive smoke exposure 1.6 times (OR=1.653, p=.037), and, as mentioned, increased
the likelihood of missing an appointment by 5.3 times (OR=5.342, p=.042) (Table 34, 37).
Parent stress was still significant in influencing passive smoke exposure even controlling
for the family’s income and employment, parent education, number of people in the
home, and the neighborhood environment. Having a single parent doubled the likelihood
of having people who smoked living at home (OR=2.1, p=.023), which could include the
parent or another adult family member (Table 34).

124
Having an AAP. Parent education of graduating high school or more increased
the likelihood of the child having an asthma action plan 2.7 fold (OR=2.943, p=.008),
controlling for asthma severity, asthma knowledge, asthma self-efficacy, and other
exogenous factors (Table 33). It is unknown if healthcare providers decide whether or not
to give parents of children with asthma an AAP if they believe the parents are less likely
to use it, possibly due to literacy concerns or interest shown by the parents, or in an effort
to reduce complexity in management by giving more paper. Another explanation is that
healthcare providers do give written management plans, yet parents with less education
are less likely to look at the papers given or regard them as important in their child’s
management, forgetting or not being fully aware that they do have these instructions.
Also, transportation increases the likelihood of parents having an AAP almost twice (OR
1.96, p=.049).
Medication administration. The addition of parent asthma knowledge related to
medications had a large effect on medication administration, a small effect on missed
appointments and no effect on having an AAP. Parents with asthma knowledge were 15.2
times more likely to have regular medication administration (OR=15.2, p=.010), parents
with self efficacy related to medications were 3.4 times more likely to perform regular
medication administration (OR=3.35, p=.025), and those misinformed about the role of
medications are 65.0% less likely to continue giving medication regularly (OR=.350, 1-
.350=.650, p=.004). Knowledge and self-efficacy, as well as having an AAP, are
modifiable factors. Taking ICS regularly was significantly associated with children going
to the ED for asthma, not controlling for AAP in the model. Taking medication regularly

125
was not significantly related to asthma control measure, yet was related to ED visits,
which leads to a possible explanation that regular ICS use does not effect categories of
control or uncontrolled asthma but exacerbations that are severe enough to go to the ED,
which may be lost in the asthma control score.
Sensitivity Analysis
Lagged model. A lag test only for two variables, passive smoke and pests in the
home, was performed due to only their measurement every quarter (Table 35). Passive
smoke remained insignificant and pests in the home reduced the correlation by 17.6% (1-
1.29/1.566) (p= .024), but remained significant. With the change in pest’s significance,
missed appointments increased in association with ED visits by 10.6% (1- 2.5958/2.346)
(p = .007). The parent management behavior variables demonstrated similar covariance.
Pests were predictive of ED visits, controlling for demographic variables, parent stress,
asthma severity and other parent management behaviors.
Sensitivity test using alternate asthma control measure. Using alternate
measures for main outcomes of interest assists with confirming the associations of
dependent variables on the independent variable (Table 37). An alternate measure for
asthma control was examined. Maximum symptom days were also substituted for ATAQ
asthma control, where asthma severity and missed appointments also retained
significance (OR= 3.89, p= .000; OR= 4.42, p= .018, respectively) and with pests gaining
significance (OR= 1.6, p=.004).
Functional form. Asthma control using the ATAQ Control was tested using both
the continuous measure (1-7) and the dichotomous measure (combined scores 1-3 and 4-

126
7) (Table 37). The dichotomous variable combined scores 1-3 to create a “very
uncontrolled” asthma category and a “better controlled” category to explore further what
is associated with “very uncontrolled” asthma. The continuous ATAQ Control model
found two significant associations, asthma severity (OR= .576, p= .000) and missed
appointments (OR = .507, p= .001). The dichotomous model testing better controlled
asthma, as opposed to very uncontrolled asthma, found these associations of asthma
severity and missed appointments significant as well. Child gender (OR= 1.46, p= .049),
socioeconomic status (OR= 1.82, p= .008), marital status (OR= .56566807, p= .024), and
neighborhood (OR= .581, p= .014) were also significant.
Fifteen variables in the main model (N=15/24, 62.5%) were transformed from
multiple categories to dichotomous for the analysis. These include child age, child race,
parent race, income, parent education, apartment, not married, number of people in the
home, insurance, neighborhood, transportation, parent stress, take ICS, people who
smoke in home and pests in home. These variables were transformed to create a method
of measuring a variable that provides useful categories. For example, using a continuous
parent stress ranging from 1 through 16 examined the association between parent stress
and ED visits, with the likelihood of the child going to the ED for every one point higher
the parent has of reporting stress. By placing the continuous variable of parent stress in
the main outcome model, parent stress became insignificant (OR= 1.06, p=.081), with a
33.8% (1-1.057832/1.728849=.338) decline in association with ED visits (Table 36).
Creating a dichotomous variable of parent stress, based on the literature, with scores 0
through 4 meaning low stress and 4 through 16 being moderate to high stress, parent

127
stress becomes significant in the main ED model. Parents with moderate to high stress
had a greater risk of bringing their child to the ED than parents with low stress,
controlling for other variables.

128
CHAPTER FIVE
DISCUSSION AND CONCLUSIONS
Asthma is a controllable condition. However, the challenges of the inner city and
parent characteristics directly affect these children’s outcomes in controlling their asthma,
going to the ED for asthma and school absenteeism. This section discusses the secondary
analysis performed in light of what has been previously reported in the literature. First,
comparing the study sample with other inner-city analyses and national rates a better
understanding of generalizability. Second, discussing the results of each aim and
identifying pathways identified in this analysis are discussed. Lastly, applying the results
of the analysis to policy and future research are highlighted.
Study Overview
The Asthma Clinical Research Center at Boston Children’s Hospital, Harvard
Medical School conducted a 5 year prospective, NIH/NIAID funded longitudinal study,
“School Inner-city Asthma Study” (SICAS) (Principal Investigator, Phipatanakul)
(Phipatanakul et al., 2011). This descriptive correlational study sampled children with
asthma in selected classrooms of schools in a major urban area in the Northeast, United
States, each year for 5 consecutive years. The students who had asthma in the classrooms
were enrolled in the study and had a baseline assessment at Children’s Hospital Boston.
Children were required to have asthma that was diagnosed by a healthcare provider in the

129
past and either had wheezing in the last year, or had an unscheduled medical visit for
asthma in the last year, or was taking daily medicines for asthma. A baseline
questionnaire was used to collect information from parents’ demographic information and
the child’s asthma specific information, as well as parent stress. Follow-up phone calls to
parents at 3, 6, 9, and 12 months collected home environment and asthma outcome
information.
Comparison with national sample and with other inner-city asthma study.
This inner-city population of children with asthma has high asthma severity, with
a high amount of AAPs given and a comparable amount of ED visits compared to
national child asthma rates. Almost two thirds (N=217, 62.2%) of children have been
prescribed an ICS inhaler, indicating persistent asthma severity, which is much higher
than the national ICS prescription rates of 17.1% to 33.7% (Statistics, 2012). While it is
ideal that every child has a written asthma action plan (AAP), 64.8% (N=226) of children
in this inner-city sample have a plan. This is, however, greater than the national average
of 45.4% of children with asthma were given AAPs (Control, 2012)
(http://www.cdc.gov/asthma/acbs/table6.htm). This may be due to the higher asthma
severity in this population, leading to multiple healthcare visits for asthma, increasing the
chances of a parent obtaining an AAP for their child. Parents reported almost half
(N=165, 47.7%) of the children visited the ED or urgent care for asthma at least once
prior or during the study, which is similar to the national asthma attack rate of 43.1% to
63.1% in US states (Statistics, 2012).

130
Demographics comparison. Compared to an inner-city study population sampled
from four urban areas in the US, this analysis had similar child race diversity and percent
of children on Medicaid insurance. Similar to the multi-center, national study that
informed the design of SICAS, the National Cooperative Inner-City Asthma Study
(NCICAS), children in this study were racially diverse with a low percent of Caucasian
children (Garbutt et al., 2010; Nelson et al., 2011; Sockrider et al., 2006). There were a
similar number of children on Medicaid (74.6% versus 73.1%). However, more parents
have higher education (SICAS: 80.9% completing high school, NCICAS: 66.7%
completing high school), higher income (SICAS: 50% <$25,000, NCICAS: 61%
<$15,000), less unmarried parents (SICAS: 70.9%, NCICAS: 77%) and fewer children in
SICAS appear to have gone to the ED (47.7% versus 65.7%).
Compared to a study from three urban and surrounding areas in the US from
practices affiliated with a managed care organization, the Pediatric Asthma Care Patient
Outcomes Research Team II (PAC PORT II) study, there was a similar number of
smokers in the home reported, but this analysis included a larger number of houses with
pest exposure. The SICAS inner-city population with asthma has a high rate of pest
exposure, with 67.2% reporting at least 1 type of pest in their home at baseline, compared
to the PAC PORT II study with 18% home pest exposure (Finkelstein et al., 2002). Also,
SICAS reported 33.1% of parents reported a smoker in the home, which is similar to
PAC PORT II study reporting 30% (Finkelstein et al., 2002). It is possible that the PAC
PORT II study sample had both urban and suburban participants, reducing the likelihood
of parents reporting pest exposure. Yet, the number of homes with smokers was

131
comparable. Overall, the SICAS analysis is representative of inner city residents in the
US, except slightly more educated and higher income than other inner-city environments,
who have gone to the ED for asthma less often. This difference strengthens the results of
this analysis, as it is likely more difficult to see an effect of management behaviors on the
main outcome with a lower number of ED events.
Aim 1 Analyses and Interpretation of the Findings
Results indicated a small number of child and parent characteristics related to
child asthma outcomes examined in current literature of studies including parents of
children with asthma. The analysis explored twelve child and parent characteristics,
including child age, gender, race, insurance, transportation type, parent gender, household
income, parent education, housing, marital status and number of people in the household,
and season in all of the main outcome models of childhood asthma. These variables were
determined as important to the model because they were either controlled for in other
studies or hypothesized to have an effect on the outcomes. Four of these twelve (25%)
were significant in explaining the probabilities of children going to the ED and/or the
child having asthma control, controlling for other characteristics, asthma severity, and
parent management behaviors. Marital status and transportation were significant in
explaining the probability of the child going to the ED and probability of having more
controlled asthma. Child minority race increased the likelihood of a child going to the ED.
Household income increased the likelihood of a child having better controlled asthma. No
characteristics remained significant in the final school absenteeism model.

132
Child race. Child race has been shown to be an important factor in population
based study related to ED visits for asthma. However, at risk calculations of race has
shown a decreased risk of ED visits in racial minorities than what has been believed in
the past (L. J. Akinbami et al., 2011). However, this analysis approached significance for
an increased risk for children who are minorities to have a greater likelihood of a
probability going to the ED, controlling for child and parent personal and inner-city
living characteristics (OR=3.6, p=.060). The variance of the model was refined once
asthma knowledge was included, and child race became significant (OR=6.61, p=.042)
(Table 26). Child race increased in effect by 127%, with this direction of change expected
as asthma knowledge’s zero-order correlation with race was +.06 and a negative zero-
order correlation with a lack of self-efficacy of -.11 (1-7.1419/3.1442 = -1.27). Child
minority race, independent of asthma knowledge and self-efficacy, shows an increased
likelihood of going to the ED (Table 26), but not of having more uncontrolled asthma
(Table 29). It is possible that parents of children with asthma who have minority status
may have different decision making processes than Caucasian parents as to when to bring
a child to the ED, not related to (controlling for/regardless of) asthma knowledge and
self-efficacy. Flores and colleagues found that African American parents were more
likely to use the ED use as usual source of asthma care than Latino parents (OR=3.6, 95%
CI=1.7, 7.8), adjusted for child gender, asthma specialist, poverty, caregiver’s
educational attainment, and asthma severity (Flores et al., 2009).
Transportation. The majority of children did not take a personal car to school
(68.1%) (Table 17). Parents who drive their child to school would likely have access to a

133
car regularly and would be able to drive their children to the ED if the child develops
concerning asthma symptoms. In bivariate analyses, parents of children with asthma who
had a car were 60% more likely to bring their child to the ED then parents who took
public transportation (OR 1.6, p=.032) (Table 23). This relationship persisted when
controlling for all other variables in the final model, as children taking the bus or walking
were 49.6% less likely to go to the ED (OR=.504, p=.003) (Table 26). However, children
who took the bus or walked were more likely to have better controlled asthma (OR=1.546,
p=.039) (Table 29). It is possible that children who took the bus or walked had more
regular moderate physical exertion resulting in better pulmonary function or less
symptoms. However, this dataset does not support further analysis of physical activity
and asthma control. Also, transportation’s effect was independent of income, where
income had a strong negative correlation with taking the bus or walking (-0.24, p=.000)
(Table 27). Regardless of income, children who take the bus or walk to school and have
asthma are in better shape or have reported fewer symptoms than those who are driven to
school. Whether walking or taking the bus may improve respiratory function, or those
with symptoms are more likely to be driven to school, remains to be clarified.
Marital status and income. 70.1% of parents in the secondary analysis are single.
In bivariate analysis, single parents were 1.8 times more likely than married parents to
have children with very uncontrolled asthma (p=.015), and approached significance in
being more likely to bring their child to the ED for asthma (p=.137). Controlling for all
other variables in the final outcome models, parents who are single were 43.5% less
likely to have children with more controlled asthma (OR=.565, 1-.565=.435, p=.024) and

134
79% more likely to bring their child to the ED (OR= 1.79, p=.017) (Table 26 and Table
29).
In a secondary study of 383 children with chronic illness, including 90 children
with asthma, single mothers were described (Mullins et al., 2011). The sample of parents
were primarily Caucasian, had moderate household income and were married (Mullins et
al., 2011). Single mothers were more likely to be from a minority group and have lower
income than married mothers (X2 (1): 28.97, p< .001; X2 (6): 146.32, p< .001,
respectively) (Mullins et al., 2011). In this analysis, child race and parent income were
significant with main outcomes independent of the parent’s marital status. Child race
remained significant in the ED model with single parents controlled for and income
remained significant in the asthma control model with single parent status controlled for
(Table 26 and Table 29).
Aim 2a Analyses and Interpretation of the Findings
Parents in the current study were primarily mothers (97.7%); the majority are
single (70.1%), and from a minority racial or ethnic group (93.6%). Half have an annual
household income of less than $25,000 per year (50.0%) and have 2 or more children
living at home (80.9%). Almost two thirds of these women have moderate to high
perceived stress in their lives (N=223, 63.5%), where these feelings of not having control
over their circumstances are primarily explained by education and income (Table 30).
Parent and child characteristics in an inner city were explored to see if any
explained parent stress in the parents of children with asthma population. Income and
education were confirmed to be related to parent stress in this inner-city population, with

135
parent gender unable to be examined because of the low participation of fathers in the
study. Bivariate analyses showed parent stress to be significantly associated with parent
education and household income/employment, with neighborhood maintenance and
asthma knowledge approaching significance. Controlling for all other parent child
characteristics and child asthma severity, parent education and household income
remained significant in hierarchical regression. Parents who graduated high school were
57.9% less likely to have moderate to high stress (1-0.421=.579, p=.042) (Table 30).
Parents who had an adult living in their home with regular employment or income greater
than $25,000 annually were 53.1% less likely to have moderate to high stress (1-
0.469=.531, p=.042) (Table 30). A moderate income population had parent income
significantly related to parent stress in their hierarchical regression (β= -.359, p< .01)
(Carpentier 2008). Also, parent gender was significant in that study (β= -.290, p< .05)
related to parent stress. This inner-city analysis had a low number of fathers participating
(N=8) and all were in the moderate to high parent stress category, which omitted parent
gender from the regression analysis. Education in a high-income inner-city population in
India found graduate level education to be associated with lower parent stress (Rastogi et
al., 2009). In this low-come inner-city population, education level at high school
graduation level or above was associated with lower stress. It appears that varying levels
of education affects parent stress differently depending on socioeconomic status.
Marital status was not associated in the inner-city population with parent stress as
in a moderate-income population. In a moderate-income population of parents of children
with chronic illness, marital status was significantly related to parent stress, and was

136
attenuated by parent income (Mullins 2011). In this analysis of an inner-city population,
parent marital status was not significantly related to parent stress in the bivariate analysis
(p=.167, Table 18) and its effect on parent stress was attenuated by other variables in the
main model (p=.791, Table 30).
Child asthma severity was not significantly related to parent stress in bivariate or
multivariate analyses. Asthma knowledge or asthma self-efficacy also was not
significantly related to parent stress. This is consistent with what was noted in a middle-
income group of parents of children with asthma; duration of illness was not significantly
associated with parent stress in hierarchical regression (Carpentier et al., 2008). None of
the child characteristics were significant in association with parent stress in bivariate or
regression analyses, revealing that the child or their asthma condition do not appear to
affect parent stress compared to other stressors.
Even though it was predicted that the urban environment would have unique
stressors that would contribute to parent stress (Quinn et al., 2010b), none of the urban
environment variables such as housing and neighborhood were significantly associated
with parent stress in the bivariate and regression analyses. Living in an unmaintained
neighborhood approached significance with parent stress in both bivariate (OR: 1.67,
p=0.084, Table 18) and controlling for all other variables in the full regression model
(1.554, p=.194, Table 30). Even though urban environment may affect parent stress, it did
not affect their stress over and above the variables of income and education. However,
these sources of stress are likely the same across populations.

137
Hierarchy of needs. Income, education and neighborhood effecting parent stress
is logical and expected, irrespective of population. According to Maslow’s hierarchy of
needs in his Theory of Human Motivation (1943), personal and financial security
dominate other needs that are not seen as equally important. If parents feel insecure
financially, stress is most likely to come from these problems rather than others perceived
as less threatening. Also, they may be more likely to focus their attention and efforts on
these problems financial problems, rather than attempting to affect other problems not
recognized as equally important. Parents likely recognize their need for financial
resources to provide for themselves and their family, but may not recognize parent
management behaviors such as keeping asthma management healthcare visits as equally
important. However, if parents understand that management behaviors are “safety nets”
(1943) against their child having worsened, uncontrolled asthma and possibly costing
time and money going to the ED or missing school, then they are more likely to make
these a priority and act on them.
Using this insight into what is associated with high stress in inner-city parents of
children with asthma will enable future research and interventions to be tailored to those
at risk for high stress (mothers with low education—less than high school diploma, low
income--<$25,000 household annual income or not regularly employed household
members, and living in a not well maintained neighborhood), to be able to reduce their
stress and its effect on their child’s outcome are implications of these findings.

138
Aim 2b Analyses and Interpretation of the Findings
There are few analyses comparing parent stress and main outcomes. Controlling
for exogenous variables, parent depression was found to a have a direct effect on ED
visits in an inner-city population (elementary schools from two urban areas) (Bartlett et
al., 2004). In this analysis, parents who have moderate to high stress were found to have a
50% higher chance of taking their child to the ED than parents with low stress (p=0.069)
(Table 23). Controlling for socio-demographics and parent management behaviors,
parents with moderate to high stress were 64.5% more at risk to bring their child to the
ED for asthma (OR= 1.645 p=.029). Parent stress remained significant when each parent
management behavior and asthma control were introduced in the model. However, parent
stress did not affect school absenteeism or asthma control in bivariate analysis or
regression models.
Parent stress was not associated with missed school in the bivariate (p = 0.366)
(Table 26) and multivariate model (OR= .032, p= 0.18) (Table all 4 models). Parent
stress was not associated with asthma control in bivariate (p = 0.508) (Table 25) or
multivariate model (OR= 0.168, p= 0.82) (Table all 4 models). Even though the
relationship between parent stress and asthma symptoms in Milam (2008) was not found
in this secondary analysis, other neighborhood and social variables did explain asthma
control. Income, marital status, neighborhood, transportation, asthma severity and missed
appointments were related to asthma control (Milam et al., 2008).
Controlling for exogenous and endogenous variables, parent stress remained
significant in predicting ED visits even though asthma control was stepped into the model.

139
Parent stress effects parents’ decisions on whether to go to the ED for their child’s
asthma, regardless of the child’s level of asthma control as measured by the ATAQ. It is
possible that the ATAQ does not capture children’s severe symptoms that lead to going to
the ED, but that it captures general symptoms in the last 2 weeks of interviewing the
parents (while there are 3 months between follow-up contact with the parents). It is
possible that children who go to the ED may have an asthma attack that necessitates
going to the ED but is not readily apparent with the questionnaire. Controlling for age,
child gender, race, parent history of asthma, community, language and wheeze at baseline,
PSS scores in quartiles approached significance in predicting child wheeze (Milam et al.,
2008). However, this analysis did not find this association between parent stress and
asthma control.
Aim 2c Analyses and Interpretation of the Findings: Psychosocial Pathways
Determining the pathway between parent stress and child asthma outcomes has
not been addressed in the literature sufficiently. Biological pathways from parent
psychosocial distress to child psychosocial distress have been considered, but there has
been a lack of association between parent psychosocial distress measures and child
psychosocial distress measures (Szabó et al., 2010; Wolf et al., 2008). A study considered
parent stress affecting the child’s inflammation, leading to increased child reactivity to air
pollution (Islam et al., 2011). However, the mechanism linking parent stress and the
child’s inflammation was not examined (Islam et al., 2011) (Islam 2011). Another
psychosocial pathway is proposed, where parent management behaviors mediate parent
stress and child asthma outcomes. Celano examined parent stress and parent management

140
behaviors, however this study did not examine child asthma outcome measures of ED
visits, school absenteeism or asthma control (Celano et al., 2011).
There is a lack of literature examining the mechanism that links parent stress to
child asthma outcomes. As Wolf and Buseke-Kirshbaum postulate, there may be a
psychosocial pathway between parent stress and child asthma outcomes, with a need for
longitudinal analysis to examine this link (Wolf et al., 2008). This analysis took the
examination of parent perceived stress and child asthma outcomes further by examining
the relationship of parent psychosocial and management behaviors with child asthma
outcomes.
While parent stress was only significant with ED visits as a main outcome, the
pathways of management behaviors affecting asthma control and school absenteeism
without stress were also examined. Management behaviors that are influenced by parent
stress on the main outcome of ED visits may also affect these other two outcomes and
understanding that relationship may assist in discerning the value of influencing that
management behavior, as it affects multiple outcomes.
Two main pathways. This analysis found two main pathways of parent stress and
child asthma main outcomes. First, parent stress significantly affects parents missing
appointments, which significantly affects all of the main child asthma outcomes,
including ED visits, school absenteeism and asthma control. Secondly, parent stress
affects passive smoke exposure, which trends in significance in affecting ED visits, as
well as asthma control. Understanding these pathways and developing a strategy to
intervene on multiple points is an important next step. Moderate to high parent stress

141
affected the two parent management behaviors of routine visits and passive smoke
exposure.
First Pathway: Missed healthcare visits. Stress influences the parent
management behavior of routine visits, with bivariate analysis showing parents with
moderate to high stress were 6.9 times more likely to skip appointments than parents with
low stress (OR=6.9, p=.003) and the multivariate analysis showing parents with moderate
or high stress were 5.3 times more likely to skip an appointment (p=.042). Missing a
child appointment was significantly associated with all of the main outcomes. Missing
appointments was associated with being 55.5% less likely to have more controlled
asthma (OR=.445, 1-.445=.555, p=.018), 4.4 times more likely of having another
symptom day (OR=4.426, p=.018), twice as likely to go to the ED (OR=2.346, p=.017),
and twice as likely to miss school (OR=2.168, p=.021).
As parent stress significantly affects ED visits in the ED model, the ED model
parents missing their child’s routine asthma appointments reduces the role of stress on
ED visits by 5.7%, revealing that stress is a reason why parents miss routine
appointments and influences whether the child goes to the ED for asthma.
Second Pathway: Passive smoke. Parent stress was significant in explaining
passive smoke (OR= 1.65, p=.037). A qualitative study of inner-city parents of children
with asthma noted that parent knowledge related to the harm of passive smoke exposure
for their children with asthma was present, yet their stress—primarily stemming from
financial situations, increased their tobacco use, as well as in the presence of their

142
children. In this analysis, parent stress was partially explained by parent income and
education, which is consistent with these qualitative findings (Table 30).
Stress did not significantly influence parent management of the home
environment in bivariate analysis or have influence on the main outcomes mediated by
home environment in regression analysis (Table 21 and Table 26). The addition of home
environment management of pests in the home, smokers in the home and passive smoke
exposure changed the influence of stress on ED visits by only 3.4% (1-1.832/1.771=.034),
indicating that these do not influence the relationship between parent stress and the
probability of the child going to the ED (Table 26). Parent stress was significant in
explaining passive smoke (OR= 1.65, p=.037) (Table all models), but not explaining
smokers in the home or pests at home. Passive smoke approached significance in
explaining ED visits (Table 26) when controlling for all other demographic and parent
management variables, while smokers in the home and pests were significant in
impacting ED visits (Table 26).
Alternate Pathways to ED visits
Third Pathway: Pests Pathway. As predicted, pests had a positive impact in the
probability of a child going to the ED for asthma (OR= 1.57, p= .000) (Table 26).
However, as mentioned, home environment did not mediate the effect of parent stress on
ED visits (Table 26) and stress did not explain the risk of parents having pests in their
home (Table 34).
Controlling for income, housing type and neighborhood, parents with lower
education still had a higher risk of having pests in their home (Table 34). While education

143
itself may not directly influence action in this area, there may be an element of a sense of
control or proactive action that is missing in this population in order to address this
problem adequately. Parents with lower education were twice as likely to have higher
stress (OR: 2.07,p=.017, Table 18), which could also mean possible lower empowerment
to act or change circumstances. Empowering parents to ask for an AAP and to persist in
extermination or prevention of pests in their home may assist in better outcomes for their
children.
While air pollution’s effect on lung function was mediated by parent stress in
Islam’s study (Islam et al., 2011), none of the environmental exposures at home was
mediated by parent stress in all of the models. Other possible neighborhood
environmental influences such as walking or taking the bus (OR= 1.560816 (p= .033) and
neighborhood maintenance (OR= .58105825, p= .014) were both significantly related to
asthma control, controlling for other demographics and parent management behaviors.
Home environmental exposures were all significantly related to going to the ED, while
pests was also significant in predicting asthma control (OR= 1.6030635, p=.004) (Table
26 and Table 29).
Fourth Pathway: Asthma severity and medication administration (Lack of
Controller Medication Therapy and Lack of Medication Adherence). Children that
were included in the analysis had their asthma diagnosed by a healthcare provider in the
past, not diagnosed at baseline. These healthcare providers in the past, before the child’s
recruitment to the study, must have assessed the child’s asthma symptoms at that time
and likely assigned an asthma severity rating of either intermittent or persistent, in order

144
to determine if the child needs long-term controller medication treatment. Children with
intermittent asthma are not given long-acting medication, but their symptoms will be
reassessed at their next medical visit to see if short-acting medication is sufficient in
controlling the child’s symptoms. However, children with persistent asthma are
prescribed ICS treatment, according to national asthma treatment guidelines (NAEPP
criteria), where symptoms consist of either twice or more days with asthma symptoms per
week, waking up at night due to asthma twice a month or other frequent symptoms. For
those children who were not prescribed ICS controller therapy, it is likely that the child’s
asthma was intermittent at the time and not severe enough to warrant initiation of
medications.
It is likely that children in the study not prescribed ICS, and must have been
thought to have intermittent asthma by their primary care providers, likely requiring ICS
therapy due to the uncontrolled nature of their asthma at baseline and throughout the
study (Table 19c and 19d). The children’s healthcare providers may be unaware of the
child’s uncontrolled asthma due to the low frequency of obtaining information on the
child’s symptoms. Clinic visits are the only current mechanism in the healthcare system
today that primary care providers are informed of the child’s symptoms. However,
parents reporting the child’s symptoms by phone every three months revealed the extent
of each child’s uncontrolled asthma, and this information, if given to healthcare providers,
would likely change their prescription of ICS and teaching of mediation administration
for the children who do have ICS prescribed already.

145
Also, for children who were prescribed ICS medication, this medication was not
administered regularly enough by parents whose children were prescribed ICS and had
ICS in hand to have an effect on the child’s symptoms (Table 19b). An additional
measure of asthma severity are parents who fill the ICS prescription, called ICS in hand,
who likely believe that their child’s asthma is severe enough to have this medication on
hand. These children with more severe asthma whose parents have their ICS medication
in hand were more likely to have very uncontrolled asthma than those who did not (Table
19e). All the children’s asthma in the study was uncontrolled (N=142, 40.5%) or very
uncontrolled (N=208, 59.3%) at some point in the study, except for one child, and points
to insufficient asthma management, including management with medications (Table 16).
Asthma Severity and Medication Administration on the Main Outcomes
Whether the child was ever prescribed an ICS inhaler or the parent had the child’s
ICS inhaler in hand were proxies for the child’s asthma severity. Children with higher
asthma severity measured by parents having ICS on hand were 5.1 times more likely to
bring their children to the ED (p = .000), are 2.3 times more likely to have their child
miss school related to asthma (OR=2.28, p=.000) and 59.4% less likely to have better
asthma control (OR= .4065, 1-.4065=.594, p=.000), controlling for all other variables.
However, regular medication administration by parents had an opposite effect on
these outcomes. Parents who administer ICS medications some days or everyday were
40% less likely to go to the ED (OR=.6012, 1.0-.6012= 0.3988, p=.041) than parents who
administer mediation irregularly or not at all, controlling for asthma severity. Regular
ICS medication administration approached significance when stepped into the asthma

146
control model (OR=1.47, p=.119), but lost significance when other parent management
behaviors were controlled for (Table 29). ICS medication administration was not related
to school absenteeism.
Even though regular medication administration only approached significance in
explaining asthma control, it was significant in explaining ED visits. A possible
explanation is that ED visits is a more refined measure of very uncontrolled asthma or
specifically asthma exacerbations necessitate action by the parent to seek immediate
medical attention. Regular medication administration may prevent a child having an
asthma exacerbation, but not necessarily very uncontrolled asthma symptoms.
Parent stress, medication adherence and ED visits. In bivariate analyses,
parents with moderate to high stress were 58% more likely to have their children take
ICS medications regularly (some days or everyday) (p=.058) (Table 20). Due to this
positive relationship, the effect of taking ICS regularly does strengthen the relationship
between stress and ED visits by 4.7% (1.77/1.689-1) in the multivariate model, with
parents who do give their child asthma medication regularly experience more stress
controlling asthma severity and other demographic variables. In another inner-city
population study, the bivariate analysis showed parent stress was negatively associated
with overall asthma management (r=-.41, p= .006), as well as three subscales, including
medication adherence (r=-.39, p< .01), balanced integration and the child’s response to
symptoms (Celano et al., 2011). These findings could be different because in this
secondary data analysis, the children who took ICS regularly were children with higher
asthma severity. Asthma severity heavily influences medication adherence, with children

147
who have higher asthma severity being 34.8 times more likely to take ICS regularly
(p=.000), controlling for other demographic variables and parent stress (Table of all SMB
models). While taking ICS significantly reduced the chances of the child going to the ED
for asthma (OR= .611, p= .049) controlling for all other variables (Table 20), parent
stress did not influence whether or not the parent gives their child ICS regularly over
asthma severity (Table 31). Asthma severity, not parent stress, had the greatest influence
on medication adherence.
Parent Role in Medication Adherence
In this analysis, 33.9% (N=118) of parents ensured their child took medications
some days or everyday. In multivariate analysis, asthma severity and having an AAP
were associated with medication adherence controlling for demographics. Parents who
had an AAP were 2.6 times more likely to have their child administer their medications
regularly (OR= 2.56, p=.012). In a sample of 30 African American parents and children 6
to 14 years old with asthma, 93% were taking their inhalers on their own yet only 7%
could use a metered dose inhaler correctly (Winkelstein et al., 2000).
Parents who do not supervise their children to administer their medication
regularly or correctly may lack asthma knowledge or self-efficacy related to medication
management. In this secondary analysis, parent asthma knowledge and self-efficacy were
shown to be associated with medication adherence. Parents who had asthma knowledge
were 15.2 times more likely to be adherent (OR=15.2, p=.004); parents who believe they
do not need to continue to administer medications regularly are 96.8% less likely to be
adherent (OR=.035, p=.004). Parent beliefs of medication effectiveness, also known as

148
self-efficacy, related to medication administration, were 3.4 times more likely to be
adherent (OR=3.35, p=.025).
In a primarily Caucasian, moderate-income sample, children who have mothers
with more depressive symptoms were observed to have problems taking medications
(p=.009); they frequently forgot to take medications (p=.005) and forgot to take
medications 2 or more days in the past 2 weeks (p=.014) (Mullins et al., 2011). However,
parent stress of this inner-city population in this analysis approached significance in an
unadjusted analysis (OR=1.58, p=.058, Table 20), yet became insignificant in explaining
medication adherence when controlling for demographics, missed appointments and
asthma knowledge questions (OR= 1.40, p=.360). As this model of medication
administration controlled for many child and parent characteristics that are relevant to
this management behaviors, the relationship between medication administration and
parent stress was mediated by child and parent characteristics, revealing a more accurate
finding. More analyses examining parent psychosocial variables with management
behaviors need to control for relevant characteristics.
Overall, the literature suggests that parents of children with asthma appear to
understand their role in medication administration. In a qualitative study of 18 parents of
children and adolescents with asthma 2-18 years old, parents’ beliefs, knowledge and
attitudes towards anti-inflammatory medication use was explored. Peterson and
colleagues found that parents, commonly mothers, direct the asthma management of their
children, “including medication administration, healthcare provider visits, management
and communication with school and daycare and other activities outside of the home”

149
(Peterson-Sweeney et al., 2003, p.50). A qualitative study using focus groups of 50
middle school children with asthma, with a mean age of 12.5 years (SD= 1.05), explored
asthma management barriers and developmental issues. Ayala and colleagues found that
adolescents were gaining more autonomy in asthma management from parents in the area
of medication management, though parents continued to be involved in reminders to take
medication and other aspects of medication management (Ayala et al., 2006).
Parents who are non-adherent in administering their child’s asthma medications
do not likely realize the importance of their role. A qualitative study examining the
barriers to adherence to guideline-based care found that parents misjudge their child’s
ability to manage their asthma on their own. In a study of 20 parents of children 2-12
years old with asthma, in-depth interviews were performed after one year of
electronically monitored adherence of their child’s medication use (Klok et al., 2014).
Reasons for non-adherence to medications measured objectively by electronic monitoring
were reported as unawareness of non-adherence by parents and healthcare providers, a
lack of parental drive to obtain high adherence and ineffective parent problem solving.
Klok and colleagues found that parents placed excessive responsibility for medication
adherence on children (Klok et al., 2014). Similarly, in a study of 30 African American
caregivers and children 6 to 14 years old with asthma, only 7% had effective metered
dose inhaler skills, yet 93% were taking their inhalers on their own (Winkelstein et al.,
2000). Without parental supervision, these children had inadequate inhalation techniques
(Winkelstein et al., 2000). Parents may be unaware of their child’s medication adherence

150
and may be unaware of their child’s poor inhalation techniques, pointing to the child’s
need for parent directed medication management.
Assisting Parents in Obtaining Asthma Control
Medication administration concerns can be addressed using previously trialed
interventions (Garbutt et al., 2010; Nelson et al., 2011; Sockrider et al., 2006). These
interventions, while not successful in changing ED visits, the asthma counselor
techniques can continue to be used in conjunction with an intervention aimed at
addressing the child’s uncontrolled asthma with treatment monitoring by the PCP.
Tackling the excess burden of uncontrolled asthma could be related to feedback to
the PCP related to the child’s asthma symptoms via using an asthma control score.
Providers may be unaware about how poorly controlled their patient’s asthma is due to
their infrequent visits and snapshots of their patient’s lung function. Providers who
believe the child has intermittent asthma are likely not aware that the child had an asthma
control score at some point throughout the year, putting them at risk for going to the ED
or missing school. Having a way of communicating the child’s symptoms regularly to the
PCP would enable the PCP to make recommendations for the child’s care. Parents could
assess their child’s asthma symptoms at home and report these (either by calling on the
phone, texting, using an app and/or going online) without needing to come to a routine
visit every time, relay information to the clinic regularly, and have suggestions come
back about medication changes.
Also, involving parents in medication management during clinic visits may
increase parent medication administration. An experimental study was conducted in an

151
emergency department with a convenience sample of 86 inner-city children ages 1 to 5
years, with their parents included in hands-on treatment of their children’s asthma
exacerbation in the ED setting (Hussain-Rizvi, Kunkov, & Crain, 2009). Parents were 7.5
times more likely to be using the same treatment device (metered dose inhaler with
spacer) two weeks later than parents who were not included in the treatment (Hussain-
Rizvi et al., 2009). This in-person medication administration intervention involving
parents in the medication domain of management at the clinic may potentially increase
medication administration adherence at home.
Parent and Child Characteristics on Parent Management Behaviors
Aim 3 Analyses and Interpretation of the Findings
Asthma care plan. The secondary analysis revealed that 68.4% of children had
an AAP (N=349). A study on a similar population by Flores and colleagues was 44% of
children had an AAP (N=220). Nationally, the average rate for receiving an AAP is
45.4% for children with active asthma (Control, 2012)
(http://www.cdc.gov/asthma/acbs/table6.htm). While the rate of AAPs is higher in this
secondary analysis than the national average, this sample also has a high rate of
uncontrolled asthma. . Ideally, all of these children would have an AAP in order to make
the treatment plan clear to parents of children with asthma and for parents to recognize
symptoms and use it when their child is having asthma symptoms (Butz et al., 2004). In a
qualitative study of 40 inner-city, minority families who have a child with asthma,
healthcare provider education was reported to focus on medications and not about

152
symptom prevention or self-management (Yoos et al., 1997). In this study, only 8% of
participants had written materials given to them related to their treatment.
In the secondary analysis, parents reporting they have an AAP for their child was
explained by asthma severity and parent education, where children with higher asthma
severity were 2.7 times more likely to have an AAP (OR=2.70, p=.005) and parents who
have more than a high school education being 2.7 times more likely to have an AAP
(OR=2.70, p=.004) (Table 33). Flores and colleagues found in their multivariate analysis
revealed that boys were more likely than girls to have an AAP (OR=1.9, 95% CI=1.1,
3.5) and having an asthma specialist (OR=5.0, 95% CI=2.2, 11.3) controlling for race,
poverty, parent education, and asthma severity. They did not report on parent education
or asthma severity as being significant. The sample was primarily African American
families (81%) with some Latino families (19%), had lower income families (67% below
federal poverty threshold), and had a lower amount of children with AAPs (44%), which
could explain the different associations found. This secondary analysis also adjusted for
additional sociodemographic and home environment variables, such as housing type,
marital status, number of people in the home, insurance type, transportation,
neighborhood, parent stress, asthma severity and missed appointments in the AAP model.
Routine visits. This secondary analysis found that parents of children with
asthma missed their child’s routine visit were 5.9 times more likely to have 5 or more
people in their home (OR=5.89, p=.003), were 6.75 times more likely to live in a less
maintained neighborhood (OR=6.75, p=.001) and 5.3 times more likely to have moderate
to high parent stress (OR=5.34, p=.042). Having multiple family members or children

153
with competing needs, as well as having high stress, reduces a parent’s ability to bring
their child to routine appointments. Living in a less well maintained neighborhood may
indicate lower accessibility to a local clinic for appointments. In another inner-city
sample, Celano and colleagues also found that the number of household members was
negatively associated with asthma management (r=-.42, p=.005), while child age or
gender and parent age, education or marital status were not (Celano et al., 2011).
Tobacco use (passive smoke exposure and smokers in the home). A third of
parents reported their child had passive smoke exposure daily to several times a month
(N=123, 35.0%) and a third reported one or more smokers in their home (N=116, 33.0%)
(Table 17). Parents with moderate to high stress were 60% more likely to expose their
child to passive smoke (OR=1.65, p=.037) than parents with low stress, controlling for
other demographics including income (Table 34). This supports the qualitative study by
Halterman (2007) where stress was a trigger for continued tobacco use by parents of
children with asthma in an inner-city setting (Halterman et al., 2007). Specifically,
financial stress was a trigger for continued tobacco use.
While stress was not significant for explaining smokers in home, health insurance
and parent marital status were significant. Children on Medicaid health insurance were
2.6 times more likely to have smokers in the home (OR=2.6, p=.005). While health
insurance is informative as to the coverage of medical expenses, it is also a proxy for
socioeconomic status with eligibility for coverage in low income populations. Halterman
postulated that it was financial stress that caused smoking in the home (Halterman et al.,
2007), and since this analysis only has information about stress from one parent, it is

154
possible that another parent or family member has stress related to low SES, as measured
by Medicaid coverage, and increases the number of people who smoke in the home. Also,
single parents were 2.1 times more likely to have their child exposed to more smokers at
home (OR=2.08, p=.023) than married parents, controlling for all other demographics.
Single parents may have more stressors or other social reasons for smoking or having
smokers in their homes than parents who are married, giving their child higher risk for
passive smoke exposure.
There also may be underreporting of passive smoke exposure. In a national
sample of inner-city children with asthma, parents report 39% were exposed to smoke,
with 48% of children having high urinary cotinine detected, indicating all of these
children were exposed to high smoke at home (Kattan et al., 1997). This secondary data
analysis did not have an objective measure of tobacco exposure, which is a limitation.
Even with conservative samples, the results models are insightful related to the
associations observed with tobacco exposure.
Pests. 67.2% (N=236) of parents reported at least 1 type of pest in their home.
Parent education, number of people in the home and neighborhood were significantly
related to pest exposure. Parents who lived in a less maintained neighborhood were 80%
(OR=1.79, p=.002) more likely to have pests in the home. Homes with 5 or more people
were 2 times (OR= 2.00, p=.000) more likely to have pests, likely due to less time or
ability to enact on preventive measures to keep a household free of pests. Parents with
higher education were 39.1% less likely to have pests in the home than those who had
lower education (OR=.609, p=.044).

155
While pest elimination is the responsibility of parents, extermination can be
difficult to keep allergen levels low. Gergen and colleagues showed in an inner-city
extermination intervention (NCICAS), extermination only had a short period of
effectiveness and allergen levels remained high enough to cause asthma symptoms in
children with asthma (Gergen et al., 1999). There was poor compliance by families
regarding cleaning instructions. Gergen postulated that without high family or
community support in these changes, there is a low likelihood for change, as well as
higher motivation likely needed to be fostered for these changes (Gergen et al., 1999).
Gergen found that treatment in all rooms would be needed and may need to happen over
time to decrease the allergen levels in the homes (Gergen et al., 1999). Also, prevention
of reinfestation techniques is recommended, especially in apartments or multiple unit
buildings.
Conclusions
The majority of parents of children with asthma (63.5%) in the inner city had
moderate to high stress, which is higher than moderate-income populations. Income and
education were directly related to parent stress in this inner-city population, while asthma
severity was not associated. Parent stress in higher socioeconomic status populations in
other studies was also explained by income and education. This analysis also found that
asthma severity was not significant in explaining parent stress, suggesting that there is
low or no impact of the child’s disease on a parent stress in an inner-city environment.
Also, living in an unmaintained neighborhood approached significance in explaining

156
stress, yet did not show significance over and above a parent’s socioeconomic status and
education level.
Controlling for demographics, parent stress had a direct effect on child ED visits
for asthma, including and not including endogenous variables in the model. Controlling
for all characteristics and mediating variables, children who are racial or ethnic minorities,
parents who drove a car and single parents were more likely to bring their child to the ED
for asthma. Similarly, children who had parents with higher income, were married and
who took public transportation were more likely to have better controlled asthma. Also,
child asthma severity, child asthma control, smokers in the home, pests in the home, and
missed appointments were significant in affecting the probability of children going to the
ED in the final model, controlling for parent, child, and inner-city characteristics and
season. Regular medication administration’s effect on ED visits was mediated by the
parent having an asthma action plan.
Other studies have not examined the pathways of parent stress affecting child
asthma outcomes through parent management behaviors guided by the national child
asthma management guidelines (Program, 2007). Missed appointments and passive
smoke exposure are two prominent pathways that mediated parent stress and child asthma
outcomes. Moderate to high stress in parents lead to parents being more likely to miss
appointments, which was significantly associated with a child going to the ED for asthma,
missing school for asthma and having very uncontrolled asthma. Moderate to high stress
was the only characteristic that was associated with passive smoke exposure in children
and trended on significance in explaining the probability of a child going to the ED for

157
asthma. Other pathways that lead to poor asthma outcomes for children include pests in
the home and irregular medication administration were examined. Exploring the
implications of these findings on practice, future research and policy is an essential step
in reducing costly healthcare services for children with asthma and improving asthma
control.

158
IMPLICATIONS FOR PRACTICE, FUTURE RESEARCH AND POLICY
Implications for Practice
Streamlining the process for rescheduling appointments over the phone may
reduce mothers missing appointments that are critical to prevent child ED visits. Ease of
transfer for rescheduling, electronic programs for after hours scheduling, as well as online
scheduling may assist these groups. Staff that has flexibility built into schedule for ability
to reschedule the same day or in the near future, including an asthma specialist at the
clinic may also be helpful. Parents who take public transportation and have a more
difficult time coming to the clinic may need this assistance Incorporating the parent
management behaviors from the national guidelines into clinician education would assist
in parent’s awareness of the impact these behaviors have on their child’s outcomes or
time spent in the ED. Clinicians need to discuss the home environment exposures that
exacerbate asthma at the visit. Parents need information on how to look for pests and
exterminate adequately. Tailoring this information to parents who are more at risk for
bringing their child to the ED, such as single, minority status mothers, has potential to
enhance treatment compliance in diverse, vulnerable families.
Parents can also be screened for tobacco use during a child’s clinic visit. Parents
can also be screened for stress using the four-item Perceived Stress Scale. Discussing
parent’s concerns and offering resources that may assist in empowering parents to
overcome stress. As a qualitative study of this population revealed, parent behaviors such
as tobacco use often comes from financial stress. Parents can be offered stress

159
management assistance program online and other assistance related to the stressors
parents identify.
Implications for Future Research
Almost two decades ago, a national study for inner-city children with asthma
concluded that more small, in-depth studies needed to be performed to examine the link
between parent asthma management and their psychological difficulties. While this
analysis (SICAS) has assisted in fulfilling this call, more qualitative and quantitative
research is needed.
Empowering mothers, especially those at risk for having higher stress (low
education, low income, and living in a not well maintained neighborhood), and enabling
them to overcome their stress and manage their child’s asthma by keeping preventative
routine healthcare appointments and limiting their child’s passive smoke exposure in
their control is likely to result in improved child asthma outcomes.
Qualitative Research
Understanding the barriers to parents missing appointments, which leads to more
adverse outcomes in asthma control, costly healthcare use and missed school, is
necessary. Parent stress, having a large family, and living in an unmaintained
neighborhood were significant in affecting parents to miss appointments. Asthma
knowledge approached significance in association in the full model of missed
appointments as well. Exploring how this effect missed appointments in a qualitative
study would assist in refining an intervention to address parent stress and missed
appointments.

160
Flores and colleagues found that African American parents were more likely to
use the ED use as usual source of asthma care than Latino parents (OR=3.6, 95% CI=1.7,
7.8), adjusted for child gender, asthma specialist, poverty, caregiver’s educational
attainment, and asthma severity (Flores et al., 2009). A qualitative study of urban parents
of children with asthma revealed barriers to quality asthma care, one of which is a
preference of ED care because of the perceived higher quality of care given (Mansour,
Lanphear, & DeWitt, 2000). Nelson and colleagues hypothesized that a lack of
alternative sources of effective acute management guidance may result in an overreliance
in the ED (Nelson et al., 2009). Parents of children with asthma believed that a “lack of
continuity” among healthcare providers is a barrier to asthma management. Parents who
use urgent care to take care of their child’s asthma problems are more likely to have a
lack of continuity (Buford, 2004, p.159) and this was affirmed in parent’s comments
about urgent care giving a quick treatment, with primary care investigating the treatment
plan (Buford, 2004). Further qualitative work exploring this barrier to keeping asthma
appointments is needed.
Quantitative Research
The interventional studies completed to date with parents of children with asthma
were effective in addressing asthma control, but not ED visits. Parents have not been
commonly included in the asthma management interventions tested in schools. Coffman
and colleagues performed a review of literature on school-based asthma education
programs (Coffman, Cabana, & Yelin, 2009). They found that parents were included in
an intervention in 62% (15/24) of school-based asthma education programs, but had a

161
limited role in and were generally excluded from any education or management
instruction (Coffman et al., 2009). Several types of home interventions focused on
parents of children with asthma.
Lay coaching and telephone coaching interventions of parents of children with
asthma are effective in changing some parent management behaviors, but not child main
outcomes of ED visits or missed school (Garbutt et al., 2010; Nelson et al., 2009; Nelson
et al., 2011; Sockrider et al., 2006). In an educational self-management intervention
performed once in the ED, a tailored AAP and education summary related to medication
administration was performed, which assisted in increasing routine visits but not reducing
ED visits (Sockrider et al., 2006). In an 18 month lay coaching intervention, asthma
management at home was taught, as well as a collaborative relationship with a healthcare
provider was developed, which assisted in increasing routine visits, but not ED visits
(Nelson et al., 2011). A one year telephone coaching intervention that included all parent
management behavior intervention categories except did home environment management
such as tobacco use and pests in the home, did not effect ED visits (Garbutt et al., 2010).
However, this intervention did affect asthma control in children with very poorly
controlled asthma. Gaps noted in these interventions include: 1. None addressed parent
psychosocial factors in their intervention. This secondary analysis reveals that parent
stress directly affects ED visits, as well as routine visits. An intervention for parents of
children with asthma to address their stress is necessary. 2. Not all of the management
behaviors were included in these interventions.

162
One intervention conducted by a highly motivated group did include all of the
parent management behaviors recommended by the national guidelines. The Allergy &
Asthma Network Mothers of Asthmatics (AANMA) launched its Great American
Asthma Challenge (GAAC): Real Strategies for Living and Breathing the NIH
Guidelines program in urban neighborhoods in Baltimore, MD, Chicago, IL, and
Richmond, VA (NHLBI, 2010). This intervention educated patients and families related
to parent management behaviors of controller medication use, AAPs, assessing severity
in clinic, monitory asthma control, schedule routine visits regularly, and control
environmental exposures. These reflect that national guidelines for asthma management.
However, there is no mention of measuring outcomes. Also, tailoring the
intervention to those at highest risk for negative outcomes or addressing parent stress or
self-efficacy is not currently addressed. Potentially modifying this intervention based on
the results of this study and measuring outcomes are feasible next steps.
Parent Stress Intervention. A parent stress intervention for parents of children
with asthma has not been previously tested. Measuring parent stress using the four-item
Perceived Stress Scale in the community or clinic setting is likely feasible. Supporting
their effort to make appointments with primary care or with the asthma specialist should
be key. Schools naturally intake students with asthma, asking for ICS medications and an
AAP for the child. While there is reported low adherence on these actions by parents,
additionally capturing their stress level and tracking the child related to their
appointments would enhance identification of children at risk for going to the ED and
missing school by not keeping appointments.

163
The majority of interventional studies that include parents of children with asthma
are recruited from the clinical or ED setting. However, school interventions, such as
SICAS, are important in elucidating the relationship of all of the exposures in both
settings that affect the child’s asthma outcomes. Healthcare personnel, such as a clinical
nurse specialist, would “intake” children with asthma in the schools at the beginning of
the year by contacting parents over the phone and capturing key information that lead to
ED visits. Parents who have pests in their home, and who do not have in house support in
caring for their child all are at risk to bring their child to the ED. Parents who use public
transportation have a barrier going to the ED. After an assessment of these factors is done,
discussing strategies to overcome these barriers to good asthma care can be conducted
using point-of-care resources. Making these resources available to parents by their child
bringing them home, being available in the school and in the clinic is important, as well
as healthcare professionals discussing them. Motivational interviewing of parents with
stress may be a strategy to assist in finding solutions to working with the stress in a
parent’s life to increase the management behaviors for asthma to be controlled.
Also, parent stress needs to be addressed before first before passive smoke
exposure can be impacted. Parents in this study with smokers in the home were twice as
likely to be single (OR= 2.096, p=.021), controlling for number of people in the home
and other parent characteristics. Single parents were more likely to have a smoker in the
home, so targeting a tobacco cessation intervention to this demographic, which is the
majority of the sample, would assist in tailoring the intervention.

164
Cost Savings
A prospective cost-effectiveness study designed based on the NCICAS study,
revealed that the intervention was more expensive than usual care by $245 per child in
the first year and had a cost of $9.20 per symptom day by the second year, but was cost
saving for children with severe asthma in the second year (Sullivan et al., 2002).
Implications for Policy
Policy implications: The only standardized parent education for asthma in clinical
practices this far is the asthma action plan. However, this is currently not well
disseminated or utilized for communicating messages to parents for adequate asthma
management. There are no asthma management guidelines that mirror the current
national guidelines that parents are made aware of.
Stakeholders who are necessary to support school-aged children with asthma in
the inner city include the parents of the child with asthma, healthcare provider, school
nurse, public health organizations and public health departments. Public health
organizations and public health departments have an interest in seeing asthma rates
improve and their operations or evaluations of asthmatics’ health management are being
affected.
Stakeholder How Affected Related Organizations
Capacity to Address Problem
Motivation to Solve Problem
Child’s parent(s)
Current liaison between PCP and school nurse, also use the plan to treat
Asthma & Allergy Network Mothers of Asthmatics
Low to moderate: one strong group (AANMA), but are not very
Low to moderate: depending on their child’s severity.

165
the child at home. Care deeply about child’s health
(AANMA): the leading national nonprofit organization to reduce asthma prevalence and severity
organized at a state or local level
Primary Care Providers
To fill out AAP and give instruction to family
Health care organizations (ie. Children’s Hospital Boston) and health care plans for reimbursement (ie. Neighborhood Health Plan)
High: strong lobbying support
Low: no incentives or penalties for completing or not completing AAP, but do care about pediatric health
School Nurses To receive the AAP and reinforce explanation to child and family regularly, to use the plan to treat child while at school
National Association of School Nurses, Massachusetts School Nurse Organization
Moderate: fairly organized as a group, but do not have high numbers.
High: strongly affects the care they give and the safety of the children in their school whether or not they have an AAP
School Administration
Support the school nurse with appropriate tools, space and coordination to receive AAPs
National Association of State Boards of Education, Massachusetts Teachers Association
Moderate to High: organized and strong voice
Low: likely not aware of problem with the lack of AAPs, does not directly affect their role
Public Health Organizations
Support the health of the population they are interested in and want to see asthma prevalence decrease
American Lung Association New England, Boston Asthma Initiative
Moderate: known to be focused on issue
High: want to show improvement in outcomes for people with asthma due to their work

166
Public Health Departments
Support the health of the population they are interested in and want to see asthma prevalence decrease
Massachusetts Department of Public Health/School Health Services
High: directly report to government, highly respected
Moderate: many different initiatives they are working on
Figure 12.Childhood Asthma Stakeholder Matrix
There are many different organizations in Massachusetts that have a focus on
asthma care. A stakeholder matrix was developed to understand their interest in asthma
and policy involvement to increase asthma management in the home (Figure 3). If the
organization had a program related to asthma, they were rated with a “high” asthma focus.
Organizations also partner together, such as the American Lung Association and the
Environmental Protection Agency to raise awareness on asthma causes (Environmental
Protection Agency, 2012). Also, the Mass Asthma Action Partnership collaborates with
many of the organizations in the stakeholder matrix to form the Strategic Plan for Asthma
in Massachusetts (Mass Asthma Action Partnership, 2012). This strategic plan includes
working with homes, schools and other settings to improve asthma management for
residents in Massachusetts.
Stakeholder Asthma goals Asthma focus
Policy focus
New England: Regional American Lung Association New England
Asthma services in NE, Asthma Friendly Schools Initiative
High Moderate-High
Environmental Protection Agency, New England Region
Knowledge and awareness for QOL for people with asthma Healthy Communities Grants to test interventions related to home exposures
Moderate Moderate-High

167
Allergy and Asthma Foundation of America New England Chapter
Education, advocacy, speakers, media support for asthma awareness
High Low-Moderate
Massachusetts: State-wide Tobacco Free Massachusetts Coalition
Policy for tobacco free environments
Low High
Neighborhood Health Plan Education and tools for clinicians and patients for asthma management
Low Low
Massachusetts Department of Public Health/School Health Services
School health manual, school nurse role in asthma care
Moderate High
Massachusetts Department of Public Health/Bureau of Environmental Health
Asthma tracking and surveillance in schools- Pediatric Asthma Tracking Program, funded by CDC
Moderate Low
American Lung Association Massachusetts
Asthma services in MA High Moderate
Massachusetts Teachers Association
Union, advocacy Low High
Massachusetts Coalition for Occupational Safety and Health
Training and building alliances
Low-Moderate
High
MASSPIRG Advocacy, organization, litigation
Very Low High
Boston; City-wide Boston Public Health Commission
Asthma Prevention and Control, Healthy Homes Program and statistics for asthma in Boston
High Moderate
Harvard Pilgrim Healthcare Asthma Disease Management Program, asthma nurse educators available
High Low
Children’s Hospital Boston Community Asthma Initiative
High Low
Boston Asthma Initiative Home visits, school-based interventions, community-based forums, and strong ties with local health centers
High Low
Multilateral Health Resources in Action Mass Asthma Action High High

168
Partnership: state-wide partnership between orgs
National Association of State Boards of Education
Green Cleaning for Schools
Low Moderate
Figure 13. Public Health Organizations, Public Health Departments and Professional Organizations Stakeholder Matrix
Preventive Services to Children, Parents and Homes.
The Center for Medicaid and Medicare Services (CMS) updated a regulation (42
CFR section 440.130) for preventive services provided by community health workers or
asthma educators who are referred by a physician or licensed practitioner for
beneficiaries to be reimbursed (Pearson, Goates, Harrykissoon, & Miller, 2014). The
Boston Asthma Home Visit Collaborative offers free home visiting services to Boston
residents. The collaborators include the Boston Public Health Commission, the
Neighborhood Health Plan, Boston Children’s Hospital, Brigham and Women’s Hospital,
and Tufts Medical Center. These home visits are related to asthma management
counseling and home environment assessment.
Gergen and colleagues have noted that extermination in all rooms and over time is
necessary to reduce allergen levels for a clinical impact of reduced symptoms to be
noticed (Gergen et al., 1999). The extent of the home services and asthma counseling
provided in the programs discussed remains to be clarified Measurement of the family’s
compliance to recommendations and effectiveness needs to be measured. Making a
concerted effort for families who have 5 or more members on environmental
recommendations in order to prevent pests is needed. Resources to help parents with the
stressors that affect their perceived stress are often not addressed by stakeholders or in
home visits. Also, tobacco cessation services may be recommended, but effectiveness of

169
these recommendations on outcomes of tobacco cessation and child asthma symptoms is
unknown. Parent stress or financial stress are not currently targeted in these interventions
and appear to be a gap in the interventions, affecting their impact. It is unknown if the
visits assist parents in scheduling or keeping routine appointments or administering their
child’s medications regularly. Testing technology interventions, such a mobile phone
interventions, related to messaging for medication adherence in this population is needed.
Parent and Healthcare Provider Communication. Stakeholder organizations
are beginning to understand the need for communication between primary care providers
in hospitals and health clinics with school nurses. Having routine appointments and an
up- to- date AAP for each child with asthma have potential to are prevent the child going
to the ED, reducing costs related to asthma. This communication process is complex, as
there are multiple steps of communication between these systems to have a form
completed and returned to the nurse. A more accessible electronic medical record for
parents, school nurses and clinics to access for the most up -to -date AAP and technology
to enhance appointment reminders and ease of rescheduling to parent’s phones needs to
be implemented and examined for effectiveness in improving child asthma outcomes.
Limitations
Strengths and Weaknesses. The results of this study may be generalized to
children with asthma in the inner city and their parents. However, parents likely have
increased access to health care due to the high number of hospitals and clinics located in
Boston, compared to other inner-city populations. As this may lend to reduced variability
in measures of children prescribed medications, appointments and ED use, this increased

170
access to care does not detract from the results found in this study. Also, most children
had Medicaid insurance. As Massachusetts has a low rate of uninsured residents and
Medicaid covering asthma medications at no cost to the family (check), there may not be
the same barriers as other states without public insurance or a high uninsured population.
SICAS was recruited at a community level; in the schools, which addresses
NCICAS’s concern of recruiting children with a higher morbidity than the inner-city
population (Kattan et al., 1997). Social desirability may be a problem of the self-report
data obtained from parents in this study. Parent reported symptoms are also less likely to
be reported than the child’s actual asthma symptoms. Kieckhefer and colleagues reported
significant differences between child and parent symptoms and nighttime awakening
reporting, often with parents underreporting symptoms (Kieckhefer & Trahms, 2000).
Therefore, children’s asthma control, which uses parent reported asthma symptoms in its
calculation, may be over-reported.
The order of administration of the SICAS and instruments was in the reverse
order of the conceptual model, asking about symptoms related to asthma control, then
parent management questions and lastly parent perceived stress. This order limits
respondent bias of parents constructing their own impressions of the relationship between
these items.
Coverage Error. Children who may be under-covered in this study include those
who do not attend public school in Boston. Sampling Error. Certain classrooms were
selected for this study based on the rate of returned initial parent surveys. Since this rate
is random by classroom, there is likely no error.

171
Feedback effect. When measuring the effect of parent management behaviors on
asthma control or ED visits, being absolutely certain that asthma control or ED is a
function of management behaviors alone and not the outcomes on management behaviors
is important. Similarly, ED visits should be measured as a function of parent stress and
not include the potential feedback of an ED visit on parent stress. An estimated lag model
was tested in the sensitivity analysis to explore a possible feedback effect of the child’s
outcome on parent management behaviors. However, since parent management behaviors
other than pests in the home and passive smoke exposure were not measured in all time-
points, the feedback effect was not able to be tested for all desired variables in the model.
The full lagged model of the main outcome ED visits with pests in the home, passive
smoke exposure and asthma control only lagged variables was not statistically different
than the reported full model. Ideally, if parent management behaviors were measured in
all time points, then a sequential equation model would be ideal to test the potential
feedback effect.
Conclusion
Marital status, income, child race and transportation were directly related to the
child’s asthma outcomes. The majority of parents of children with asthma (63.5%) in the
inner city had moderate to high stress. Income and education were directly related to
parent stress in this inner-city population, while asthma severity was not associated.
Controlling for demographics, parent stress has a direct effect on child ED visits for
asthma, including and not including endogenous variables in the model. Also, Child
asthma severity, child asthma control, smokers in the home, pests in the home, and

172
missed appointments were significant in the final ED model, controlling for parent, child,
and inner-city characteristics and season. Missed appointments and passive smoke
exposure are two prominent pathways that mediated parent stress and child asthma
outcomes. Other pathways that lead to poor asthma outcomes for children include pests in
the home and irregular medication administration were examined.
Parent stress had both direct and indirect pathways in affecting the main outcome of
children going to the ED for asthma. Parent management behaviors of routine healthcare
appointments and having pests in the home also had a significant impact on this outcome,
controlling for demographics and inner-city characteristics. Implications for practice
include streamlining rescheduling appointments with flexible staff to accommodate
barriers to routine appointments. Also, teaching parents the essential behaviors needed to
prevent undesirable child asthma outcomes, as well as screening for tobacco use. Future
research should focus on exploring the barriers parents have to performing essential
asthma management tasks that lead to better child outcomes quantitatively and
qualitatively, as well as testing a parent stress intervention tailored for inner-city parents
of children with asthma. Lastly, policy implications include partnering with current
efforts of stakeholders who are funding home visits for assistance in controlling the home
environment to positively impact the child’s asthma outcomes.

173
Funding
Financial support was provided by the Jonas Center for Nursing and Veterans
Healthcare for this analysis. The School Inner-City Asthma Study was supported by NIH
grants R01 AI 073964, R01AI 073964-02S1, K24 AI 106822 and U10HL098102 (PI:
Phipatanakul). This work was conducted with the support from Harvard Catalyst/The
Harvard Clinical and Translational Science Center (NIH Award # UL1 TR001102 and
financial contributions from Harvard University and its affiliated academic healthcare
centers. The content is solely the responsibility of the authors and does not necessarily
represent the official views of Harvard Catalyst, Harvard University and its affiliated
academic healthcare centers, the National Center for Research Resources, or the National
Institutes of Health.
This work was conducted with support from Harvard Catalyst, The Harvard Clinical
and Translational Science Center (National Center for Research Resources and the
National Center for Advancing Translational Sciences, National Institutes of Health
Award 1UL1TR001102-01 and financial contributions from Harvard University and its
affiliated academic health care centers). The content is solely the responsibility of the
authors and does not necessarily represent the official views of Harvard Catalyst, Harvard
University and its affiliated academic health care centers, or the National Institutes of
Health
This study was supported by grants R01AI073964, R01AI073964-02S1,
K24AI106822, K23AI106945, K23ES023700, K23AI104780, U10HL098102,
U01AI110397 from the National Institutes of Health. This work was conducted with the

174
support from Harvard Catalyst/The Harvard Clinical and Translational Science Center
(NIH Award # 8UL1TR000170) and financial contributions from Harvard University
and its affiliated academic healthcare centers. The content is solely the responsibility of
the authors and does not necessarily represent the official views of Harvard Catalyst,
Harvard University and its affiliated academic healthcare centers, the National Center for
Research Resources, or the National Institutes of Health CTSU PI (Nagler).

175
REFERENCES
Akinbami, L. (2006). The state of childhood asthma, United States, 1980-2005. Advance
Data, (381), 1–24. Retrieved from http://www.ncbi.nlm.nih.gov/pubmed/17180851
Akinbami, L. J. (2011). Asthma Prevalence , Health Care Use , and Mortality : United
States , 2005 – 2009, (32).
Akinbami, L. J., Moorman, J. E., & Liu, X. (2011). Asthma prevalence, health care use,
and mortality: United States, 2005-2009. National Health Statistics Reports, (32), 1–
14. Retrieved from http://www.ncbi.nlm.nih.gov/pubmed/21355352
Altamimi, S., Robertson, G., Jastaniah, W., Davey, A., Dehghani, N., Chen, R., …
Colbourne, M. (2006). Single-dose oral dexamethasone in the emergency
management of children with exacerbations of mild to moderate asthma. Pediatric
Emergency Care, 22(12), 786–93. doi:10.1097/01.pec.0000248683.09895.08
American Lung Association. (2012). Asthma & Children Fact Sheet. Retrieved from
http://www.lung.org/lung-disease/asthma/resources/facts-and-figures/asthma-
children-fact-sheet.html
Ayala, G. X., Miller, D., Zagami, E., Riddle, C., Willis, S., & King, D. (2006). Asthma in
middle schools: what students have to say about their asthma. The Journal of School
Health, 76(6), 208–14. doi:10.1111/j.1746-1561.2006.00098.x

176
Backer, V., Nepper-Christensen, S., & Nolte, H. (2006). Quality of care in patients with
asthma and rhinitis treated by respiratory specialists and primary care physicians: a
3-year randomized and prospective follow-up study. Annals of Allergy, Asthma &
Immunology : Official Publication of the American College of Allergy, Asthma, &
Immunology, 97(4), 490–6. doi:10.1016/S1081-1206(10)60940-4
Bandura A. (1997). Self-‐efficacy: The exercise of control. New York: WH Freeman Bartlett, S. J., Krishnan, J. A., Riekert, K. A., Butz, A. M., Malveaux, F. J., & Rand, C. S.
(2004). Maternal depressive symptoms and adherence to therapy in inner-city
children with asthma. Pediatrics, 113(2), 229–37. Retrieved from
http://www.ncbi.nlm.nih.gov/pubmed/14754931
Brook, U., Mendelberg, A., & Heim, M. (1993). Increasing parental knowledge of
asthma decreases the hospitalization of the child: a pilot study. The Journal of
Asthma : Official Journal of the Association for the Care of Asthma, 30(1), 45–9.
Retrieved from http://www.ncbi.nlm.nih.gov/pubmed/8428857
Brown, N., Gallagher, R., Fowler, C., & Wales, S. (2010). The role of parents in
managing asthma in middle childhood: An important consideration in chronic care.
Collegian, 17(2), 71–76. doi:10.1016/j.colegn.2010.04.006
Brown, J. V, Avery, E., Mobley, C., Boccuti, L., & Golbach, T. (1996). Asthma
management by preschool children and their families: a developmental framework.
The Journal of Asthma : Official Journal of the Association for the Care of Asthma,
33(5), 299–311. Retrieved from http://www.ncbi.nlm.nih.gov/pubmed/8827937

177
Buford, T. A. (2004). Transfer of asthma management responsibility from parents to their
school-age children. Journal of Pediatric Nursing, 19(1), 3–12. Retrieved from
http://www.ncbi.nlm.nih.gov/pubmed/14963865
Burns, C., Gray, M., & Henry, R. (2008). The development , dissemination and
evaluation of written information as a component of asthma management for parents
of children with asthma, 9–13.
Buske-‐Kirschbaum, A. (2008). Treating the parents to heal the child? Brain Behav
Immun, 22(4), 431-‐432.
Busse, W. W., Morgan, W. J., Gergen, P. J., Mitchell, H. E., Gern, J. E., Liu, A. H., . . .
Sorkness, C. A. (2011). Randomized trial of omalizumab (anti-‐IgE) for asthma
in inner-‐city children. N Engl J Med, 364(11), 1005-‐1015.
Butz, A., Huss, K., Mudd, K., Donithan, M., Rand, C., & Bollinger, M. (2004). Asthma
Management Practices at Home in Young Inner-City Children. Journal of Asthma,
41(4), 433–444. doi:10.1081/JAS-120033985
Butz, A. M., Huss, K., Mudd, K., Donithan, M., Rand, C., & Bollinger, M. E. (2004).
Asthma management practices at home in young inner-city children. The Journal of
Asthma : Official Journal of the Association for the Care of Asthma, 41(4), 433–44.
Retrieved from http://www.ncbi.nlm.nih.gov/pubmed/15281329
Cabana, M. D., Slish, K. K., Lewis, T. C., Brown, R. W., Nan, B., Lin, X., & Clark, N. M.
(2004). Parental management of asthma triggers within a child’s environment. The
Journal of Allergy and Clinical Immunology, 114(2), 352–7.
doi:10.1016/j.jaci.2004.04.047

178
Carpentier, M. Y., Mullins, L. L., Wolfe-Christensen, C., & Chaney, J. M. (2008). The
relationship of parent self-focused negative attributions to ratings of parental
overprotection, perceived child vulnerability, and parenting stress. Families, Systems,
& Health, 26(2), 147-163.
Celano, M., Klinnert, M., Holsey, C., & McQuaid, E. (2011). Validity of the family
asthma management system scale with an urban african-american sample. Journal of
Pediatric Psychology (J PEDIATR PSYCHOL).
Chiang, L.-C., Huang, J.-L., & Lu, C.-M. (2003). Educational diagnosis of self-
management behaviors of parents with asthmatic children by triangulation based on
PRECEDE-PROCEED model in Taiwan. Patient Education and Counseling, 49(1),
19–25.
Chiang, L.-C., Huang, J.-L., Yeh, K.-W., & Lu, C.-M. (2004). Effects of a self-
management asthma educational program in Taiwan based on PRECEDE-
PROCEED model for parents with asthmatic children. The Journal of Asthma :
Official Journal of the Association for the Care of Asthma, 41(2), 205–15. Retrieved
from http://www.ncbi.nlm.nih.gov/pubmed/15115173
Christian, B. J., D’Auria, J. P., & Fox, L. C. (n.d.). Gaining freedom: self-responsibility
in adolescents with diabetes. Pediatric Nursing, 25(3), 255–60, 266. Retrieved from
http://www.ncbi.nlm.nih.gov/pubmed/12024340
Coffman, J. M., Cabana, M. D., & Yelin, E. H. (2009). Do school-based asthma
education programs improve self-management and health outcomes? Pediatrics,
124(2), 729–42. doi:10.1542/peds.2008-2085

179
Cohen, S., Kamarck, T., & Mermelstein, R. (1983). A global measure of perceived stress.
Journal of Health and Social Behavior, 24(4), 385–96. Retrieved from
http://www.ncbi.nlm.nih.gov/pubmed/6668417
Coutinho, M., McQuaid, E., & Koinis-Mitchell, D. (2013). Contextual and cultural risks
and their association with family asthma management in urban children. Journal of
Child Health Care (J CHILD HEALTH CARE).
DeFrances, C. J., Cullen, K. A., & Kozak, L. J. (2007). National Hospital Discharge
Survey: 2005 annual summary with detailed diagnosis and procedure data. Vital and
Health Statistics. Series 13, Data from the National Health Survey, (165), 1–209.
Retrieved from http://www.ncbi.nlm.nih.gov/pubmed/18350768
Derogatis, L. R., & Melisaratos, N. (1983). The Brief Symptom Inventory: an
introductory report. Psychological Medicine, 13(3), 595–605. Retrieved from
http://www.ncbi.nlm.nih.gov/pubmed/6622612
Dinakar, C., Van Osdol, T. J., & Wible, K. (2004). How frequent are asthma
exacerbations in a pediatric primary care setting and do written asthma action plans
help in their management? The Journal of Asthma : Official Journal of the
Association for the Care of Asthma, 41(8), 807–12. Retrieved from
http://www.ncbi.nlm.nih.gov/pubmed/15641630
Eckshtain, D., Ellis, D. A., Kolmodin, K., & Naar-King, S. (2010). The effects of
parental depression and parenting practices on depressive symptoms and metabolic
control in urban youth with insulin dependent diabetes. Journal of Pediatric
Psychology, 35(4), 426–35. doi:10.1093/jpepsy/jsp068

180
Evans, R., Gergen, P. J., Mitchell, H., Kattan, M., Kercsmar, C., Crain, E., . . . Wedner, H. J.
(1999). A randomized clinical trial to reduce asthma morbidity among inner-‐
city children: results of the National Cooperative Inner-‐City Asthma Study. J
Pediatr, 135(3), 332-‐338.
Fawcett, J., & Desanto-‐Madeya, S. (2013).
Contemporary nursing knowledge analysis and evaluation of nursing models a
nd theories (3rd ed.). Philadelphia.: F.A. Davis Co.
Finkelstein, J. A., Fuhlbrigge, A., Lozano, P., Grant, E. N., Shulruff, R., Arduino, K. E., &
Weiss, K. B. (2002). Parent-‐reported environmental exposures and
environmental control measures for children with asthma. Arch Pediatr
Adolesc Med, 156(3), 258-‐264.
Flores, G., Snowden-‐Bridon, C., Torres, S., Perez, R., Walter, T., Brotanek, J., . . .
Tomany-‐Korman, S. (2009). Urban minority children with asthma:
substantial morbidity, compromised quality and access to specialists, and the
importance of poverty and specialty care. J Asthma, 46(4), 392-‐398.
doi:10.1080/02770900802712971
Forbis, S., Rammel, J., Huffman, B., & Taylor, R. (2006). Barriers to care of inner-‐city
children with asthma: school nurse perspective. J Sch Health, 76(6), 205-‐207.
doi:10.1111/j.1746-‐1561.2006.00097.x

181
Fung, V., Graetz, I., Galbraith, A., Hamity, C., Huang, J., Vollmer, W. M., . . . Wu, A. C.
(2014). Financial barriers to care among low-‐income children with asthma:
health care reform implications. JAMA Pediatr, 168(7), 649-‐656.
doi:10.1001/jamapediatrics.2014.79
Friday, G. A., Khine, H., Lin, M. S., & Caliguiri, L. A. (1997). Profile of children
requiring emergency treatment for asthma. Annals of Allergy, Asthma &
Immunology : Official Publication of the American College of Allergy, Asthma, &
Immunology, 78(2), 221–4. doi:10.1016/S1081-1206(10)63391-1
Garbutt, J., Bloomberg, G., Banister, C., Sterkel, R., Epstein, J., Bruns, J., … Wells, S.
(2007). What constitutes maintenance asthma care? The pediatrician’s perspective.
Ambulatory Pediatrics : The Official Journal of the Ambulatory Pediatric
Association, 7(4), 308–12. doi:10.1016/j.ambp.2007.03.007
Garbutt, J. M., Banister, C., Highstein, G., Sterkel, R., Epstein, J., Bruns, J., …
Bloomberg, G. R. (2010). Telephone Coaching for Parents of Children With Asthma,
164(7), 625–630.
Gergen, P. J., Mortimer, K. M., Eggleston, P. A., Rosenstreich, D., Mitchell, H., Ownby,
D., . . . Malveaux, F. (1999). Results of the National Cooperative Inner-‐City
Asthma Study (NCICAS) environmental intervention to reduce cockroach
allergen exposure in inner-‐city homes. J Allergy Clin Immunol, 103(3 Pt 1),
501-‐506.
Global Initiative for Asthma. (2012). Global strategy for asthma management and
prevention.

182
Grineski, S. (2008). Coping with asthma in the central city: parental experiences
with children's health care. J Health Care Poor Underserved, 19(1), 227-‐236.
doi:10.1353/hpu.2008.0025
Gruchalla, R. S., Pongracic, J., Plaut, M., Evans, R., Visness, C. M., Walter, M., …
Mitchell, H. (2005). Inner City Asthma Study: relationships among sensitivity,
allergen exposure, and asthma morbidity. The Journal of Allergy and Clinical
Immunology, 115(3), 478–85. doi:10.1016/j.jaci.2004.12.006
Guyatt, G. H., Juniper, E. F., Griffith, L. E., Feeny, D. H., & Ferrie, P. J. (1997). Children
and adult perceptions of childhood asthma. Pediatrics, 99(2), 165–8. Retrieved from
http://www.ncbi.nlm.nih.gov/pubmed/9024440
Halterman, J. S., Aligne, C. A., Auinger, P., McBride, J. T., & Szilagyi, P. G. (2000).
Inadequate therapy for asthma among children in the United States. Pediatrics,
105(1 Pt 3), 272–6. Retrieved from http://www.ncbi.nlm.nih.gov/pubmed/10617735
Healthy People 2020. (2014). Respiratory Diseases: Asthma. Retrieved June 04, 2014,
from
http://www.healthypeople.gov/2020/topicsobjectives2020/objectiveslist.aspx?topicI
d=36
Hilliard, M. E., Monaghan, M., Cogen, F. R., & Streisand, R. (2011). Parent stress and
child behaviour among young children with type 1 diabetes. Child: Care, Health
and Development, 37(2), 224–32. doi:10.1111/j.1365-2214.2010.01162.x

183
Hullmann, S. E., Wolfe-‐Christensen, C., Ryan, J. L., Fedele, D. A., Rambo, P. L., Chaney, J.
M., & Mullins, L. L. (2010). Parental overprotection, perceived child
vulnerability, and parenting stress: a cross-‐illness comparison. J Clin Psychol
Med Settings, 17(4), 357-‐365. doi:10.1007/s10880-‐010-‐9213-‐4
Hung, C.-C., Chen, Y.-C., Mao, H.-C., & Chiang, B.-L. (2002). Effects of systematic
nursing instruction of mothers on using medication and on health status of asthmatic
children. The Journal of Nursing Research : JNR, 10(1), 22–32. Retrieved from
http://www.ncbi.nlm.nih.gov/pubmed/11923898
Hussain-Rizvi, A., Kunkov, S., & Crain, E. (2009). Does Parental Involvement in
Pediatric Emergency Department Asthma Treatment Affect Home Management?
Journal of Asthma, 46(8), 792–795. doi:10.3109/02770900903104532
Institute of Medicine. (2002). The Future of the Public’s Health in the 21st Century.
Islam, T., Urman, R., Gauderman, W. J., Milam, J., Lurmann, F., Shankardass, K.,
McConnell, R. (2011). Parental stress increases the detrimental effect of
traffic exposure on children's lung function. Am J Respir Crit Care Med, 184(7),
822-‐827. doi:10.1164/rccm.201104-‐0720OC
Kattan, M., Mitchell, H., Eggleston, P., Gergen, P., Crain, E., Redline, S., . . . Wedner, H. J.
(1997). Characteristics of inner-‐city children with asthma: the National
Cooperative Inner-‐City Asthma Study. Pediatr Pulmonol, 24(4), 253-‐262.

184
Joesch, J. M., Kim, H., Kieckhefer, G. M., Greek, A. A., & Baydar, N. (n.d.). Does your
child have asthma? Filled prescriptions and household report of child asthma.
Journal of Pediatric Health Care : Official Publication of National Association of
Pediatric Nurse Associates & Practitioners, 20(6), 374–83.
doi:10.1016/j.pedhc.2006.02.003
Kavanaugh, M., Halterman, J., Montes, G., Epstein, M., Hightower, A., & Weitzman, M.
(2006). Maternal depressive symptoms are adversely associated with prevention
practices and parenting behaviors for preschool children. Ambulatory Pediatrics
(AMBULATORY PEDIATR).
Kieckhefer, G. M. (1988). The meaning of health to 9-, 10-, and 11-year-old children
with chronic asthma. The Journal of Asthma : Official Journal of the Association for
the Care of Asthma, 25(6), 325–33. Retrieved from
http://www.ncbi.nlm.nih.gov/pubmed/3235421
Kieckhefer, G. M., & Trahms, C. M. (n.d.). Supporting development of children with
chronic conditions: from compliance toward shared management. Pediatric Nursing,
26(4), 354–63. Retrieved from http://www.ncbi.nlm.nih.gov/pubmed/12026469
Klinnert, M. D., Kaugars, A. S., Strand, M., & Silveira, L. (2008). Family psychological
factors in relation to children’s asthma status and behavioral adjustment at age 4.
Family Process, 47(1), 41–61. Retrieved from
http://www.ncbi.nlm.nih.gov/pubmed/18411829

185
Klok, T., Lubbers, S., Kaptein, A. A., & Brand, P. L. (2014). Every parent tells a story:
why non-‐adherence may persist in children receiving guideline-‐based
comprehensive asthma care. J Asthma, 51(1), 106-‐112.
La Roche, M. J., Koinis-Mitchell, D., & Gualdron, L. (2006). A culturally competent
asthma management intervention: a randomized controlled pilot study. Annals of
Allergy, Asthma & Immunology : Official Publication of the American College of
Allergy, Asthma, & Immunology, 96(1), 80–5. doi:10.1016/S1081-1206(10)61044-7
Lieu, T. A., Quesenberry, C. P., Capra, A. M., Sorel, M. E., Martin, K. E., & Mendoza, G.
R. (1997). Outpatient management practices associated with reduced risk of
pediatric asthma hospitalization and emergency department visits. Pediatrics, 100(3
Pt 1), 334–41. Retrieved from http://www.ncbi.nlm.nih.gov/pubmed/9282702
Lozano, P., Finkelstein, J. A., Carey, V. J., Wagner, E. H., Inui, T. S., Fuhlbrigge, A. L.,
Weiss, K. B. (2004). A multisite randomized trial of the effects of physician
education and organizational change in chronic-asthma care: health outcomes of the
Pediatric Asthma Care Patient Outcomes Research Team II Study. Archives of
Pediatrics & Adolescent Medicine, 158(9), 875–83. doi:10.1001/archpedi.158.9.875
Manandhar, K., Bajracharya, B. L., Dhakal, S., & Shrestha, M. (2006). Morbidity pattern
of children with asthma: a prospective study. Kathmandu University Medical
Journal (KUMJ), 4(3), 324–8. Retrieved from
http://www.ncbi.nlm.nih.gov/pubmed/18603927

186
Mangione-Smith, R., DeCristofaro, A. H., Setodji, C. M., Keesey, J., Klein, D. J., Adams,
J. L., McGlynn, E. A. (2007). The quality of ambulatory care delivered to children
in the United States. The New England Journal of Medicine, 357(15), 1515–23.
doi:10.1056/NEJMsa064637
Mansour, M. E., Lanphear, B. P., & DeWitt, T. G. (2000). Barriers to asthma care in
urban children: parent perspectives. Pediatrics, 106(3), 512–9. Retrieved from
http://www.ncbi.nlm.nih.gov/pubmed/10969096
Martin, M., Beebe, J., Lopez, L., & Faux, S. (2010). A qualitative exploration of asthma
self-management beliefs and practices in Puerto Rican families. Journal of Health
Care for the Poor and Underserved, 21(2), 464–74. doi:10.1353/hpu.0.0285
Mcquaid, E. L., Walders, N., Kopel, S. J., Ms, C., Fritz, G. K., & Klinnert, M. D. (2005).
Pediatric Asthma Management in the Family Context : The Family Asthma
Management System Scale, 30(6), 492–502.
Milam, J., McConnell, R., Yao, L., Berhane, K., Jerrett, M., & Richardson, J. (2008).
Parental stress and childhood wheeze in a prospective cohort study. The Journal of
Asthma : Official Journal of the Association for the Care of Asthma, 45(4), 319–23.
Modi, A. C., & Quittner, A. L. (2006). Barriers to treatment adherence for children with
cystic fibrosis and asthma: what gets in the way? Journal of Pediatric Psychology,
31(8), 846–58. doi:10.1093/jpepsy/jsj096
Moncrief, T., Beck, A. F., Simmons, J. M., Huang, B., & Kahn, R. S. (2014). Single parent
households and increased child asthma morbidity. J Asthma, 51(3), 260-‐266.

187
Mullins, L. L., Wolfe-‐Christensen, C., Chaney, J. M., Elkin, T. D., Wiener, L., Hullmann, S.
E., . . . Junghans, A. (2011). The relationship between single-‐parent status and
parenting capacities in mothers of youth with chronic health conditions: the
mediating role of income. J Pediatr Psychol, 36(3), 249-‐257.
National Asthma Education and Prevention Program. (2007). Expert Panel Report 3
(EPR-3): Guidelines for the Diagnosis and Management of Asthma-Summary
Report 2007. The Journal of Allergy and Clinical Immunology, 120(5 Suppl), S94–
138. doi:10.1016/j.jaci.2007.09.043
National Cancer Institute. (2005). Theory at a Glance: A Guide for Health Promotion
Practice, 2nd Edition.
National Center for Health Statistics. (2012). Health, United States, 2011: With special
feater on socioeconomic status and health. Hyattsville, MD.
National Center for Health Statistics. (2013). Health, United States, 2012: With special
featur on emergency care. Hyattsville, MD.
Nelson, K. A., Freiner, D., Garbutt, J., Trinkaus, K., Bruns, J., Sterkel, R., … Strunk, R.
C. (2009). Acute asthma management by a pediatric after-hours call center.
Telemedicine Journal and E-Health : The Official Journal of the American
Telemedicine Association, 15(6), 538–45. doi:10.1089/tmj.2009.0005
Nelson, K., Highstein, G., Garbutt, J., Trinkaus, K., Fisher, E., Smith, S., & Strunk, R.
(2011). A randomized controlled trial of parental asthma coaching to improve
outcomes among urban minority children. Archives of Pediatrics & Adolescent
Medicine, 165(6), 520–6. doi:10.1001/archpediatrics.2011.57

188
Orem, D. (1987). Self-‐care and health promotion: Understanding self-‐care (2003 ed.).
New York, NY: Springer.
Pearson, W. S., Goates, S. A., Harrykissoon, S. D., & Miller, S. A. (2014). State-‐based
Medicaid costs for pediatric asthma emergency department visits. Prev
Chronic Dis, 11, E108. doi:10.5888/pcd11.140139
Peterson-Sweeney, K., McMullen, A., Yoos, H. L., & Kitzman, H. (2003). Parental
perceptions of their child’s asthma: management and medication use. Journal of
Pediatric Health Care : Official Publication of National Association of Pediatric
Nurse Associates & Practitioners, 17(3), 118–25. doi:10.1067/mph.2003.31
Phipatanakul, W., Bailey, A., Hoffman, E. B., Sheehan, W. J., Lane, J. P., Baxi, S., …
Gold, D. R. (2011). The school inner-city asthma study: design, methods, and
lessons learned. The Journal of Asthma : Official Journal of the Association for the
Care of Asthma, 48(10), 1007–14. doi:10.3109/02770903.2011.624235
Quinn, K., Kaufman, J. S., Siddiqi, A., & Yeatts, K. B. (2010a). Parent perceptions of
neighborhood stressors are associated with general health and child
respiratory health among low-‐income, urban families. J Asthma, 47(3), 281-‐
289. doi:10.3109/02770901003605324
Quinn, K., Kaufman, J. S., Siddiqi, A., & Yeatts, K. B. (2010b). Stress and the city:
housing stressors are associated with respiratory health among low
socioeconomic status Chicago children. J Urban Health, 87(4), 688-‐702.
doi:10.1007/s11524-‐010-‐9465-‐1

189
Quittner, A. L., Modi, A. C., Lemanek, K. L., Ievers-Landis, C. E., & Rapoff, M. A.
(2008). Evidence-based assessment of adherence to medical treatments in pediatric
psychology. Journal of Pediatric Psychology, 33(9), 916–36; discussion 937–8.
doi:10.1093/jpepsy/jsm064
Qureshi, F., Zaritsky, A., & Poirier, M. P. (2001). Comparative efficacy of oral
dexamethasone versus oral prednisone in acute pediatric asthma. The Journal of
Pediatrics, 139(1), 20–6. doi:10.1067/mpd.2001.115021
Rachelefsky, G. (2003). Treating exacerbations of asthma in children: the role of
systemic corticosteroids. Pediatrics, 112(2), 382–97. Retrieved from
http://www.ncbi.nlm.nih.gov/pubmed/12897291
Ranganathan, S. C., Payne, D. N., Jaffe, A., & McKenzie, S. A. (2001). Difficult asthma:
defining the problems. Pediatric Pulmonology, 31(2), 114–20. Retrieved from
http://www.ncbi.nlm.nih.gov/pubmed/11180686
Rastogi, D., Gupta, S., & Kapoor, R. (2009). Comparison of asthma knowledge,
management, and psychological burden among parents of asthmatic children from
rural and urban neighborhoods in India. The Journal of Asthma : Official Journal of
the Association for the Care of Asthma, 46(9), 911–5.
doi:10.3109/02770900903191323
Reeves, M. J., Bohm, S. R., Korzeniewski, S. J., & Brown, M. D. (2006). Asthma care
and management before an emergency department visit in children in western
Michigan: how well does care adhere to guidelines? Pediatrics, 117(4 Pt 2), S118–
26. doi:10.1542/peds.2005-2000I

190
Ryan, P., & Sawin, K. (2009). The Individual and Family Self-Management Theory:
background and perspectives on context, process, and outcomes. Nursing Outlook
(NURS OUTLOOK).
Sawicki, G. S., Strunk, R. C., Schuemann, B., Annett, R., Weiss, S., & Fuhlbrigge, A. L.
(2010). Patterns of inhaled corticosteroid use and asthma control in the Childhood
Asthma Management Program Continuation Study. Annals of Allergy, Asthma &
Immunology : Official Publication of the American College of Allergy, Asthma, &
Immunology, 104(1), 30–5. doi:10.1016/j.anai.2009.11.004
Sawyer, M. G., Spurrier, N., Whaites, L., Kennedy, D., Martin, A. J., & Baghurst, P.
(2000). The relationship between asthma severity, family functioning and the health-
related quality of life of children with asthma. Quality of Life Research : An
International Journal of Quality of Life Aspects of Treatment, Care and
Rehabilitation, 9(10), 1105–15. Retrieved from
http://www.ncbi.nlm.nih.gov/pubmed/11401043
Scarfone, R. J., & Friedlaender, E. (2003). Corticosteroids in acute asthma: past, present,
and future. Pediatric Emergency Care, 19(5), 355–61. Retrieved from
http://www.ncbi.nlm.nih.gov/pubmed/14578839
Sharp, L. K., Kimmel, L. G., Kee, R., Saltoun, C., & Chang, C. H. (2007). Assessing the
Perceived Stress Scale for African American adults with asthma and low literacy. J
Asthma, 44(4), 311-316.

191
Shegog, R., Bartholomew, L., Parcel, G., MM, S., Masse, L., & Abramson, S. (2001).
Impact of a computer-assisted education program on factors related to asthma self-
management behavior. Journal of the American Medical Informatics Association (J
AM MED INFORM ASSOC).
Shults, J., Ratcliffe, S. J., & Leonard, M. (2007). Improved generalized estimating
equation analysis via xtqls for quasi-‐least squares in Stata The Stata Journal,
7(2), 147-‐166.
Skinner, E. A., Diette, G. B., Algatt-‐Bergstrom, P. J., Nguyen, T. T., Clark, R. D., Markson,
L. E., & Wu, A. W. (2004). The Asthma Therapy Assessment Questionnaire
(ATAQ) for children and adolescents. Dis Manag, 7(4), 305-‐313.
doi:10.1089/dis.2004.7.305
Smith, S. R., Jaffe, D. M., Fisher, E. B., Trinkaus, K. M., Highstein, G., & Strunk, R. C.
(2004). Improving follow-up for children with asthma after an acute Emergency
Department visit. The Journal of Pediatrics, 145(6), 772–7.
doi:10.1016/j.jpeds.2004.08.029
Sockrider, M. M., Abramson, S., Brooks, E., Caviness, A. C., Pilney, S., Koerner, C., &
Macias, C. G. (2006). Delivering Tailored Asthma Family Education in a Pediatric
Emergency Department Setting : A Pilot Study. doi:10.1542/peds.2005-2000K
Sullivan, S. D., Weiss, K. B., Lynn, H., Mitchell, H., Kattan, M., Gergen, P. J., . . .
Investigators, N. C. I.-‐C. A. S. N. (2002). The cost-‐effectiveness of an inner-‐city
asthma intervention for children. J Allergy Clin Immunol, 110(4), 576-‐581.

192
Szabó, A., Mezei, G., Kovári, E., & Cserháti, E. (2010). Depressive symptoms amongst
asthmatic children’s caregivers. Pediatric Allergy and Immunology : Official
Publication of the European Society of Pediatric Allergy and Immunology, 21(4 Pt
2), e667–73. doi:10.1111/j.1399-3038.2009.00896.x
Szefler, S. J., Phillips, B. R., Martinez, F. D., Chinchilli, V. M., Lemanske, R. F., Strunk,
R. C., … Taussig, L. M. (2005). Characterization of within-subject responses to
fluticasone and montelukast in childhood asthma. The Journal of Allergy and
Clinical Immunology, 115(2), 233–42. doi:10.1016/j.jaci.2004.11.014
Toelle, B. G., & Ram, F. S. F. (2004). Written individualised management plans for
asthma in children and adults. The Cochrane Database of Systematic Reviews, (2),
CD002171. doi:10.1002/14651858.CD002171.pub2
Van Es, S. M., Nagelkerke, A. F., Colland, V. T., Scholten, R. J., & Bouter, L. M. (2001).
An intervention programme using the ASE-model aimed at enhancing adherence in
adolescents with asthma. Patient Education and Counseling, 44(3), 193–203.
Retrieved from http://www.ncbi.nlm.nih.gov/pubmed/11553420
Vollmer, W. M. (2004). Assessment of asthma control and severity. Annals of Allergy,
Asthma & Immunology : Official Publication of the American College of Allergy,
Asthma, & Immunology, 93(5), 409–13; quiz 414–6, 492. doi:10.1016/S1081-
1206(10)61406-8

193
Wade, S., Weil, C., Holden, G., Mitchell, H., Evans, R., Kruszon-Moran, D., … Wedner,
H. J. (1997). Psychosocial characteristics of inner-city children with asthma: a
description of the NCICAS psychosocial protocol. National Cooperative Inner-City
Asthma Study. Pediatric Pulmonology, 24(4), 263–76. Retrieved from
http://www.ncbi.nlm.nih.gov/pubmed/9368260
Whittemore, R., Jaser, S., Chao, A., Jang, M., & Grey, M. (2012). Psychological
experience of parents of children with type 1 diabetes: a systematic mixed-studies
review. The Diabetes Educator, 38(4), 562–79. doi:10.1177/0145721712445216
Williams, S. G., Schmidt, D. K., Redd, S. C., & Storms, W. (2003). Key clinical activities
for quality asthma care. Recommendations of the National Asthma Education and
Prevention Program. MMWR. Recommendations and Reports : Morbidity and
Mortality Weekly Report. Recommendations and Reports / Centers for Disease
Control, 52(RR-6), 1–8. Retrieved from
http://www.ncbi.nlm.nih.gov/pubmed/12696781
Winkelstein, M. L., Huss, K., Butz, A., Eggleston, P., Vargas, P., & Rand, C. (2000).
Factors associated with medication self-‐administration in children with
asthma. Clin Pediatr (Phila), 39(6), 337-‐345.
Wisnivesky, J. P., Lorenzo, J., Feldman, J. M., Leventhal, H., & Halm, E. A. (2010). The relationship
between perceived stress and morbidity among adult inner-city asthmatics. J Asthma, 47(1), 100-104.
Wolf, F. M., Guevara, J. P., Grum, C. M., Clark, N. M., & Cates, C. J. (2003).
Educational interventions for asthma in children. The Cochrane Database of
Systematic Reviews, (1), CD000326. doi:10.1002/14651858.CD000326

194
Wong, G. C., Bernaards, C. A., Berman, B. A., Jones, C., & Bernert, J. T. (2004). Do
children with asthma and their parents agree on household ETS exposure?
Implications for asthma management. Patient Educ Couns, 53(1), 19-‐25.
doi:10.1016/S0738-‐3991(03)00123-‐X
Wood, R. A., Bloomberg, G. R., Kattan, M., Conroy, K., Sandel, M. T., Dresen, A., . . .
Gern, J. E. (2011). Relationships among environmental exposures, cord blood
cytokine responses, allergy, and wheeze at 1 year of age in an inner-city birth cohort
(Urban Environment and Childhood Asthma study). J Allergy Clin Immunol, 127(4),
913-919.e911-916.
World Health Organization. (2007). Global surveillance, prevention and control of
chronic respiratory diseases: a comprehensive approach. Geneva: World Health
Organization. Retrieved from
http://www.who.int/gard/publications/GARD_Manual/en/
World Health Organization. (2013). Asthma. Retrieved from
http://www.who.int/mediacentre/factsheets/fs307/en/
Wright, R. J., Cohen, S., Carey, V., Weiss, S. T., & Gold, D. R. (2002). Parental stress as a
predictor of wheezing in infancy: a prospective birth-‐cohort study. Am J
Respir Crit Care Med, 165(3), 358-‐365. doi:10.1164/ajrccm.165.3.2102016
Wright, R. J., Mitchell, H., Visness, C. M., Cohen, S., Stout, J., Evans, R., & Gold, D. R.
(2004). Community violence and asthma morbidity: the Inner-‐City Asthma
Study. Am J Public Health, 94(4), 625-‐632.

195
Yang, B.-H., Chen, Y.-C., Chiang, B.-L., & Chang, Y.-C. (2005). Effects of nursing
instruction on asthma knowledge and quality of life in schoolchildren with asthma.
The Journal of Nursing Research : JNR, 13(3), 174–83. Retrieved from
http://www.ncbi.nlm.nih.gov/pubmed/16237629
Yawn, B. P., Brenneman, S. K., Allen-Ramey, F. C., Cabana, M. D., & Markson, L. E.
(2006). Assessment of asthma severity and asthma control in children. Pediatrics,
118(1), 322–9. doi:10.1542/peds.2005-2576
Yoos, H. L., Kitzman, H., Henderson, C., Mcmullen, A., Jill, K. S., & Elizabeth, S. H.
(2007). in Childhood Asthma, 56(3), 167–174.

196
Table 1. Instruments for Measuring Asthma Management
Instrument Studies Reporting use
Other Domains Covered
# Of Items Most Relevant Population Instrument Validated In and Administration Type
Purpose of Instrument in Studies
Education Domain Satisfaction with Information about Medications Scale
(Horne, 2001)
Medications, and Assessment & Monitoring Domain
16 items Likert 5-point scale.
Asthmatic adults who were either inpatient or outpatient. No severity rating. In person.
Assess the extent to which patients feel they have received enough information about prescribed medications.
Asthma Illness Representation Scale
(Yoos, 2003) (Yoos, 2007) (Sidora-Arcoleo, 2008)
Medications, and Assessment & Monitoring Domain
39 items Likert 5-point scale. 3 sections.
Parents of children with asthma from clinical practice settings. Moderate minority representation with primarily mild to moderate persistent asthma. Over the phone and in person.
To identify at-risk populations and circumstances for underutilization of anti-inflammatory medications, and designed to capture both the professional and lay representations of asthma.
Beliefs about Medications Questionnaire
(Conn 2007) (Yilmaz 2012) (Horne, 1999)
Medications, and Assessment & Monitoring Domain
18 items Likert 5-point scale. Two domains.
Parents of children with asthma who have primary care. Low minority representation and primarily moderate asthma. Over the phone and in person.
How much a parent feels a medication is necessary to maintain their child’s health, and concern, which includes concerns about dependency and adverse effects.
Treatment Satisfaction Questionnaire for Medication
(Atkinson, 2004)
Medications, and Assessment & Monitoring Domain
14 items Likert 7-point scale.
Adults with asthma from home. Done electronically.
To assess patient’s satisfaction with various medications designed to treat, control or prevent a wide variety of medical conditions.
Medications Domain The Medication Adherence Scale
(Conn, 2007)
Assessment & Monitoring Domain
8 items Likert 7-point scale.
Parents of children with asthma from primary care. Low minority representation and primarily moderate to severe asthma. Over the phone.
Measures adherence to daily preventive asthma medication use by parent report.
The Risks for Nonadherence Scale
(Adams, 2007) (Bauman 2002)
Education, and Assessment & Monitoring Domain
13 items Dichotomous Yes/No.
Primary caregivers of children with asthma 3-17 years old from community health clinics and emergency departments. Large minority representation. Asthma severity evenly
A summary score of characteristics of a child’s regimen and characteristics of the caregiver or child that is related to

197
distributed. In person, self-administered.
nonadherence.
Disease Management Interview-Asthma
Modi, 2006)
28 Items Parents of children with asthma and children with asthma ages 6 to 13 were interviewed. Children who used daily medications.
Used to calculate rates of self-reported adherence to medical treatment regimens.
Assessment and Monitoring Domain Asthma Management Questionnaire
(Spurrier, 2005)
None. 49 items Likert 6-point scale. 5 scenarios.
Parents of school-aged children with asthma who were admitted to a hospital within the last 2 years for asthma. Administered during home visit.
Measure the range of behaviors that parents use when their children either develop asthma symptoms or are at risk of developing asthma symptoms.
Asthma Control Test
(Adams, 2007)
Medications Domain
5 items Likert 5-point scale.
Primary caregivers of children with asthma 3-17 years old from community health clinics. Large minority representation. Asthma severity evenly distributed. Manually filled out form.
Measure individuals’ control over their asthma symptoms, activity restriction, shortness of breath, use of rescue medications and self-rating of Asthma Control in the past 4 weeks.
Childhood Asthma Control Test
(Yavuz, 2012)
None 3 items for parents, 4 items for children. Close-ended questions.
Parents of children with asthma and children with asthma from a hospital visit. Primarily mild intermittent to moderate persistent asthma and a homogenous population from Turkey. In person.
Determine the disease control levels of children with asthma.
Asthma Control Questionnaire
(Honkoop 2013) (Juniper, 1999)
Medications Domain
6 items Likert 6-point scale.
Adult asthmatics from community and asthma clinics. Primarily Caucasian sample with varying amounts of severity. Filled out online and also by interviewer.
Identifying patients at risk and for evaluating the effects of treatment.
Family Asthma Management System Scale
(Walker, 2010) (McQuaid 2005)
Education, Medications, and Environmental Domains
8 subscales 9-point scale, rated by researcher. Semi-structured interview.
Parents of children with asthma from asthma and allergy clinics and the community. Primarily Caucasian and mild to moderate asthma severity In person, administered by researcher.
Assesses different domains of family asthma management behaviors.
Environmental Domain Home Environmental Control Inventory
(Tzeng 2010)
None 42 items. Unknown scale. Five domains.
Parents of children with asthma from medical centers. Moderate to severe asthma. In person.
Measure the control of environmental asthma triggers.

198
Control Measures Pediatric Asthma Health Outcome Measure
(Gerald, 2012)
Assessment & Monitoring Domain
3 items 2 dichotomous and 1 ordinal.
Parents of children with asthma from asthma clinics. Primarily minority representation and primarily mild to moderate asthma. In person.
Designed to measure quality-adjusted life years (QALY) in children with asthma, as a multi-attribute outcome measure.
Asthma Therapy Assessment Questionnaire
(Skinner, 2004)
Assessment & Monitoring, Medications, and Education Domains
20 items Dichotomous Yes/No.
Parents of children with asthma from large managed care organizations that had two or more visits in the past year. Primarily Caucasian representation and most with worsened asthma in the last six months. Survey.
Identify indicators of potential care problems in several categories, including symptom control, behavior and attitude barriers, and communication gaps.
CAN Questionnaire
(Perez-Yarza, 2009)
Assessment & Monitoring Domain
9 items Likert 5-point scale.
Parents of children with asthma from hospital outpatient clinics. Children with moderate to severe asthma. In person, self-administered.
To assess asthma control in children with asthma.
Self-Management Behavior Attributes Pediatric Asthma Caregivers Quality of Life Questionnaire
(Juniper, 1996)
Assessment and Monitoring Domain
13 items Likert 7-point scale. Two domains: emotional function and activities.
Parents of children with asthma from clinics and the community. In person, self-administered.
Measure the areas of function important to the primary caregivers of children with asthma.

199
Table 2. Child and Parent Demographic Questions
Question Child race C28. How would you describe [CHILD]'s race, nationality, or ethnic background (check all that apply)
00 White 01 Black 02 Hispanic [ask C28a] 03 Haitian/Creole 04 Asian 05 Native American 06 Mixed, Specify _________________________________ 07 Other, Specify __________________________________
Household employment and Household Income C33. How many adults in the home have a regular paying job now? C34. What is the total annual household income during [LAST CALENDAR YEAR] from all sources before taxes of everyone in [CHILD]’s home? Please point to the answer closest to the household annual income. [PLEASE USE CUE CARD]
1 > $95,000 7 = $35,000 to $44,999 2 = $85,000 - $94,999 8 = $25,000 to $34,999 3 = $75,000 - $84,999 9 = $15,000 to $24,999 4 = $65,000 to $74,999 10 = < $15,000 5 = $55,000 to $64,999 99 Don’t know 6 = $45,000 to $54,999 77 Refuse to say
Housing C2. Does [CHILD] live in a: One-family house detached from any other house…...1 One-family house attached to one or more houses…...2 Building with 2-3 apartments (multi family house)…..3 Building with 4 or more apartments………………….4 Other………………………………………………….5 C2a. Please specify other:___________________ Don’t know…………………………………………..99
Neighborhood Housing T1a. Are the houses in the

200
neighborhood well maintained? 0 Definitely Yes
1 Mainly Yes 2 Mainly No 3 Definitely No 7 Refused to say 9 Don’t Know
Transportation D1. What method of transportation does [CHILD] usually use to go to school?
Personal car………………1 City bus ………………….2 School bus………………..3 Light rail………………….4 Metro/ subway…………....5 Motorcycle………………..6 Bicycle…………………....7 Walk……………………....8 Other……………………...9 Specify: a.__________________________
Marital Status C32. What is your current marital status? [PROMPT IF NECESSARY.]
Married .................................. 1 Divorced ................................ 2 Single .................................... 3 Widowed ............................... 4 Separated ............................... 5
Other……………………6 Specify:______________________ Number of People in the Home, Number of Children, Number of Adults C26. How many people live in [CHILD]'s home, including [CHILD] and you?
[The respondent should be included, if appropriate.] C26a. How many of these household members are children? (less than 18 years old)
C26b. How many of these household members are adults? (18 years and over)?
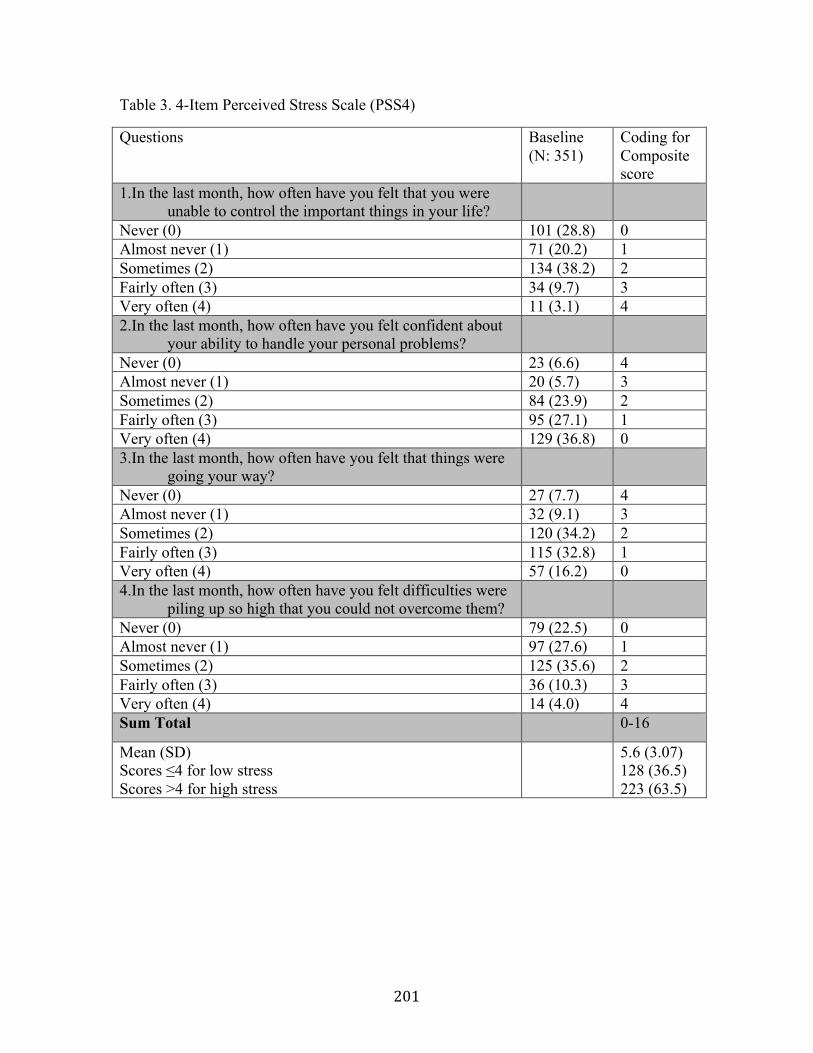
201
Table 3. 4-Item Perceived Stress Scale (PSS4)
Questions Baseline (N: 351)
Coding for Composite score
1.In the last month, how often have you felt that you were unable to control the important things in your life?
Never (0) 101 (28.8) 0 Almost never (1) 71 (20.2) 1 Sometimes (2) 134 (38.2) 2 Fairly often (3) 34 (9.7) 3 Very often (4) 11 (3.1) 4 2.In the last month, how often have you felt confident about
your ability to handle your personal problems?
Never (0) 23 (6.6) 4 Almost never (1) 20 (5.7) 3 Sometimes (2) 84 (23.9) 2 Fairly often (3) 95 (27.1) 1 Very often (4) 129 (36.8) 0 3.In the last month, how often have you felt that things were
going your way?
Never (0) 27 (7.7) 4 Almost never (1) 32 (9.1) 3 Sometimes (2) 120 (34.2) 2 Fairly often (3) 115 (32.8) 1 Very often (4) 57 (16.2) 0 4.In the last month, how often have you felt difficulties were
piling up so high that you could not overcome them?
Never (0) 79 (22.5) 0 Almost never (1) 97 (27.6) 1 Sometimes (2) 125 (35.6) 2 Fairly often (3) 36 (10.3) 3 Very often (4) 14 (4.0) 4 Sum Total 0-16
Mean (SD) Scores ≤4 for low stress Scores >4 for high stress
5.6 (3.07) 128 (36.5) 223 (63.5)

202
Table 4. Environmental Management Questions
Question Baseline Passive smoke exposure C21, D1. How frequently is your child around people who are smoking? Would you say…
Never (0) 74/351 (21.1) Rarely (1) 17 (4.8) Several times a month (2) 32 (9.1) Several times a week (3) 119 (33.9) Daily (4) 109 (31.0) People Smoking in Home C22. How many people who live in [CHILD]'s home smoke? continuous Pests in Home C15a-d (baseline: past 12 months), D3. Have you seen any of the following in your
home in the past 3 months? (Yes = 1; No = 0)
a. Cockroaches 76/351 (21.6) b. Bed bugs 24 (6.9) c. Mice 177 (50.6) d. Lady bugs 59 (16.8)

203
Table 5. Medication Management Questions
Questions Prescribed ICS K3. Has [CHILD] ever had a prescription for an asthma drug that is not used for quick relief? This drug would be used to control asthma. Yes (1) or No (0) Take ICS medication K3a. If yes, how does [CHILD] take this drug now?
Never took it…………………………………0 Only takes it when having symptoms………..1 Used to take it, but not now………………….2 Takes it some days, but not other days………3 Takes it everyday…………………………….4
ICS medication in hand K1. During the past 12 months, did [CHILD] take any medicines for asthma? Yes (1) or No (0) Name
K1a1.__________________________

204
Table 6. Assessment and Monitoring Management Questions
Question Baseline Barrier to having appointment L12. Many people have problems making and keeping doctor's appointments for their child's asthma. Sometimes appointments are hard to get or people have to wait a long time. Sometimes it is hard to get to the office or they are not open at good times.
In the past 3 months, have you had any problems making or keeping appointments for [CHILD]’s asthma?
Yes (1) or No (0)
44/351 12.54
L12a. In the past 3 months, have you missed any appointments or chosen not to make one because of these problems?
Yes (1) or No (0)
24/44 54.55

205
Table 7. Educational Management Questions
Question Baseline Asthma Action Plan K11. Has a doctor or health care provider ever given you separate written instructions, not including prescriptions, explaining what to do when [CHILD] starts wheezing?
Yes (1) or No (0)
226/349 (64.8)

206
Table 8. Asthma Knowledge Questions
Question Baseline Child Asthma Knowledge K7. Do you believe [CHILD] is able to take his/her asthma drug(s) as directed?
Yes (1), No (0), Don’t know (0) 296/351(84.33)
Parent Asthma Knowledge K8. Do you believe the drug(s) [CHILD] takes can control his/her asthma?
Yes (1), No (0), Don’t know (0) 294/351(83.76)
L7. There are times when people think the child is all better before finishing the prescription. In the past 3 months, have you thought [CHILD]’s asthma was better before finishing the prescription? Yes (1) or No (0)
137/296 (46.3)
Self-efficacy (related to mediations) L8. Some families feel that the asthma medications do not really work. In the past 3 months, have you felt this way? Yes (1) or No (0)
60/306 (19.6)
Child Refuses Medications L4. Sometimes families have trouble giving asthma medicines because the child refuses to take the medicine. Sometimes it's because the child is too busy playing or the medicine tastes bad or makes him/her feel funny. In the past 3 months, has this ever been a problem in your family? Yes (1) or No (0), or NA (missing)
40/312 (12.8)

207
Table 9. School’s Role in Asthma Management
Question Baseline School’s Role in Asthma Management K15. Have you had any problems in the past 12 months in dealing with [CHILD]’s taking medications at school? Yes (1) or No (0), Doesn't Take Meds at School or Don’t now (missing)
46/285 (16.1)

208
Table 10. Emergent or Unscheduled Visit Outcome Score
Question Baseline Emergent or Unscheduled Visit Outcome Score J7, H5.Not counting hospitalizations, during the past 3 months did [CHILD] see a doctor or health care provider for any reason? Include visits to an emergency room, a doctor's office, or a clinic. Yes (1) or No (0)
0 or 1
J7a. How many times? _____Visits ≥0 J7c. Was that visit for asthma or another reason? [1=Asthma, 2= Pneumonia, 3=Respiratory (lung) infection, 4= Influenza, 5= anaphylaxis (life threatening reaction to food) 0=Other]
0 - 5
J7d. Was that an appointment that was scheduled at a clinic/ dr. office at least 24 hours ahead or was it an emergency visit at an ER, clinic, or dr. office?
Clinic/ Dr. office, schedule (1), Clinic/ Dr. office, unscheduled (2), ER (3).
1 - 3

209
Table 11. Asthma Therapy Assessment Questionnaire (ATAQ) Control Section
Question Baseline Coding for Composite score
Asthma Therapy Assessment Questionnaire (ATAQ) Control Composite score 1. In the past 4 weeks, did [CHILD] 1a. Have wheezing or difficulty breathing when exercising?
Yes (1) or No (0)
161/348 (46.3)
0 or 1
1b. Have wheezing during the day when not exercising? Yes (1) or No (0)
74/348 (21.3)
0 or 1
1c. Wake up at night with wheezing or difficulty breathing? Yes (1) or No (0)
111/349 (31.8)
0 or 1
1d. Miss days of school because of his/her asthma? Yes (1) or No (0)
58/349 (16.6)
0 or 1
1e. Miss any daily activities because of his/her asthma? Yes (1) or No (0)
66/351 (18.8)
0 or 1
7. How would you rate you/ your child's asthma control during the past 4 weeks? Not controlled at all (0)
4/343 (1.2)
1
Poorly controlled (1) 5 (1.5) 1 Somewhat controlled (2) 78 (22.7) 1 Well controlled (3) 161 (46.9) 0 Completely controlled (4) 95 (27.7) 0 6a. Think about how the inhaler / nebulizer was used in the past 4 weeks. What was the highest number of times in one day it was used? 0 times (0)
4/176 (2.3)
0
1 to 2 times (1) 103 (58.5) 0 3 to 4 times (2) 62 (35.2) 0 5 to 6 times (3) 4 (2.3) 1 Over 6 (4) 3 (1.7) 1 Sum Total 0-7 Reverse Code Sum Total (Highest score = Good Control) Mean (SD)
0-7 3.9 (1.38)

210
Table 12. National Asthma Education and Prevention Program (NAEPP) Guideline Assessing Asthma Control
Well Controlled Not Well Controlled
Very Poorly Controlled
NAEPP Guidelines
Symptoms ≤2 days/week but not more than once on each day
>2 days/week or multiple time on ≤ 2 days/week
Throughout the day
Nighttime awakenings
≤1x/month ≥2x/month ≥2x/week
Interference with normal activity
None Some limitation Extremely limited
Short-acting beta2 agonist use for symptom control
≤2 days/week >2 days/week Several times per day
Lung Function • FEV1 or
peak flow • FEV1 /FVC
>80% >80%
60-80% 75-80%
<60% <75%
This analysis’s variables used
Symptoms Once or twice a week (H4 0,1)
Three to six times a week, Once a day (H4 2,3)
More than once a day (H4 4)
Nighttime awakenings
Not at all (H5 0)
Once or twice (H5 1)
Two to three nights a week, Four or more nights a week (H5 2,3)
Interference with normal activity
None of the time, a little of the time (H2 0,1)
Some of the time (H2 2)
Most of the time, all of the time (H2 3,4)
Short-acting beta2 agonist use for symptom control
Once or less, Two to three times a week (H6 0,1)
Four to six times a week (H6 2,3)
Once or twice per day, three or more times per day (H6 4,5)
Lung Function • FEV1 or
peak flow • FEV1 /FVC
unknown unknown unknown

211
Table 13. National Asthma Education and Prevention Program (NAEPP) Guideline Asthma Control Composite Score
Question Baseline Coding for Composite score
National Asthma Education and Prevention Program (NAEPP) Guideline H4. During the past 4 weeks, how often has [CHILD] had shortness of breath?
Not at all (0) 169/343 (49.3)
2
Once or twice a week (1) 131 (38.2) 2 Three to six times a week (2) 25 (7.3) 1 Once a day (3) 9 (2.6) 1 More than once a day (4) 9 (2.6) 0 H5. During the past 4 weeks, how often did [CHILD’s] asthma symptoms (wheezing, coughing, shortness of breath, chest tightness or pain) wake him/her up at night or earlier than usual in the morning?
Not at all (0) 189/348 (54.3)
2
Once or twice (1) 112 (32.2) 1 Two to three nights a week (2) 35 (10.1) 0 Four or more nights a week (3) 12 (3.4) 0 H2. In the past 4 weeks, how much of the time did [CHILD’s] asthma keep him/ her from getting as much done at school or home as he/she would like?
None of the time (0) 204/347 (58.8)
2
A little of the time (1) 99 (28.5) 2 Some of the time (2) 35 (10.1) 1 Most of the time (3) 6 (1.7) 0 All of the time (4) 3 (0.9) 0 H6. During the past 4 weeks, how often has [CHILD] used his/her rescue inhaler or nebulizer medication (such as albuterol)?
Not at all (0) 176/348 (50.3)
2
Once a week or less (1) 93 (26.6) 2 Two to three times a week (2) 40 (11.4) 1G Four to six times a week (3) 10 (2.9) 1 Once or twice per day (4) 25 (7.1) 0 Three or more times per day (5) 6 (1.7) 0

212
Table 14. Missed School Outcome Score
Questions Range Baseline Score Missed School Outcome Score I1, H2. In the past 3 months, how many days did [CHILD] miss school due to asthma? _____ Days
≥0
146/351 (41.6)
0= no missed school, 1= missed school due to asthma in the last 3 months

213
Table 15. Variable Description Summary Table
Variable Acronym Description Type Measurement Child Characteristics Child age Child age in years continuous range: 4-13 Child gender Child gender dichotomous 1= male, 2=female Child race or ethnic group
Child race or ethnic group
Categorical (0-4) 0= white, 1= African American, 2= Hispanic, 3= mixed race, 4= other
Child race Child race or ethnic group
dichotomous 0= white, 1= minority
Child health insurance
Child’s health insurance
dichotomous 0=Private, other 1= Medicaid or Medicaid Managed Care
Prescribed an ICS controller inhaler
Prescribed ICS inhaler dichotomous 0=not prescribed, 1=prescribed ICS
Parent Characteristics
Parent gender Parent gender dichotomous 1= male, 2=female Parent race or ethnic group
Parent race or ethnic group
Categorical (0-4) 0= white, 1= African American, 2= Hispanic, 3= mixed race, 4= other
Parent race Parent race or ethnic group
dichotomous 0= white, 1= minority
Household income Parent income dichotomous 0=<$25,000, 1= ≥$25,000 Employed Household
employment dichotomous 0=no regularly employed people
in the home, 1=at least 1 regularly employed
Employed or <$25,000 household income
Household SES dichotomous
Parent education Parent education dichotomous 0=did not complete high school, 1= completed
Housing: apartment building
Housing type Dichotomous 0=house, 1= apartment building
Parent marital status Parent marital status Dichotomous 0=married, 1=single People in Home Number of people
living in home Dichotomous 0=family of four people, 1=5 or
more people Take the bus or walk Transportation Dichotomous 0=child is driven by car, 1= child
takes public transportation or walks
Asthma knowledge Asthma knowledge Dichotomous Lack asthma self-efficacy
Dichotomous 1= parent stops medications early

214
Has an ICS controller inhaler
ICS medication brought with parent or “in hand”
Dichotomous 1= parent has child’s treatment, 0= parent does not have child’s treatment
Parent Stress Parent stress PSS4 Continuous Range: 0-16 Parents with moderate to high perceived stress
PSS4 Dichotomous 0= PSS4 score 0-4 for low stress, 1= PSS4 score 5-16 for moderate to high stress
Parent Management Administer ICS med some days or everyday
Dichotomous 1= takes some days or everyday
Smoker(s) in home Smokers in home Dichotomous 1= at least one smoker in the home
Passive smoke exposure
Passive smoke exposure
Dichotomous 1= child was exposed to smoke in the last month
Pests in home Pests reported in home Dichotomous 1= at least one type of pest in the home
Missed healthcare appointments
If parent skipped routine appointment
Dichotomous 1= if parent skipped a routine appointment
Asthma action plan If parent has an asthma action plan
Dichotomous 1= if parent has an asthma action plan
Outcomes ED visits ED visits for asthma Categorical ED visits dichotomous
ED visits for asthma Dichotomous 0= no ED visits, 1= ED visit
Maximum ED visits dichotomous
ED visits for asthma Dichotomous 0= no ED visits, 1= ED visit in any of the follow-ups
School absenteeism/missed school
Missed school related to asthma
Dichotomous 0= did not miss school related to asthma, 1= missed school in last 3 months
Maximum missed school
Missed school related to asthma
Dichotomous 0= no missed school in any follow-ups, 1= missed school in any of the follow-ups
ATAQ Child Asthma Control
ATAQ Control domain
Continuous (0-7) 0=poor control, 7= good control
ATAQ Child Asthma Control, categorical
ATAQ Control domain in categories
Categorical (0-2) 2=no control problems 1= control problems, 0= control problems with unscheduled visit
Very uncontrolled asthma
ATAQ Control domain in very uncontrolled and better controlled categories
Dichotomous 0= Very uncontrolled asthma, 1= Better controlled asthma

215
Table 16. Characteristics of School-‐aged Participants (N=351) Child Characteristic % (N=351) Exogenous Variables Mean child age (SD) 7.9 years (1.88) Ages 4-6 years 27.1 Ages 7-13 years 72.9 Child Gender: Male 53.0 Child Race or Ethnic Group
White 4.3 Black 34.2 Hispanic 37.9 Other 23.6
Child Race or Ethnic Group: Minority 95.7 Health Insurance: Medicaid, Medicaid Managed Care 74.6 Ride public transportation, bike or walk to school 68.1 Prescribed an ICS Controller Inhaler 62.2 Has an ICS Controller Inhaler 52.1 Outcomes Very uncontrolled asthma (ATAQ) 40.5 Unscheduled asthma visit to ED or UC 47.7 School absenteeism related to asthma 65.5 Notes: N=351 unless otherwise specified Source: Boston Children’s Hospital’s SICAS baseline data, follow-up data used to create max variables for the three outcomes. All variables had <1% missing, except for health insurance (2.6%)

216
Table 17. Characteristics of Parent Participants (N=351)
Parent Characteristic % (N=351)* Exogenous Variables Parent Gender: Female 97.7 Parent Race: Minority 93.4 Parent Education: Parent completed high school 80.9 Employed or <$25,000 household income 76.9 Parents with Moderate to High Perceived Stress (PSS) 63.5 Housing: apartment building 37.7 Neighborhood: Not well maintained 20.9 Marital status: parent not married 70.1 People in Home: >4 people 38.8 Asthma knowledge 83.8 Lack asthma self-efficacy 19.6 Stop medications early 46.3 Asthma Management Behaviors Several times a month to daily passive smoke exposure 35.0 Smoker(s) in home 33.0 Have at least 1 type of pest in the home 67.2 Cockroaches (C15a) 21.6 Bed bugs 6.9 Mice or rats 50.6 Lady bugs 17.4 Administer ICS med some days or everyday 33.9 Missed Healthcare Appointments 6.84 Asthma action plan 64.8 Notes: N=351 unless otherwise specified Source: Boston Children’s Hospital’s SICAS baseline data * all Ns had <2% missing, except for neighborhood (7.4%), asthma knowledge (8.6%) and asthma self-efficacy (12.8%) and stopping medications early (15.7%)

217
Table 18. Child and Parent Characteristics by Parent Stress (N=351)
Parents with Low Stress (N=128) %
Parents with Moderate to High Stress (N=223) %
Odds Ratio* (95% CI)
p values**
Child age, 4-6 years old 31.2 24.7 0.181 7-13 years old 68.8 75.3 Child gender: Female 46.9 47.1 0.970 Parent Gender: Male 0 3.6 0.030 Parent Race: Minority 92.1 94.2 0.458 Employed or ≥$25,000 income 84.4 72.7 0.49 (0.28-0.86) 0.013 Parent Education: completed high school
87.5 77.1 0.48 (0.26-0.89) 0.019
Housing: apartment building 32.8 40.5 0.151 Marital status: parent not married 34.4 27.4 0.167 People in Home: >4 people 42.2 36.8 0.316 Insurance: Medicaid, Medicaid Managed Care
70.6 76.8 0.203
Transportation: Ride public transportation, bike or walk to school
64.1 70.4 0.220
Neighborhood: Not well maintained 15.8 23.9 1.67 (0.93-3.00) 0.084 ICS prescribed 59.1 64.0 0.363 ICS in hand 50.0 53.4 0.544 Asthma knowledge 95.0 89.5 0.44 (0.17-1.14) 0.083 Asthma self-efficacy 16.2 21.5 0.260 Notes: Source: Boston Children’s Hospital baseline SICAS data * calculated only if Pearson’s Chi-squared showed a significant relationship. Did not control anything else. ** all Ns had <2% missing, except for insurance (2.6%), neighborhood (7.4%), asthma knowledge (8.6) and asthma self-efficacy (12.8%)

218
Table 19. Inhaled Corticosteroid (ICS) Decision Tree Tables Table 19a: Prescribed ICS and ICS in hand No ICS in hand ICS in hand total Not prescribed ICS 120 (90.91) 12 (9.09) 132 (37.82) Prescribed ICS 47 (21.66) 170 (78.34) 217 (62.18) total 167 (47.85) 182 (52.15) 349, p=.000 Notes: Source: Boston Children’s Hospital SICAS data, baseline data Table 19b: Prescribed ICS, ICS in hand and Medication Administration Does not
take ICS Administers with symptoms
Administers some days
Administers everyday
Total (col%)
Not prescribed ICS No ICS in hand 120 (90.91) 120 (90.91)
ICS in hand 12 (9.09) 12 (9.09) 132 (100) 132 Prescribed ICS No ICS in hand 30 (65.22) 8 (17.39) 2 (4.35) 6 (13.04) 46 (21.30) ICS in hand 15 (8.82) 45 (26.47) 15 (8.82) 95 (55.88) 170
(78.70) p=0.000 45 (20.83) 53 (24.54) 17 (7.87) 101 (46.76) 216 Notes: Source: Boston Children’s Hospital SICAS data, baseline data Table 19c: Asthma Control and ICS Prescribed at Baseline Very
Uncontrolled Uncontrolled Controlled Total
Not prescribed ICS ICS (lower severity)
18 13.64 107 81.06 7 5.30 132 37.82
Prescribed ICS (higher severity)
48 22.12 161 74.19 8 3.69 217 62.18
66 18.91 268 76.79 15 4.30 349 p = 0.127
Notes: Source: Boston Children’s Hospital SICAS data, baseline data
Table 19d: Asthma Control and ICS Prescribed at Baseline and all Follow-ups
Very Uncontrolled
Uncontrolled Controlled Total
Not prescribed ICS (lower severity)
61 11.87 435 84.63 18 3.50 514 38.22
Prescribed ICS 157 18.89 369 76.90 35 4.21 831 61.78

219
(higher severity) 218 16.21 1074 79.85 53 3.94 1,345 Pr =
0.002 Notes: Source: Boston Children’s Hospital SICAS data, baseline data
Table 19e: Asthma Control and ICS in Hand at Baseline
Very Uncontrolled
Uncontrolled Controlled Total
No ICS in hand (lower severity)
20 11.90 138 82.14 10 5.95 168 47.86
ICS in hand (higher severity)
47 25.68 131 71.58 5 2.73 183 52.14
67 19.09 296 76.64 15 4.27 351 p = 0.002
Notes: Source: Boston Children’s Hospital SICAS data, baseline data

220
Table 20. Parent Stress and Asthma Knowledge by Parent Management Behaviors
Parent Asthma Knowledge Did not Skip Appointments
Skipped Appointments
Odds Ratio* (95% CI)
p values**
Moderate to high stress 201 61.47 22 91.67 6.9 (1.59-29.83) 0.003 Child refuses to take medication 35 12.11 5 21.74 0.184 Child can take medications correctly 275 88.71 21 91.30 0.702 Asthma knowledge 277 92.64 17 77.27 0.27 (0.09-0.80) 0.018 Asthma action plan 212 65.03 14 60.87 0.686 Stop medications early 125 45.79 12 52.17 0.555 Lack asthma knowledge 54 19.08 6 26.09 0.416 No ICS on hand ICS on hand Moderate to high stress 104 61.90 119 65.03 0.544 Child refuses to take medication 16 11.85 24 13.56 0.655 Child can take medications correctly 134 88.74 162 89.01 0.938 Asthma knowledge 127 86.99 167 95.43 3.12 (1.32-7.36) 0.009 Asthma action plan 85 51.20 141 77.05 3.20 (2.02-5.07) 0.000 Stop medications early 58 47.54 79 45.40 0.716 Lack asthma knowledge 22 16.92 38 21.59 0.309 Does not take
ICS some or everyday
Takes ICS some or everyday
Moderate to high stress 138 60.00 83 70.34 1.58 (0.98-2.54) 0.058 Child refuses to take medication 24 12.57 16 13.56 0.800 Child can take medications correctly 189 88.32 104 89.66 0.713 Asthma knowledge 183 88.41 108 97.30 4.72 (1.39-16.05) 0.013 Asthma action plan 124 54.39 99 83.90 4.37 (2.51-7.62) 0.000 Stop medications early 95 53.98 40 34.19 0.44 (0.27-0.72) 0.001 Lack asthma knowledge 31 51.7 29 48.3 0.084 No Asthma
Action Plan Asthma Action Plan
Moderate to high stress 78 63.41 143 63.27 0.979 Child refuses to take medication 16 16.84 24 11.16 0.169 Child can take medications correctly 93 84.55 201 90.95 0.082 Asthma knowledge 94 88.68 198 92.96 0.196 Stop medications early 40 43.96 95 46.80 0.651 Lack asthma knowledge 17 18.48 43 20.28 0.716 Notes: Source: Boston Children’s Hospital SICAS baseline and follow-up data. Odds ratio displayed only with significant p-values from Pearson chi-squared relationships. * calculated only if Pearson’s Chi-squared showed a significant relationship. Did not control anything else. Odds ratios are explaining very uncontrolled asthma. ** all Ns had <2% missing, except for child can take asthma medications correctly (5.1%), less asthma knowledge (8.6%), child refuse to take medication (11.1%), lack asthma knowledge (12.8%), stop medications early (15.6%)

221
Table 21. Parent and Home Environment Characteristics by Environmental Management Behaviors
Home Environment Variable No Passive Smoke
Passive Smoke Exposure
Odds Ratio* (95% CI)
p values**
Live in an apartment building 63 31.82 69 45.39 0.009 Neighborhood not well maintained 35 18.82 33 23.74 0.280 5 or more people in home 83 41.92 53 34.64 0.165 2 or more children living in home 161 81.31 123 80.39 0.828 2 or more adults in Home 130 65.66 93 60.78 0.347 Employed or <$25,000 income 38 19.19 43 28.10 0.61 (0.37-1.00) 0.050 Parent did not complete high school 34 17.17 33 21.57 0.299 Moderate to high stress 120 60.61 130 67.32 0.195 No People who
Smoke in Home People who Smoke in Home
Live in an apartment building 91 38.72 41 35.65 0.578 Neighborhood not well maintained 42 19.35 26 24.07 0.325 5 or more people in home 86 36.60 50 43.10 0.239 2 or more children living in home 186 79.15 98 84.48 0.232 2 or more adults in Home 142 60.43 81 69.83 1.52 (.94-2.44) 0.086 Not employed or <$25,000 income 51 21.70 30 25.86 0.384 Parent did not complete high school 41 17.45 26 22.41 0.265 Moderate to high stress 146 62.13 77 66.38 0.436 No Pests in
Home Pests in Home
Live in an apartment building 25 34.25 107 38.63 0.492 Neighborhood not well maintained 4 5.56 64 25.30 5.76 (2.02-
16.41) 0.001
5 or more people in home 17 23.29 119 42.81 2.46 (1.36-4.46) 0.003 2 or more children living in home 52 71.23 232 83.45 2.04 (1.12-3.70) 0.020 2 or more adults in Home 41 56.16 182 65.47 0.142 Not employed or <$25,000 income 13 17.81 68 24.46 0.230 Parent did not complete high school 11 15.07 56 20.14 0.326 Moderate to high stress 46 63.01 177 63.67 0.918 Notes: Source: Boston Children’s Hospital SICAS baseline and follow-up data. Odds ratio displayed only with significant p-values from Pearson chi-squared relationships. * calculated only if Pearson’s Chi-squared showed a significant relationship. Did not control anything else. Odds ratios are explaining very uncontrolled asthma. ** all Ns had <1% missing except for neighborhood not well maintained (7.4%)

222
Table 22. Child and Parent Characteristics by Having an Asthma Action Plan
No Asthma Action Plan
Asthma Action Plan
Odds Ratio* (95% CI)
p values**
Child age, 4-6 years old 33 26.83 62 27.43 0.904 7-13 years old 90 73.17 164 72.57 Parent Race (Minority) 114 92.68 211 93.78 0.694 Not employed or <$25,000 income 94 76.42 175 77.43 0.830 Parent Education: Parent did not complete high school
34 27.64 32 14.16 2.32 (1.34-4.00) 0.002
Medicaid, Medicaid Managed Care
96 80.00 157 71.36 0.62 (0.36-1.06) 0.081
Notes: Source: Boston Children’s Hospital SICAS baseline and follow-up data. Odds ratio displayed only with significant p-values from Pearson chi-squared relationships. * calculated only if Pearson’s Chi-squared showed a significant relationship. Did not control anything else. Odds ratios are explaining very uncontrolled asthma. ** all Ns had <1% missing except for Medicaid or Medicaid Managed Care Child Health Insurance (3.1%)

223
Table 23. Child and Parent Characteristics, AMBs and Child Asthma Outcomes by Emergency Visits for Asthma
Variable No ED visit 186, (53.0%)
ED visit 165 (47.0%)
Odds Ratio* (95% CI)
p values**
Sociodemographics Child Age, M (SD), y M: 8.2 SD: 1.8 M: 7.6 SD: 1.9 351 4-6 years old 40 21.51 55 33.33 7-13 years old 146 78.49 110 66.67 0.54 (0.34-0.88) 0.013 Child Gender 98 52.69 88 53.33 0.904 Child Race or Ethnic Group 0.222 White 11 5.91 4 2.42 Black 57 30.65 63 38.18 Hispanic 71 38.17 62 37.58 Other 47 25.27 36 21.82 Parent Gender (Male) 3 1.65 5 3.07 0.382 Parent Race White 18 9.68 5 3.05 Minority 168 90.32 159 96.95 3.41 (1.24-9.39) 0.018 Employed 135 74.18 120 74.53 0.940 Parent Income 0.814 ≥$25,000 77 49.36 68 50.75 0.814 Employed or ≥$25,000 annual household income
143 76.88 127 76.97 0.984
Not employed or <$25,000 income
43 23.12 38 23.03 0.984
Parent Education Parent did not complete high school
40 21.51 27 16.36 0.221
Parent completed high school 146 78.49 138 83.64 Current Health Insurance 0.613 Private insurance 46 25.14 41 25.79 Medicaid, Medicaid Managed Care
137 74.86 118 74.21 0.613
Live in an apartment building 73 39.46 59 35.76 0.476 Homes in neighborhood not well maintained
36 21.18 32 20.65 0.906
Parent not married 124 66.67 122 73.94 0.137 2-4 People living in home 115 61.83 100 60.61 0.815 5 or more people in home 71 38.17 65 39.39 2 or more children living in home 149 80.11 135 81.82 0.684 Parent Perceived Stress Measures
Parent Perceived Stress Score of 0-4 (Low stress) 76 40.86 52 31.52 -- Score of 5+ (Moderate to high stress)
110 59.14 113 68.48 1.50 (0.97-2.33) 0.069
Parent Management Behaviors Ride public transportation, bike or walk to school
136 73.12 103 62.42 0.61 (0.39-0.96) 0.033
Prescribed ICS 99 53.51 118 71.95 2.23 (1.42-3.48) 0.000 ICS in hand 75 40.32 108 65.45 2.80 (1.82-4.33) 0.000

224
Taking ICS med some days or everyday
56 30.27 62 38.04 0.127
Several times a month to daily passive smoke
66 35.48 57 34.55 0.854
Have at least 1 pest in the home 144 77.42 134 81.21 0.382 Smokers in home 67 36.02 49 29.70 0.209 No Skipped Appointments 176 94.62 151 91.52 0.249 Skipped appointments 10 5.38 14 8.48 Child refuses to take medication 15 9.68 25 15.92 0.099 Child can take medications correctly
147 87.50 149 90.30 0.416
Asthma knowledge 150 91.46 144 91.72 0.934 Asthma action plan 118 63.78 108 65.85 0.686 Stop medications early 65 44.22 72 48.32 0.479 Lack asthma knowledge 21 13.91 39 25.16 2.08 (1.16-3.74) 0.014 Knowledgeable 130 86.09 116 74.84 School problem with child’s med 16 10.74 30 22.06 2.35 (1.22-4.54) 0.011 No problem 133 89.26 106 77.94 Asthma Control Measures No Control Problems 12 6.45 3 1.82 0.032 Uncontrolled asthma 174 93.55 162 98.18 ATAQ Better Asthma Control 127 68.65 81 49.09 0.44 (0.28-0.68) 0.000 Outcomes Missed school 98 52.69 132 80.00 3.59 (2.23-5.79) 0.000 Notes: Source: Boston Children’s Hospital SICAS baseline and follow-up data. Odds ratio displayed only with significant p-values from Pearson chi-squared relationships. * calculated only if Pearson’s Chi-squared showed a significant relationship. Did not control anything else. Odds ratios are explaining very uncontrolled asthma. ** all Ns had <1% missing except for child gender (1.8%), employed (2.3%), income (17.4%), Medicaid or Medicaid Managed Care Child Health Insurance (3.1%), neighborhood (7.4%), asthma knowledge (8.6%) and asthma self-efficacy (12.8%) and stopping medications early (15.7%)

225
Table 24. Child and Parent Characteristics, AMBs and Child Asthma Outcomes by Missed School due to Asthma
Variable No Missed School 121, (34.47 %)
Missed School 230 (65.5%)
Odds Ratio* (95% CI)
p values**
Sociodemographics Child Age, M (SD), y M: 8.2 SD: 1.8 M: 7.6 SD: 1.9 4-6 years old 28 23.14 67 29.13 0.230 7-13 years old 93 76.86 163 70.87 Child Gender 55 45.45 110 47.83 0.672 Child Race or Ethnic Group
White 6 4.96 9 3.91 0.341 Black 46 38.02 74 32.17 Hispanic 38 31.40 95 41.30 Other 31 25.62 52 22.61
Parent Gender (Male) 2 1.71 6 2.63 0.590 Parent Race 0.391 White 6 5.00 17 7.39 Minority 114 95.00 213 92.61 0.391 Employed 93 78.81 162 72.00 0.170 Parent Income 0.710 ≥$25,000 48 48.48 97 50.79 Employed or ≥$25,000 annual household inco
98 80.99 172 74.78 0.189
Not employed or <$25,000 income
23 19.01 58 25.22 0.189
Parent Education Parent did not complete high school
25 20.66 42 18.26 0.587
Parent completed high school 96 79.34 188 81.74 Current Health Insurance 0.951
Private insurance 30 25.64 57 25.33 Medicaid, Medicaid Managed Care
87 74.36 168 74.67 0.951
Live in an apartment building 43 35.54 89 38.86 0.541 Homes in neighborhood not well maintained (T1aDI)
19 17.12 49 22.90 0.224
Parent not married 83 68.60 163 70.87 0.979 2-4 People living in home 74 61.16 141 61.30 0.754 5 or more people in home 47 38.84 89 38.70 0.754 2 or more children living in home 99 81.82 185 80.43
Parent Perceived Stress Measures Parent Perceived Stress
Score of 0-4 (Low stress) 48 39.67 80 34.78 0.366 Score of 5+ (Moderate to high stress)
73 60.33 150 65.22
Parent Management Behaviors Ride public transportation, bike or walk to school
91 75.21 148 64.35 0.60 (0.36-0.97) 0.038
Prescribed ICS 66 55.00 151 65.94 1.58 (1.01-2.49) 0.046 ICS in hand 50 41.32 133 57.83 1.95 (1.24-3.04) 0.003

226
Not taking ICS med or not taking regularly
83 69.17 147 64.47 0.379
Taking ICS med some days or everyday
37 30.83 81 35.53 0.379
Several times a month to daily passive smoke
45 37.19 111 48.26 1.75 (1.11-2.76) 0.015
Have at least 1 pest in the home 89 73.55 189 82.17 1.66 (0.98-2.81) 0.060 Smokers in home 31 25.62 85 36.96 1.70 (1.04-2.77) 0.033 Skip Appointments 7 5.79 17 7.39 0.571 No skipped appointments 114 94.21 213 92.61 Child refuses to take medication 7 6.93 33 15.64 2.49 (1.06-5.84) 0.031 Child can take medications correctly 96 86.49 200 90.09 0.324 Asthma knowledge 100 94.34 194 90.23 0.212 Asthma action plan 75 61.98 151 66.23 0.430 Stop medications early 40 43.48 97 47.55 0.516 Lack asthma knowledge 11 11.46 49 23.33 2.35 (1.16-4.76) 0.017 Knowledgeable 85 88.54 161 76.67 School problem with child’s med 11 11.96 35 18.13 0.185 Asthma Control Measures No Control Problems 5 4.13 10 4.35 0.924 Uncontrolled asthma 116 95.87 220 95.65 ATAQ Better Asthma Control 112 92.56 96 41.92 0.06 (0.03-0.12) 0.000 Outcomes Unscheduled asthma visit 33 27.27 132 57.39 3.6 0.000 88 72.73 98 42.61 Notes: Source: Boston Children’s Hospital SICAS baseline and follow-up data. Odds ratio displayed only with significant p-values from Pearson chi-squared relationships. * calculated only if Pearson’s Chi-squared showed a significant relationship. Did not control anything else. Odds ratios are explaining very uncontrolled asthma. ** all Ns had <1% missing except for child gender (1.8%), employed (2.3%), income (17.4%), Medicaid or Medicaid Managed Care Child Health Insurance (3.1%), neighborhood (7.4%), asthma knowledge (8.6%) and asthma self-efficacy (12.8%) and stopping medications early (15.7%)

227
Table 25. Child and Parent Characteristics, AMBs and Child Asthma Outcomes by Asthma Control
Variable Very uncontrolled asthma 142, (40.6%)
Better controlled Asthma 208 (59.4%)
Odds Ratio* (95% CI)
p values**
Sociodemographics Child Age, M (SD), y 4-6 years old 40 28.17 55 26.44 0.721 7-13 years old 102 71.83 153 73.56 Child Gender: Female 59 41.55 105 50.48 0.100 Male 83 58.45 103 49.52 1.44 (0.94-2.22) Child Race or Ethnic Group 0.999
White 6 4.23 9 4.33 Black 49 34.51 71 34.13 Hispanic 53 37.32 79 37.98 Other 34 23.94 49 23.56
Parent Gender (Male) 3 2.16 5 2.44 0.865 Parent Race 0.246 White 12 8.45 11 5.31 Minority 130 91.55 196 94.69 0.246 Employed 97 70.29 157 76.96 0.166 Parent Income 0.503 ≥$25,000 56 47.46 88 51.46 Employed or ≥$25,000 annual household inco
101 71.13 168 80.77 -- 0.036
Not employed and <$25,000 income
41 28.87 40 19.23 1.72 (1.04-2.83) 0.036
Parent Education Parent did not complete high school
32 22.54 35 16.83 0.183
Parent completed high school 110 77.46 173 83.17 Current Health Insurance 0.317
Private insurance 31 22.63 56 27.45 Medicaid, Medicaid Managed Care
106 77.37 148 72.55 0.317
Live in an apartment building 55 39.01 76 36.54 0.640 Homes in neighborhood not well maintained
42 31.11 26 13.68 0.35 (0.20-0.61) 0.000
Parent not married 110 77.46 136 65.38 0.54 (0.33-0.88) 0.013 2-4 People living in home 82 57.75 133 63.94 0.242 5 or more people in home 60 42.25 75 36.06 0.242 2 or more children living in home
109 76.76 174 83.65 0.107
Parent Perceived Stress Measures
Parent Perceived Stress 0.508 Score of 0-4 (Low stress) 49 34.51 79 37.98 Score of 5+ (Moderate to high stress)
93 65.49 129 62.02
Parent Management Behaviors

228
Ride public transportation, bike or walk to school
91 64.08 147 70.67 0.194
Prescribed ICS 96 68.09 120 57.97 0.65 (0.42-1.02) 0.062 ICS in hand 86 60.56 96 46.15 0.56 (0.36-0.87) 0.008 Not taking ICS med or not taking regularly
87 61.70 142 68.93 0.163
Taking ICS med some days or everyday
54 38.30 64 31.07 0.163
Several times a month to daily passive smoke
70 49.30 82 39.42 0.68 (0.44-1.04) 0.076
Have at least 1 pest in the home 121 85.21 156 75.00 0.52 (0.31-0.92) 0.021 Smokers in home 54 38.03 61 29.33 0.69 (0.44-1.08) 0.078 Skip Appointments 16 11.27 8 3.85 0.31 (0.13-0.75) 0.010 Child refuses to take medication 26 19.55 14 7.87 0.35 (0.17-0.70) 0.003 Child can take medications correctly
122 85.92 173 83.17 0.489
Asthma knowledge 120 84.51 173 83.17 0.740 Asthma action plan 90 63.83 135 65.22 0.790 Stop medications early 54 41.54 82 49.70 0.163 Lack asthma knowledge 34 25.76 26 15.03 0.51 (0.29-0.90) 0.019 School problem with child’s med 31 25.00 15 9.38 .0.31 (0.16-0.60) 0.001 Outcomes Unscheduled asthma visit 84 59.15 81 38.94 0.000 58 40.85 127 61.06 -- Missed school 133 93.66 96 46.15 0.06 (0.03-0.12) 0.000 9 6.34 112 53.85 Notes: Source: Boston Children’s Hospital SICAS baseline and follow-up data. Odds ratio displayed only with significant p-values from Pearson chi-squared relationships. * calculated only if Pearson’s Chi-squared showed a significant relationship. Did not control anything else. Odds ratios are explaining very uncontrolled asthma. ** all Ns had <1% missing except for child gender (1.8%), employed (2.3%), income (17.4%), Medicaid or Medicaid Managed Care Child Health Insurance (3.1%), neighborhood (7.4%), asthma knowledge (8.6%) and asthma self-efficacy (12.8%) and stopping medications early (15.7%)

229
Table 26. Odds Ratios of Characteristics and Mediating Variables with ED Visits in Multivariate Analysis

230
Table 27. Correlation Matrix of Independent and Dependent Variables
ED v
isit
Chi
ld a
ge
Chi
ld g
ende
r
Pare
nt g
ende
r
Chi
ld ra
ce
Pare
nt ra
ce
Soci
oeco
nom
ic
Pare
nt e
duca
tion
Hou
sing
Mar
ital s
tatu
s
Peop
le in
hom
e
Chi
ld in
sura
nce
Nei
ghbo
rhoo
d
ED visit 1.00 Child age -0.06 1.00 Child gender -0.06 -0.07 1.00 Parent gender -0.06 -0.04 0.04 1.00 Child race 0.07 0.02 0.03 0.15 1.00 Parent race 0.07 0.07 0.02 0.24 0.74 1.00 Socioeconomic 0.03 -0.11 0.03 -0.08 -
0.10 -0.08 1.00
Parent education
0.02 -0.02 0.04 -0.06 -0.01
-0.06 0.13 1.00
Housing 0.00 -0.11 -0.06 -0.03 0.16 0.12 -0.01
0.02 1.00
Marital status 0.06 -0.03 -0.01 0.12 0.29 0.27 -0.26
-0.16
0.20 1.00
People in home
0.03 0.02 0.09 -0.03 0.05 0.01 0.14 0.04 -0.06
-0.22
1.00
Child insurance
0.01 0.00 -0.01 0.03 0.24 0.24 -0.33
-0.20
0.24 0.27 0.02 1.00
Neighborhood 0.01 -0.05 0.09 0.07 0.09 0.02 -0.04
-0.03
0.12 0.07 0.16 0.10 1.00
Season 1 -0.27 0.04 0.03 0.02 0.01 0.01 -0.01
0.02 0.02 0.00 0.00 -0.03
-0.05
Season 2 -0.19 0.02 0.02 0.00 0.01 0.00 -0.01
0.02 0.02 0.00 -0.01
-0.01
-0.04
Season 3 -0.17 0.01 0.02 0.00 0.01 0.00 -0.01
0.02 0.01 0.00 -0.01
-0.01
-0.04
Season 4 -0.15 0.01 0.01 0.00 0.01 -0.01 -0.01
0.01 0.01 0.00 0.00 -0.01
-0.03
Transportation -0.13 0.15 0.01 0.10 0.17 0.22 -0.24
-0.16
0.20 0.23 0.00 0.30 0.13
Parent stress 0.07 0.08 0.01 -0.12 -0.01
0.07 -0.16
-0.16
0.08 0.05 -0.04
0.05 0.09
Prescribed ICS 0.11 -0.06 -0.11 -0.03 0.02 0.04 0.09 0.03 0.08 0.04 -0.05
-0.07
0.00
ICS in hand 0.23 -0.15 -0.08 -0.04 0.02 0.00 0.07 0.05 0.06 0.07 -0.06
-0.02
0.02
Med administration
0.06 -0.03 -0.09 -0.11 -0.04
-0.03 0.04 0.08 0.10 0.06 -0.09
-0.06
0.04
Smokers in home
-0.08 0.07 0.00 0.02 0.08 0.04 -0.09
-0.09
-0.06
0.14 0.12 0.14 0.06
Passive smoke 0.04 0.05 -0.04 0.01 0.06 0.02 -0.05
-0.02
0.08 0.11 -0.08
0.09 0.02

231
Pests in home 0.15 -0.01 0.00 0.01 0.09 0.08 -0.08
-0.08
0.13 0.02 0.14 0.09 0.19
Missed appointm
0.16 0.01 -0.04 0.04 0.05 0.07 -0.04
0.06 0.10 0.03 0.20 0.14 0.14
AAP -0.04 0.02 0.01 0.04 -0.02
0.03 0.01 0.18 0.06 -0.01
-0.05
-0.09
-0.07
Asthma knowledge
-0.02 0.03 0.03 -0.04 0.06 0.03 0.06 0.10 -0.01
0.01 0.04 -0.06
-0.10
Self-efficacy 0.02 -0.12 -0.05 -0.02 -0.11
-0.13 -0.04
-0.08
0.04 0.00 -0.08
0.00 0.05
L9 -0.07 -0.02 0.10 0.04 0.04 -0.03 0.16 0.14 -0.07
-0.18
0.10 0.00 0.11
Skip med.s -0.02 0.21 0.06 -0.05 -0.04
-0.06 0.05 -0.03
-0.12
0.02 -0.08
0.01 0.00
Tran
spor
tatio
n
Pare
nt st
ress
Pres
crib
ed IC
S
ICS
in h
and
Med
ad
min
istra
tion
Smok
ers i
n ho
me
Pass
ive
smok
e
Pest
s in
hom
e
Mis
sed
appo
intm
ent
AA
P
Ast
hma
know
ledg
e
Self-
effic
acy
Stop
med
.s
Transportation 1.00 Parent stress 0.03 1.00 Prescribed ICS -0.07 0.10 1.00 ICS in hand -0.08 0.08 0.58 1.00 Med administration
-0.06 0.12 0.56 0.58 1.00
Smokers in home
0.16 0.09 -0.05 -0.06 0.00 1.00
Passive smoke 0.13 0.11 0.02 0.02 0.08 0.42 1.00 Pests in home 0.09 0.06 -0.03 -0.06 -
0.10 0.09 0.10 1.00
Missed appointm
0.00 0.12 0.02 0.06 0.02 0.04 0.08 0.15 1.00
AAP 0.07 -0.06 0.12 0.19 0.22 0.02 0.06 -0.05 0.04 1.00 Asthma knowledge
-0.08 -0.05 0.04 0.02 0.04 -0.02
0.01 -0.03 -0.06
0.05 1.00
Self-efficacy 0.00 0.09 0.05 0.10 0.11 -0.07
-0.03 0.00 0.04 -0.04
-0.20
1.00
Stop med.s 0.02 -0.08 -0.01 -0.02 0.03 0.01 -0.01 -0.08 -0.10
0.07 0.07 -0.06
1.00

232
Table 28. Odds Ratios of Characteristics and Mediating Variables with Missed School in Multivariate Analysis Step 1
+ Medication Management
Step 2 + Environment Management
Step 3 + Assessment Management
Step 4 + Education Management
Step 5 + Asthma knowledge & Self-efficacy
Step 6 + Asthma Control
Odds Ratio (p value) Parent Stress 1.129 (.486) 1.096 (.599) 1.032 (.855) 1.027 (.878) 1.046 (.809) 1.138 (.485) Administer ICS med some/everyday
.787 (.279) .786 (.278) .783 (.269) .801 (.324) .742 (.199) .762 (.240)
Smoker(s) in home 1.015 (.909) 1.028 (.834) 1.029 (.831) 1.000 (1.00) .970 (.828) Passive smoke exposure 1.191 (.320) 1.175(.363) 1.152 (.426) 1.086 (.669) 1.244 (.286) ≥ 1 type of pest in home 1.146 (.130) 1.126 (.194) 1.126 (.195) 1.102 (.319) 1.084 (.446) Missed Healthcare Appointments
2.168 (.021) 2.007 (.042) 1.785 (.095) 1.410 (.328)
Asthma action plan .871 (.444) .847 (.398) .844 (.377) Asthma knowledge .673 (.154) .745 (.340) Lack of self-efficacy 1.479 (.080) 1.490 (.070) Uncontrolled asthma .126 (.000) Controlled asthma .128 (.000) constant .0725 (.061) .069 (.055) .087 (.079) .090 (.084) .216 (.314) .730 (.835) N 1271 (332) 1266 (332) 1266 (332) 1260 (330) 1047 (284) 1047 (284) Notes: Source: Boston Children’s Hospital SICAS data, baseline and follow-up data. Generalized estimation equations used for model. Controlling for 12 characteristics (child age, child gender, parent gender, child race, household income/employment, parent education, housing, parent marital status, people in home, medical insurance, transportation), child asthma severity and season.

233
Table 29. Odds Ratios of Characteristics and Mediating Variables with Asthma Control in Multivariate Analysis
Step 1 + Medication Management
Step 2 + Environment Management
Step 3 + Assessment Management
Step 4 + Education Management
Step 5 + Asthma knowledge & Self-efficacy
Odds Ratio (p value) Parent Stress 1.102 (.630) 1.110 (.608) 1.183 (.414) 1.169 (.448) 1.234 (.339) Administer ICS med some/everyday
1.472 (.119) 1.451 (.137) 1.429 (.155) 1.408 (.179) 1.446 (.174)
Smoker(s) in home 0.958 (.785) 0.934 (.665) 0.944 (.716) 0.967 (.840) Passive smoke exposure 1.043 (.583) 1.085 (.723) 1.086 (.721) 1.113 (.668) ≥ 1 type of pest in home 0.854 (.176) 0.890 (.321) 0.894 (.341) 0.934 (.586) Missed Healthcare Appointments
0.445 (.018) 0.484 (.038)
0.487 (.049)
Asthma action plan 1.092 (.675) 1.118 (.628) Asthma knowledge 1.873 (.068) Lack of self-efficacy .858 (.558) cons 1.499 (.349) 5.206 (.305) 3.607 (.424) 3.846 (.402) 3.133 (.532) N 1,212 (308) 1,207 (308) 1,207 (308) 1,201 (306) 1004 (265) Notes: Source: Boston Children’s Hospital SICAS data, baseline and follow-up data. Generalized estimation equations used for model. Controlling for 12 characteristics (child age, child gender, parent gender, child race, household income/employment, parent education, housing, parent marital status, people in home, medical insurance, transportation), child asthma severity, and season.

234
Table 30. Odds Ratios of Characteristics and Mediating Variables with Parent Stress in Multivariate Analysis
Step 1
Step 2 + Asthma severity
Step 3 + Asthma self-efficacy
Step 4 + Asthma knowledge
Odds Ratio (p value) Income/employment 0.486 (0.037) 0.490 (0.040) 0.469 (0.042) 0.503 (0.068) Parent education 0.416 (0.021) 0.379 (0.014) 0.421 (0.042) 0.501 (0.114) Prescribed an ICS Controller Inhaler
1.306 (0.442) 1.358 (0.422) 1.396 (0.385)
Has an ICS Controller Inhaler 0.968 (0.924) 1.004 (0.991) 1.027 (0.943) Lack of self-efficacy 1.614 (0.184) 1.256 (0.586) Asthma knowledge 0.451 (0.272) cons 1.380 (0.739) 1.307 (.787) .734 (0.775) 1.364 (0.795) N 302 300 262 251 R2 0.054 0.057 0.061 0.056 Notes: Source: Boston Children’s Hospital baseline SICAS data. Generalized estimation equations used for model. Controlling for 10 characteristics (child age, child gender, parent gender, child race, housing, parent marital status, people in home, medical insurance, transportation) and season.

235
Table 31. Odds Ratios of Characteristics with Medication Administration in Multivariate Analysis
Model 1 Model 2 + Asthma knowledge & Self-efficacy
Variable OR (p value) Child age 1.108 (0.219) 1.110 (0.269) Child gender 0.676 (0.224) 0.701 (0.327) Parent gender 0.154 (0.099) omitted Child race 0.323 (0.143) 0.371 (.318) Income/employment 0.915 (0.840) 1.189 (0.720) Parent education 1.370 (0.528) 0.703 (0.546) Housing 0.970 (0.932) 1.078 (0.848) Marital status 1.388 (0.403) 1.633 (0.262) People in Home 0.938 (0.858) 1.061 (0.881) Insurance 0.783 (0.540) 0.792 (0.609) Transportation 0.954 (0.896) 0.785 (0.568) Neighborhood 1.999 (0.094) 1.872 (0.179) Parent Stress 1.370 (0.348) 1.399 (0.360) Prescribed ICS - - ICS in Hand 31.06 (0.000) 21.86 (0.000) Missed Appointment 0.870 (0.836) 1.260 (0.745) Asthma action plan 2.557 (0.012) 3.510 (0.004) Asthma knowledge 15.23 (0.010) Asthma self-efficacy 3.352 (0.025) Stopped medications 0.350 (0.004) cons 1.289081 (0.10) .003 (0.003) N 304 239 R2 0.3511 0.3499 Notes: Controlling for season. Source: Boston Children’s Hospital SICAS data, baseline and follow-up data.

236
Table 32. Odds Ratios of Characteristics with Missed Appointments in Multivariate Analysis
Model 1 Model 2 + Asthma knowledge & Self-efficacy
Variable OR (p value) Child age 1.168 (0.303) 1.249 (0.180) Child gender 0.447 (0.162) 0.644 (0.470) Parent gender omitted omitted Child race omitted omitted Income/employment 0.813 (0.738) 1.236 (0.763) Parent education 1.543 (0.576) 1.991 (0.437) Housing 1.765 (0.304) 1.444 (0.550) Marital status 1.982 (0.328) 1.640 (0.500) People in Home 5.890 (0.003) 4.987 (0.012) Insurance 9.437 (0.060) 11.495 (0.038) Transportation 0.446 (0.215) 0.482 (0.307) Neighborhood 6.755 (0.001) 7.610 (0.001) Parent Stress 5.342 (0.042) 5.202 (0.050) Prescribed ICS 1.297 (0.763) 0.793 (0.808) ICS in Hand 0.967 (0.968) 1.721 (0.563) Asthma action plan Asthma knowledge 0.127 (0.062) Asthma self-efficacy 0.490 (0.425) Stopped medications cons .0002575 (0.001) .0004721 (0.004) N 281 237 R2 0.2743 0.2957 Notes: Source: Boston Children’s Hospital SICAS data, baseline and follow-up data. Controlling for season.

237
Table 33. Odds Ratios of Characteristics with Having an Asthma Action Plan in Multivariate Analysis
Model 1 Model 2 + Asthma knowledge & Self-efficacy
Variable OR (p value) Child age 1.059 (0.427) 1.045 (0.588) Child gender 1.134 (0.630) 1.130 (0.680) Parent gender 2.367 (0.307) 3.298 (0.194) Child race 0.701 (0.509) 0.788 (0.714) Income/employment 0.974 (0.937) 0.688 (0.347) Parent education 2.695 (0.004) 2.943 (0.008) Housing 1.140 (0.645) 1.386 (0.328) Marital status 1.043 (0.895) 0.880 (0.722) People in Home 0.925 (0.780) 1.031 (0.923) Insurance 0.711 (0.295) 0.607 (0.190) Transportation 1.618 (0.095) 1.956 (0.049) Neighborhood 0.905 (0.762) 0.724 (0.377) Parent Stress 1.029 (0.918) 0.845 (0.591) Prescribed ICS 1.077 (0.828) 0.962 (0.922) ICS in Hand 2.696 (0.005) 2.129 (0.057) Missed Appointment 0.734 (0.585) 0.875 (0.831) Asthma action plan Asthma knowledge 1.478 (0.544) Asthma self-efficacy 0.872 (0.750) Stopped medications cons .0619 (0.159) .0458 (0.154) N 305 255 R2 0.0847 0.0857 Notes: * p<0.05; ** p<0.01 Source: Boston Children’s Hospital SICAS data, baseline and follow-up data. Controlling for season.

238
Table 34. Odds Ratios of Characteristics with Pests in Home, Passive Smoke and Smokers in Home in Multivariate Analysis
Pests in Home Model
Passive Smoke Model
Smokers in Home Model
OR (p value) Child age 0.991 (0.85) 1.080 (0.19) 1.036 (0.607) Child gender 1.005 (0.98) 0.964 (0.87) 0.994 (0.980) Parent gender .969 (0.96) 1.971 (0.42) 0.951 (0.956) Child race 2.07 (0.14) .4580 (.072) 0.442 (0.123) Income/employment 0.652 (0.07) 1.135 (0.64) 1.090 (0.787) Parent education 0.609 (0.04) .988 (0.97) 1.023 (0.946) Housing 1.34 (0.13) 1.280 (0.28) 0.701 (0.193) Marital status .912 (0.68) 1.542 (0.12) 2.081 (0.023) People in Home 2.00 (.000) 0.712 (0.16) 1.178 (0.543) Insurance .841 (0.43) 1.55 (0.12) 2.609 (0.005) Transportation 1.067 (0.70) 1.051 (0.80) 1.209 (0.511) Neighborhood 1.790 (.002) .906 (0.61) 1.323 (0.362) Parent Stress 1.12 (0.54) 1.653 (.037)
1.120 (0.676)
cons 1.58 (0.750) 0.034 (0.073) .194 (0.428) N 1,222 1,219 309 R2 na na 0.0572 Notes: Controlling for season. Source: Boston Children’s Hospital SICAS data, baseline and follow-up data for Pests in Home Model and Passive Smoke Model. Baseline data for Smokers in Home Model only.

239
Table 35. Odds Ratios of Characteristics and Mediating Variables with Emergency Department Visits in Multivariate Analysis in a Lagged Model
ED Visits (GEE) Without a Lag Pests and Passive Smoke in Home Lags
Asthma Control Lag
Correlation coefficient (p value) Child age -0.050 (0.90) -0.045 (0.82) -0.007 (0.09) Child gender -0.173 (0.82) -0.189 (0.89) -0.094 (0.32) Parent Gender -1.254 (1.90)
.2854 (.057) -1.219 (1.86) -1.723 (2.09)*
Child Race (minority)
1.888 (2.03)* 6.6087 (.042)
1.921 (2.07)* 1.539 (1.27)
Employed or income >25K 0.091 (0.34) 0.083 (0.30) -0.094 (0.26) Parent education (Graduated HS) 0.087 (0.29) 0.030 (0.10) -0.041 (0.10) Housing (Apartment) -0.428 (1.84) -0.351 (1.51) -0.585 (1.73) Marital Status (Not married) 0.617 (2.31)*
1.8542 (.021) 0.582 (2.20)* 0.923 (2.42)*
People in Home (>5 people) 0.287 (1.24) 0.269 (1.16) 0.315 (0.99) Health Insurance (Medicaid) -0.169 (0.64) -0.223 (0.84) 0.235 (0.61) Transportation (bus or walk) -0.685 (2.95)**
.50399 (.003) -0.635 (2.76)** -1.073 (3.35)**
Parent Stress 0.497 (2.18)* 1.6446 (.029)
0.526 (2.30)* 0.371 (1.15)
Prescribed ICS -0.320 (1.02) -0.177 (0.57) 0.415 (0.88) ICS medication in hand 1.568 (5.41)**
4.7951 (.000) 1.505 (5.24)** 1.984 (4.64)**
Takes ICS -0.345 (1.29) -0.382 (1.43) -0.700 (1.94) People in home who smoke -0.621 (3.17)**
.5372 (.002) -0.553 (2.94)** -0.747 (2.54)*
Passive smoke 0.349 (1.39) -0.050 (0.21) 0.150 (0.39) Pests in home 0.412 (3.23)**
1.5102 (.001) 0.231 (1.84) 0.342 (1.71)
Missed Appointments 0.843 (2.24)* 2.3231 (.025)
0.970 (2.57)* 1.295 (2.64)**
AAP (K11) -0.242 (1.04) -0.207 (0.89) -0.346 (1.08) Asthma Knowledge (K8) -0.533 (1.38) -0.551 (1.43) -1.305 (2.62)** Asthma self-efficacy (L8) 0.018 (0.07) 0.038 (0.14) -0.206 (0.58) Uncontrolled asthma -1.003 (4.42)**
.36685 (.000) -1.003 (4.44)** -0.708 (2.12)*
Controlled asthma -2.799 (2.64)** .06089 (.008)
-2.925 (2.76)** -0.444 (0.61)
cons 0.875 (0.51) 1.049 (0.61) 0.714 (0.32) N 1,047 1,046 774 Notes ORs displayed under correlation coefficients in selected variables for further description. Controlling for season. Source: Boston Children’s Hospital SICAS data, baseline and follow-up data

240
Table 36. Sensitivity Test of Parent Stress in ED Visit Model
ED Visit Model (GEE)
ED model with parent stress continuous measure
ED model with parent stress continuous measure
Correlation coefficient (p value) Child age -0.040 (0.77) -0.033 (0.63) Child gender -0.182 (0.93) -0.175 (0.90) Parent Gender -0.880 (1.44) -0.938 (1.53) Child Race (minority)
1.152 (1.71) 3.16459 (.087)
1.044 (1.54)
Employed or income >25K
-0.098 (0.40) -0.106 (0.43)
Parent education (Graduated HS)
0.099 (0.37) 0.060 (0.23)
Housing (Apartment) -0.465 (2.16)* .62829 (.031)
-0.444 (2.07)*
Marital Status (Not married)
0.583 (2.39)* 1.790541 (.017)
0.563 (2.31)*
People in Home (>5 people)
0.283 (1.33) 0.246 (1.16)
Health Insurance (Medicaid)
0.023 (0.09) 0.004 (0.01)
Transportation (bus or walk)
-0.689 (3.33)** .5019142 (.001)
-0.687 (3.32)**
Parent Stress dichotomous
0.547 (2.55)* 1.728849 (.011)
Parent Stress continuous
0.056 (1.74) 1.057832 (.081)
Prescribed ICS -0.085 (0.30) -0.093 (0.33) ICS medication in hand
1.742 (6.55)** 1.710 (6.48)**
Takes ICS -0.492 (1.97)* -0.419 (1.70) People in home who smoke
-0.625 (3.39)** -0.622 (3.36)**
Passive smoke 0.375 (1.63) 0.368 (1.60) Pests in home 0.449 (3.87)** 0.446 (3.87)** Missed Appointments 0.853 (2.40)*
0.868 (2.43)*
cons -1.132 (0.75) -0.865 (0.58) N 1,266 1,266 Notes * p<0.05; ** p<0.01 ORs displayed under correlation coefficients in selected variables for further description. Controlling for season. Source: Boston Children’s Hospital SICAS data, baseline and follow-up data.

241
Table 37. ATAQ Continuous Asthma Control Model and Maximum Symptom Models
GEE models Range
ATAQ Control continuous Model 1-7
Maximum Symptom Model 0-14
Maximum Symptom Model 0-42
Correlation coefficient (p value) Child age 0.020 (0.77) -0.121 (1.58) -0.183 (1.32) Child gender 0.165 (1.71) 0.109 (0.39) 0.357 (0.69) Parent Gender 0.146 (0.44) 1.182 (1.22) 1.720 (0.97) Child Race 0.232 (0.95) -0.150 (0.21) -0.581 (0.44) Employed or income >25K
0.224 (1.78) -0.574 (1.55) .5635 (.120)
-1.274 (1.90) .2796 (.058)
Parent edu -0.082 (0.59) -0.235 (0.58) -0.302 (0.41) Apartment -0.161 (1.52) -0.050 (0.16) 0.201 (0.35) Marital status -0.145 (1.23) -0.290 (0.84) -0.627 (1.00) LiveTogether5 -0.073 (0.68) -0.178 (0.56) -0.014 (0.02) Insurance: Medicaid -0.189 (1.58) 0.486 (1.39) 0.730 (1.14) Neighborhood -0.153 (1.37) 0.200 (0.59) 0.533 (0.90) Transportation 0.121 (1.22) -0.042 (0.14) -0.085 (0.16) Parent stress 0.001 (0.01) 0.417 (1.38) 0.716 (1.30) Prescribed ICS 0.045 (0.36) -0.679 (1.85)
.5069 (.065) -1.231 (1.85) .29206907 (.065)
ICS med in hand -0.550 (5.01)** .57708 (.000)
1.364 (4.13)** 3.9106 (.000)
2.458 (4.26)** 11.679 (.000)
Medication administration
0.163 (1.22) -0.028 (0.07) 0.161 (0.23)
People in home who smoke
-0.102 (1.30) 0.339 (1.47) 1.404 (.142)
0.556 (1.33)
Passive smoke 0.025 (0.23) -0.036 (0.11) 0.188 (0.34) Pests -0.098 (1.81) 0.479 (2.91)**
1.6138 (.004) 0.633 (2.22)* 1.8835 (.026)
Missed Appointments
-0.634 (2.89)** .53047 (.004)
1.518 (2.35)* 4.5621 (.019)
2.610 (2.23)* 13.604 (.026)
AAP -0.040 (0.38) -0.120 (0.39) -0.169 (0.30) cons 4.835 (6.18)** 0.579 (0.25) 0.964 (0.23) N 1,201 1,201 1,201 Notes * p<0.05; ** p<0.01 ORs displayed under correlation coefficients in selected variables for further description. Controlling for season. Source: Boston Children’s Hospital SICAS data, baseline and follow-up data