impact of ozone layer depletion i: ozone depletion climatology
TRANSCRIPT

*Fax: #31-30-2543163.E-mail address: [email protected] (R. De Winter-Sorkina).
Atmospheric Environment 35 (2001) 1609}1614
Impact of ozone layer depletion I: ozone depletion climatology
Renata De Winter-Sorkina*
Institute for Marine and Atmospheric Research Utrecht (IMAU), Utrecht University, P.O. Box 80005, 3508 TA Utrecht, The Netherlands
Received 11 May 2000; received in revised form 17 August 2000; accepted 29 August 2000
Abstract
A monthly ozone pro"le depletion climatology is constructed for the time period 11/1978}4/1993 for 103 latitudebands using the TOMS total ozone data and SAGE trends. Monthly mean Nimbus-7/TOMS total ozone data areanalysed by multiple linear regression which takes into account the seasonal variation, quasi-biennial oscillations (QBO),solar cycle and the month-to-month correlation of ozone values. Total ozone depletion trends and the mean seasonalcycle are determined. To construct the monthly ozone pro"le depletion climatology the SAGE trends are used down toan altitude of 20 km. The trends between 20 km and the tropopause are estimated from both the TOMS total ozone "eldsfor 1978/79 (the mean seasonal cycle) and 1992/93 (the mean seasonal cycle minus depletion trends) and the SAGE trends;these estimates take into account general information about the seasonal and altitude dependence of trends that isderived from an ozonesonde analysis. ( 2001 Elsevier Science Ltd. All rights reserved.
Keywords: Ozone trends; Ozone pro"le; TOMS; SAGE; Ozonesonde
1. Introduction
In the stratosphere ozone acts as a shield to protect theEarth's surface from the sun's harmful ultraviolet radi-ation. Increases in UV-B radiation have been observedin areas undergoing periods of intense ozone depletion(Kerr and McElroy, 1993). An increase in UV radiationthat reaches the Earth's surface can lead to an increasein the incidence of skin cancer, cataracts, impaired im-mune systems, to damage to forests and aquatic organ-isms, and to a decrease in crop yields. The increase inphotodissociation rates of tropospheric species can havean impact on tropospheric chemistry (Madronich andGranier, 1992; Bekki et al., 1994; Fuglestvedt et al., 1994;Granier et al., 1996). When ozone absorbs the UV light itheats the atmosphere in the vicinity; a change in theabundance of ozone may change the temperature struc-ture of the atmosphere and in this way alter the atmo-spheric circulation.
The aim of this work is to construct a monthly clima-tology of trends in zonally averaged ozone pro"les, which
is used in the assessment of impact of ozone depletion ontropospheric composition (De Winter-Sorkina, 2001).This ozone depletion climatology can be used to studythe e!ects of increasing UV radiation, and can also beused in climate models. The early version of the derivedclimatology of monthly ozone trend pro"les (De Winter-Sorkina, 1997) was used to study the e!ect of stratos-pheric ozone depletion on climate (Bengtsson et al.,1999).
First, the TOMS total ozone trend analysis is per-formed. Total ozone undergoes strong annual and inter-annual variations. The primary goal is to separate theanthropogenic changes in the ozone layer from naturalvariations. The multiple-linear regression method used inthis study allows us to eliminate in#uences that someknown processes (such as solar cycle, quasi-biennial os-cillations of zonal wind in the Tropics) have on ozoneand to determine the mean seasonal cycle and the rates oflong-term total ozone depletion. In the constructedmonthly ozone pro"le trends climatology, the SAGEtrends are used down to an altitude of 20 km. The trendsbetween 20 km and the tropopause are estimated fromboth the TOMS total ozone data and SAGE trends andtake into account general information derived from anozonesonde analysis.
1352-2310/01/$ - see front matter ( 2001 Elsevier Science Ltd. All rights reserved.PII: S 1 3 5 2 - 2 3 1 0 ( 0 0 ) 0 0 4 3 6 - 2

Fig. 1. Seasonal and latitudinal dependency of total ozone trends derived from TOMS version 7 data for the time period11/1978}04/1993. Shaded areas represent the trends signi"cant at the 2p error level. Black patches indicate missing data due to the polarnight.
2. Total ozone depletion
Version 7 of the total ozone data measured from No-vember 1978 to April 1993 by Total Ozone MappingSpectrometer (TOMS) aboard the Nimbus-7 satellite wasused to determine depletion trends in stratosphericozone. Total ozone varies in time as a result of somenatural processes and human activity. We take into ac-count the following natural factors: seasonal variation,quasi-biennial oscillations (QBO) and the 11-year solarcycle. Furthermore, we presuppose an anthropogenicin#uence due to CFC emissions; this is modelled asa linear function of time with seasonal coe$cients (de-pletion trends). Therefore, the trends represent the aver-age loss rate over the full period of the data record. Thetemporal dependence of the ozone column is describedby the following multiple linear regression model (DeWinter-Sorkina, 1995):
O3(t)"k(i)#b
Tt#b
QBOX
QBO(t!¸)
#bSUN
XSUN
(t)#N(t), (1)
N(t)"UN(t!1)#e(t),
where O3
is the monthly mean ozone, t the time inmonths, k(i) a seasonal term for the ith month of the year(i"1, 2,2, 12); X
QBO(t) is the Singapore (23N) 30mbar
zonal wind representing the tropical QBO, L the opti-mum phase lag between X
QBO(t) and O
3(t), X
SUNthe
solar 10.7 cm #ux used as a proxy for the ultraviolet solarirradiance; N(t) is a residual noise term representing theshort-term variation in ozone, modelled as a "rst-order
autoregressive process because there is a month-to-month correlation in ozone values; e(t) is a residual un-correlated series with the mean equal to zero, althoughthe variance of e(t) depends on the month [p2(t)"p2(t!12)]; b
T, b
QBO, b
SUNare the linear trend, QBO and
solar cycle seasonal coe$cients, respectively, which aredetermined by least squares regression. The 2p errorlimits for trend coe$cient b
T,b are calculated as fol-
lows:
2p"2(p@b2#(d/2)2)1@2, (2)
p@b"b((pb/b)2#(pk/k)2!2(pbk/bk))1@2,
where d is the 2p drift error of TOMS ozone data. Theaccuracy of TOMS total ozone record within 1% perdecade over the length of the time series (McPeters et al.,1996a) is used for the calculation of standard errors.
The monthly mean ozone values are used because oftheir relative independence. The daily data are stronglycorrelated. Zonal means of the TOMS monthly meanozone over 103 latitude bands were "tted to the modeldescribed above; in this way the in#uence that regionalweather patterns might have on trends was largely ex-cluded. There are some missing values over the PolarRegions as the satellite does not observe ozone at night.
Fig. 1 shows zonal and monthly mean total ozonetrends derived from Nimbus-7/TOMS version 7 data forthe time period November 1978}April 1993 (De Winter-Sorkina, 1997). The shaded areas represent the ozonetrends signi"cant at the 2p error level. The largest ozoneloss at mid-latitudes of the Northern Hemisphere of!8.3$1.9% per decade occurred in February between
1610 R. De Winter-Sorkina / Atmospheric Environment 35 (2001) 1609}1614

403N and 503N. However, there were signi"cant ozonetrends in the late spring and during the summer north of453N latitude when the UV radiation levels are high. Inthe Southern Hemisphere there were high ozone de-pletion trends in spring and summer (for example!16.6$5.0% per decade in October between 603S and703S). In our analysis we found positive, but non-signi"-cant ozone trends in the tropical region in agreementwith the results of McPeters et al. (1996b).
E!ects of the Pinatubo eruption in June 1991 led to thevery low global and zonal averages of ozone detected in1992}1993 (Bojkov et al., 1993; Gleason et al., 1993).Considering that the standard error of the trends is atleast about 1% per decade, the trends did not changesigni"cantly from 1993 to 1998 (WMO, 1999). Only innorthern mid-latitude winter, is the estimated trend end-ing in 1993 about 2% stronger than the estimated trendover the period 1/79}1/98. In the Southern Hemisphere,the e!ect of the 1993 anomaly had a much lower impact.The Nimbus-7 TOMS total ozone data record is thelongest one obtained by one instrument. There is a timegap of almost 2 years in the TOMS data record betweenMeteor-3 and Earth Probe TOMS. The trends deducedfrom the Nimbus-7 TOMS data represent the real situ-ation of ozone depletion in the 1980s and early 1990s andare suitable for estimating the possible e!ects on tropo-spheric chemistry.
3. Seasonal trends in the ozone pro5le
Ozone pro"les on the long-term and on a global basiswere measured by SBUV/SBUV2 and SAGE I/SAGE IIsatellite instruments. The vertical resolution of the SAGEozone pro"les is 1 km, which is much better than that ofthe SBUV measurements, whose resolution is approxim-ately 8 km above 25 km altitude. Adjustments were madeto correct for the latitude-dependent di!erence in altituderegistration between the SAGE I and SAGE II data sets(Wang et al., 1996). Comparisons of re-evaluated SAGEmade with SBUV, HALOE, MLS, Umkehr, lidar andsondes show a remarkable degree of consistency and lendsupport to the use of SAGE data in calculating long-termozone trends (SPARC/IOC/GAW, 1998). SAGE I/IIdata cover the latitude range 603S}603N and are reliablefor trend analyses over the altitude range 20}55km. Thetotal ozone trends derived from TOMS were comparedto the integrated ozone pro"le trends derived fromSAGE I/II and ozonesonde data (SPARC/IOC/GAW,1998). Trends derived from ozonesonde data over403N}533N show that large fractions of the total trendsoccur below 20km. Both the magnitude and seasonalvariation in the ozonesonde trends are consistent withTOMS data, and the ozonesonde results below 20km arein agreement with the observed TOMS } SAGE I/IItrend di!erences.
Here we use SAGE I/II annual trends (Cunnold andWang, private communications) from January 1979 toDecember 1996 (no data being available for January1982}September 1984) down to 20 km. The SAGE I dataare from version 6.1 retrieval, with adjustments for alti-tude errors, and the SAGE II data are based on the latestversion 5.96 algorithm. We also use the SAGE I/II trendsas a function of latitude and month for the altitude of40}45km, where the winter maximum trend appears(SPARC/IOC/GAW, 1998). The ratios of monthly SAGEI/II trends at 40}45km altitude and annual SAGE I/IItrends determine the latitude- and month-dependent sea-sonal coe$cients. In our model, the SAGE I/II annualtrends above 26 km are scaled with these seasonal coe$-cients in order to get the monthly trends. Between 20 and26 km the ozone trend is almost constant as a function ofa season (Bojkov and Fioletov, 1997).
Trends in ozone are largest in the lower stratosphere.Between the altitudes of 20 km and the tropopauseozonesondes provide the largest dataset for the trendanalyses, but give very poor spatial coverage at a limitednumber of stations, located mainly on the continents ofthe Northern hemisphere. Ozonesondes alone thereforecannot provide global trends. However, averaged ozonesoundings over a number of stations do supply a greatdeal of valuable information about the altitude and sea-sonal dependence of ozone trends. The decrease inozone occurs between about 30 hPa and the tropopause(Logan, 1994; SPARC/IOC/GAW, 1998). Bojkov andFioletov (1997) analysed the sonde data relative tothe tropopause height, and found signi"cant decreasesonly 1}2 km above the tropopause. There is a seasonalvariation in the trends, which appears to depend onregion (Logan, 1994; Bojkov and Fioletov, 1997;SPARC/IOC/GAW, 1998). At the European stations de-creases in ozone are largest in spring and winter. There isno signi"cant decrease in ozone below 90hPa at theEuropean stations in summer and autumn, but the de-crease persists in spring to 200hPa.
First, we determine the monthly mean TOMS version7 total ozone "elds for 1978/79 as a seasonal term k(i)in Eq. (1), excluding the e!ects of QBO, solar cycleand month-to-month correlation in ozone values. Clima-tological pro"les of ozone are scaled above thetropopause height in such a way that the ozone columns"t with the TOMS monthly mean ozone for 1978/79. Thealtitude pro"les of ozone and temperature are taken fromthe results for 1980 (Velders, 1995) of the two-dimen-sional stratosphere model developed by Harwood andPyle (1975). These pro"les are speci"c for a given latitudeand a particular month of the year. Tropopause heightsfor 503N}603S are calculated for 103 latitude bands andfor each month as the average tropopause altitude for thetime period 1979}1991 from the temperature soundings(Fishman et al., 1990). North of 503N and south of 603Sthe annual mean tropopause altitude is assumed to be
R. De Winter-Sorkina / Atmospheric Environment 35 (2001) 1609}1614 1611
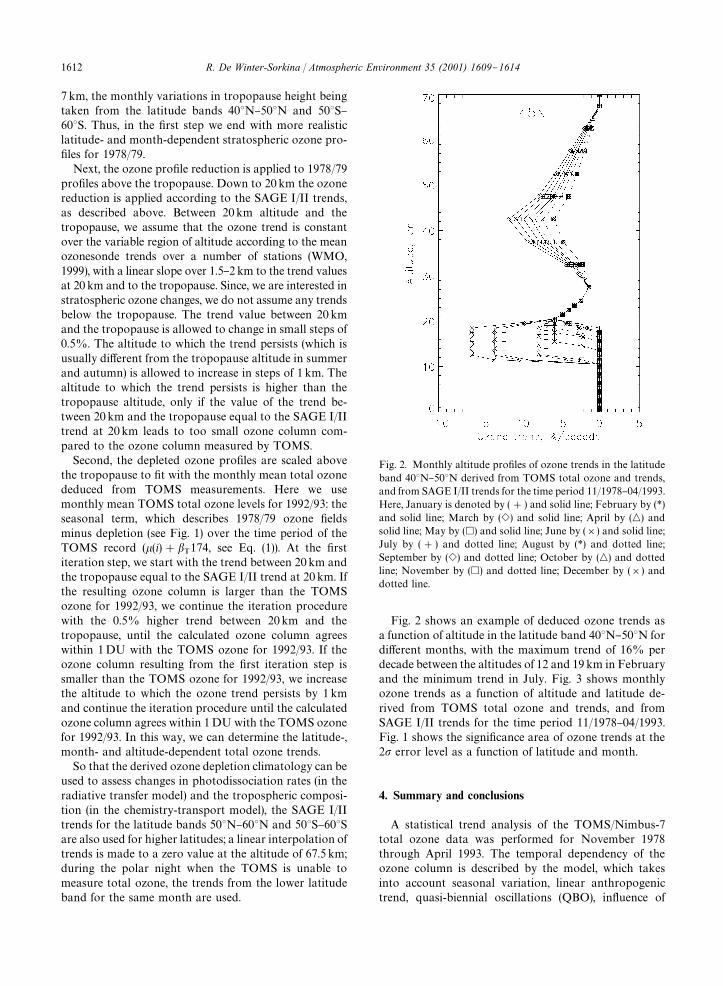
Fig. 2. Monthly altitude pro"les of ozone trends in the latitudeband 403N}503N derived from TOMS total ozone and trends,and from SAGE I/II trends for the time period 11/1978}04/1993.Here, January is denoted by (#) and solid line; February by (*)and solid line; March by (e) and solid line; April by (n) andsolid line; May by (h) and solid line; June by (]) and solid line;July by (#) and dotted line; August by (*) and dotted line;September by (e) and dotted line; October by (n) and dottedline; November by (h) and dotted line; December by (]) anddotted line.
7 km, the monthly variations in tropopause height beingtaken from the latitude bands 403N}503N and 503S}603S. Thus, in the "rst step we end with more realisticlatitude- and month-dependent stratospheric ozone pro-"les for 1978/79.
Next, the ozone pro"le reduction is applied to 1978/79pro"les above the tropopause. Down to 20 km the ozonereduction is applied according to the SAGE I/II trends,as described above. Between 20 km altitude and thetropopause, we assume that the ozone trend is constantover the variable region of altitude according to the meanozonesonde trends over a number of stations (WMO,1999), with a linear slope over 1.5}2 km to the trend valuesat 20 km and to the tropopause. Since, we are interested instratospheric ozone changes, we do not assume any trendsbelow the tropopause. The trend value between 20 kmand the tropopause is allowed to change in small steps of0.5%. The altitude to which the trend persists (which isusually di!erent from the tropopause altitude in summerand autumn) is allowed to increase in steps of 1 km. Thealtitude to which the trend persists is higher than thetropopause altitude, only if the value of the trend be-tween 20 km and the tropopause equal to the SAGE I/IItrend at 20 km leads to too small ozone column com-pared to the ozone column measured by TOMS.
Second, the depleted ozone pro"les are scaled abovethe tropopause to "t with the monthly mean total ozonededuced from TOMS measurements. Here we usemonthly mean TOMS total ozone levels for 1992/93: theseasonal term, which describes 1978/79 ozone "eldsminus depletion (see Fig. 1) over the time period of theTOMS record (k(i)#b
T174, see Eq. (1)). At the "rst
iteration step, we start with the trend between 20 km andthe tropopause equal to the SAGE I/II trend at 20 km. Ifthe resulting ozone column is larger than the TOMSozone for 1992/93, we continue the iteration procedurewith the 0.5% higher trend between 20 km and thetropopause, until the calculated ozone column agreeswithin 1DU with the TOMS ozone for 1992/93. If theozone column resulting from the "rst iteration step issmaller than the TOMS ozone for 1992/93, we increasethe altitude to which the ozone trend persists by 1 kmand continue the iteration procedure until the calculatedozone column agrees within 1DU with the TOMS ozonefor 1992/93. In this way, we can determine the latitude-,month- and altitude-dependent total ozone trends.
So that the derived ozone depletion climatology can beused to assess changes in photodissociation rates (in theradiative transfer model) and the tropospheric composi-tion (in the chemistry-transport model), the SAGE I/IItrends for the latitude bands 503N}603N and 503S}603Sare also used for higher latitudes; a linear interpolation oftrends is made to a zero value at the altitude of 67.5 km;during the polar night when the TOMS is unable tomeasure total ozone, the trends from the lower latitudeband for the same month are used.
Fig. 2 shows an example of deduced ozone trends asa function of altitude in the latitude band 403N}503N fordi!erent months, with the maximum trend of 16% perdecade between the altitudes of 12 and 19 km in Februaryand the minimum trend in July. Fig. 3 shows monthlyozone trends as a function of altitude and latitude de-rived from TOMS total ozone and trends, and fromSAGE I/II trends for the time period 11/1978}04/1993.Fig. 1 shows the signi"cance area of ozone trends at the2p error level as a function of latitude and month.
4. Summary and conclusions
A statistical trend analysis of the TOMS/Nimbus-7total ozone data was performed for November 1978through April 1993. The temporal dependency of theozone column is described by the model, which takesinto account seasonal variation, linear anthropogenictrend, quasi-biennial oscillations (QBO), in#uence of
1612 R. De Winter-Sorkina / Atmospheric Environment 35 (2001) 1609}1614

Fig. 3. Monthly ozone trends as a function of altitude and latitude derived from TOMS total ozone and trends, and from SAGE I/IItrends for the time period 11/1978}04/1993.
R. De Winter-Sorkina / Atmospheric Environment 35 (2001) 1609}1614 1613

the 11-year solar cycle and month-to-month correlationin ozone values. Monthly total ozone trends and themean seasonal cycle are calculated for zonal means over103 latitude bands. The estimates of the monthly meanand latitude-dependent altitude pro"les of the ozonetrends are based on the ozone pro"le trends down to20 km from SAGE I/II, the total ozone trends and themean seasonal cycle from the TOMS data, and on gen-eral information about seasonal and altitude dependencyof trends derived from an ozonesonde analysis. The con-structed ozone trend climatology will be used to assessthe impact of ozone layer depletion on troposphericcomposition resulting from changes in photodissociationrates (De Winter-Sorkina, 2001).
The ozone depletion climatology is available from theauthor.
Acknowledgements
Renata de Winter-Sorkina was supported by the Euro-pean Union RIFTOZ project and by the Space ResearchOrganisation of the Netherlands (SRON). The authorthanks Peter Builtjes and Paul Fortuin for their interestand support, D.M. Cunnold and H.J. Wang forproviding their SAGE ozone trends and NASA GSFCTOMS team for making the TOMS total ozone dataavailable.
References
Bekki, S., Law, K.S., Pyle, J.A., 1994. E!ect of ozone depletionon atmospheric CH
4and CO concentrations. Nature 371,
595}597.Bengtsson, L., Roeckner, E., Stendel, M., 1999. Why is the global
warming proceeding much slower than expected? Journal ofGeophysical Research 104, 3865}3876.
Bojkov, R.D., Zerefos, C.S., Balis, D.S., Ziomas, I.C., Bais, A.F.,1993. Record low total ozone during northern wintersof 1992 and 1993. Geophysical Research Letters 20,1351}1354.
Bojkov, R.D., Fioletov, V.E., 1997. Changes of the lower strato-spheric ozone over Europe and Canada. Journal of Geo-physical Research 102, 1337}1347.
De Winter-Sorkina, R., 1995. Depletion and natural variabilityof the ozone layer from TOMS observations. RIVM Reportno. 722201005, Bilthoven, The Netherlands.
De Winter-Sorkina, R., 1997. Impact of ozone layer depletion ontropospheric ozone photodissociation rates. In: Walcek, C.E.(Ed.), American Meteorological Society, Proceedings of theThird Conference on Atmospheric Chemistry, 2}7 February1997, Long Beach, CA, 118}127.
De Winter-Sorkina, R., 2001. Impact of ozone layer depletion II:changes in photodissociation rates and troposphericcomposition. Atmospheric Environment 35, 1615}1625.
Fishman, J., Watson, C.E., Larsen, J.C., Logan, J.A., 1990. Thedistribution of tropospheric ozone determined from satellitedata. Journal of Geophysical Research 95, 3599}3617. Dataon CD-ROM.
Fuglestvedt, J.S., Jonson, J.E., Isaksen, I.S.A., 1994. E!ects ofreduction in stratospheric ozone on tropospheric chemistrythrough changes in photolysis rates. Tellus 46B, 172}192.
Gleason, J.F., Bhartia, P.K., Herman, J.R., McPeters, R., New-man, P., Stolarski, R.S., Flynn, L., Labow, G., Larko, D.,Seftor, C., Wellemeyer, C., Komhyr, W.D., Miller, A.J.,Planet, W., 1993. Record low global ozone in 1992. Science260, 523}526.
Granier, C., Muller, J.F., Madronich, S., Brasseur, G.P., 1996.Possible causes for the 1990}1993 decrease in the globaltropospheric CO abundances: a three-dimensional sensitiv-ity study. Atmospheric Environment 30, 1673}1682.
Harwood, R.S., Pyle, J.A., 1975. A two-dimensional mean circu-lation model for the atmosphere below 80km. QuarterlyJournal of the Royal Meteorological Society 101, 723}747.
Kerr, J.B., McElroy, C.T., 1993. Evidence for large upwardtrends of ultraviolet-B radiation linked to ozone depletion.Science 262, 1032}1034.
Logan, J.A., 1994. Trends in the vertical distribution of ozone: ananalysis of ozonesonde data. Journal of Geophysical Re-search 99, 25553}25585.
Madronich, S., Granier, C., 1992. Impact of recent total ozonechanges on tropospheric ozone photodissociation, hydroxylradicals, and methane trends. Geophysical Research Letters19, 465}467.
McPeters, R.D., Bhartia, P.K., Krueger, A.J., Herman, J.R.,Schlesinger, C.G., Wellemeyer, C.G., Seftor, C.J., Jaross, G.,Taylor, S.L., Swissler, T., Torres, O., Labow, G., Byerly, W.,Cebula, R.P., 1996a. Nimbus-7 Total Ozone Mapping Spec-trometer (TOMS) Data Products User's Guide. NASA Ref-erence Publication 1384.
McPeters, R.D., Hollandsworth, S.M., Flynn, L.E., Herman,J.R., Seftor, C.J., 1996b. Longterm ozone trends derived fromthe 16-year combined Nimbus-7/Meteor 3 TOMS Version7 record. Geophysical Research Letters 23, 3699}3702.
SPARC/IOC/GAW, 1998. Assessment of trends in the verticaldistribution of ozone. WMO global ozone research andmonitoring Project Report no. 43, WCRP-SPARC Reportno. 1, AREP/ENV, Geneva.
Velders, G.J.M., 1995. Scenario study of the e!ects of CFC,HCFC and HFC emissions on stratospheric ozone. RIVMReport no. 722201006, Bilthoven, The Netherlands.
Wang, H.J., Cunnold, D.M., Bao, X., 1996. A critical analysis ofstratospheric aerosol and gas experiment ozone trends. Jour-nal of Geophysical Research 101, 12495}12514.
WMO, 1999. Scienti"c assessment of ozone depletion: 1998.Global ozone research and monitoring project. Report No.44, World Meteorological Organization, Geneva.
1614 R. De Winter-Sorkina / Atmospheric Environment 35 (2001) 1609}1614