impact of optimal placement and sizing of capacitors on...
TRANSCRIPT

IOSR Journal of Electrical and Electronics Engineering (IOSR-JEEE)
e-ISSN: 2278-1676,p-ISSN: 2320-3331, Volume 15, Issue 1 Ser. I (Jan – Feb 2020), PP 39-49
www.iosrjournals.org
DOI: 10.9790/1676-1501013949 www.iosrjournals.org 39 | Page
Impact of Optimal Placement and Sizing of Capacitors on Radial
Distribution Network using Cuckoo Search Algorithm
Sunday Adeleke Salimon1, KamiluAkinkunmi Suuti
2, Hafiz Adesupo Adeleke
3,
Kayode Ebenezer Ojo1, Hassan Adedapo Aderinko
1
1(Electronic and Electrical Engineering Department,LadokeAkintola University of Technology, Ogbomoso,
Nigeria) 2(Electrical and Electronic Engineering Department, University of Ibadan, Ibadan, Nigeria)
3(Electronic and Electrical Engineering Department, Air Force Institute of Technology, Kaduna, Nigeria)
Abstract: Background:Introduction of capacitor into a radial distribution network can bring about power loss reduction,
minimization of total cost due to power loss and compensation, improvement of network voltage profile and
stability index. This depends on the deliberate placement and sizing of shunt capacitor as improper allocation
may yield negative results. Hence this paper aim to minimize the compensation cost, reduce total power loss,
improve the voltage profile and stability index by the way of optimal placement and sizing of one to three shunt
capacitors using Cuckoo Search Algorithm as optimization technique. Methodology: In this paper, the objective function is the minimization of the total annual cost due to the radial
distribution system power losses and reactive power compensation subject to the operating constraints. The cost
of reactive power compensation includes purchase, installation and operating cost of capacitors. The
applicability of the proposed method was tested on the standard IEEE 33-bus and Ayepe 34-bus Nigerian radial
distribution network of the Ibadan Electricity Distribution Company. Four test cases were considered for the
two test systems which are the base case, one, two, three installation of shunt capacitors.
Results: The simulation results of the four test cases obtained were compared. The results demonstrate that the
proposed method is capable of saving significant amount total annual cost, reducing total power loss and attain
improvement in voltage profile and stability index. The rate of improvement of the results tends to be
insignificant as the number of capacitors optimally were increased beyond two.
Conclusion:Optimal allocation of capacitors in the radial distribution system is capable of improving the
efficiency of the system.
Key Word:Radial distribution network; Shunt Capacitors; Cuckoo Search Algorithm; Reactive power
compensation. --------------------------------------------------------------------------------------------------------------------------------------
Date of Submission: 17-01-2020 Date of Acceptance: 04-02-2020
--------------------------------------------------------------------------------------------------------------------------------------
I. Introduction In radial distribution networks, a significant amount of total power generated power is squandered as
losses due to the active and reactive current components. Several researchers have shown that the optimal
placement and sizing of shunt capacitors can reduce the losses because it provides reactive compensation [1].
Beside the advantage of loss reduction, proper placement of capacitor can also release additional reactive power
capacity within the distribution network, improve the network voltage profile and voltage stability index, power
factor correction, power quality improvement and reduction of the total of the total voltage harmonic distortion
(THD) of the distribution network [2]. In radial distribution networks, the predominantly natures of loads,
transformers and lines cause significant power losses due to lagging currents. The introduction of strategically
placed capacitors within the distribution network help to reduce the losses created by an inductive system, thus
increasing the system capacity, reducing the system losses and improving the voltage profile [3]. Due to the fact
that there are many constraints and variables present, the process for calculating the placement and sizing of
capacitors involves the evaluation of optimization function. Often this function will not only address technical
aspect of a problem, but will evaluate its cost as well. Therefore, it becomes imperative to model a solution
method that will optimize the objective function at minimal cost.
Numerous optimization techniques and models have been proposed for the solution of the optimal
sizing and placement of capacitors in a radial distribution network by several researchers. The early proposed
approaches are the analytical numeric programming optimization techniques like local variation method [4] and
mixed integer programming techniques [5,6] have been used for solving the problem. In recent years, various

Impact of Optimal Placement and Sizing of Capacitors on Radial Distribution Network using CSA
DOI: 10.9790/1676-1501013949 www.iosrjournals.org 40 | Page
meta-heuristic population based approaches have been introduced by researchers for capacitor placement
problems.
Abdul-Wafa et al [7] proposed a combination of loss sensitivity factor and fuzzy real coded Genetic
Algorithm for optimum capacitor sizing for achieving the maximum net money savings on power/energy loss
and capacitor cost. In [8], Devabalaji et al presented a combination of LSF and VSI for capacitor placement and
a Bacterial Foraging Algorithm for the capacitor sizing in a load varying environment. Sultana et al [9] used a
hybrid combination of Bat Algorithm and Cuckoo Search for optimal allocation of capacitor banks for
minimization of power and maximization of net savings. Askarzadeh et al [10] proposed a newly developed
crow search algorithm for solving the problem of optimal capacitor allocation problem in the distribution
network. El-Ela et al [11] proposed a water cycle algorithm for simultaneous optimal allocation of Capacitors
and Distributed Generation units with the objective of minimizing the power losses, total energy cost and total
emission.
The present study adopted the Cuckoo Search Algorithm for the optimal placement and sizing of shunt
capacitors with the intention of investigating the impact of the number of shunt capacitors optimally installed on
the total annual net saving, total real power losses, voltage profile and stability index of the radial distribution
network.
II. Problem Formulation Load flow for radial distribution networks
Due to the topology and radial structure of the distribution network, high resistance to reactance, large
number of nodes, ill-conditioned and unbalanced nature of loads, conventional load flow methods (such as
Gauss-Seidel, Newton Raphson, Fast decoupled methods) may provide inaccurate results and may not converge.
Hence, the forward/backward sweep load flow method as given by [12] was used to obtain the losses in the
system due to its high computational performance, implementation simplicity, robust convergence, low memory
requirement [13]. It also takes advantage of the radial structure of the distribution system in order to achieve fast
convergence.
Objective Function
The objective of the capacitor placement and sizing problem in the radial distribution network is to
minimize the total annual cost due to the network power losses and reactive power compensation subject to the
operating constraints. The cost of reactive power compensation includes purchase, installation and operation
cost of capacitors. As the location and size of capacitors are to be treated discrete, the mathematical model can
be expressed as constraint nonlinear integer optimization problem:
𝐹𝑚𝑖𝑛 = Cost of power loss + Cost of reactive power compensation 𝐹𝑚𝑖𝑛 = 𝐾𝑝x 𝑃𝑙𝑜𝑠𝑠 + α[(𝐶𝑖𝑛𝑠𝑡 x N) + 𝐶𝑐𝑎𝑝 𝑄𝑐𝑖
𝑁𝑖=1 ] + (𝐶𝑜𝑝𝑒 x N) (1)
Where 𝑃𝑙𝑜𝑠𝑠 is the total power losses, where 𝐾𝑝 is the annual cost per unit of power losses ($/kW), 𝐶𝑖𝑛𝑠𝑡 is
installation cost, N is the total number of candidate buses for capacitor placement, 𝐶𝑐𝑎𝑝 is the purchase cost of
capacitor, 𝑄𝑐𝑛 is the shunt capacitor size placed at bus n and 𝐶𝑜𝑝𝑒 is the operating cost of the capacitor.
In order to measure the value of the voltage stability in the radial distribution network, the Voltage Stability
Index (VSI) is determined. Inspecting the VSI performance exposes the buses which undergoing huge voltage
drops are weak and within the condition of corrective actions. VSI of a line can be calculated using Eq. (2) as
given by [14]
VSI(i,i+1)=│𝑉𝑖│4–4[𝑃𝑖+1𝑅𝑖+1 + 𝑄𝑖+1𝑋𝑖 ]│𝑉𝑖+1│
2-4[𝑃𝑖+1𝑅𝑖+1 + 𝑄𝑖+1𝑋𝑖+1]2 (2)
Where Vi, is the sending node voltage; while Pni, Qni, Rni, and Xni are real power, reactive power, resistance, and
impedance for the receiving node. The reactive power support provided by the capacitors also helps to enhance the voltage stability of the
distribution network.
Constraints Each capacitor size minimizing the objective function, must satisfy the following constraints.
(i) Shunt capacitor limits
𝑄𝑚𝑖𝑛 ≤ 𝑄𝑐 ≤ 𝑄𝑚𝑎𝑥 (3) Where 𝑄𝑚𝑖𝑛 is the minimum compensation limit and 𝑄𝑚𝑎𝑥 is the maximum compensation limit (ii) Bus bar voltage limits
𝑉𝑚𝑖𝑛 ≤ 𝑉𝑖 ≤ 𝑉𝑚𝑎𝑥 (4) In radial distribution networks 𝑉𝑚𝑖𝑛 = 0.95 and 𝑉𝑚𝑎𝑥 = 1.05 (iii) Total reactive power injected
𝑄𝑐𝑛𝑁𝑛=1 < 𝑄𝑡𝑜𝑡𝑎𝑙 (5)

Impact of Optimal Placement and Sizing of Capacitors on Radial Distribution Network using CSA
DOI: 10.9790/1676-1501013949 www.iosrjournals.org 41 | Page
Where 𝑄𝑡𝑜𝑡𝑎𝑙 is the total reactive load
Cuckoo Search Algorithm
Cuckoo Search Algorithm (CSA) is a meta-heuristic optimization technique whose birth was claimed
from inspiration surrounding the brood parasitism of cuckoo species, which lay their eggs in the nests of other
host birds. CS Algorithm was developed by Yang and Deb in 2009 [15], and it has been applied to various
engineering optimization problems. The fundamental ideas in modelling this algorithm was borrowed from the
fact that if a host bird discovers foreign egg in its nest, it will either abandon the nest and build a new elsewhere
or throw the foreign egg away.
Three rules are taken into account in cuckoo search algorithm as follows:
(i) At one time, each cuckoo only lays one egg, and leaves it in a randomly chosen nest; (ii) The algorithm will carry over the best nest with high quality eggs (solutions) to the next generations;
(iii) A host bird can discover a foreign egg with a probability, 𝑝𝑎= [0, 1] while the number of available host
nests is fixed. In this case, the host bird can either abandon its nest and build a completely new nest
elsewhere or simply throw the eggs away [15]. A Lévy flight is performed in other to produce new solutions, 𝑥𝑖(𝑡+1)for a cuckoo ias given in
the equation. 𝑥𝑖(𝑡+1)=𝑥𝑖(𝑡)+ α⊕ Levy(𝛌) (17) where α is the step size which should be associated to the problem of interests scales; α can be set to value 1 in
most situations. Equation (12) is basically the stochastic equation for random walk, which is a Markov chain
whose next status or location only depends on the current status or location, and the transition probability, which
are the first and second term respectively. The product ⊕ represents the entry wise multiplication, which is
similar to those used in Particle Swarm Optimization (PSO). In terms of exploring the search space, random
walk via Lévy flight is more efficient as its step length is much longer in the long run [16]. The random step length of Lévy flight, which fundamentally provides a random walk, is derived from a
Lévy distribution with an infinite variance and infinite mean [15].
Levy~ u =𝑡−𝜆 (18) Here, the sequential jumps of a cuckoo fundamentally form a random walk process with a power law
step length distribution with a heavy tail [16]. Numerous new solutions should be generated by Lévy walk near
the best solution obtained, since this procedure will speed up the local exploration. However, to confirm the
algorithm will not be trapped in a local optimum, a substantial part of the new solutions must be generated
through far field randomization, so that the locations would be sufficiently far from the current best solution
[15].
Application of Cuckoo Search Algorithm to Capacitor Placement
This paper reports the successful application of CS algorithm for capacitor placement problem to
minimize the cost due to the system total power loss and reactive power compensation. The details of the
solution procedure are provided below:
(1) Input data: the data to be fed as input are listed below.
(a) Number of buses.
(b) Load demand active (kW) and reactive (kVAr) power at each bus.
(c) Bus voltage limit (𝑉𝑚𝑖𝑛 and 𝑉𝑚𝑎𝑥 ). (d) Distribution lines‟ impedances (resistance and reactance).
(e) Distribution lines‟ capacity (maximum allowable power flow).
(f) The number of capacitor banks to be installed (N=1,2 and 3)
(g) CS parameters (number of nests, n=25, step size, α=1, maximum number of iterations, Kmax =100,
probability to discover foreign eggs, 𝑃𝑎 = 0.6). (2) Perform the initial load flow analysis using the Backward/Forward Sweep load flow for radial distribution
networks without capacitor compensation for the base case.
(3) Generate initial population of the hoist nest (solution vector) XN
The solution can be split into two parts, the first part carries the locations for capacitor banks and the second
part carries the integer representing size of the capacitor bank to be placed. To extract the size of the capacitor
bank, a multiplication factor is employed. KVAr = a*50 + 100, where, „a‟ is an integer representing the size of
the capacitor bank.
For installation of a single capacitor, N=1
𝑋1 =
59
1526
⋮⋮⋮⋮
5348
(19)
Impact of Optimal Placement and Sizing of Capacitors on Radial Distribution Network using CSA
DOI: 10.9790/1676-1501013949 www.iosrjournals.org 42 | Page
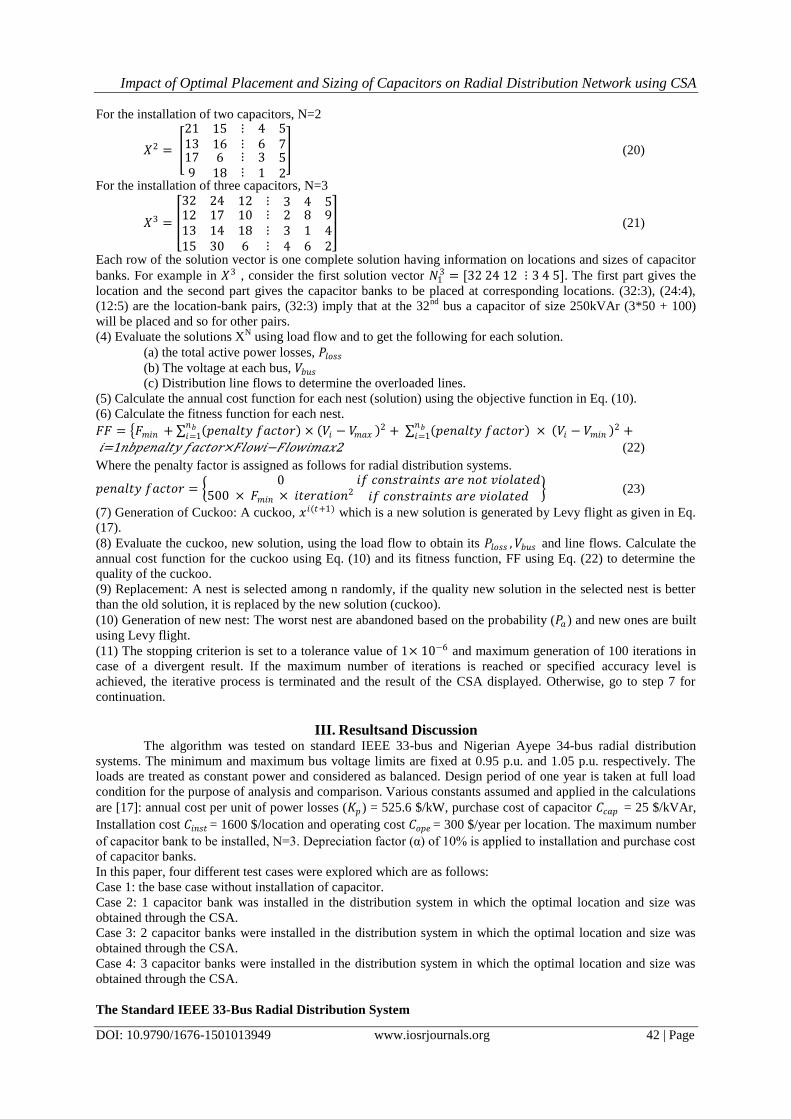
For the installation of two capacitors, N=2
𝑋2 =
2113179
15166
18
⋮⋮⋮⋮
4631
5752
(20)
For the installation of three capacitors, N=3
𝑋3 =
32 24 12 ⋮ 3 4 5121315
171430
10186
⋮⋮⋮
234
816
942
(21)
Each row of the solution vector is one complete solution having information on locations and sizes of capacitor
banks. For example in 𝑋3 , consider the first solution vector 𝑁13 = [32 24 12 ⋮ 3 4 5]. The first part gives the
location and the second part gives the capacitor banks to be placed at corresponding locations. (32:3), (24:4),
(12:5) are the location-bank pairs, (32:3) imply that at the 32nd
bus a capacitor of size 250kVAr (3*50 + 100)
will be placed and so for other pairs. (4) Evaluate the solutions X
N using load flow and to get the following for each solution.
(a) the total active power losses, 𝑃𝑙𝑜𝑠𝑠 (b) The voltage at each bus, 𝑉𝑏𝑢𝑠 (c) Distribution line flows to determine the overloaded lines.
(5) Calculate the annual cost function for each nest (solution) using the objective function in Eq. (10).
(6) Calculate the fitness function for each nest.
𝐹𝐹 = 𝐹𝑚𝑖𝑛 + 𝑝𝑒𝑛𝑎𝑙𝑡𝑦 𝑓𝑎𝑐𝑡𝑜𝑟 × 𝑉𝑖 − 𝑉𝑚𝑎𝑥 2 + 𝑝𝑒𝑛𝑎𝑙𝑡𝑦 𝑓𝑎𝑐𝑡𝑜𝑟 × 𝑉𝑖 − 𝑉𝑚𝑖𝑛 2 +𝑛𝑏𝑖=1
𝑛𝑏𝑖=1
𝑖=1𝑛𝑏𝑝𝑒𝑛𝑎𝑙𝑡𝑦 𝑓𝑎𝑐𝑡𝑜𝑟×𝐹𝑙𝑜𝑤𝑖−𝐹𝑙𝑜𝑤𝑖𝑚𝑎𝑥2 (22)
Where the penalty factor is assigned as follows for radial distribution systems.
𝑝𝑒𝑛𝑎𝑙𝑡𝑦 𝑓𝑎𝑐𝑡𝑜𝑟 = 0
500 × 𝐹𝑚𝑖𝑛 × 𝑖𝑡𝑒𝑟𝑎𝑡𝑖𝑜𝑛2 𝑖𝑓 𝑐𝑜𝑛𝑠𝑡𝑟𝑎𝑖𝑛𝑡𝑠 𝑎𝑟𝑒 𝑛𝑜𝑡 𝑣𝑖𝑜𝑙𝑎𝑡𝑒𝑑
𝑖𝑓 𝑐𝑜𝑛𝑠𝑡𝑟𝑎𝑖𝑛𝑡𝑠 𝑎𝑟𝑒 𝑣𝑖𝑜𝑙𝑎𝑡𝑒𝑑 (23)
(7) Generation of Cuckoo: A cuckoo, 𝑥𝑖(𝑡+1) which is a new solution is generated by Levy flight as given in Eq.
(17). (8) Evaluate the cuckoo, new solution, using the load flow to obtain its 𝑃𝑙𝑜𝑠𝑠 , 𝑉𝑏𝑢𝑠 and line flows. Calculate the
annual cost function for the cuckoo using Eq. (10) and its fitness function, FF using Eq. (22) to determine the
quality of the cuckoo. (9) Replacement: A nest is selected among n randomly, if the quality new solution in the selected nest is better
than the old solution, it is replaced by the new solution (cuckoo).
(10) Generation of new nest: The worst nest are abandoned based on the probability (𝑃𝑎 ) and new ones are built
using Levy flight. (11) The stopping criterion is set to a tolerance value of 1× 10⁻⁶ and maximum generation of 100 iterations in
case of a divergent result. If the maximum number of iterations is reached or specified accuracy level is
achieved, the iterative process is terminated and the result of the CSA displayed. Otherwise, go to step 7 for
continuation.
III. Resultsand Discussion The algorithm was tested on standard IEEE 33-bus and Nigerian Ayepe 34-bus radial distribution
systems. The minimum and maximum bus voltage limits are fixed at 0.95 p.u. and 1.05 p.u. respectively. The
loads are treated as constant power and considered as balanced. Design period of one year is taken at full load
condition for the purpose of analysis and comparison. Various constants assumed and applied in the calculations
are [17]: annual cost per unit of power losses (𝐾𝑝 ) = 525.6 $/kW, purchase cost of capacitor 𝐶𝑐𝑎𝑝 = 25 $/kVAr,
Installation cost 𝐶𝑖𝑛𝑠𝑡 = 1600 $/location and operating cost 𝐶𝑜𝑝𝑒 = 300 $/year per location. The maximum number
of capacitor bank to be installed, N=3. Depreciation factor (α) of 10% is applied to installation and purchase cost
of capacitor banks.
In this paper, four different test cases were explored which are as follows:
Case 1: the base case without installation of capacitor.
Case 2: 1 capacitor bank was installed in the distribution system in which the optimal location and size was
obtained through the CSA.
Case 3: 2 capacitor banks were installed in the distribution system in which the optimal location and size was
obtained through the CSA.
Case 4: 3 capacitor banks were installed in the distribution system in which the optimal location and size was
obtained through the CSA.
The Standard IEEE 33-Bus Radial Distribution System

Impact of Optimal Placement and Sizing of Capacitors on Radial Distribution Network using CSA
DOI: 10.9790/1676-1501013949 www.iosrjournals.org 43 | Page
The IEEE 33-bus system is a standardized test system with a base voltage and base MVA of 12.66kV
and 100MVA respectively. The power of all network buses are assumed to be delivered by the substation placed
at node 1. The line and load data are gotten from [18]. The total real power loads and reactive loads on the 33
radial distribution system are 3.715 MW and 2.3 Mvar respectively. The test system has a total thirty-three
buses with thirty branches as shown in Figure 1. The number of stages (number of iterations), Kmax =100, and
the possible capacitor banks in discrete sizes are assumed to be from 150 kVar to 1500 kVar in multiples of 50.
The simulation results of the four test cases after running the algorithm are tabulated in Table I while the
characteristics of the voltage profile and the voltage stability index are illustrated in Figures (3) and (4)
respectively.
Figure 1: Standard IEEE 33-Bus Test System
Table no 1: Comparison of Results Between the Four Test Cases for Standard IEEE 33-Bus Base Case 1 Capacitor 2 Capacitors 3 Capacitors
Optimal Bus ------- 30 30, 13 30, 24, 11
Capacitor size (kVar) ------ 1200 1000, 400 950, 400, 450
Power loss (kW) 210.99 151.52 142.07 138.65
Qloss (kVar) 143.13 103.38 96.62 94.41
Annual Cost ($) 110, 896.34 83,078.50 79, 148.97 78, 839.03
Net Savings ($) -------- 27,817.84 31,747.37 32,057.31
Min Voltage 0.9038 (18) 0.9159 (18) 0.9308 (18) 0.9321 (18)
Min VSI 0.6689 0.7041 0.7510 0.7554
Ploss Reduction -------- 59.47 68.92 72.34
% Ploss Reduction -------- 28.18 32.66 34.28
% Net Savings -------- 25.08 28.63 28.91
In Table I, it can be seen that the real power loss, reactive power loss and the annual cost for the base
case are 210.99 kW, 143.13 kVar and $110, 896.34, respectively. After running the algorithm for optimal
installation of one capacitor, the returned optimal size is 1200 kVar at bus 30 with total real power loss of
151.52 kW, total reactive power loss of 103.38 kVar and total annual cost of $ 83,078.50. For optimal
installation of two capacitor banks, the optimum solutions obtained are 1000 kVar at bus 30 and 400 kVar at bus
13 with total power loss of 142.07 kW, total reactive power loss of 96.62 kVar and total annual cost of $79,
148.97. For optimal placement of three capacitor banks, the optimum sizes obtained by the algorithm are 950
kVar at bus 30, 400 kVar at bus 24 and 450 kVar at bus 11 with total real power loss of 138.65 kW, total
reactive power loss of 94.41 kVar and total annual cost of $78,839.03.
It can be seen from Table I that the real power loss reduction in case of one, two, three capacitor banks
optimal installation are 59.47 kW (28.18%), 68.92 kW (32.66%) and 72.34 kW (34.28%), respectively
compared to the base case. The annual net savings for case two, three and four are $27, 817.84 (25.08%), $31,
747.84 (28.63%) and $32,057.31 (28.91%) compared to the base case. The results show that there are real power
loss reduction and net savings with optimal installation of one capacitor bank and there is further loss reduction
and more net savings with increase in the number of capacitors even though the rate of increment is declining as
the capacitor banks are increased. From Figures 3 and 4, the voltage profile and VSI values of the distribution
network were poor for the base case and improved after the installation of capacitor. There is further
improvement in both the voltage profile and VSI values as the number of capacitors are increased even though it
is very slim between cases three and four. The difference in the increment in both the voltage profile and the
VSI values tends to decline as the number of shunt capacitors optimally installed are increased from two to
three.

Impact of Optimal Placement and Sizing of Capacitors on Radial Distribution Network using CSA
DOI: 10.9790/1676-1501013949 www.iosrjournals.org 44 | Page
The results obtained for case four from the proposed algorithm is compared with other existing
techniques as shown in Table 2. The results show the efficiency of the proposed method in finding optimal
capacitor allocation. The convergence characteristics for cases two, three and four are illustrated in Figure 4.
The performance of the proposed algorithm over 20 independent runs of simulation for compensation cost
minimization for the different cases with best, average and worst values of power loss and its standard deviation
is presented in Table 3. The results show that the algorithm is very precise which indicates its output
consistency.
Figure 2: Voltage Profile of each bus in the 33 Bus for the Different Cases
Figure 3: VSI values of the Standard IEEE 33 Bus for the Different Cases
Table no 2: Optimal CBs Allocation in the 33-bus system (Case 3) Optimization Technique
CBs size (kVAr) and location Base Ploss (kW)
Ploss (kW)
Ploss Reduction
GSA [19] 450(13), 800(15), 350(26) 202.6 134.5 68.1
CSA [20] 600(11), 300(33), 450(24), 600(30) 202.6 131.5 71.1
PSO [20] 900(2),450(7), 450(11),300(15), 450(29) 202.6 132.48 69.52
BFOA [21] 349.6(18), 820.6(30), 277.3(33) 202.6 144.04 58.56
IMDE [22] 475(14), 1037(30) 202.6 139.7 62.9
WCA [11] 397.3(14), 451.1(24), 1000(30) 202.6 130.91 71.69
SSA [23] 450(10), 450(23), 1050(29) 202.6 132.35 70.25
Proposed method 450(11), 400(24), 950(30) 210.99 138.65 72.34

Impact of Optimal Placement and Sizing of Capacitors on Radial Distribution Network using CSA
DOI: 10.9790/1676-1501013949 www.iosrjournals.org 45 | Page
(a) Case Two (b) Case Three
(c) Case Four
Figure 4: Convergence Characteristics for the Different Cases
Table no 3: Simulation results of total annual cost achieved by the algorithm over 20 independent runs Best Average Worst Standard deviation
Case 2 (kW) 83, 078.50 83, 295.04 84, 113.34 281.91
Case 3 (kW) 79, 148.97 81, 408.11 82, 674.34 1025.04
Case 4 (kW) 78, 839.03 80, 972.80 82, 203.25 1030.90
Ayepe 34-bus Nigerian radial distribution network
The second network used to test the algorithm is the Ayepe 34-bus radial distribution network of the
Ibadan Electricity Distribution Company (IBEDC), Ibadan, Nigeria. The network consists of 34 buses with the
first bus serving as the substation which delivers load to other buses in the network. The total real power loads
and reactive loads on the 34 bus network are 4.12 MW and 2.05 Mvar respectively. The line and load data are
obtained from [13]. The loads were modelled using steady state values of the real and reactive power they
consumed. The single-line diagram of the Ayepe 34-Bus feeder is as depicted in Figure 5. The number of stages
(number of iterations), Kmax =100, and the possible capacitor banks in discrete sizes are assumed to be from 150
kVar to 1000 kVar in multiples of 50.
The simulation results of the four test cases after running the algorithm are tabulated in Table 4 while
the characteristics of the voltage profile and the voltage stability index are illustrated in Figures (6) and (7)
respectively.
Impact of Optimal Placement and Sizing of Capacitors on Radial Distribution Network using CSA
DOI: 10.9790/1676-1501013949 www.iosrjournals.org 46 | Page
2 3 4 5 6 7 8 9
10 11
12 13
14 15
16
17
18
19 20
21
22
23
24
25
26
27
28
29
30
33
32
31
34
1
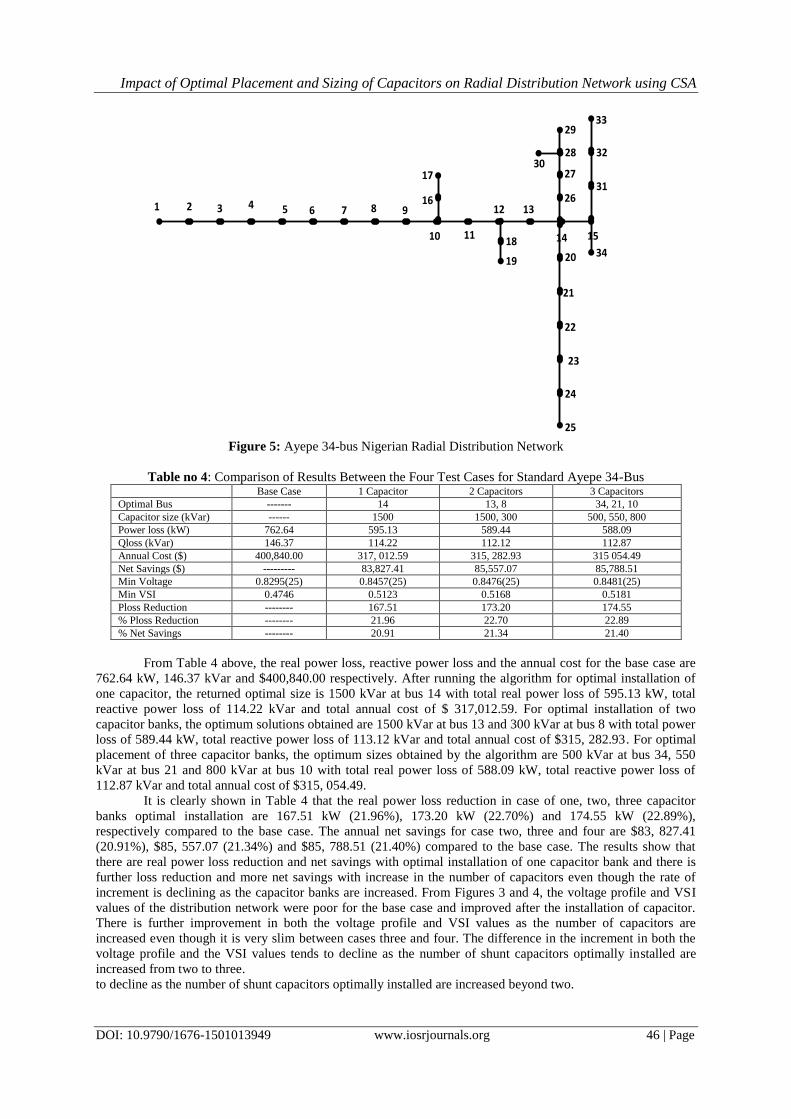
Figure 5: Ayepe 34-bus Nigerian Radial Distribution Network
Table no 4: Comparison of Results Between the Four Test Cases for Standard Ayepe 34-Bus Base Case 1 Capacitor 2 Capacitors 3 Capacitors
Optimal Bus ------- 14 13, 8 34, 21, 10
Capacitor size (kVar) ------ 1500 1500, 300 500, 550, 800
Power loss (kW) 762.64 595.13 589.44 588.09
Qloss (kVar) 146.37 114.22 112.12 112.87
Annual Cost ($) 400,840.00 317, 012.59 315, 282.93 315 054.49
Net Savings ($) --------- 83,827.41 85,557.07 85,788.51
Min Voltage 0.8295(25) 0.8457(25) 0.8476(25) 0.8481(25)
Min VSI 0.4746 0.5123 0.5168 0.5181
Ploss Reduction -------- 167.51 173.20 174.55
% Ploss Reduction -------- 21.96 22.70 22.89
% Net Savings -------- 20.91 21.34 21.40
From Table 4 above, the real power loss, reactive power loss and the annual cost for the base case are
762.64 kW, 146.37 kVar and $400,840.00 respectively. After running the algorithm for optimal installation of
one capacitor, the returned optimal size is 1500 kVar at bus 14 with total real power loss of 595.13 kW, total
reactive power loss of 114.22 kVar and total annual cost of $ 317,012.59. For optimal installation of two
capacitor banks, the optimum solutions obtained are 1500 kVar at bus 13 and 300 kVar at bus 8 with total power
loss of 589.44 kW, total reactive power loss of 113.12 kVar and total annual cost of $315, 282.93. For optimal
placement of three capacitor banks, the optimum sizes obtained by the algorithm are 500 kVar at bus 34, 550
kVar at bus 21 and 800 kVar at bus 10 with total real power loss of 588.09 kW, total reactive power loss of
112.87 kVar and total annual cost of $315, 054.49.
It is clearly shown in Table 4 that the real power loss reduction in case of one, two, three capacitor
banks optimal installation are 167.51 kW (21.96%), 173.20 kW (22.70%) and 174.55 kW (22.89%),
respectively compared to the base case. The annual net savings for case two, three and four are $83, 827.41
(20.91%), $85, 557.07 (21.34%) and $85, 788.51 (21.40%) compared to the base case. The results show that
there are real power loss reduction and net savings with optimal installation of one capacitor bank and there is
further loss reduction and more net savings with increase in the number of capacitors even though the rate of
increment is declining as the capacitor banks are increased. From Figures 3 and 4, the voltage profile and VSI
values of the distribution network were poor for the base case and improved after the installation of capacitor.
There is further improvement in both the voltage profile and VSI values as the number of capacitors are
increased even though it is very slim between cases three and four. The difference in the increment in both the
voltage profile and the VSI values tends to decline as the number of shunt capacitors optimally installed are
increased from two to three.
to decline as the number of shunt capacitors optimally installed are increased beyond two.

Impact of Optimal Placement and Sizing of Capacitors on Radial Distribution Network using CSA
DOI: 10.9790/1676-1501013949 www.iosrjournals.org 47 | Page
Figure 6: Voltage Profile of each bus in the Ayepe 34-Bus for the Different Cases
Figure 7: VSI values of the Ayepe 34-Bus for the Different Cases
The convergence characteristics for cases two, three and four are illustrated in Figure 4. The
performance of the proposed algorithm over 20 independent runs of simulation for compensation cost
minimization for the different cases with best, average and worst values of power loss and its standard deviation
is presented in Table 5. The results show that the algorithm is very precise which indicates its output
consistency.
Impact of Optimal Placement and Sizing of Capacitors on Radial Distribution Network using CSA
DOI: 10.9790/1676-1501013949 www.iosrjournals.org 48 | Page
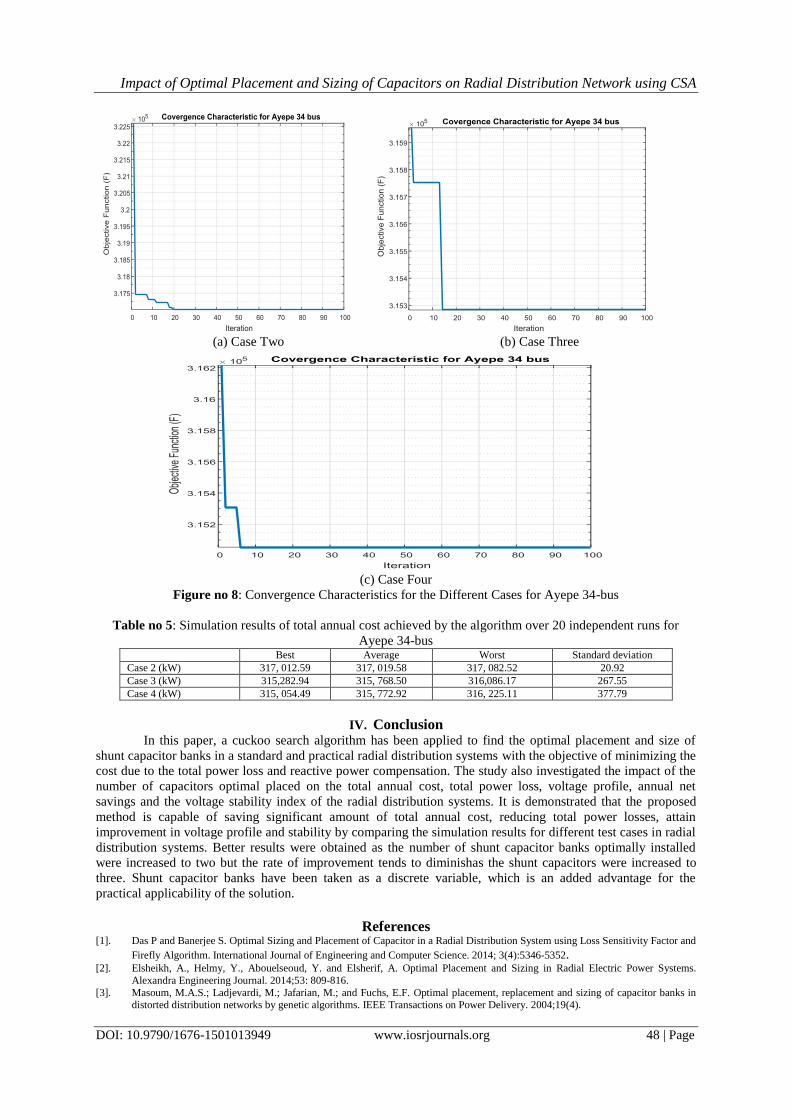
(a) Case Two (b) Case Three
(c) Case Four
Figure no 8: Convergence Characteristics for the Different Cases for Ayepe 34-bus
Table no 5: Simulation results of total annual cost achieved by the algorithm over 20 independent runs for
Ayepe 34-bus Best Average Worst Standard deviation
Case 2 (kW) 317, 012.59 317, 019.58 317, 082.52 20.92
Case 3 (kW) 315,282.94 315, 768.50 316,086.17 267.55
Case 4 (kW) 315, 054.49 315, 772.92 316, 225.11 377.79
IV. Conclusion
In this paper, a cuckoo search algorithm has been applied to find the optimal placement and size of
shunt capacitor banks in a standard and practical radial distribution systems with the objective of minimizing the
cost due to the total power loss and reactive power compensation. The study also investigated the impact of the
number of capacitors optimal placed on the total annual cost, total power loss, voltage profile, annual net
savings and the voltage stability index of the radial distribution systems. It is demonstrated that the proposed
method is capable of saving significant amount of total annual cost, reducing total power losses, attain
improvement in voltage profile and stability by comparing the simulation results for different test cases in radial
distribution systems. Better results were obtained as the number of shunt capacitor banks optimally installed
were increased to two but the rate of improvement tends to diminishas the shunt capacitors were increased to
three. Shunt capacitor banks have been taken as a discrete variable, which is an added advantage for the
practical applicability of the solution.
References [1]. Das P and Banerjee S. Optimal Sizing and Placement of Capacitor in a Radial Distribution System using Loss Sensitivity Factor and
Firefly Algorithm. International Journal of Engineering and Computer Science. 2014; 3(4):5346-5352. [2]. Elsheikh, A., Helmy, Y., Abouelseoud, Y. and Elsherif, A. Optimal Placement and Sizing in Radial Electric Power Systems.
Alexandra Engineering Journal. 2014;53: 809-816.
[3]. Masoum, M.A.S.; Ladjevardi, M.; Jafarian, M.; and Fuchs, E.F. Optimal placement, replacement and sizing of capacitor banks in distorted distribution networks by genetic algorithms. IEEE Transactions on Power Delivery. 2004;19(4).
Impact of Optimal Placement and Sizing of Capacitors on Radial Distribution Network using CSA
DOI: 10.9790/1676-1501013949 www.iosrjournals.org 49 | Page
[4]. Ponnavaiko M., Prakasa Rao K.S. Optimal Placement of Fixed and Switched Shunt Capacitors on Radial Distributors by the
Method of Local Variations.IEEE Transaction Power Application System. 1989; 102:725-734.
[5]. Baran, M.E. and Wu, F.F. Optimal Capacitor Placement on Radial Distribution Systems. IEEE Transaction Power Delivery. 1985; 4: 725-34.
[6]. Khodr, H.M., Olsina, F.G., De Oliveira-De Jesus, P.M. and Yusta, J.M. Maximum Savings Approach for Location and Sizing of
Capacitors in Distribution Systems.Elect Power Energy System Research.2008; 78:1192-203. [7]. Abul‟Wafa, A.R. Optimal capacitor placement for enhancing voltage stability in distribution systems using analytical algorithm and
Fuzzy-Real Coded GA. International Journal of Electrical Power & Energy Systems. 201455, pp. 246-252, 2014
[8]. Devabalaji, K.R., Ravi, K. and Kothari, D.P. Optimal location and sizing of capacitor placement in radial distribution system using bacterial foraging optimization algorithm. International Journal of Electrical Power & Energy Systems. 2015; 71: 383-390.
[9]. Sultana, S. and Roy, P.K. Optimal capacitor placement in radial distribution systems using teaching learning-based optimization.
International Journal of Electrical Power & Energy Systems. 2014; 54:387-398. [10]. Askarzadeh, A. Capacitor placement in distribution systems for power loss reduction and voltage improvement: a new
methodology. IET Generation, Transmission & Distribution. 2016; 10(14): 3631-3638.
[11]. El-Ela, A.A.A., El-Sehiemy, R.A. and Abbas, A.S. Optimal Placement and Sizing of Distributed Generation and Capacitor Banks in Distribution Systems Using Water Cycle Algorithm. IEEE Systems Journal, vol. 1, no. 99, pp. 1-8, 2018.
[12]. Salimon, S.A., Aderinko, H.A., Fajuke, F.I., and Suuti, K.A. Load Flow Analysis of Nigerian Radial Distribution Network using
Backward/Forward Sweep Technique. Journal of VLSI Design and its Advancement. 2019; 2(3): 1-11. [13]. Adepoju, G.A., Salimon, S.A., Aderinko, H.A. and Bisiriyu, A.O. Optimal Placement and Sizing of Distributed Generation in a
Nigerian Distribution Network using Cuckoo Search Algorithm. Current Journal of Applied Science and Technology. 2019;
38(6):1-12. [14]. Tan, W.S., Hassan M.Y., Majid M.S., Rahman H.A. Allocation and sizing of DG using Cuckoo Search. IEEE International
Conference on Power and Energy (PECon), Kota Kinabalu Sabah, Malasia. 2012;133–138.
[15]. Yang, XS and Deb S. Cuckoo Search via Levy Flights. In Nature and Inspired Biologically Computing (NaBIC 2009), World Congress. 2009; 210-214.
[16]. Yang X.S. and Deb, S. Engineering Optimization by Cuckoo Search. Int. J. Mathematically Modelling and Numerical Optimization.
2010; 1:330-343. [17]. Gnanasekaran, N., Chandramamohan, S., Kumar, P.S. and Imran, A. M. Optimal Placement of Capacitors in Radial Distribution
System using Shark Smell Optimization Algorithm.Aim Shams Engineering Journal. 2016; 7:907-916.
[18]. Das, D., Kothari, D., and Kalam A. Simple and Efficient Method for Load Flow Solution of Radial Distribution Network. International Journal Electrical Power Energy System. 1995; 17(5): 335-346.
[19]. Shuaib, Y.M., Kalavathi, M.S. andRajan, C.C.A. Optimal capacitor placement in radial distribution system using gravitational
search algorithm. International Journal of Electrical Power & Energy Systems. 2015; 64: 384-397. [20]. Askarzadeh, A. Capacitor placement in distribution systems for power loss reduction and voltage improvement: a new
methodology. IET Generation, Transmission & Distribution. 2016: 10(14): 3631-3638.
[21]. Kowsalya, M. Optimal Distributed Generation and capacitor placement in power distribution networks for power loss minimization.International Conference on Advances in Electrical Engineering (ICAEE). 2014; 1-6.
[22]. Khodabakhshian, A. and Andishgar, M.H. Simultaneous placement and sizing of DGs and shunt capacitors in distribution systems
by using IMDE algorithm. International Journal of Electrical Power & Energy Systems. 2016; 82: 599-607.
[23]. Sambaiah, K.S. and Jayabarathi, T. Optimal Allocation of Renewable Distributed Generation and Capacitor Banks in Distributed
Systems using Salp Swarm Algorithm International Journal of Renewable Energy Research. 2019; 9(1): 96-107.
Sunday AdelekeSalimon, et.al.“Impact of Optimal Placement and Sizing of Capacitors on Radial
Distribution Network using Cuckoo Search Algorithm.”IOSR Journal of Electrical and
Electronics Engineering (IOSR-JEEE), 15(1), (2020): pp.39-49.