impact of non-co2 combustion effects from aviation on the...
TRANSCRIPT

Impact of Non-CO2 Combustion Effects from Aviation on the Environmental Feasibility of Alternative Jet Fuels
Russell Stratton PhD Candidate
PARTNER Department of Aeronautics and Astronautics
Massachusetts Institute of Technology [email protected]
Dr. James Hileman Research Advisor
Principal Research Engineer Massachusetts Institute of Technology
Submitted to The 7th Annual Joseph A. Hartman
Student Paper Competition
January 31st, 2011 Massachusetts Institute of Technology
Cambridge, Massachusetts, USA

7TH ANNUAL JOSEPH A. HARTMAN PAPER COMPETITION
-1-
Table of Contents
Abstract........................................................................................................................................................ 2
1 Introduction........................................................................................................................................... 2
2 Methods ................................................................................................................................................. 4
2.1 Functional Unit................................................................................................................................................4 2.2 Modeling Framework .....................................................................................................................................5 2.3 Model Uncertainty ..........................................................................................................................................6 2.4 Combustion of SPK Fuel Compared to Conventional Jet Fuel ..................................................................6 2.5 Climate Metrics ...............................................................................................................................................7
3 Results .................................................................................................................................................... 8
3.1 Non-CO2 Ratios for Conventional and SPK Fuel ........................................................................................8 3.2 Well to wake (+) Emissions Inventories ......................................................................................................10 3.3 Sensitivity of Results to Time Window........................................................................................................13
3.3.1 Baseline Conventional Jet Fuel from US Crude Oil ................................................................................13 3.3.2 Baseline Conventional Jet Fuel from Nigerian Crude Oil .......................................................................13 3.3.3 Baseline Rapeseed Oil to HRJ Fuel .........................................................................................................14 3.3.4 Combustion Emissions and Effects of Conventional Jet Fuel .................................................................14
4 Discussion and Conclusions ............................................................................................................... 15
Acknowledgments ..................................................................................................................................... 16
Appendix A - Characterization of SPK Combustion Emissions and Effects ...................................... 16
References .................................................................................................................................................. 18
Student Biography .................................................................................................................................... 19

7TH ANNUAL JOSEPH A. HARTMAN PAPER COMPETITION
-2-
Impact of Non-CO2 Combustion Effects from Aviation on the Environmental Feasibility of Alternative Jet Fuels Russell W. Stratton Massachusetts Institute of Technology, 77 Massachusetts Avenue, Cambridge, Massachusetts, 02139
Abstract
Alternative fuels represent a potential option for reducing the climate impacts of the aviation sector. The climate
impacts of alternative fuels are traditionally considered as a ratio of life cycle greenhouse gas (GHG) emissions to
those of the displaced petroleum product; however, this ignores the climate impacts of the non-CO2 combustion
effects from aircraft in the upper atmosphere. The results of this study show that including non-CO2 combustion
emissions and effects in the life cycle of Synthetic Paraffinic Kerosene (SPK) can lead to a decrease in the relative
merit of SPK fuels relative to conventional jet fuel. For example, an SPK fuel option with zero life cycle GHG
emissions would offer a 100% reduction in GHG emissions but only a 53% reduction in actual climate impact using
a 100-year time window and the nominal climate modeling assumption set outlined herein. Therefore, climate
change mitigation policies for aviation that rely exclusively on relative well-to-wake life cycle GHG emissions as a
proxy for aviation climate impact may overestimate the benefit of alternative fuel use on the global climate system.
1 Introduction
Aviation plays a key role in the global economy and transportation systems. Projections indicate that over the next 2
decades, the demand for aviation within the US will grow at roughly 2% per annum (1). Mitigating climate change
from the aviation sector can be simplified to consuming less energy, either through improvements in aircraft
technology or operational efficiency, and reducing the climate impacts of the energy source, through the use of
alternative fuels. Synthetic Paraffinic Kerosene, currently the most promising fuel composition for use in aviation,
can be created via: 1) Gasification of coal, natural gas, or biomass to form synthesis gas, which is processed using
Fischer-Tropsch (F-T) synthesis, and subsequently upgraded to a product slate that includes a synthetic jet fuel; and
2) Hydroprocessing of renewable oils, such as those created from jatropha, camelina, and algae, among many others,
to create a Hydroprocessed Renewable Jet (HRJ) fuel (2). These fuels differ from conventional jet fuel in that they
are comprised solely of paraffinic hydrocarbons and contain neither aromatic compounds nor sulfur (3).

7TH ANNUAL JOSEPH A. HARTMAN PAPER COMPETITION
-3-
The potential of a particular fuel to reduce greenhouse gas emissions (GHG) is generally assessed through a
comparison of the life cycle GHG emissions inventory of the alternative fuel with that of the fuel it is intended to
displace (2). A life cycle GHG emissions inventory encompasses emissions from recovery and transportation of the
feedstock to the production facility, processing of these materials into fuels, transportation and distribution of the
fuel to the aircraft tank, and finally, the combustion of the fuel in the aircraft. The term “well-to-wake” is used to
describe the life cycle GHG inventory of aviation fuels. Life cycle analyses of bio-based, ground transportation fuels
assume that the emissions from fuel combustion are equal and opposite to the emissions absorbed from the
atmosphere during growth of the feedstock (4, 5). However, this approach neglects non-CO2 combustion emissions
and effects, namely, soot and sulfate aerosols, water vapor, and NOX. Aviation also causes contrails and induced
cirrus clouds called contrail cirrus. Such products will exist even if the net GHG emissions from the fuel life cycle
are zero. Figure 1 schematically demonstrates the life cycle impacts pathway of aviation related climate change
using a bio-based fuel starting with emissions from fuel production and fuel combustion in the engine and
culminating in societal impacts.
Figure 1: Aviation climate change impacts pathway (adapted from (6))
Soot and sulfate aerosols generate atmospheric warming and cooling, respectively, and have lifetimes on the order
!"#$%&'%("$)*+,&-".*/'01-23'#*405225'#26*!"#$%$&"'$%$(#"$%$)"'$%$(!$%$*++,$%$&#$%$"#$%$!"$
7-).6*!-(.$%$)$
/01$
&#$%$"#$
!"#$ &"2$ (#"$ )"'$ )++,$(!$
"345-$67,584$
!94.035:$;453<+-*$ =031+79>*035:$?1+34**4*$
@!"#$ @!(A$ @"B$@/41+*+:$ !+-,150:*$
@!:+CD*$
@(#"$
!95-E4*$0-$,4.7415,C14F$*45$:4G4:F$034H*-+I$3+G41F$7143070,5<+-F$4,3J$
K51.0-E$ !++:0-E$@)++,$L$K51.0-E$@)C:M5,4*$L$!++:0-E$
N0143,$O.0**0+-*$
/,.+*794103$?1+34**4*$
!95-E4*$0-$;5D05<G4$P+130-E$
!:0.5,4$!95-E4$
()..%&'%!"#$*89))#:'-2)*8"2*405225'#26*$!"#$%$!(A$%$&#"$
/-.3;"3'#*<*="9;)23#>*
?"@*A"&)95".*A';)0)#&*
B)&*7-).*C9'D-,3'#*
B)&*7-).*!9"#2E'9&"3'#*
O-41E>$!+Q?1+DC3,*$
!(A$
@!(A$
&#"$
@&#"$
B)&*7-).*/'01-23'#*
PC4:$R0M4$$!>3:4$),5E4*$
/E103C:,C14$5-D$M+14*,1>F$43+*>*,4.*F$4-41E>$71+DC3<+-$5-D$3+-*C.7<+-F$9C.5-$945:,9F$*+305:$4S43,*F$4,3J$T.753,*$
!"#$ U0+.5**$!+Q?1+DC3,*$

7TH ANNUAL JOSEPH A. HARTMAN PAPER COMPETITION
-4-
of days to weeks (7). Contrails and contrail cirrus sustain only for hours to days and cause atmospheric warming
(6,8); however, their impact is the most uncertain of all aviation induced climate forcing (6). NOX results in both
short-term warming and long-term cooling. In the months following a pulse of NOX in the upper atmosphere, ozone
production is stimulated causing a short term warming. The NOX also stimulates the production of additional OH,
acting as a sink for CH4. The corresponding reduction in CH4, which is an important ozone precursor, leads to a
long-term reduction in ozone. Both the long-term reduction in CH4 and ozone cool the atmosphere and decay with a
lifetime of approximately 11 years (9).
The purely paraffinic nature and lack of sulfur present in SPK fuels has been shown to cause changes in the
combustion emissions from gas turbine engines (10-13); hence, the purpose of this paper is twofold: 1) develop
ratios by which the CO2 from combustion can be scaled to include the climate forcing from non-CO2 combustion
effects of conventional jet fuel and SPK, and 2) quantify how including non-CO2 combustion species within the fuel
life cycle changes the merit of alternative jet fuels relative to conventional jet fuel from the perspective of climate
change. Select jet fuel life cycle GHG inventories developed by Stratton et al. (2) are subsequently leveraged as
examples of how non-CO2 combustion effects change the climate change mitigation potential of alternative fuel
options; however, the conclusions of this work are independent of the life cycle GHG inventories to which the
climate forcing from non-CO2 combustion effects are added.
2 Methods
This paper implements a modified version of the climate impacts module of the Aviation Portfolio Management
Tool (APMT) to establish a ‘basis of equivalence’ between emissions of different species, such that the climate
impacts of non-CO2 combustion emissions and effects can be related to those of CO2. This process is described in
further detail in Sections 2.1 through 2.5.
2.1 Functional Unit
Well-to-wake GHG emissions are presented per unit of energy (lower heating value) consumed by the aircraft. The
life cycle emissions of a fuel pathway can be presented either with or without the inclusion of climate impacts from
7TH ANNUAL JOSEPH A. HARTMAN PAPER COMPETITION
-5-
non-CO2 combustion emissions and effects. When non-CO2 combustion emissions and effects are ignored, the
emissions inventory is a pure GHG emissions inventory composed of CO2, CH4 and N2O.
€
CO2e( )well-to-wake = CO2 +CH4 ⋅ GWPCH4 +N2O⋅ GWPN2O( )well-to-tank
+ CO2( )combustion Equation 1
Merging non-CO2 combustion emissions and effects into a fuel life cycle GHG inventory requires them to be
presented per megajoule (LHV) of fuel consumed by the aircraft. This work developed non-CO2 ratios to scale the
CO2 from combustion to account for the climate forcing from non-CO2 combustion emissions and effects. This
approach draws from the process and results developed for conventional jet fuel by Dorbian and Waitz (14).
Although non-CO2 combustion emissions and effects have climate impacts that have been represented in terms of
CO2, they are not themselves greenhouse gases (with the exception of water vapor). As such, integrating the non-
CO2 combustion emissions and effects into a GHG life cycle inventory results in a combination of a GHG inventory
and an impact analysis. The terminology ‘well-to-wake (+)’ is presented here to identify the combination of CO2 and
non-CO2 effects from fuel combustion in aircraft. This framework is shown in Equation 2.
€
CO2e( )well-to-wake (+)= CO2 +CH4 ⋅ GWPCH4
+N2O⋅ GWPN2O( )well-to-tank
+ CO2( )combustion⋅ non - CO2 ratio( ) Equation 2
2.2 Modeling Framework
The APMT climate module has been documented and tested in the literature (15-17). The model is based on the
Bern carbon-cycle impulse response function with a simplified analytical temperature change model to estimate
climate impacts for aviation CO2 and non-CO2 effects. The temporal resolution is limited to one year while the
spatial resolution is an aggregated global mean level.
Inputs to APMT Climate are a background emissions scenario, a demand scenario for aviation fuel burn and
corresponding emissions inventories for CO2 and NOX. Radiative forcing estimates for NOX were obtained by
linearly scaling radiative forcing estimates from the literature based on NOX emissions because the short lived nature
of the species inhibits a well defined gas-cycle like that for carbon (9,18,19). All short-lived effects (aerosols, H2O,
contrails and contrail cirrus) are scaled linearly with fuel burn levels based on radiative forcing estimates from the
literature (20-22). Outputs from the model are temporal profiles of RF and change in global mean average
temperature from each forcing agent.

7TH ANNUAL JOSEPH A. HARTMAN PAPER COMPETITION
-6-
2.3 Model Uncertainty
Monte Carlo methods are used to propagate uncertainties in inputs and model parameters to outputs. This requires
expressing inputs and parameters as distributions where possible. As described by Mahashabde et al. (16), in order
to extract meaningful insights about the possible costs and benefits of a policy, it is helpful if the analysis options are
synthesized into a set of pre-defined combinations of inputs and assumptions. These combinations of inputs and
model parameters each describe a particular point of view or perspective on analysis. Each of these combinations is
designated as a lens as it symbolizes a particular viewpoint through which one can assess environmental and
economic impacts. There are currently three lenses implemented in the APMT climate module; namely, low
impacts, mid impacts and high impacts. Each lens corresponds to the use of different values or distributions for the
most influential parameters in the climate module. Parameters captured in the lenses are the projected growth of
aviation, climate forcing of each non-CO2 effect, climate sensitivity and a climate damage coefficient. While APMT
would normally allow the background CO2 concentration to vary between lenses, this work uniformly adopted a
constant background CO2 concentration of 378 ppm to maintain consistency with existing IPCC GWP calculations.
Sensitivity analysis using the APMT climate model has shown that using certain SRES background CO2
concentrations can amplify the relative magnitude of non-CO2 forcing agents by up to 20% relative to the constant
background case; however, this sensitivity is not examined further within this work.
In a manner that parallels the lenses described above, Stratton et al. (2) developed a new methodological approach
for constructing life cycle GHG inventories of transportation fuels. In it, key parameters were identified through
examination of the GHG emissions resulting from each life cycle step. Optimistic, nominal and pessimistic sets of
these key parameters were developed and used to formulate corresponding low GHG inventories, baseline or
nominal GHG inventories, and high GHG inventories using attributional life cycle analysis (LCA). The low lens,
mid lens and high lens of APMT, which were used to assess tank-to-wake combustion emissions, mirror the
formulation of the low, baseline and high well-to-tank GHG emissions inventories.
2.4 Combustion of SPK Fuel Compared to Conventional Jet Fuel
The purely paraffinic nature and lack of sulfur in SPK fuels result in increased specific energy, decreased energy
density and changes to the emissions characteristics of CO2, H2O, soot, sulfates and NOX (3, 10-13). Therefore,
independent non-CO2 ratios are required for conventional jet fuel and SPK fuel. The changes in combustion
7TH ANNUAL JOSEPH A. HARTMAN PAPER COMPETITION
-7-
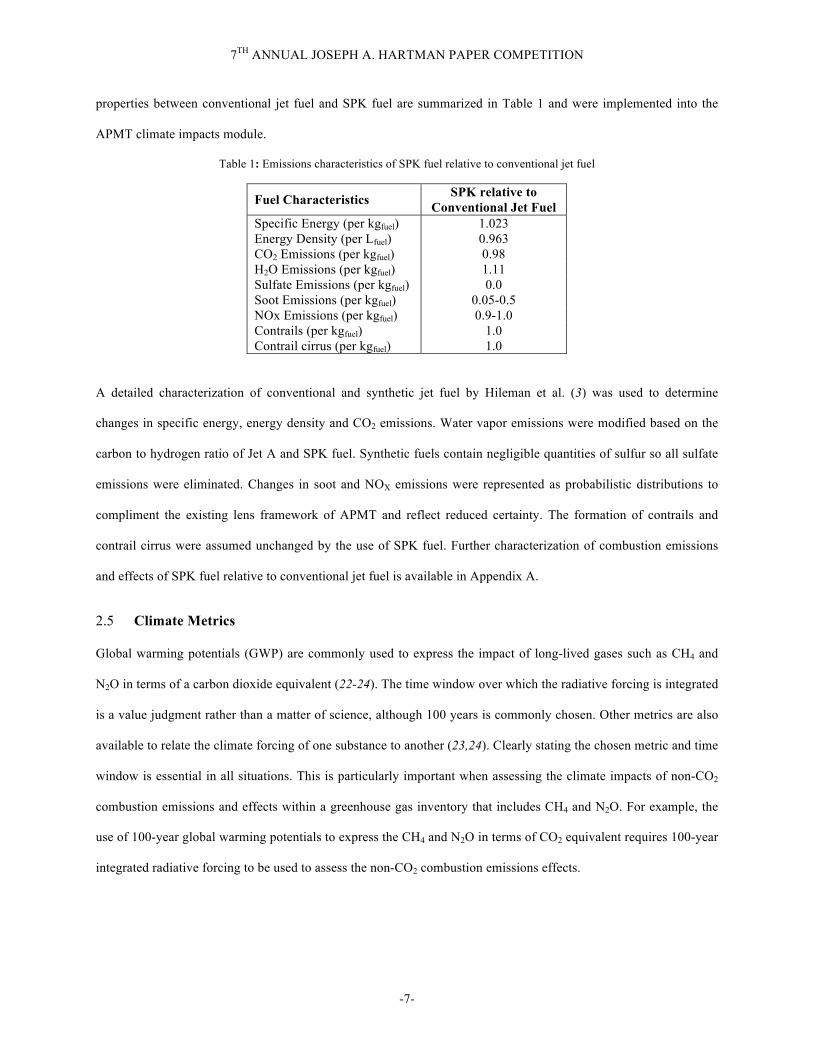
properties between conventional jet fuel and SPK fuel are summarized in Table 1 and were implemented into the
APMT climate impacts module.
Table 1: Emissions characteristics of SPK fuel relative to conventional jet fuel
Fuel Characteristics SPK relative to Conventional Jet Fuel
Specific Energy (per kgfuel) 1.023 Energy Density (per Lfuel) 0.963 CO2 Emissions (per kgfuel) 0.98 H2O Emissions (per kgfuel) 1.11 Sulfate Emissions (per kgfuel) 0.0 Soot Emissions (per kgfuel) 0.05-0.5 NOx Emissions (per kgfuel) 0.9-1.0 Contrails (per kgfuel) 1.0 Contrail cirrus (per kgfuel) 1.0
A detailed characterization of conventional and synthetic jet fuel by Hileman et al. (3) was used to determine
changes in specific energy, energy density and CO2 emissions. Water vapor emissions were modified based on the
carbon to hydrogen ratio of Jet A and SPK fuel. Synthetic fuels contain negligible quantities of sulfur so all sulfate
emissions were eliminated. Changes in soot and NOX emissions were represented as probabilistic distributions to
compliment the existing lens framework of APMT and reflect reduced certainty. The formation of contrails and
contrail cirrus were assumed unchanged by the use of SPK fuel. Further characterization of combustion emissions
and effects of SPK fuel relative to conventional jet fuel is available in Appendix A.
2.5 Climate Metrics
Global warming potentials (GWP) are commonly used to express the impact of long-lived gases such as CH4 and
N2O in terms of a carbon dioxide equivalent (22-24). The time window over which the radiative forcing is integrated
is a value judgment rather than a matter of science, although 100 years is commonly chosen. Other metrics are also
available to relate the climate forcing of one substance to another (23,24). Clearly stating the chosen metric and time
window is essential in all situations. This is particularly important when assessing the climate impacts of non-CO2
combustion emissions and effects within a greenhouse gas inventory that includes CH4 and N2O. For example, the
use of 100-year global warming potentials to express the CH4 and N2O in terms of CO2 equivalent requires 100-year
integrated radiative forcing to be used to assess the non-CO2 combustion emissions effects.

7TH ANNUAL JOSEPH A. HARTMAN PAPER COMPETITION
-8-
The non-CO2 ratios developed herein are designed to scale the CO2 emissions from fuel combustion to account for
the climate forcing from non-CO2 combustion emissions and effects. The IPCC provides GWP values for CH4 and
N2O over time windows of 20 years, 100 years and 500 years (22). Maintaining consistency with the treatment of
life cycle CH4 and N2O limits the assessment of non-CO2 combustion emissions and effects in this work to
integrated-radiative forcing over 20 year, 100 year and 500 year time windows. The non-CO2 ratio for a given time
window, Δt, is given by Equation 3, where each RF is the aggregated radiative forcing from all direct and indirect
mechanisms through which that species or effect influences the climate system.
€
non - CO2 ratio =RFCO2
(t) +RFNOx(t) +RFsoot (t) +RFsulfates(t) +RFcontrails(t) +RFcirrus(t) +RFH2O
(t)[ ] dtt0
t0 +Δt
∫
RFCO2(t)[ ] dt
t0
t0 +Δt
∫
Equation 3
The challenge in treating non-CO2 combustion emissions and effects lies in reconciling the wide range of
atmospheric lifetimes ranging from centuries for CO2 to hours for contrails. Long lived gases become well mixed in
the atmosphere; however; short lived emissions can remain concentrated near flight routes, mainly in the northern
mid-latitudes; hence, these emissions can lead to regional perturbations to radiative forcing (25). The impact of
aircraft on regional climate could be important, but is currently beyond the capability of the models used in this
work; hence, the results from APMT Climate may not be applied to individual flights. Despite these limitations,
assessing short-lived effects on a globally averaged basis gives an indication of the total potential of mitigating
climate change by including non-CO2 forcing agents in climate policy (22).
3 Results
3.1 Non-CO2 Ratios for Conventional and SPK Fuel
The non-CO2 ratios derived for conventional jet fuel and SPK fuel are given in Figure 2 for time windows of 500
years, 100 years and 20 years. Each time window has ratios derived using the low, mid-range, and high impact lens
to capture climate-modeling uncertainties. The bars correspond to results using the mid-range lens while the
whiskers show the results using the low and high lens. Shorter time windows emphasize the climate forcing of short-
lived effects.
7TH ANNUAL JOSEPH A. HARTMAN PAPER COMPETITION
-9-
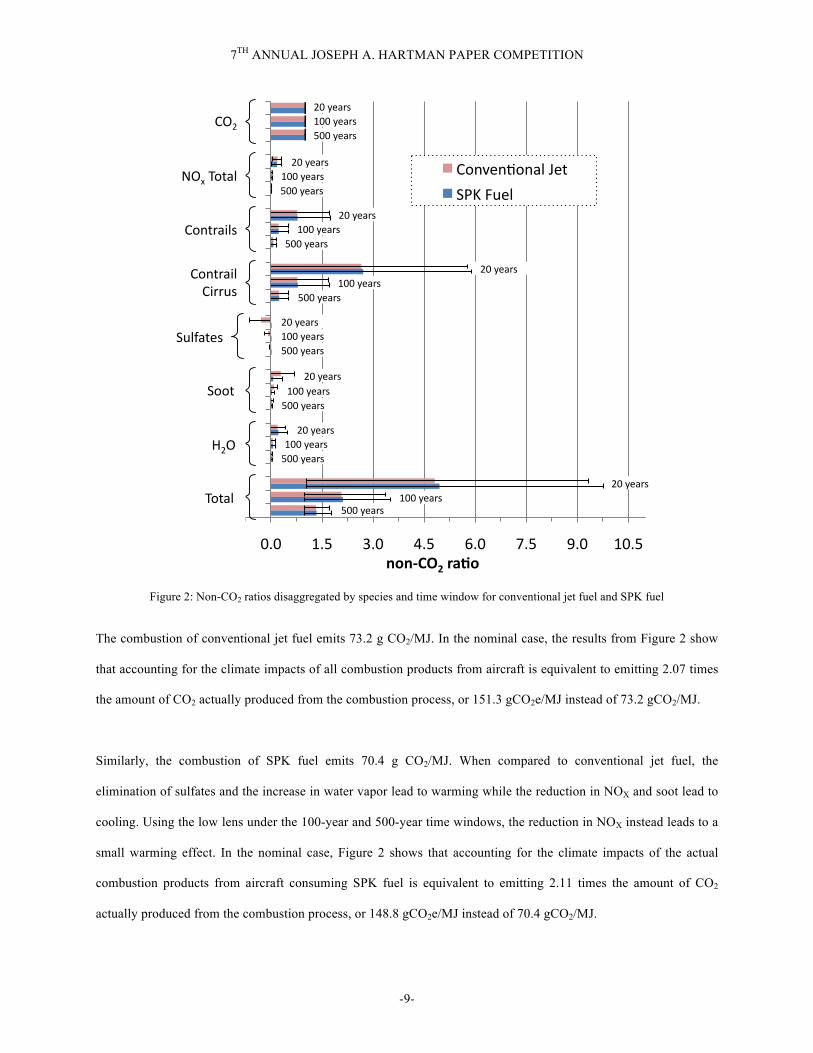
Figure 2: Non-CO2 ratios disaggregated by species and time window for conventional jet fuel and SPK fuel
The combustion of conventional jet fuel emits 73.2 g CO2/MJ. In the nominal case, the results from Figure 2 show
that accounting for the climate impacts of all combustion products from aircraft is equivalent to emitting 2.07 times
the amount of CO2 actually produced from the combustion process, or 151.3 gCO2e/MJ instead of 73.2 gCO2/MJ.
Similarly, the combustion of SPK fuel emits 70.4 g CO2/MJ. When compared to conventional jet fuel, the
elimination of sulfates and the increase in water vapor lead to warming while the reduction in NOX and soot lead to
cooling. Using the low lens under the 100-year and 500-year time windows, the reduction in NOX instead leads to a
small warming effect. In the nominal case, Figure 2 shows that accounting for the climate impacts of the actual
combustion products from aircraft consuming SPK fuel is equivalent to emitting 2.11 times the amount of CO2
actually produced from the combustion process, or 148.8 gCO2e/MJ instead of 70.4 gCO2/MJ.
!"#$% &#&% "#$% '#&% (#$% )#&% *#$% +#&% "&#$%!"!#$%&'()*"'
,-./0.1-.23%405%
678%9:03%
!"#$
%"&$'()*+$
!(,)-*.+/$
!(,)-*.+$!.--0/$
10+2*)3/$
1(()$
4#"$
'()*+$
#5$63*-/$755$63*-/$855$63*-/$
#5$63*-/$755$63*-/$855$63*-/$
#5$63*-/$755$63*-/$
855$63*-/$
#5$63*-/$755$63*-/$
855$63*-/$
#5$63*-/$755$63*-/$855$63*-/$
#5$63*-/$755$63*-/$855$63*-/$
#5$63*-/$755$63*-/$855$63*-/$
#5$63*-/$755$63*-/$
855$63*-/$

7TH ANNUAL JOSEPH A. HARTMAN PAPER COMPETITION
-10-
The contribution of contrails and contrail cirrus to the total non-CO2 ratio is sufficiently large that even a small
change of either is more significant than a large change in other species; hence, the total non-CO2 ratios are most
sensitive to error in these two forcing agents. The reader is reminded that the radiative forcing from contrails and
contrail cirrus were assumed unchanged per unit mass of fuel burned. As discussed is Appendix A, more detailed
models and empirical measurements are needed to determine what, if any, changes may actually occur to contrails
and contrail-cirrus with a change in fuel composition.
3.2 Well to wake (+) Emissions Inventories
Using Equation 2, the results from Figure 2 can be combined with a well-to-wake GHG emissions inventory to
complete the framework required to include non-CO2 combustion emissions and effects in a fuel life cycle. The non-
CO2 ratios developed using the low, mid-range and high impact lenses of the APMT climate model were paired with
select life cycle GHG inventories developed by Stratton et al. (2). These GHG inventories from were created by
identifying key parameters through examination of the GHG emissions resulting from each life cycle step.
Optimistic, nominal and pessimistic sets of these key parameters formed the basis for corresponding low GHG
inventories, baseline or nominal GHG inventories, and high GHG inventories. The select fuel pathways used herein
are conventional jet fuel, Fischer-Tropsch jet fuel from switchgrass, Fischer-Tropsch jet fuel from coal without
carbon capture, and hydroprocessed jet fuel from rapeseed oil. All results and discussion in this section are limited
to a 100-year time window because of its prevailing use in the scientific community for global warming potentials.
The sensitivity of results to choice of time window is addressed in Section 3.3.
Life cycle analysis is fundamentally a comparative tool; hence, results are normalized by the life cycle GHG
emissions of baseline conventional jet fuel. As noted in Table 1, the specific energy of SPK is 2.3% higher than that
of conventional jet fuel. Therefore, the use of SPK leads to a reduced take-off weight and hence a reduced quantity
of fuel needed to complete a given mission. Hileman et al. (3) quantified this effect on a fleet wide basis, finding
that a 0.3% reduction in fleet wide fuel energy use would result from the use of all SPK; therefore, a 0.3%
improvement in energy efficiency was applied to SPK fuels when normalizing by conventional jet fuel.
Figure 3 compares the well-to-wake and well-to-wake (+) emissions inventories normalized by the corresponding
baseline of conventional jet fuel. The upper half shows only the well-to-wake inventories as presented by Stratton et

7TH ANNUAL JOSEPH A. HARTMAN PAPER COMPETITION
-11-
al (2). The lower half shows the well-to-wake (+) version of the same GHG inventories. The solid error bars, which
have lines on their ends, correspond to combining the 100-year mid-range non-CO2 ratios with the well-to-wake
low, baseline and high GHG emissions scenarios. The dashed error bars, which have circles on their ends,
correspond to pairing the 100-year low impact, mid-range and high impact non-CO2 ratios with the well-to-wake
low, baseline and high GHG emissions scenarios, respectively. Presenting the results in this manner separates the
variability introduced by the well-to-tank GHG inventories from the climate modeling uncertainty of the non-CO2
ratios. The uncertainty of the non-CO2 ratios has a larger influence than the internal variability of the GHG
inventories on the range of normalized well-to-wake (+) emissions for each fuel pathway.
Relative to the normalized well-to-wake GHG inventories shown in the upper half of Figure 3, intra-pathway
variability is increased with the inclusion of the non-CO2 combustion emissions and effects while inter-pathway
variability in normalized well-to-wake (+) emissions is reduced. For these select pathways, when only GHG
emissions are considered, the range in baseline life cycle GHG emissions is 0.2 to 2.2 times those of baseline
conventional jet fuel. When GHG emissions and non-CO2 combustion emissions and effects are included, the range
in baseline well-to-wake (+) emissions is reduced to 0.6 to 1.6 times those of baseline conventional jet fuel. Hence,
the inclusion of non-CO2 combustion emissions and effects in the fuel life cycle increases the absolute emissions
range of each fuel pathway but reduces the overall range in the life cycle emissions of alternative fuels relative to
conventional jet fuel.
Interest is primarily focused on fuel options with well-to-wake GHG emissions lower than those of conventional jet
fuel. Because of the similar magnitude of the non-CO2 combustion emissions and effects of SPK and conventional
jet fuel, the normalized well-to-wake (+) emissions of fuels in this category are higher than their normalized well-to-
wake GHG emissions. Hence, a percentage reduction in life cycle GHG emissions of the jet fuel mix is less than the
actual percentage reduction in aviation related climate impacts. For example, an SPK fuel option with zero life cycle
GHG emissions would offer a 100% reduction in GHG emissions but only a 53% reduction in actual climate impact
using a 100-year time window and the mid-range lens. Therefore, aviation GHG reduction scenarios (e.g., emissions
wedge charts) that rely exclusively on relative changes in GHG emissions may overestimate the benefit of
alternative fuel use on the global climate system. Only a percentage reduction in fuel burn is equivalent to the same

7TH ANNUAL JOSEPH A. HARTMAN PAPER COMPETITION
-12-
percentage reduction in aviation related climate forcing. The degree of overestimation is dependent on the
assumptions used for the climate impact analysis of non-CO2 combustion emissions and effects. Conversely,
aviation GHG reduction scenarios that rely on absolute changes in GHG emissions (e.g. mass of CO2e/MJ) will
yield similar results for the impact of alternative fuel use on the global climate system regardless of whether well-to-
wake or well-to-wake (+) emissions are used. The discrepancy between conventional jet fuel and SPK fuels caused
by combustion CO2 emissions and the non-CO2 ratios is small by comparison to the variability in well-to-tank GHG
emissions among the fuel options of Figure 3.
Figure 3: Well-to-wake (+) emissions for select alternative jet fuel pathways, normalized by conventional jet fuel
!"!# !"$# %"!# %"$# &"!# &"$#
'()*+,-./00#*1#234#56*#
7/860669#:);#*1#<75#
=.>96#*1#=1?@6?A1?/;#56*#
=1/;#*1#234#56*#B(C1#=='D#
!"##$%&$!'(")*+,--,&.-)/&0+'#,1"2)34)5&.6".7&.'#)8"%)9:"#)
!"!# !"$# %"!# %"$# &"!# &"$#
'()*+,-./00#*1#234#56*#
7/860669#:);#*1#<75#
=.>96#*1#=1?@6?A1?/;#56*#
=1/;#*1#234#56*#B(C1#=='D#
!"##$%&$!'(")*+,)-./00/&10)2&3.'#/4"5)67)8&19"1:&1'#);"%)<="#)
E1(F#G/06;)?6#/?9#,)-,#(6;;3*13(/H6#B+D#6I)00)1?0#>0)?-#%!!3J6/.#I)93./?-6#?1?3=:&#./A1#
E1(#(6;;3*13(/H6#B+D#6I)00)1?0#>0)?-#%!!3J6/.#;1(#;6?0#?1?3=:&#./A1F#G/06;)?6#(6;;3*13(/H6#B+D#6I)00)1?0#>0)?-#%!!3J6/.#I)93./?-6#;6?0#?1?3=:&#./A1F#,)-,#(6;;3*13(/H6#B+D#6I)00)1?0#>0)?-#%!!3J6/.#,)-,#;6?0#?1?3=:&#./A1##
7TH ANNUAL JOSEPH A. HARTMAN PAPER COMPETITION
-13-
While the results of this work were developed using the current best available data, climate forcing from contrails
and contrail cirrus remains uncertain, especially for SPK fuel; therefore, these results should be used with caution
until further research is available on how SPK fuel use changes their impacts.
3.3 Sensitivity of Results to Time Window
The results of Figure 3 were created using a 100-year time window to express all species and effects in terms of
carbon dioxide equivalent; however, other time windows (e.g., 500-year and 20-year) could have been chosen for
the non-CO2 ratios and GWP values of CH4 and N2O. The sensitivity of the well-to-wake and well-to-wake (+)
emissions inventories to the choice of time window can be examined through the use of alternative jet fuel case
studies. Specifically, the well-to-wake GHG emissions inventories of baseline conventional jet fuel from US crude
oil, baseline conventional jet fuel from Nigerian crude oil and baseline rapeseed oil to HRJ were chosen to span a
CO2 dominated fuel, a CH4 intensive fuel and a N2O intensive fuel. Methane and nitrous oxide have atmospheric
lifetimes of 12 and 114 years, respectively; therefore, a 20-year time window more heavily weights methane while a
100-year time window more heavily weights nitrous oxide. Additionally, the CO2 and non-CO2 combustion
emissions and effects of conventional jet fuel were evaluated using the mid-range lens with 500-year, 100-year and
20-year time windows. The sensitivity of each GHG inventory and the combustion emissions and effects to time
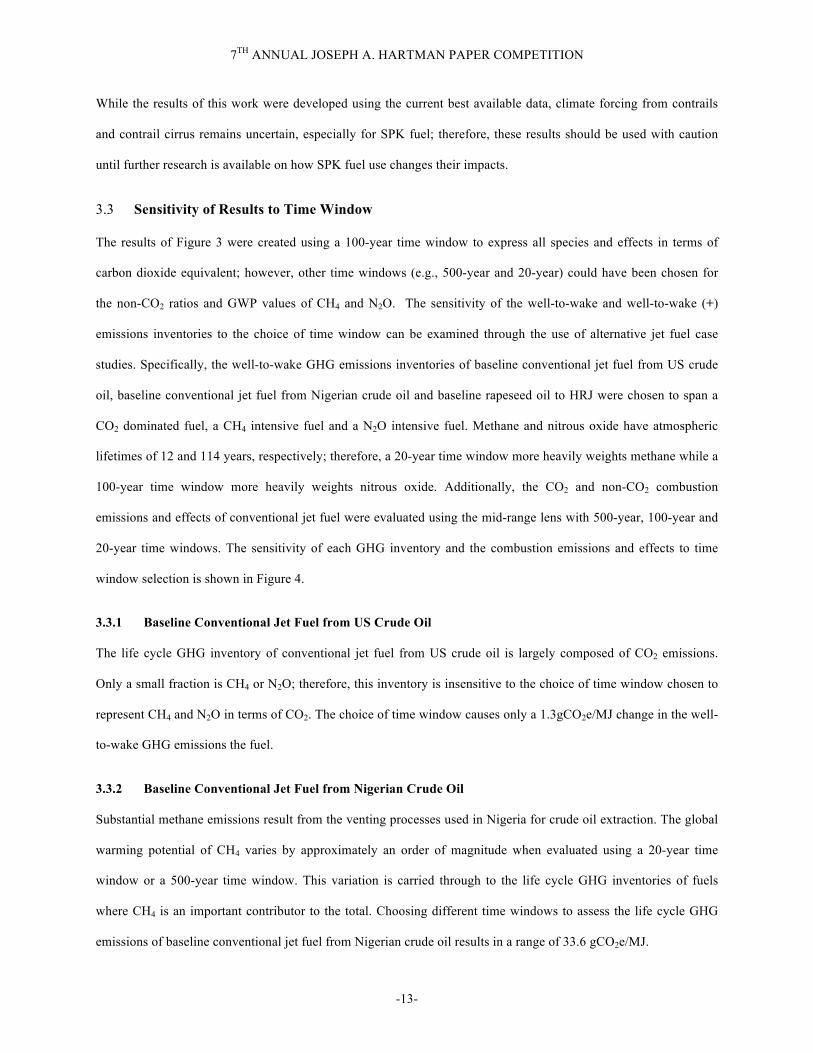
window selection is shown in Figure 4.
3.3.1 Baseline Conventional Jet Fuel from US Crude Oil
The life cycle GHG inventory of conventional jet fuel from US crude oil is largely composed of CO2 emissions.
Only a small fraction is CH4 or N2O; therefore, this inventory is insensitive to the choice of time window chosen to
represent CH4 and N2O in terms of CO2. The choice of time window causes only a 1.3gCO2e/MJ change in the well-
to-wake GHG emissions the fuel.
3.3.2 Baseline Conventional Jet Fuel from Nigerian Crude Oil
Substantial methane emissions result from the venting processes used in Nigeria for crude oil extraction. The global
warming potential of CH4 varies by approximately an order of magnitude when evaluated using a 20-year time
window or a 500-year time window. This variation is carried through to the life cycle GHG inventories of fuels
where CH4 is an important contributor to the total. Choosing different time windows to assess the life cycle GHG
emissions of baseline conventional jet fuel from Nigerian crude oil results in a range of 33.6 gCO2e/MJ.

7TH ANNUAL JOSEPH A. HARTMAN PAPER COMPETITION
-14-
Figure 4: Sensitivity of well-to-wake GHG emissions inventories of baseline conventional jet fuel from US crude oil, baseline conventional jet fuel from Nigerian crude oil, baseline rapeseed oil to HRJ and the combustion emissions and effects of
conventional jet fuel to 500-year, 100-year and 20-year time windows using the mid-range lens
3.3.3 Baseline Rapeseed Oil to HRJ Fuel
The life cycle GHG inventory of HRJ form rapeseed oil is strongly influenced by N2O emissions from direct and
indirect conversion of synthetic nitrogen applied to the field and nitrogen rich crop residues. The global warming
potential for N2O is less sensitive to time window than that of CH4; however, it still varies by approximately a factor
of 2 and this variation is carried through to the life cycle GHG inventories of fuels where N2O is an important
contributor. Baseline HRJ from rapeseed oil (assuming no GHG emissions from land use change) is subject to a
range of 13.5 gCO2e/MJ with the use of 500-year and 20-year time windows.
3.3.4 Combustion Emissions and Effects of Conventional Jet Fuel
While both the time horizon and choice of lens are important when assessing the climate impacts of non-CO2
combustion emissions and effects, the focus of this section is the influence of the time window; therefore, the mid-
Con
vent
iona
l Jet
from
Nig
eria
n C
rude
(C
H4 I
nten
sive
)
!" #!" $!" %!" &!" '!!"
(!!")*+,"&$-#"./0#*123"
'!!")*+,"&$-%"./0#*123"
#!")*+,"&(-("./0#*123"
!"#$%&'()$%*+*%,-".."/0.%12&34$5678%
4567+88"/,*95:" ;*<6=*,)" >**9"?,+@8A6,:+B6@" C,6<*885@."
>D*E"?,+@8A6,:+B6@" F??"G#0" F??"/H$" /67ID8B6@"/0#"
!" #!" $!" %!" &!" '!!"
(!!")*+,"&$-#"./0#*123"
'!!")*+,"&$-%"./0#*123"
#!")*+,"&(-("./0#*123"
!"#$%&'()$%*+*%,-".."/0.%12&34$5678%
4567+88"/,*95:" ;*<6=*,)" >**9"?,+@8A6,:+B6@" C,6<*885@."
>D*E"?,+@8A6,:+B6@" F??"G#0" F??"/H$" /67ID8B6@"/0#"
!" #!!" $!!" %!!" &!!"
'!!"()*+",-.*/"0"123!"456$)789"
#!!"()*+",-.*/"0"#'#3&"456$)789"
$!"()*+",-.*/"0"%'$3$"456$)789"
!"#$%&'%("$)*+,-*./0110'#1*+2345)678-*
5-:;<=>-?"56$"
5-:;<=>-?"?-?@56$"
Con
vent
iona
l Jet
Fue
l Com
bust
ion
Em
issi
ons
and
Effe
cts
Con
vent
iona
l Jet
from
US
Cru
de
(CO
2 Dom
inat
ed)
Rap
esee
d H
RJ
(N2O
Inte
nsiv
e)
!" #!" $!" %!" &!" '!!"
(!!")*+,"&$-#"./0#*123"
'!!")*+,"&$-%"./0#*123"
#!")*+,"&(-("./0#*123"
!"##$%&$!'(")*+*),-.//.&0/)12345"6789)!" #!" $!!" $#!"
#!!"%&'(")*+,"-./0&123"
$!!"%&'("$!4+5"-./0&123"
0!"%&'("$05+4"-./0&123"
!"##$%&$!'(")*+*),-.//.&0/)12345"6789)
!"##$ !%#$ #$ %#$ "##$ "%#$
%##$&'()$*+,"$-./0'123$
"##$&'()$%*,4$-./0'123$
0#$&'()$%5,5$-./0'123$
!"##$%&$!'(")*+*),-.//.&0/)12345"6789)
!" #!!" $!!" %!!" &!!"
'!!"()*+",-.!"/01$)234"
#!!"()*+"#'#.&"/01$)234"
$!"()*+"%'$.$"/01$)234"
!"#$%&'"()*#+&&+"(&),(-)*./01&)23!45/6789)

7TH ANNUAL JOSEPH A. HARTMAN PAPER COMPETITION
-15-
range lens was used as a representative assumptions set. The combustion emissions and effects from conventional jet
fuel vary by 255.2 gCO2e/MJ, from 97.0 gCO2e/MJ to 352.2 gCO2e/MJ, with the use of a 500-year or 20-year time
window, respectively. SPK fuels are subject to the same influence because of the similarity in the non-CO2 ratios of
SPK fuel and conventional jet fuel. As a result, all SPK fuels used by aviation are affected by the substantial
influence of time window on well-to-wake (+) emissions. The scope is not limited to fuel pathways that are strong in
a particular type of emissions and the magnitude is several times larger than that of CH4 or N2O. Despite this
undesirable variability, the time window used to assess non-CO2 combustion emissions and effects should be
constrained to the same as that used in the global warming potentials of well-to-tank CH4 and N2O; hence, the need
for consistency serves as a constraint in choosing the appropriate time window.
4 Discussion and Conclusions
This work implemented a modified version to the APMT climate impacts module to develop ratios to scale the CO2
from fuel combustion to account for the additional climate forcing from the non-CO2 combustion effects of SPK fuel
and conventional jet fuel. The results indicated that including non-CO2 combustion emissions and effects when
comparing the emissions from SPK fuel to those of conventional jet fuel can lead to an important decrease in the
relative merit of the SPK fuel. This is because contrails and contrail-cirrus clouds dominate the climate impact of the
non-CO2 effects from conventional fuel and the analysis herein assumed that SPK fuel use would not change the
prevalence or impact of these effects. Additional work should be devoted to better understanding how changes in
fuel composition affect the formation of contrails and contrail-cirrus clouds as their impact may be reduced with a
change in fuel composition.
The decrease in relative merit of SPK fuels means that methods of tracking climate change mitigation that rely
exclusively on relative well-to-wake life cycle GHG emissions as a proxy for aviation climate impact may
overestimate the benefit of alternative fuel use on the global climate system. Furthermore, the variability introduced
into the results by including non-CO2 combustion emissions and effects highlights the broad challenges faced in
collapsing multiple attributes into a single metric for comparison when assessing any new energy technology
options. Determining an absolute ‘better or worse’ requires an evaluation system, which is usually accomplished
through a weighting scheme, monetization or time windowing with one or more metrics. Greenhouse gases are a

7TH ANNUAL JOSEPH A. HARTMAN PAPER COMPETITION
-16-
convenient metric of comparison because their cause and environmental effect are both important and readily
quantified. Many other factors have less quantifiable impacts. The need for absolute comparisons often requires
defining a ‘basis of equivalence’ that introduces significant variability into the result.
This work indicates that aviation has an opportunity space extending beyond improving fuel efficiency and burning
alternative fuels to reduce its climate impact. Technologies that reduce GHG emissions from fuel production,
combustion CO2 emissions, and non-CO2 combustion emissions and effects can all be considered simultaneously.
Currently, these areas are largely examined in isolation. A holistic analysis framework is needed that examines
alternative fuels for reduced well-to-wake GHG emissions, aircraft design and operations for reduced fuel
consumption, and changes to operational procedures for reduced contrails and contrail-cirrus impacts; however,
enable an equitable comparison of the climate mitigation options for aviation requires accounting for the climate
impacts of non-CO2 combustion emissions and effects.
Acknowledgments
This work was made possible by funding from the Federal Aviation Administration and Air Force Research Labs
through the PARTNER Center of Excellence under Award Number 06-C-NE-MIT, Amendment Nos. 012 and 021.
Special thanks to Mr. Chris Dorbian, Prof. Steven Barrett, Prof. Jessika Trancik and Prof. Ian Waitz for their help in
improving the quality of the work that is presented herein as well as Warren Gillette and Lourdes Maurice, of FAA,
and Tim Edwards and Bill Harrison, both of AFRL, for their leadership in managing this project.
Appendix A - Characterization of SPK Combustion Emissions and Effects
In maintaining the lens framework, the percentage reductions in soot and NOX emissions attributed to the use of
SPK fuel, as compared to conventional jet fuel, are given by distributions with functional forms and bounds shown
in Figure A-1. Results with the low and high lenses reflect deterministic use of the low and high values while the
mid-range lens reflects the results of Monte Carlo simulations using random variables drawn from the distributions
of Figure A-1.

7TH ANNUAL JOSEPH A. HARTMAN PAPER COMPETITION
-17-
Figure A-1: Input distributions for NOX and soot reductions resulting from the use of SPK fuel
The upper and lower bounds of NOX reduction were based on experimental results from Bester and Yates (10),
Bulzan et al. (11) and Dewitt et al. (12). The functional form of the distribution was chosen to reflect a conservative
estimate within the bounds of experimental data. NOX emissions are strongly dependent on engine throttle setting,
specific engine/combustor technology and ambient temperature; hence, it is little surprise that results of the
aforementioned research efforts do not conclusively indicate a single value.
The upper and lower bounds of SPK induced soot reduction were based on experimental measurements from
PW308 and CFM56 gas turbines. The data were reported by Donohoo (13) and are dependent on throttle setting.
Soot reductions from SPK use in the PW308 varied from 95% at idle to 50% at 85% of full throttle; similarly, SPK
fuel in the CFM56 led to a 98% reduction in soot at idle and a 70% reduction at 85% of full throttle. The mode of
the distribution is consistent with measurements from Bester and Yates (10) and Bulzan et al. (11), who measured
average reductions of 85% and 90% in soot emissions over the throttle range of a CFM-56-2C1 engine using coal
based F-T jet fuel from Sasol and natural gas based F-T jet fuel from Shell, respectively.
SPK fuel was assumed to cause no change to the radiative forcing from aircraft contrails and contrail cirrus per unit
of fuel mass relative to conventional jet fuel because no data has provided quantifiable evidence otherwise.
Qualitatively, the magnitude of the atmospheric impact from contrails and contrail cirrus depends on details of
plume evolution and the relative ability of aerosol particles to act as ice-forming nuclei (6). The presence of ice-
forming nuclei may trigger the formation of contrail cirrus much later than the original emission if the background
atmosphere has changed to a state allowing for cloud formation (20). Hence, the complete elimination of sulfate
aerosols and the significant reduction of soot emissions caused by SPK fuel might serve to reduce contrail and
contrail cirrus formation. Conversely, the increase in water vapor from SPK fuel may serve to stimulate additional
contrails and contrail cirrus if their formation is more strongly dependent on background atmospheric aerosol
!"#!"#$%"&'(
$!"#)*+,(
%!"#!"#(
&%"#)*+,(
&!"#-*.'(
/01(%23(45.678"9( /01(/"":(45.678"9(

7TH ANNUAL JOSEPH A. HARTMAN PAPER COMPETITION
-18-
concentrations rather than local concentrations in the exhaust jet. Wuebbles et al. (6) emphasize that improving the
understanding of contrails and contrail cirrus formation requires coordinated regional-scale measurements to
correlate the growth, decay, and trajectories of contrail ice particles with the ambient aerosols and gaseous aerosol
precursor concentrations.
References (1) FAA. Federal Aviation Administration. FAA Aerospace Forecast: Fiscal Years 2010-2030. U.S. Department of
Transportation, FAA, 2009; http://www.faa.gov/data_research/aviation/aerospace_forecasts/2010-2030/media/2010%20Forecast%20Doc.pdf (accessed April 14, 2010).
(2) Stratton, R. W.; Wong, H. M.; Hileman, J. I. Life Cycle Greenhouse Gas Emissions from Alternative Jet Fuels,
Partnership for Air Transportation Noise and Emissions Reduction (PARTNER) Report, Number 2010-001, Massachusetts Institute of Technology: Cambridge, MA, 2010. http://web.mit.edu/aeroastro/partner/reports/proj28/partner-proj28-2010-001.pdf (accessed July 28, 2010)
(3) Hileman, J. I.; Stratton, R. W.; Donohoo. P. E. Energy Content and Alternative Fuel Viability, Journal of Propulsion
and Power 2010, 26 (6), 1184-1195
(4) Edwards, R.; Larivé, J.; Mahieu, V.; Rouveirolles, P. Well-to-Wheels Analysis of Future Automotive Fuels and Powertrains in the European Context, Tank-to-Wake Report Version 2c, EUCAR, CONCAWE, & JRC: Ispra, Italy, 2007; http://ies.jrc.ec.europa.eu/WTW (accessed April 14, 2010).
(5) Broch, A.; Hoekman, S. K.; Gertler, A.; Robbins, C.; Natarajan, M. Biodistillate Transportation Fuels 3 – Life Cycle
Impacts, SAE International 2009, 2009-01-2768.
(6) Wuebbles, D.; Gupta, M.; Ko, M. Evaluating the Impacts of Aviation on Climate Change, EOS 2007, 88 (14), 157-168
(7) Jacobson, M.Z. Short-term effects of controlling fossil-fuel soot, biofuel soot and gases, and methane on climate, Arctic ice, and air pollution health, Journal of Geophysical Research 2010, 115 (D14209)
(8) Stuber, N.; Forster, P.; Shine, K. The importance of the diurnal and annual cycle of air traffic for contrail radiative
forcing, Nature Letters 2006, 44 (15), 864-867.
(9) Stevenson, S. D.; Doherty, R. M.; Sanderson, M. G.; Collins, W. J.; Johnson, C. E.; Derwent, R. G. Radiative forcing from aircraft NOx emissions: Mechanisms and seasonal dependence. Journal of Geophysical Research 2004, 109 (D17307).
(10) Bester, N. and Yates, A. Assessment of the Operational Performance of Fisher-Tropsch Synthetic Paraffinic Kerosene
in a T63 Gas Turbine Compared to Conventional Jet A-1 Fuel, GT200960333, In Power for Land, Sea and Air, Proceedings of ASME Turbo Expo 2009, Orlando, Florida, June 8-12, 2009.
(11) Bulzan, D.; Howard, R.; Corporan, E.; et al. Gaseous Particulate Emissions Results of the NASA Alternative Aviation
Fuel Experiment (AAFEX). In Power for Land, Sea and Air, Proceedings of ASME Turbo Expo 2010, Glasgow, UK, June 14-18, 2010.
(12) Dewitt, M.J.; Corporan, E.; Graham, J.; Minus, D. Effects of Aromatic Type and Concentration in Fischer-Tropsch
Fuels on Emissions Production and Material Compatibility, Energy and Fuels 2008, 22, 2411-2418.
(13) Donohoo, P. Scaling Air Quality Effects from Alternative Jet Fuel in Aircraft and Ground Support Equipment, M.Sc. Thesis, Massachusetts Institute of Technology, Cambridge, MA, 2010.
(14) Dorbian, C. and Waitz, I., Estimating the climate and air quality benefits of aviation fuel and emissions reductions.
Submitted to Atmospheric Environment, July 2010.

7TH ANNUAL JOSEPH A. HARTMAN PAPER COMPETITION
-19-
(15) Marais, K.; Lukachko, S. P.; Jun, M.; Mahashabde, A.; Waitz, I.A. Assessing the impact of aviation on climate. Meteorologische Zeitschrift 2008, 17, 157–172.
(16) Mahashabde, A., Wolfe, P., Ashok, A., Dorbian, C., He, Q., Fan, A., Lukachko, S., Mozdzanowska, A., Wollersheim,
C., Barrett, S.R.H., Locke, M., Waitz, I.A. Assessing the Environmental Impacts of Aircraft Noise and Emissions, Progress in Aerospace Sciences 2011, 47, 15-52.
(17) APMT, Aviation Portfolio Management Tool, Climate Impacts Methodology, 2010;
http://web.mit.edu/aeroastro/partner/apmt/climateimpact.html (accessed April 14, 2010).
(18) Wild, O.; Prather, M. J.; Akimoto, H. Indirect long-term global radiative cooling from NOx emissions. Geophysical Research Letters 2001, 28 (9), 1719–1722.
(19) Hoor, P.; Borken-Kleefeld, J.; Caro, D.; Dessens, O.; Endresen, O.; Gauss, M.; Grewe, V.; Hauglustaine, D.; Isaksen, I.
S. A.; J¨ockel, P.; Lelieveld, J.; Myhre, G.; Meijer, E.; Olivie, D.; Prather, M.; Schnadt Poberaj, C.; Shine, K. P.; Staehelin, J.; Tang, Q.; van Aardenne, J.; van Velthoven, P. and Sausen, R. The impact of traffic emissions on atmospheric ozone and OH: results from QUANTIFY. Atmospheric Chemistry and Physics 2009, 9, 3113–3136.
(20) Sausen, R.; Isaksen, I.; Grewe, V.; Hauglustaine, D.; Lee, D. S.; Myhre, G.; K¨ohler, M. O.; Pitari, G.; Schumann, U.; Stordal, F.; Zerefos, C. Aviation radiative forcing in 2000: An update on IPCC (1999). Meteorologische Zeitschrift 2005, 14, 555– 561.
(21) Hansen, J.; Sato, M.; Ruedy, R. and et al. Efficacy of climate forcings. Journal of Geophysical Research Atmospheres 2005, 110 (D18104).
(22) Solomon, S.; Qin, D.; Manning, M.; Chen, Z.; Marquis, M.; Averyt, K. B.; Tignor, M.; Miller, H. L. Contribution of
Working Group I to the Fourth Assessment Report, Intergovernmental Panel on Climate Change, Cambridge University Press, Cambridge, UK, 2006.
(23) Wuebbles, D. J.; Yang, H.; Herman, R. Climate Metrics and Aviation: Analysis of Current Understanding and
Uncertainties, Subject Specific white paper on Metrics for Climate Impacts, University of Illinois and Western Illinois University: Urbana and Macomb, IL, 2008.
(24) Shine, K. P.; Fuglestvedt, J. S.; Hailemariam, K.; Stuber, N. Alternatives to the global warming potential for comparing
climate impacts of emissions of greenhouse gases. Climatic Change 2005, 68 (3), 281 – 302.
(25) Penner, J. E.; Lister, D. H.; Griggs, D. J.; Dokken, D. J.; McFarland, M. Aviation and the Global Atmosphere: A special report in collaboration with the Scientific Assessment Panel to the Montreal Protocol on Substances that Deplete the Ozone Layer, Intergovernmental Panel on Climate Change, Cambridge University Press, Cambridge, UK, 1999.
Student Biography
Russ Stratton is a PhD student working in the department of aeronautics at MIT in the Partnership for Air
Transportation Noise and Emissions Reduction. His research is focused on assessing the environmental impacts of
aviation. Russ’s Masters research was with Dr. James Hileman and Dr. Ian Waitz in assessing the life cycle
greenhouse gas impacts of alternative jet fuels on climate and quantifying the production potential and system level
trades of fuel production from various feedstocks. Previous to attending MIT, Russ earned his B.Sc. in Physics and
Mechanical Engineering from Queen’s University at Kingston, Ontario.