impact of mobile1
TRANSCRIPT

8/2/2019 Impact of Mobile1
http://slidepdf.com/reader/full/impact-of-mobile1 1/25
Amidst the spreading gloom of the economic downturnfollowing the global financial meltdown, the Indian telecomsector provides the proverbial silver lining. The growth inmobile connections has continued at around 10 milliona month and investment prospects remain bullish. It is
important at this stage to ensure that investor confidence ismaintained by further improving the regulatory environmentand ensuring that the policy regime promotes growth. During the past few years this researchhas built a detailed understanding of the importanceof telecommunications infrastructure to economicdevelopment. India has more diversity within its borders than any othercountry – it comprises 1.1 billion people, living and workingin very different circumstances and geographies. Yet it hasa national government and policy environment that setscritical economic policies (including telecommunications)across the whole country. We have taken advantage of that
diversity and the availability of state level data to investigateeconomic impacts within India across states, economicsectors and population segments. Furthermore, because evenstate level data can mask great differences, we have looked atspecific economic sectors (agriculture and small and mediumenterprises) and segments of the population (urban slumdwellers) to extend our understanding.
2. The impact of telecommunications
on economic growth
A number of earlier studies have examined the relationshipbetween telecommunication services and economic growth.There is a positive relationship between GDP per capita andtelephone density indicators. The data for all countries, fromthe least developed to the most industrialised, generallyfall within a small band along a straight line. A similarrepresentation for mobile teledensity and per capita GSDPacross Indian states (Figure 1) also reveals data tightlyclustered around the line of best fit.Figure 1: Mobile density and Per Capita Income across
Indian states
0

8/2/2019 Impact of Mobile1
http://slidepdf.com/reader/full/impact-of-mobile1 2/25
1020304050
607080100900 10000 20000 30000 40000 50000 60000 70000 80000
Per Capita GSDPMobile penetrationSource: TRAI, CSO; data for March 2008. Mobile density is subscriptions per100 population
Noting the high correlation between telecoms penetrationand growth, early research focussed on the potential rolethat telecommunications could play in accelerating growthand economic development.The growth dividend of investment in (fixed)telecommunications infrastructure in developed economiesis now fairly well established. Since the growth of mobilephones in developing economies such as India, China,Brazil and others has been sensational; it raises the obviousquestion whether mobile phones in developing economiesare playing the same role that fixed telephony played in thericher economies in the 1970s and 1980s. Mobile phones areoften the only means of communication for a large number of people. For example, the most recent numbers available forIndia reveal that while fixed line penetration is roughly 3.5 perhundred and declining, the corresponding number for mobilestands at 28 per hundred, and growing. Because mobilessubstitute for fixed lines in developing economies, theirgrowth impact should be stronger in these than in developedeconomies, where mobiles complement the extensive fixedservice.The value of a mobilephone can be particularly high because other forms of communication such as postal systems, roads and fixed linenetworks are often poor in developing countries. At the sametime, in many developing countries growth has been low dueto a host of other reasons – poor governance, lack of capital,low skill levels and many others. It is unlikely that increasedmobile penetration by itself will be able to alleviate theseother constraints on growth. This caution is supported by casestudies.The economic impact of mobile is likely to be strongest when

8/2/2019 Impact of Mobile1
http://slidepdf.com/reader/full/impact-of-mobile1 3/25
the absence or inadequacy of existing telecommunicationsfacilities acts as a barrier or bottleneck to private economicactivities, but also when enough other infrastructure exists topermit the effective use of telecommunications.Particularly striking is the paltry broadband penetration
rate despite a low threshold speed for the figures: anydownload speed above 256 kilobits per second (kbps) inIndia is classified as broadband, a level of service that wouldbe seen as inadequate in most countries.11 The number of subscriptions to broadband is woefully short of the targetset by DoT (See Table 2).12 The number of internet subscriberstoo would be significantly below the policy target, were itnot for the rapid penetration of mobile internet. There areabout 32 million mobile subscribers accessing the internetthrough wireless networks today, compared to about11 million who access it through the fixed network.
India seriously lags behind on broadband. Even TRAI hasconceded that its future targets are unlikely to be achieved,unless critical issues inhibiting broadband expansion inurban as well as rural areas are addressed. These includeboth policy and regulatory constraints.13
Two notable implications follow from these developments.One, hitherto unserved or under-served people will for themost part gain access through wireless technologies, whetherthe services are described as fixed, mobile, voice, or data.And secondly, given the importance of wireless to modern ICTinfrastructures, it thus becomes crucial for the governmentto play a more effective role in managing scarce frequenciesfor optimal use. This is a point to which we return in theconcluding section.The triggers for the massive increase in mobile penetrationhave been many. Factors such as price, income and tastes

8/2/2019 Impact of Mobile1
http://slidepdf.com/reader/full/impact-of-mobile1 4/25
have all been important determinants (this is explored moreformally in the economic model set out below). There hasbeen an enormous decline in prices. The effective price perminute for an outgoing mobile call has dropped from Rs.15.30 in 1998 to Rs. 0.68 today. This 98% decline would be
much higher in real terms. Another measure, the AverageRevenue per User (ARPU), is around Rs. 250 per month,compared to about Rs. 1550 in 1998.14 At the currentexchange rate that is roughly US$5 per month, representingabout 5% of an average Indian‟s monthly income. The launch
of micro pre‑paid and handsets priced at less than Rs.1,000
(US$20) have further reduced entry cost to the subscriberand extended demand. In addition, consumer financingof handsets, facilitated by declining interest rates, allowsspreading the cost over manageable monthly instalments.
Micro pre‑paid allows recharge options for as low as Rs. 10
(US$0.20). Other features of pre- paid reducing subscribers‟ entry costs include „lifetime validity‟, full value recharge and special „on-net‟ or „within network‟ tariffs.15 Not surprisingly therefore, 95% of new subscriptions are pre-paid, lifting thetotal number of subscribers on pre-paid from 76% in 2007 toabout 85% at the end of 2008. Income (measured by GDP percapita) has doubled since 1998, also contributing to demand.
India was not unique in its earlier embrace of a telephonemonopoly but deregulation started relatively late, in 1994,with drafting of the National Telecom Policy (NTP 94). This saw
the abandonment of the government-owned, verticallyintegrated structure of service provision which had led to lowsupply, high prices for certain services and a large segmentof the population without access to services. Market entry bymobile operators was allowed, starting in 1995, but was at firstlimited to two operators per service area.16 The third mobilelicence was reserved for public sector operators, MTNL andBSNL and the fourth mobile licence was auctioned in 2001.Subsequently in 2003 unlimited competition was introducedthrough a Universal Access Service Licence (UASL) thatrecognised the convergence of fixed and mobile technologies
in providing access.17 It was at this point that the number of mobile connections took off. The introduction of the “Calling Party Pays” (CPP) regime also contributed. Of total telecom sector revenue of US $27.5 billion in March2008, mobile telephony accounted for more than 50%.Average growth in revenue during the past three years hasbeen 20%, making India the fastest growing telecoms marketin the world. The more than 10 million mobile phones being

8/2/2019 Impact of Mobile1
http://slidepdf.com/reader/full/impact-of-mobile1 5/25
added each month are distributed among the major operators.Airtel, Vodafone and Reliance added the highest numbersof subscribers, with 2.03, 1.57 & 1.51 million new additionsrespectively in March 2008. Wireless service providers in Indiaalong with their respective market shares for March 2008 are
shown in Table 3. The top six players in the mobile markethave an all-India presence, while the others are regional.18The top three firms are private sector, while the public sectorBSNL ranks fourth. Strong competition has ensured a largerand more reliable network and farhigher penetration thanthe public sector would have been able to do on its own.Table 3: Mobile market shares
Service provider Market share, March 2008
Bharti Airtel 24.34%Reliance 17.74%Vodafone 17.21%
BSNL 14.37%IDEA 9.54%Tata Teleservices 9.23%Aircel 4.21%Spice 1.42%MTNL 1.29%BPL 0.49%HFCL Infotel 0.12%Shyam Telelink 0.04%Source: COAI. Figures are all-India shares, March 2008The Indian experience shows that, although it took severalyears for deregulatory measures to have an impact, inthe end competition-driven network expansion resultedin services being provided to those who had been deniedaccess in the public monopoly model. However, evenafter the monopoly of the government-owned incumbentis broken and the growth trajectory increased, moreis required if India wishes to close the gap with othercomparable countries, as Figure 4 illustrates.
On the other hand, mobile airtime rates in India havedropped to a level unmatched anywhere else in the world(see figure 5). At roughly 1 US cent a minute, the price is half of that prevailing in China and Pakistan. It is, therefore difficultto isolate a single factor responsible for India‟s low relative teledensity. One possibility is that it is due to India‟s late start.By the time India launched mobile in 1995, China had 3.6

8/2/2019 Impact of Mobile1
http://slidepdf.com/reader/full/impact-of-mobile1 6/25
million subscribers and Brazil 1.26 million. But this cannotbe the only reason as the gap continued to expand untilvery recently.Figure 5: Airtime rate per minute in selected countries
0
0.020.040.060.080.100.120.140.160.18Brazil0.17
South Africa Philippines China Pakistan India0.140.130.02 0.020.01Source: Merrill Lynch 2Q08Although net monthly additions in India are the highest inthe world today, the challenge is to ensure that growth doesnot slow, so that the gap between India and other countries isbridged sooner rather than later. This is all the more importantgiven the results of our econometric work reported below,which show a positive and significant relationship betweenmobile density and income at the state level.Mobile access differs between states and between urban andrural areas, but the gap is less than for other technologiesIt is often claimed that competition between the states toattract investment, especially since the 1991 economicreforms, has widened the already huge disparities betweenthem. The richer, better-administered and more literate stateshave proved more attractive than the poorer ones to investors.Between 1999 and 2008, when the Indian economy grew atTable 5: Indicators for individual states
States Geographical Literacy Rate, Per Capita Mobile Fixed Internet Broadband
Area 2001 Income, 2008 Subscribers Subscribers Subscribers Subscribers
Sep-08 Sep-08 Dec-07 Jan-08
Sq. km. % Rs. Per 100 people Per 100 people Per 100 people Per 100 people
Delhi 1,483 81.67 67,661 111.60 14.56 8.23 2.5Punjab 50,362 69.65 44,350 45.27 6.05 1.39 0.4Tamil Nadu 130,058 73.45 36,344 45.10 5.55 1.58 0.72Kerala 38,863 90.86 39,370 41.44 10.77 1.99 0.45

8/2/2019 Impact of Mobile1
http://slidepdf.com/reader/full/impact-of-mobile1 7/25
Himachal Pradesh 55,673 76.48 42,785 39.29 5.78 0.54 0.12Maharashtra 307,713 76.88 43,681 37.46 5.56 0.35 0.08Gujarat 196,024 69.14 41,826 35.31 3.82 0.97 0.36Karnataka 191,791 66.64 31,001 34.12 4.87 1.3 0.62Haryana 44,212 67.91 49,193 31.90 3.75 0.78 0.19
Andhra Pradesh 275,045 60.47 32,239 30.83 3.20 0.92 0.31Rajasthan 342,239 60.41 20,787 26.96 2.63 0.61 0.11WB and A&N 104,097 68.64 28,309 24.44 1.25 0.76 0.2J&K 222,236 55.52 23,943 22.32 2.09 0.54 0.07North East 176,645 63.25 26,789 18.80 2.48 2.87 0.04UP 294,411 56.27 17,036 18.33 1.40 0.26 0.06Madhya Pradesh 443,436 63.74 22,941 17.91 1.89 2.58 0.74Orissa 155,707 63.08 21,649 16.61 1.85 0.26 0.06Assam 78,438 63.25 21,700 16.18 1.28 0.17 0.05Bihar 173,877 47.00 14,113 12.21 1.11 0.1 0.03Source: CSO, GoI, Census 2001, and TRAI
12India: The Impact of Mobile Phones Moving the debate forward • The Policy Paper Series •
Number 9 • January 2009
an average annual rate of 7.3%, many richer states grew evenfaster: Gujarat at 8.8%, Haryana at 8.7% and Delhi at 7.4%.Among the poorest and most populous states, Bihar grew at5.1%, Uttar Pradesh at 4.4% and Madhya Pradesh at 3.5%.19At a policy level, there is a need torecognise the significanceof wireless in not only delivery of voice, but also data services,and to stimulate the installation of backhaul infrastructure inrural areas through the use of appropriate incentives.Table 7: A growth of mobile telephony in each state
1 J&K 268.352 North East 149.973 WB and A&N 141.434 Himachal Pradesh 121.465 Gujarat 113.216 Andhra Pradesh 110.927 Assam 110.808 Tamil Nadu 109.349 Bihar 108.6010 Orissa 107.0511 Madhya Pradesh 101.0412 Haryana 100.7513 Rajasthan 100.3914 UP(E) 92.5715 Punjab 92.2616 Kerala 87.8517 Maharashtra 85.0118 Karnataka 81.67

8/2/2019 Impact of Mobile1
http://slidepdf.com/reader/full/impact-of-mobile1 8/25
19 UP(W) 79.9120 Chennai 64.6021 Kolkata 62.3522 Mumbai 55.0623 Delhi 53.20
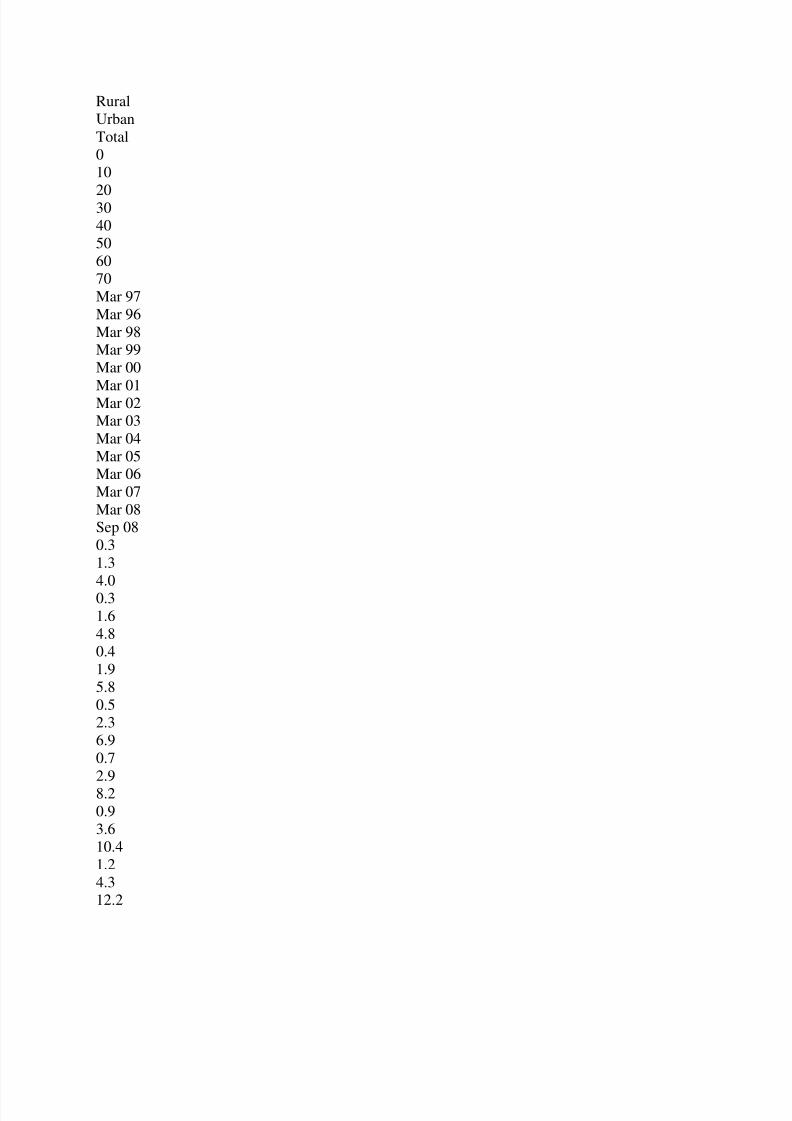
Source: Author estimates based on TRAI data; growth rate is annual average frominception of mobile services in each state to March 2008.Despite the massive increase in mobile density in the last threeyears, access in India is still skewed toward urban areas wheremuch of the industrial base is located. Urban teledensity isseven times higher than rural, which is home to 70% of India‟s population. In other words, two thirds of the phones are inurban areas where only 30% of the people live. The urban-ruralschism is in some ways starker than the gulf between states.It is therefore worth asking whether mobile technology couldbridge the rural-urban divide in the same way as it is has the
potential to reduce the divide between states.There are reasons for optimism on this score, although thegap is still wide. The strong mobile growth in 2007 – 08 hasoccurred despite some signs of saturation in urban markets.This suggests there is higher potential future growth in nonurbanmarkets. The latest figures show that at the all-Indialevel, urban teledensity (all attributable to mobile growth)increased by 34% while rural teledensity increased by 62%from March 2007 to March 2008, the disparity reflecting thelow rural base.Until now, the focus of mobile operators‟ attention has been on the more lucrative urban markets. The high cost of infrastructure rollout in less dense rural areas and affordabilitybarriers for the rural population are likely reasons. But thereare signs this is changing. Infrastructure rollout in ruralareas is now eligible for subsidy (described in detail below)and all major providers have reported future plans forexpansion in rural India.22 In addition, according to DipankarGupta, the village is not what it used to be: 70% of India‟s population, 56% of income, 64% of expenditure and 33% of savings come from rural India.23 The rural share of spendingon popular consumer goods and durables ranges from 30%to 60%.24 When examining rural data it is important to bearin mind that a small percentage of a large number is a largenumber. One percent of rural India is 1.4 million households.25Rural India therefore presents a huge opportunity but it alsorepresents a huge investment for telecoms operators. The keyfactor is the much lower population density of the rural areas – cost is driven largely by coverage (and area), while revenueopportunity is driven by population.
8/2/2019 Impact of Mobile1
http://slidepdf.com/reader/full/impact-of-mobile1 9/25
RuralUrbanTotal010
203040506070Mar 97Mar 96Mar 98Mar 99Mar 00
Mar 01Mar 02Mar 03Mar 04Mar 05Mar 06Mar 07Mar 08Sep 080.31.34.00.31.64.80.41.95.80.52.36.90.72.98.20.93.610.41.24.312.2

8/2/2019 Impact of Mobile1
http://slidepdf.com/reader/full/impact-of-mobile1 10/25
1.55.114.31.67.0
20.71.79.026.91.912.739.55.518.248.28.4
26.261.39.428.266.0Figure 7: Urban vs. Rural teledensity
Source: TRAI
Infrastructure constraints
Our research identified some important mobile drivers for
productivity improvements in agriculture. But all seven of thefocus groups involving predominantly small farmers in UttarPradesh and Rajasthan highlighted infrastructure gaps thataffected their ability to realise productivity gains throughimproved yields and higher prices. In order for farmers torealise the full potential of access to new information, theymust be able to use it effectively. We found consistently thatinadequate infrastructure prevented this.There are four specific infrastructure constraints which limitthe ability of farmers to leverage information:• insufficient availability of inputs (reduces yield);
• inadequate irrigation (reduces yield);• poor physical access to markets (reduces realised prices);• inadequate crop storage (reduces realised prices).Six of the focus groups highlighted problems such asdifficulties sourcing inputs such as fertiliser, seed andmedicine. There were concerns about the difficultiesidentifying genuine products as many counterfeits aresold. In several groups the farmers noted that they needed
8/2/2019 Impact of Mobile1
http://slidepdf.com/reader/full/impact-of-mobile1 11/25
information that would help them identify these counterfeitsupplies, which remain a significant productivity drainin India.29Three of the focus groups specifically mentioned lack of irrigation as a significant constraint and two of them noted
that it had affected the sustainability of growing desiredcrops.30 One Rajasthani farmer noted that the “scarcity of water is the main hurdle for development of agriculture inthe region.” Farmers reported poor road infrastructure and lack of refrigerated transport as problems affecting their access tomarkets. Many of the small farmers typically used small cartspowered by animal or small engines to deliver their goods tomarket and said that transport costs represented a prohibitivebarrier to accessing markets further afield. This limited theiropportunity to profit from market price differences by selling
at markets where higher prices may be available. As one smallfarmer in Allahabad commented, even if he knew the prices ina larger regional market, “There were no roads that go there.” The lack of storage facilities was cited as curtailing farmers‟ ability to choose when to sell their crop and thereby limitingoptions to maximize price. One group of farmers noted thatlack of storage was a contributing factor to the effectivemonopoly of local commission agents that they believedcaused them to receive lower prices for their produce.As a counterpoint to the findings in Uttar Pradesh andRajasthan, the farmers surveyed in the five focus groupsin Maharashtra did not report infrastructure constraintsoutside of a limited mention of cold storage concerns.31There was widespread irrigation and diversification into
water‑dependent, high-value crops like horticulture.32
There were no perceived concerns with availability of inputs33 or access to markets. Not surprisingly, these farmersconsequently reported greater ability to achieve both yieldand price benefits from leveraging information.ITC‟s internet kiosk service is one attempt to overcome some of the challenges presented by inadequate infrastructure,by combining the provision of information on agricultural
Wall painted advertisement of ITC E Choupal with mobile number of Sanchalak Farmingpractices, Allahabad31India: The Impact Moving the debate forward • The Policy Paper Series • Number 9 •
January 2009 of Mobile Phonespractices with other services like insurance along with directsale of inputs. Recognizing the problems faced by the smallfarmers in their supply chain, the internet kiosk model
8/2/2019 Impact of Mobile1
http://slidepdf.com/reader/full/impact-of-mobile1 12/25
includes information delivery, input provision and directprocurement. It seeks to overcome infrastructure constraintsby bringing markets to the farmer. Farmers we interviewedin villages with successful ITC programs reported yieldimprovements and price improvements as a result of the kiosk
program. The primary benefits reported were the introductionof hybrid seed varieties and adoption of new farmingpractices, leading to productivity gains between 10 – 40%.Farmers noted that by receiving comparative market pricinginformation as well as a firm price offer in advance from ITC,they had greater ability to choose when and where to selltheir products. They also benefited from being to sell to ITCtechniques. While we found a smallnumber who had madechanges based on the information they received via theirmobile phones, there were some who expressed reluctanceto try new approaches even when they had acquired relevant
information. ITC staff said that in their experience persuadingsmall farmers to adopt new seed varieties or farmingmethods often requires a combination of approaches:repeated dissemination of information, demonstration plotsand farmer dialogues. Several focus groups in villages wherehybrid seed had been introduced noted that the seedcompanies also promoted diffusion of the seeds throughdemonstration plots and capacity building measures.It therefore seems likely that for broader rural productivitygains a set of similar capacity-building activities tocomplement the basic information provision will be required.
Vegetable Vendors
Vegetable vendors are a familiar sight in mostneighbourhoods and residential areas. Almost half of India‟s population is vegetarian. In urban areas, homemakers havetraditionally bought their daily vegetables and fruits fromhawkers who to go from home to home to sell the producethey procure each morning from the wholesale market.Most vegetable vendors operate in a set area (such as aparticular residential neighbourhood) and are often knownto residents by their characteristic shouts which announcetheir arrival and invite their customers to buy. But times
are changing. The traditional system of buying and sellingvegetables has been under pressure in recent times. Morewomen work outside the home. The schedules of vendors andtheir customers do not always match, causing missed salesopportunities and higher wastage of unsold produce.Vendors are increasingly using mobile phones to overcomethese problems. The vegetable vendor serving a 12-storeyblock of over 100 flats in East Delhi takes orders from the

8/2/2019 Impact of Mobile1
http://slidepdf.com/reader/full/impact-of-mobile1 13/25
residents every morning on his mobile. His clients tell himwhat they need and in what quantity. They can alert him if they have plans which affect their vegetable order, such as acelebration or a trip away from home. The vendor can makeup appropriate packets for his clients, who then receive it at
the appointed time on their door step. The whole task nowtakes about three hours – freeing the vendor up for otherwork. His income has risen and the level of service received byhis customers has improved.The mobile phone enables the vendor to devise a solutionthat works for both himself and his clients. He is well-preparedwith the packages, bills and loose change. He has a welldefinedroute covering each floor of the apartment block systematically. Clients appreciate the personalisation and theconvenience. Meeting each of them with a prior appointmenthas given his work a new dignity and to him a new status,
as well as making the delivery process more convenient forboth parties. This point applies to many other traders suchas hawkers, repair persons. Previously seen as a necessarynuisance, their phones give them an opportunity to move upthe value chain and the status ladder. Slowly but significantly,India‟s traditionally hierarchical society may be becoming a little bit flatter.Given the near ubiquity of mobile phones in urban areasthe choice of examples of SMEs of this sole trader varietyis predictably large. The „eco-friendly‟ deserve a special mention. The waste recycler or „raddiwala‟ who buys old newspapers, metal objects and much else from homes torecycle now often makes an appointment with regular clients,unlike earlier when he went on his tiring rounds much likethe vegetable vendor above. The „clean transport provider‟, the cycle rickshaw puller, who helps people move in crowdedinner cities, when he has a longer booking – say, half dayor full day – might ask shoppers who want to stop often, tocall him when they are ready while he moves to park in lesscrowded part of the city nearby.A priest in the busy (and for him also lucrative) weddingseason, when a city may have hundreds or even thousands of ceremonies, might perform several in a single day. The sightof him coordinating his movement with clients as he is takingmore requests to officiate in others, may be relatively new,but is increasingly familiar.
JustDial, Mumbai, MaharashtraAs personal access to telecommunications increases, morepersonalised services can be delivered to subscribers. In India,widespread access to the internet is many years away, so other

8/2/2019 Impact of Mobile1
http://slidepdf.com/reader/full/impact-of-mobile1 14/25
means of accessing information offer value. JustDial, whichbegan operations in 1994, provides directory services on thelines of the familiar Yellow Pages to help its users to identifyand reach a wide range products and services. Callers dial itseasy-to-remember phone numbers in different towns and are
provided with information by JustDial staff. The range includeshelping somebody to locate a plumber who can fix a leakingtap, a tutor for a student, a shop selling decorative tiles forfloors, listings information about new film releases, or detailsof restaurants offering pizza within a certain budget, JustDialcan help with an ever-expanding range of queries, and is freefor callers; Its revenues come from businesses paying for alisting, as well leads that JustDial generates for them. JustDialnow supports SMS delivery that can contain more informationsuch as additional phone numbers, addresses and otherrelevant information.
JustDial, which had start-up capital of US$1000, 14 yearsago, has annual revenues of $17 million and a $100 milliondollar valuation company today on the back of its informationbusiness. Its creator, in a recent interview,12 attributed hiscompany‟s continuing success to the telecom revolution in India, which is largely fuelled by growth of mobile phones.Without this growth, the substantial JustDial business wouldbe significantly smaller as the accessible market would belimited. Mobile phones have clearly allowed the business toexpand. They also enable users to receive the informationthey seek more efficiently via SMS if they choose. JustDial isa very direct example of how economic growth is created as aconsequence of increased teledensity.
Radio Cabs
A number of more recently-founded radio taxi servicessuch as Meru Cabs, Easy Cabs and Mega Cabs have becomeavailable to Indian urban consumers in recent years. Thesenewer players leverage GPS and mobile technologies inan integrated fashion. Typically, the client of a radio cabcompany calls for a taxi an easy-to-remember phone numberlike 44224422. With the GPS technology deployed in thecompany‟s call centre and in its cars on the road, it is easy
to scan the neighbourhood for an available cab. The samesystem is able to call the driver in the car to confirm if andwhen he can reach the client at the requested time.Radio Cabs – currently operating in 4 cities, Delhi, Mumbai,Hyderabad and Bangalore – is estimated to have attainedrevenues of Rs54.7 million (US$) in barely 4 years sincethe first services began.13 The market has grown over 50%annually in recent years. Meru, the largest in size, is less than

8/2/2019 Impact of Mobile1
http://slidepdf.com/reader/full/impact-of-mobile1 15/25
one year old. Radio taxis offer more transparent billing tocustomers and can often be less expensive than the ordinarytaxi with the meter running as the older technologies can betampered with more easily. Not surprisingly, the radio cabbusiness has flourished in recent years.
Table 4 Radio taxi firmsCompany AlreadyoperationalFleetsizeExpandingin citiesMeru Cabs Mumbai,Hyderabad, Delhi& Bangalore1600 Chennai, Kolkata
& PuneSelect Cabs Hyderabad 100 Delhi & MumbaiForsche Mumbai &New Delhi60 – 70 – Mega Cabs Delhi,Chandigarh,Mumbai – Goa & HyderabadEasy Cabs Chandigarh,Delhi,Hyderabad &Bangalore1400 Mumbai, Chennai& PuneSource: http://www.travelbizmonitor.com/radio-cabs-switch-to-top-gear-in-indiaThe managers and the drivers have a healthier workingrelationship since the technology – whose exact use variesbetween the taxi companies – offers the drivers equitableaccess to lucrative and less-attractive routes, and makesmonitoring of their performance transparent. Managers cancontrol costs and quality far more effectively. This means thatgood drivers are easier to reward and retain. Driver incomeshave risen. Equally important, the quality of environment inwhich they operate has improved noticeably. Drivers find theirwork hours more predictable and are able to devote qualitytime to their families.

8/2/2019 Impact of Mobile1
http://slidepdf.com/reader/full/impact-of-mobile1 16/25
LabourNet, Bangalore
LabourNet is an example of how the delivery of basic services(such as plumbing, the repair of appliances and maintenanceservices) can be transformed through better organisationfacilitated by mobile phones. Mobile phones have enabled
LabourNet to deliver better service to customers withmore consistent service standards and quality. At the sametime, mobile contact allows the individual tradesmen toregularise their work and become more productive. Withincreasing economic activity, especially relating to the ITsector, Bangalore and Hyderabad have seen huge demandfor construction-related activity. LabourNet is attemptingto create an effective and non-exploitative marketplace forconstruction work.Traditionally in Bangalore, a client employs a Maistri (usually asmall subcontractor or independent foreman) who is usually
entrusted with the task of putting together worker teams for aspecific construction project. The Maistri, a critical intermediarybetween clients and the informal workers, has obviousclout. Given the vulnerability of the workers, the Maistriworkerrelationship is rarely transparent or documented, andfrequently exploitative of the workers involved.The LabourNet initiative was started in 2004 by Maya, anon-profit agency, with headquarters in Bangalore. It hascreated a network of workers in the informal service sectorthat can serve the construction, housekeeping, gardeningand transportation needs in the major cities of India by usingtechnology to help them find jobs and business opportunities.The initiative currently includes 200,000 workers and isenvisaged to extend to a million workers over the next 7 yearsin 7 cities around India.Maya aims to improve lives and livelihoods of traditionallybadly paid self-employed construction workers. A variety of tradespersons ranging from masons, carpenters, plumbers,electricians and so on to more specialised trades such aswater proofing experts, interior decorators, stone cutters,metal bar benders and many more are registered onLabourNet‟s database. Potential clients call LabourNet‟s call centre where staff can match their needs with workers onits database with appropriate skills, and also the fees andother specific characteristics which may be relevant for theproposed assignment. A plumber may, for instance, not bewilling or able to work on high-rise buildings.All workers registering with LabourNet require a workingmobile phone on which they can be called in case there iswork for them. This mobile linkage is critical since the workers,
8/2/2019 Impact of Mobile1
http://slidepdf.com/reader/full/impact-of-mobile1 17/25
who typically live in the urban slums, cannot be reached inany other way. They may even lack a stable or permanentresidential address. Also, many workers are often on-site whenthey need to be contacted.LabourNet solution benefits clients as well as workers.
Clients get workers who are checked and known toLabourNet. They can access the worker‟s individual history, skill sets and employment experience. Since wages too areincluded in the database, there is little room for last minutedisputes or unexpected re-negotiation of rates.For workers, LabourNet brings much additional value besidesnew work. It gives them a formal identity card which servesin many other situations – for example accessing buildingsor other services. The tracking of their performance can helpthem negotiate higher pay over time. In addition, registeringworkers can open their own bank account, usually extremely
difficult for itinerant and especially poor workers. Allregistered workers get accident insurance and can opt also tobuy health insurance – a substantial source of security in thevulnerable world that most informal workers inhabit.The number of registrations has more than doubled eachyear since the initiative started in 2004. As mentioned, inaddition to the Maistries, individual wage earners also registerwith LabourNet. As might be expected (see Table 3) whilethe Maistries spot the value of a LabourNet registration first,growing numbers of wage earners who have mobile phones,also starting to do so.

8/2/2019 Impact of Mobile1
http://slidepdf.com/reader/full/impact-of-mobile1 18/25
The impact of mobiles in the SME sector
We distinguish between two ways in which SMEs can usemobile telecommunications. Firstly, and most directly,SMEs can build specific business models around mobileservices e.g., developing applications for WAP or SMS-based

8/2/2019 Impact of Mobile1
http://slidepdf.com/reader/full/impact-of-mobile1 19/25
booking services, or information services (e.g. BookMyShow,JustDial). The mobile phone is enabling more creative andservice-oriented business models that are directly creatingemployment opportunities.This mobile value added services (MVAS) market which
provides services and applications that run on mobile phonesor networks is expected to reach over US$3 billion in revenuesin 2009.2 The MVAS market offers services of all kinds rangingfrom entertainment (e.g. film gossip, gaming) to potentiallylife-saving emergency information about nearest hospitals.This emerging MVAS business is driven by several major SMEsincluding companies who specialise in technology (e.g. BhartiTelesoft, OnMobile), mobile entertainment (e.g. Hungama),mobile marketing (e.g. ACL wireless, mobile2win, Indiatimes),and the emerging areas of mobile payments (e.g. mChek,Obopay, Ngpay), and location-based services (e.g. MapmyIndia)
In this paper, we look at two examples in particular – SMSOneand the JustDial service – which have created new businessopportunities through mobile.Perhaps more interesting is the second and indirect kind of impact of mobile. How can SMEs in general use mobiles toenhance their productivity and the efficiency of their valuechain? Small businesses often face challenges in scalingup their businesses. This may be due to lack of funds orinadequate access to markets but it can also be due to thebasic problems of communications and interrelationships astheir businesses grow. We were interested in exploring howsmaller businesses use mobile phones to overcome thesecommunications challenges.We have found a great wealth of examples of how mobilecommunications are enabling SMEs to move successfullyup the value chain and become more profitable; mobilesmean they can provide a better service and achieve greaterefficiency in their businesses. Arguably, the mobile phoneProfessor of Economics, ICRIERProfessor, IMIProf. Rajat Kathuria
Director,Com First (India) Private LtdDr. Mahesh Uppal
Dr. Mahesh Uppal is the Director of Com First (India) Private Ltd, a consultancy specializing inpolicy,regulation, and strategy.Rajat Kathuria is Professor of Economics at ICRIER, and is also a professor at the InternationalManagement Institute (IMI), New Delhi.52

8/2/2019 Impact of Mobile1
http://slidepdf.com/reader/full/impact-of-mobile1 20/25
India: The Impact of Mobile Phones Moving the debate forward • The Policy Paper Series •
Number 9 • January 2009
is permitting SMEs to make the transition from the streetcorner to the formal economy, with its attendant benefits of decreased vulnerability and increased incomes.
The case studies we have selected here range from individuallyrun businesses – like Ranjit the henna artist, described below,who started on the pavement but has now transformed hisbusiness in both geographical scope and in scale to becomemuch more substantial – to bigger SMEs like the taxi cabcompanies which are using mobiles to deliver a better serviceto more clients and operate more efficiently. In all of the verydifferent examples we consider, the use of mobiles, combinedwith other enabling factors including other technologies suchas GPS, allows capable entrepreneurs to benefit customers,employees and ultimately, of course, themselves. The details
of the ways in which mobiles are used vary depending onthe size and nature of the business
A survey of usage of mobile in poorurban areasIndia is an increasingly urban country, with over half a billionpeople expected to live in towns and cities by 2020. Morethan one fifth of the urban population lives in slum areas, andin some major cities the slum areas account for almost half the population. With large numbers of migrants arriving fromthe countryside in search of better opportunities, the slumsare growing.This makes the economic and social dynamism of the slumsa central issue for development. The key policy questionis whether life in the slums can become the focal point foran economic and social transformation which will alleviatepoverty. The alternative is that they will remain traps of despair and poverty. The rapid urbanization of the Indianpopulation and the consequent strain on urban infrastructuremeans that the economic and social plight of those living inthe slums will be one of the defining characteristics of Indiaduring the next twenty years.This context makes it crucial to develop public policies and
private opportunities which will allow slum dwellers to findways to address their particular needs. This paper seeks toanalyse the uptake and use of mobile telephony within someof India‟s urban slums, and its effect on the economic and social lives of their inhabitants. Few innovations have becomeas pervasive as quickly as the mobile phone. While thereis much anecdotal evidence on the ways mobile use canimprove the social and economic status of poor people, there

8/2/2019 Impact of Mobile1
http://slidepdf.com/reader/full/impact-of-mobile1 21/25
is little systematic evidence on the benefits of mobiles for
these groups.
The impact of mobiles on
agricultural productivitySanjay Gandhi is a consultant with expertise in private sector development, and technology andbusiness strategy in emerging markets.Gaurav Tripathi is a researcher at ICRIERIntroduction
The agricultural sector is critically important in anydeveloping economy and no less so in India, where itcontributes close to 20% of GDP and where 60% of thepopulation depends on agriculture either directly orindirectly. As India urbanizes, the urgent need to alleviatepoverty amongst both rural and urban populations makes
it essential to catalyse agricultural productivity. The Indianagricultural sector, however, despite periods of strong growthin the past, has more recently experienced low productivitygrowth. Serious challenges must be addressed in order toachieve faster productivity growth, including infrastructureconstraints, supply chain inefficiencies and also significantproblems in the diffusion of and access to information.
Small‑scale producers, who make up the vast majority of
Indian farmers, are often unable to access information thatcould increase yields and lead to better prices for their crops.The increasing penetration of mobile networks and
handsets in India therefore presents an opportunity to makeuseful information more widely available. This could helpagricultural markets operate more efficiently, and overcomesome of the other challenges faced by the sector. A keybackdrop to our investigation is the recent research byRobert Jensen examining the impact of mobile phone useby Kerala fishermen.1 Jensen found that the introductionof mobile phones decreased price dispersion and wastageby spreading information which made the markets more22India: The Impact of Mobile Phones Moving the debate forward • The Policy Paper Series •
Number 9 • January 2009 efficient. Mobiles allow fishermen, particularly the somewhatmore prosperous ones, to get timely price information anddecide the best place to land and sell their daily catch. A morerecent paper by Reuben Abraham also looking at Keralafishermen found that widespread use of mobile phonesincreased the efficiency of markets by decreasing risk anduncertainty, although it noted that realizing the potential

8/2/2019 Impact of Mobile1
http://slidepdf.com/reader/full/impact-of-mobile1 22/25
efficiencies depends on easy access to capital, especially at
the production end of the supply chain.2
Total employment in the sector to reach 10.3 million in 5 years.Communication will be
amongst the Top 3 growth drivers of the economy by 2015
Communication sector is predicted to emerge as the single largest sector of India‟s economy,
with a 15.4% share (equivalent to Rs.865,031 crore) of GDP by 2014-15. In India‟s
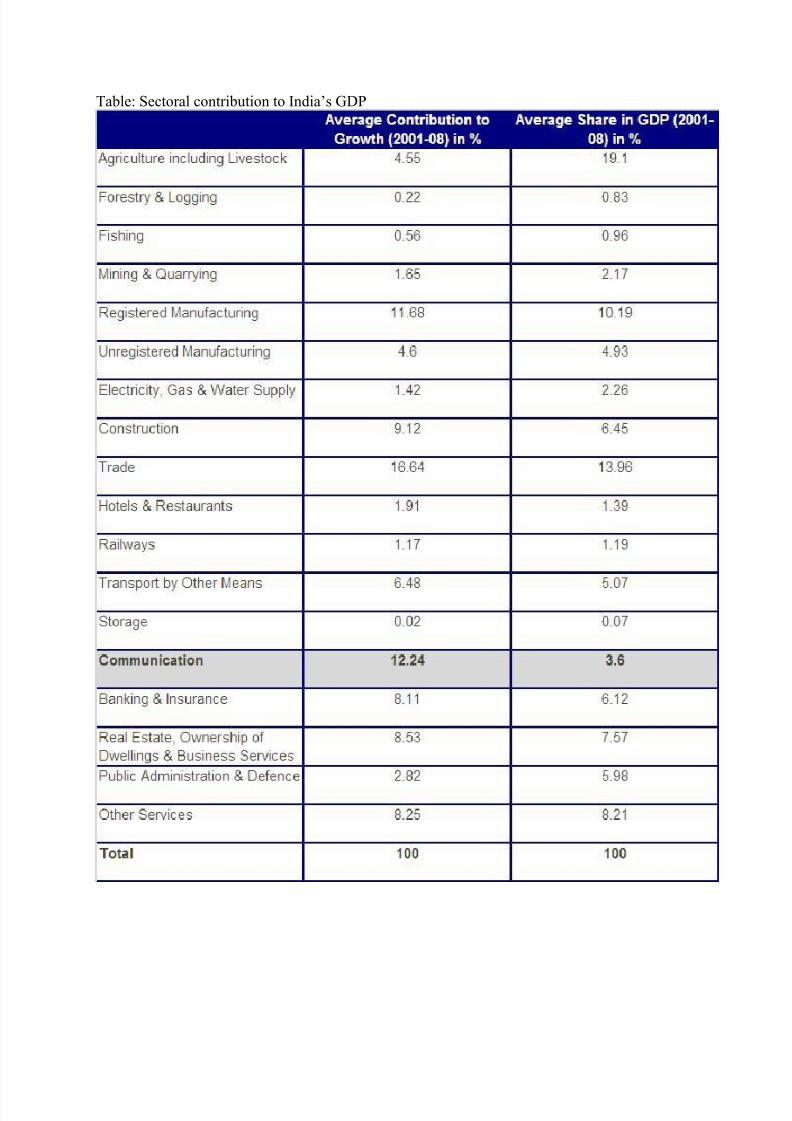
transformation from an agrarian to a services economy, communication is recognized as thefastest growing sector, growing by 25.7% during 2001-08. The communication sector will thusbe one of the major drivers of the Indian economy in the next five years. Its ranking in terms of contribution to total GDP has moved up from #17 in 1980-81 to #8 in 2007-08 and is furtherexpected to surpass all other sectors by 2014-15, assuming that all other sectors grow at theaverage growth rates observed during 2001-08. Telecommunication sector‟s share of total GDP
has increased from just 0.7% in the 1980s and 1.0% in the 1990s to 3.6% during 2001-08. In2007-08, the sector accounted for 5.7% of GDP.
Trade, Communication and Registered Manufacturing have shown more than 10% contribution(16.7%, 12.24% and 11.68%, respectively) to GDP growth during 2001-2008; however, theCommunication sector has outperformed the others despite its share of total GDP being only3.6% as against the shares of Trade (14.0%) and Registered Manufacturing (10.2%). Thecommunication sector has also had a significant impact on employment in the country. The studypredicts that the sector will generate an additional 8.5 million jobs by 2014-15, taking the totalnumber of jobs in the sector to 10.3 million.

8/2/2019 Impact of Mobile1
http://slidepdf.com/reader/full/impact-of-mobile1 23/25
Thus, the communication sector will continue to be an engine of the Indian economy over the 4/5next years. The role of communications in accelerating socio-economic development should notbe underestimated. Communication is having a positive impact on employment in the servicesand retail sectors, and helping the country to emerge as a major manufacturing power. It iscritical to empower every individual to connect to people, information and services regardless of
their location or income. This is a key element in the vision of a truly inclusive knowledgesociety. Connected people can create, accumulate and disseminate knowledge, eventuallyleading to enhanced productivity and equitable socio-economic development. This latest studyreiterates communication‟s growing importance as an agent of transformation.
8/2/2019 Impact of Mobile1
http://slidepdf.com/reader/full/impact-of-mobile1 24/25
Table: Sectoral contribution to India‟s GDP

8/2/2019 Impact of Mobile1
http://slidepdf.com/reader/full/impact-of-mobile1 25/25