impact of mining and resource development: a case study ... of mining and... · a case study for...
TRANSCRIPT
Postal: PO Box 3192, Rundle Mall South Australia 5000
Telephone (+61-8) 8313 5555 Facsimile (+61-8) 8313 4916 Email: [email protected] Physical: 3
rd Floor, Nexus Tower, 10 Pulteney Street, Adelaide
SOUTH AUSTRALIAN
C E N T R E F O R E C O N O M I C S T U D I E S
ADELAIDE & FLINDERS UNIVERSITIES
Impact of Mining and Resource Development: A Case Study for Eyre Peninsula Councils
Report commissioned by:
Local Government Association of South Australia
Report prepared by:
The South Australian Centre for Economic Studies
July 2013

Impact of Mining and Resource Development: A Case Study for Eyre Peninsula Councils Contents
The SA Centre for Economic Studies July 2013
Contents Executive Summary (i) 1. Introduction 1 1.1 Background 1 1.2 Objective 2
2. Literature Review 5 2.1 Future of mining in South Australia 5 2.2 Mining on the Eyre Peninsula 5 2.3 General impacts of mining on regional communities 8 2.4 General impacts of mining on local government 14
3. Profile of Local Councils: The Baseline 17
3.1 Population growth 17 3.2 Employment in various industries 19 3.3 Post-school qualifications 25 3.4 Age distribution 26 3.5 Council finances 27 3.6 Number of rateable properties 29 3.7 Student enrolment in Eyre Peninsula schools 29 3.8 Gross Regional Product, unemployment and the labour market 29
4. Mining on the Eyre Peninsula 33
4.1 Mines on the Eyre Peninsula 33 4.2 Travel of residents for work 37
5. Assessing the Impact of Mining on Local Governments 39 5.1 Responses from councils 39 5.2 Demand for infrastructure 45
6. Methodology 47 7. Case Study of Tumby Bay 72 7.1 Why Tumby Bay 72 7.2 What will result for Tumby Bay from mining? 73 7.3 What has Tumby Bay done to prepare for mining? 75
References 77
Appendix A: Projections for Local Government Areas 81
Appendix B: Statistical Subdivision & Statistical Local Areas 92
This report was prepared by the following SACES researchers:
Assoc Professor Michael O’Neil, Executive Director Lauren Kaye, Research Economist
Mark Trevithick, Research Economist
Disclaimer: This study, while embodying the best efforts of the investigators is but an expression of the issues considered most relevant, and neither
the Centre, the investigators, nor the Universities can be held responsible for any consequences that ensue from the use of the information in this report. Neither the Centre, the investigators, nor the Universities make any warranty or guarantee regarding the contents of the report, and any warranty or guarantee is disavowed except to the extent that statute makes it unavoidable.

Impact of Mining and Resource Development: A Case Study for Eyre Peninsula Councils Page (i)
The SA Centre for Economic Studies July 2013
Executive Summary This is an investigative report concerned with future mining developments on the Eyre Peninsula, about which there are many unknowns and considerable uncertainties. The principal objective of the report was to provide information to councils to “help them determine future population patterns” and settlement patterns and the report addresses this objective. There are 33 developing minerals projects in South Australia (excluding those already approved) and of these some 15 projects are located in, or proximate to, the Eyre Peninsula.1 To the extent that uncertainties can be resolved in regard to the timing of construction and mine site operations then councils, mining companies, State and Commonwealth governments can proceed with longer-term strategic planning. This report provides information to assist with the planning process. It is difficult to plan and commit resources including funding – whether you are a mining company or local council – in an environment of uncertainty. Judgements about the future (i.e., commodity prices, demand), population impacts, sourcing of skilled labour and various other “unknowns” impact future planning and elevate risks. Leaving aside the two largest councils in the Eyre Region the other nine councils are relatively small. They will be required to deal with individual mine operators, with local impacts and with regional impacts. There are likewise service and infrastructure requirements that the State government will need to address. And, further there is no single, one mine operator or mine site as with Olympic Dam and potentially multiple start dates. R1: The State government together with the Local Government Association of SA (LGA) should
consider establishing an “Eyre Peninsula Mining and Community Development Taskforce” to:
provide a single and strengthened forum for information sharing as to the development of mine sites, infrastructure demand and community impacts;
to assist councils in preparatory planning for housing and support services;
to provide a focus to all State agencies activity (e.g., education, health, police) as a result of mining proceeding and thereby provide support to the Eyre Peninsula Local Government Association (EPLGA) and Regional Development Australia (RDA) as they address local issues.
R2: The “Eyre Peninsula Mining and Community Development Taskforce” would thereby play a
similar role as the Olympic Dam Taskforce, enabling a single body to take a regional perspective in developing industry, on environmental matters and regional infrastructure and emerging issues that require joint local council/State government decision (i.e., “user pays” principle for road access; maintenance of local roads, etc). Such a body could also draw in planning assistance from State agencies where land use planning, re-zoning is necessary at a council level.
R3: Representation is a matter for the State government but could include membership of the LGA
(1), membership from the EPLGA (3), membership of the Whyalla and Eyre RDA (1) consideration be given to a representative from the South Australian Chamber of Mines and Energy (SACOME) (1).
1 DMITRE: various publications.
Page (ii) Impact of Mining and Resource Development: A Case Study for Eyre Peninsula Councils
July 2013 The SA Centre for Economic Studies
An important distinguishing feature for the mine operators, councils and communities on the Eyre Peninsula (relative to other mine sites in Western Australia, Northern Territory and Far North Queensland) is the proximity of local townships to the mine sites. The most important implication is the beneficial prospect of a more stable, residential population, a drive-in/drive-out workforce and flow-on demand for household investment and consumption. Potential impacts include:
short term boost in population numbers during the infrastructure and construction phase, pressure on housing, rents, existing accommodation, potential need for demountable, short-term accommodation;
attract and retain new residents for on-going operations, single persons and married workers with families, with flow-on benefits to housing construction, personal consumption, school enrolments and access to services;
job opportunities for local residents although unemployment is low and current full-time employment is high;
increase in local incomes (increase in expenditure) and wealth;
preference for local employees, unemployment is low in some regional towns, transition of some workers from agricultural sector to mining particularly transport/road drivers and even skilled workers from councils and related employment;
potential training and employment for local Indigenous communities that will require specialised (i.e., culturally specific) approaches to training and work placement;
trades workers comprise approximately 18 per cent of a mining company’s workforce; stationary and mobile plant operators, road and rail drivers and mining labourers represent some 54 per cent of the workforce so that many of these skills already exist in the workforce of the region. That is to say, there will be movement within the currently employed workforce; and
there will be opportunities in clerical and administration sectors. Much of the demand for professionals, surveyors, engineering, specialist managers and environmental health professionals could be met from migration into the region.
As mining on the Eyre Peninsula grows and the population of towns increase the responsibilities and expectations of local government increase beyond its traditional scope. Pressure is likely on councils to provide new infrastructure such as land use for housing, accommodation, libraries, community centres etc and services such as rubbish disposal. Councils face resource constraints when trying to meet these expectations. The construction of new mines is certain to have an impact on councils across the region. Employment will be created not only at mine sites, but also in support industries such as housing construction, transport, and shopping and personal services. First round impacts will be direct employment in mining, a shift of labour from existing industries and an even lower unemployment rate. Second round impacts will flow from investment in housing, household consumption expenditure and a potential boost to the population. What is needed is a collaborative approach where local and state governments cooperate and plan with mining companies to assist councils to provide some of the required infrastructure. Attracting and retaining skilled and other necessary workers, and retaining workers and families throughout and beyond the life of a mine site illustrates how individual councils and mining companies share a common goal. Working collaboratively to support mine site development, minimising costs and
Impact of Mining and Resource Development: A Case Study for Eyre Peninsula Councils Page (iii)
The SA Centre for Economic Studies July 2013
maximising productivity and at the same time providing a high quality of life, low cost housing and social and community services will provide substantial benefits to the region. In this report, the South Australian Centre for Economic Studies (SACES) estimates the following:
to the year 2020 the number of new jobs in the mining industry to reach 2,180;
the number of new mine workers who move into the region to be 1,530 to 1,660;
the resulting residential, longer-term population increase to be in the order of 4,450 to 4.820 persons;
demand for housing (to 2026) to increase above the baseline due to mining under scenario 1 (most likely scenario) by 1,200 houses;
the student population to increase by between 950 to 1,050 students, demand for teachers from between 42 to 70;
require four additional bulk-billing General Practitioners (GPs) and up to 14 additional police staff;
the four townships/council areas of Tumby Bay, Wudinna, Franklin Harbour and Kimba will experience most increases in population; and
depending upon the density of dwellings per hectare up to 108.5 hectares of land needed to accommodate population growth (12.5 dwellings per hectare) rising to 169 hectares (eight dwellings per hectare).
\


Impact of Mining and Resource Development: A Case Study for Eyre Peninsula Councils Page 1
The SA Centre for Economic Studies July 2013
1. Introduction
1.1 Background
Australia’s mining sector has expanded rapidly over the past decade. An expansion in foreign demand for Australian commodities particularly those used in steel and energy generation has been lead by China and a number of periphery countries in Asia. South Australia’s mining output and mineral exploration expenditure has grown rapidly as new mineral deposits are discovered and developed to meet expected demand. The State now has 20 major operating mines compared to five in 2006 (DMITRE, 2012); there are also 33 developing projects and more than 107 prospective mine sites. Most mining activity in the State is concentrated in the Far North and increasingly on the Eyre Peninsula. Consequently local councils on the Eyre Peninsula face increasing pressure to meet community demands and expectations for local infrastructure and services. To meet the challenges Eyre Peninsula councils need to better understand how their region will be affected in terms of: population growth, housing demand and allotment of residential land as well as the impact on all other community infrastructure and services. The Eyre Peninsula is unique compared with other long established mining areas in Central Queensland and northern Western Australia which typically use Fly-in-fly-out (FIFO) workers. Most newly developing mines on the Eyre Peninsula are within commuting distance for local townships making the preferred method of travelling to work drive-in-drive-out (DIDO). The implication of DIDO is that existing town residents employed in mines will commute to the mine site while maintaining a permanent residence on the Eyre Peninsula. As new residents take up employment over the next five to ten years they are also likely to adopt a DIDO arrangement. Unlike with FIFO, the burden of supporting these residents rests with local councils that are required to identify future population patterns so they can plan for town development. Traditionally, council responsibilities have been referred to in simplest terms as “roads, rates and rubbish” although we consider this to be an outdated view of the functions, services and activities that councils are responsible for. It is not the function of this report to review council activities (a detailed list of local government responsibilities can be found at the Local Government Association website), except to note that Councils spend over $0.5 billion annually on, inter alia, economic development, community amenity and services, industry programs, environmental management, water catchment, recreation facilities and broad range of community services. Councils levy rates on local residents to generate the financial resources necessary to deliver these services and infrastructure. The expected increase in populations of towns on the Eyre Peninsula can only be supported if councils have the human and financial resources to meet the growth. Councils have limited ability to raise revenue quickly to respond to the increasing demand for new infrastructure and services. Long-term strategic planning is needed along with collaboration between councils, mining companies, State Government and Federal Government.
Page 2 Impact of Mining and Resource Development: A Case Study for Eyre Peninsula Councils
July 2013 The SA Centre for Economic Studies
1.2 Objective
The single objective of this project was the following:
to assist Councils to plan properly for the future by providing information that will help them to determine future population patterns.
To meet this objective the report will outline the following:
population growth and settlement patterns;
community profile and trends; and
community facilities catchment. It was suggested that the report will also assist councils and the Local Government Association of SA (LGA) with regards to:
the development, timing, design and location of community infrastructure over the next ten years and beyond and the relationship between mining company’s and councils;
identifying services and facilities required for their Council district’s emerging population based upon supply and demand analysis and identification of service catchments;
identifying capital costs (where possible) associated with proposed community infrastructure to be included in their long term financial and asset management plans; and
allowing the LGA of SA to provide input of a statistical nature to future iterations of the South Australian Government’s regional planning strategy for the Eyre Peninsula.
However, it is important to consider the following caveats:
that there is a high degree of uncertainty with respect to mining companies as to their future labour requirements and exactly when they will be required;
there is a high degree of uncertainty as to the start date of mining operations, dependent upon a number of variables (e.g., $A, international circumstances, commodity prices, availability of supportive infrastructure such as ports, water, electricity, rail/road);
several companies are only at the very preliminary, pre-feasibility stage and future timing of operations is unknown;
there is a list of “developing mines” which have no start date well into the future; and
relationships between mining companies and councils appear to be positive, but it is not possible to determine with real certainty community infrastructure requirements, specific services or capital costs for any specific physical infrastructure.2
The future impact on councils is dependent, in part, on all of the above but most critically the preference (and then actual reality) of mining companies to hire and maintain a local labour force, the extent of unemployment in the region to take-up employment, the number of people who leave existing employment to take up a mining job, the ability of the farming community to contribute to employment in mining and the take-up of those who are underemployed or not in the labour force. Each of these factors will determine the extent of in-migration to the region; the life of a mine will influence settlement/ residence decisions; family structures and the location of mines will influence where individuals/families chose to locate. The profile of a “mining workforce” – by age, gender, family structure – will exert influence on community infrastructure and demand for services. The extent of an under-utilised stock of housing will determine the demand for housing supply, residential allotments and the need for council zoning. Finally, companies may invest in housing for their mining workforce proximate to the mine site
2 A much larger study on “mining infrastructure” demand is underway, conducted by Deloitte Access Economics.

Impact of Mining and Resource Development: A Case Study for Eyre Peninsula Councils Page 3
The SA Centre for Economic Studies July 2013
and while this may service the fly-in/fly-out (FIFO) workforce it will act to reduce demand for new housing. The final determination of a mining company as to how it intends to transport mining products will impact on decisions about ports, pipelines, the use of roads and rail. It is not yet determined what these impacts will be, but if, for example, local roads are intended to be used then councils will need to explore user-pay charges, perhaps transfer “local roads” to State government or explore alternative financing options so that ratepayers do not bear the cost of maintenance. The genesis of this project is that the Local Government Association of South Australia commissioned the South Australian Centre for Economic Studies (SACES) to profile and characterise local government areas on the Eyre Peninsula to assist Eyre Peninsula councils to undertake strategic planning for the future. The LGA asked SACES to consider the following Local Government Areas as part of the analysis.
Ceduna Lower Eyre Peninsula
Cleve Streaky Bay*
Elliston Tumby Bay*
Kimba* Wudinna*
Franklin Harbour*
Note: Those asterisked denotes towns that are expected to be most impacted by residential expansion over the next 5 years, depending on continued demand for iron ore and development of mining sector across the region.
When the Local Government Areas of Whyalla and Port Lincoln are included, this list covers all of the Local Government Areas in the Regional Development Australia Whyalla and Eyre Peninsula region. For these LGAs, this report provides inter alia, a profile of each region using a variety of sources including the ABS Census to map aggregate population, population change and growth between Census years, population by age cohort, employment by industry, education qualifications and council rates and taxes revenue. General commentary is also provided on the levels of associated State-based services such as education, health and police that will be required with the expansion of mining. This report also provides profiles of each mine on the Eyre Peninsula including size, location, development status, minerals extracted, expected length of operations once fully operational and whether they currently use or intend to use FIFO workers to support operations. Input from mining companies was sought to develop a better description of each mine on the Eyre Peninsula. Companies surveyed were asked to describe the location of their mines and the nearest towns to each mine site, stage of development, life of mine, infrastructure requirements, investment, workforce, preference for sourcing workers and any requirements between miners, local and state government in relation to maximising regional benefit. Input from Local Council was sought to assess the local impacts from mining, planning currently undertaken and assistance required. Councils were asked to describe their relationship with the mining sector, how well informed they are and the nature of cooperation between the mining and exploration companies. Information was sought regarding council’s capacity to adapt to increased demands from mining due to population growth and increased demand for infrastructure and services. Responses from councils are summarised into a single response and provided in the main body of the report.

Page 4 Impact of Mining and Resource Development: A Case Study for Eyre Peninsula Councils
July 2013 The SA Centre for Economic Studies
A case study of Tumby Bay is provided highlighting the expected impact of mining on a selected community on the Eyre Peninsula, i.e., growth in population, need for accommodation, community infrastructure, services and the role local government and mining companies need to play in assisting the development. The report is organised as follows, Section 2 contains a literature review of the current state of mining in South Australia, what the future holds for the industry, mining on the Eyre Peninsula and a description of the general impacts of mining on communities and local government. Section 3 contains a summary profile of each local government area, Section 4 provides a description of mines on the Eyre Peninsula, Section 5 provides a discussion of the responses to the survey received from the nine participating councils and considers the potential impact on local governments in terms of services and infrastructure provision. Section 6 considers the methodology to estimate population impacts and other impacts relevant to local councils and Section 7 provides a case study of the impacts of mining on the District Council of Tumby Bay.

Impact of Mining and Resource Development: A Case Study for Eyre Peninsula Councils Page 5
The SA Centre for Economic Studies July 2013
2. Literature Review
2.1 Future of mining in South Australia
Investment in mining exploration and the development of new mines in South Australia, supported by the Plan for Accelerating Exploration (PACE) began in April 2004. Global demand primarily from China and a number of developing countries in Asia provided strong stimulus to mining exploration. Minerals mined in South Australia include, inter alia, copper, iron ore, gold, silver, cobalt, heavy minerals, lead, zinc, graphite, molybdenum and uranium. With respect to uranium, South Australia has three mines, Olympic Dam the world’s largest uranium deposit at Roxby Downs owned by BHP Billiton, the Beverley mine owned by Heathgate Resources and the Honeymoon mine owned by Uranium One. The State has 78 per cent of Australia’s known uranium resources and one third of the world’s known uranium reserves which offer potential for further exports to countries for use in electricity generation (Earth Resources, Information Sheet). Although mining is still a small sector of the South Australian economy in terms of its proportion of gross state product in comparison with traditional industries of manufacturing and services, the mining industry has grown considerably. Mineral exploration in South Australia reached $313 million in 2011 (ABS, 2011) or 8.8 per cent of Australian mineral exploration expenditure, a significant increase over the last ten years. Mining real gross value added for South Australia reached $4.4 billion in 2010/11, an increase of 46 per cent over ten years (SACES Economic Briefing report, June 2012). The future of mining in South Australia is dependent on a number of external considerations including overseas economic conditions as the majority of output is exported overseas, commodity prices, international demand and supply, the availability of processing facilities and internal considerations including associated infrastructure such as roads, rail, water, power etc.
2.2 Mining on the Eyre Peninsula
The Whyalla and Eyre Peninsula region consists of a population of 58,707 (2010) and covers an area of 170,448 square kilometres3 (SACES, Regional factsheet, RDA Whyalla and Eyre Peninsula). If the local government areas of the Provincial Cities of Port Lincoln and Whyalla are excluded and Unincorporated West Coast and Aboriginal communities are excluded, then the population of just the Eyre Peninsula is 19,929 (ABS, 2011) covering an area of 42,967 square kilometres.4 The Eyre Peninsula contains the mineral rich regions of the Gawler Craton and Eucla Basin. Existing mining operations are largely centred on iron ore extraction and a heavy mineral sands mining operation at Jacinth-Ambrosia. New opportunities also exist for the development of mining for gold, nickel, silver and uranium. In 2010 the Eyre Peninsula Mining Alliance (EPMA)5 was formed to promote minerals development on the Eyre Peninsula and address issues in relation to infrastructure development and sustainable growth of the mining industry. Major industries of the Eyre Peninsula region are agriculture and fisheries, manufacturing, building and construction, retail trade and service industries. Mining currently comprises a small share of activity but has potential for growth in the medium term. Eyre Peninsula is rich in iron ore with high grade deposits of hematite and magnetite; mineral exploration has identified up to one billion tonnes or iron ore product
3 This includes the unincorporated area of Unincorporated West Coast and the Aboriginal communities of Maralinga Tjarutja Lands and Yalata
Aboriginal Reserve. 4 This represents the local government areas of Tumby Bay, Wudinna, Elliston, Streaky Bay, Kimba, Cleve, Franklin Harbour, Lower Eyre Peninsula
and Ceduna. 5 EPMA: Archer Exploration, Investigator Resources Ltd, Lincoln Minerals, Iron Road and Centrex Metals.

Page 6 Impact of Mining and Resource Development: A Case Study for Eyre Peninsula Councils
July 2013 The SA Centre for Economic Studies
with an estimated value of between $100 billion and $140 billion (Regional Development Australia, Whyalla and Eyre Peninsula). Exploration companies believe the total unexploited iron ore resource on the Eyre Peninsula to be well in excess of the already discovered one billion tonnes. Annual export production is expected to reach 15 to 20 million tonnes within five years, but development of the region’s iron ore mining industry is dependent on the construction of a deep sea port capable of handling panamax size ships (Regional Development Australia, Whyalla and Eyre Peninsula). The Eyre Peninsula has major sea ports located at Port Lincoln, Port Bonython, Thevenard (Ceduna) and Whyalla. Mining companies active on the Eyre Peninsula have proposed a number of new deepwater ports for which they will provide the capital funding. Some proposals include:
Deep sea-water port at Sheep Hill (Port Spencer) funded by Centrex Metals; and
Deep sea-water port at Cape Hardy near Tumby Bay and Port Neill funded by Iron Road. The District Council of Franklin Harbour was recently awarded $2.2 million in Regional Development Australian Funding (RDAF) for the Lucky Bay Harbour extension in Round Two of the RDAF funding grants program. The project will involve construction of a new port facility capable of loading iron ore and is estimated to have a total cost of $12.2 million with funding leveraged from additional sources (Regional Development Australia Fund, Project fact sheet). The new facility will assist emerging iron ore companies in the Whyalla and Eyre Peninsula region facilitating the transfer of ore from mines and shipment to export markets. The South Australian Government’s Major Developments Directory 2012/13 lists nine new developments in the Eyre Peninsula region valued at $5.8 billion. These projects are listed as at the feasibility study stage, under consideration, at field trials stage, in progress or approved. By way of comparison the capital value of major mineral projects listed in the Directory on the Eyre Peninsula is approximately the same as the capital value of mineral projects listed for the Far North region. New development projects on the Eyre Peninsula in order of highest capital cost to least capital cost include:
Iron Road’s Central Eyre Iron project (Warramboo) – 175km north of Port Lincoln;
Eyre Iron and WISCO’s Fusion project – 35 km north of Port Lincoln;
Centrex Metals and Baogang’s Bungalow Joint Venture – 10km north west of Cowell;
Arrium’s Hematite extension project – near Whyalla;
Centrex Metals Wilgerup deposit– 30km South East of Lock;
Ironclad’s Wilcherry Hill iron ore project – 40km north of Kimba;
Lincoln Mineral’s Gum Flat mine – 20km West of Port Lincoln;
Minotaur Exploration’s Poochera deposit – near Streaky Bay;
Samphire’s Uranium Project – 20km South of Whyalla
Source: South Australian Major Developments Directory, 2012/13
PIRSA Minerals indicates South Australia has 20 major approved mines in operation. Five of these approved mines are located on the Eyre Peninsula and include:

Impact of Mining and Resource Development: A Case Study for Eyre Peninsula Councils Page 7
The SA Centre for Economic Studies July 2013
Approved mines on the Eyre Peninsula
Mine Resources Company Location
Iron Chieftain Iron ore Arrium Limited Middleback Ranges, north western Eyre Peninsula
Jacinth-Ambrosia Mineral Sand Project
Heavy mineral sands
Iluka Pty Ltd Approximately 200km NW of Ceduna
Middleback Range: Project Magnet
Iron ore Arrium Limited Middleback Ranges, north western Eyre Peninsula
Wilcherry Hill project Iron ore Ironclad Mining Limited
30km north of Kimba, northern Eyre Peninsula
Wilgerup Iron ore Centrex Metals Ltd 30km SE of Lock, central Eyre Peninsula
Source: PIRSA Minerals, list of approved mines.
PIRSA Minerals also indicates there are 31 developing projects in South Australia. Eleven of these developing projects are located on the Eyre Peninsula and include; Developing mines on the Eyre Peninsula
Mine Resources Company Location
Atacama Heavy minerals Iluka Resources Ltd 200km NW of Ceduna
Bungalow Iron ore Centrex Metals Ltd (joint venture with Baogang)
9km N of Cowell
Fusion Iron Magnetite Project Iron ore Centrex Metals Ltd (joint venture with WISCO)
South Eastern Eyre Peninsula
Gum Flat Iron ore Lincoln Minerals Ltd Southern Eyre Peninsula, within 20km of Port Lincoln
Hematite Extension Project Iron ore Arrium Limited Middleback Ranges, north western Eyre Peninsula
Menninnie Dam Lead, Zinc and Silver
Terramin Australia Ltd Northern Eyre Peninsula, 160km WNW of the Port Pirie lead smelter
Paris Silver Investigator Resources Ltd
Northern Eyre Peninsula, approximately 500km NW of Adelaide
Poochera Kaolin Minotaur Exploration Ltd
100km SE of Ceduna on Eyre Peninsula
Samphire Project Uranium Uranium SA Approximately 20km south-west of Whyalla on Eyre Peninsula
Sonoran Heavy minerals Iluka Resources Ltd 200km NW of Ceduna
Tripitaka Heavy minerals Iluka Resources Ltd Approximately 100km NW of Ceduna
Typhoon Heavy minerals Iluka Resources Ltd 200km NW of Ceduna
Uley Graphite Project Graphite Mega Graphite Inc South Eyre Peninsula, approximately 23km W and SW from Port Lincoln
Warramboo Iron ore Iron Road Ltd Central Eyre Peninsula
Source: PIRSA Minerals, list of developing mines.
Iron Road’s Central Eyre Iron project (see developing mines list) at Warramboo located 26km from Wudinna in Central Eyre Peninsula is an example of a developing project which is expected to have a positive impact on the local community; requiring strategic planning by the local council because of the close proximity of the mine to regional towns. As potentially the biggest project in the State after Olympic Dam, the development is expected to reverse the exodus of people from Wudinna and attract new families to the town.

Page 8 Impact of Mining and Resource Development: A Case Study for Eyre Peninsula Councils
July 2013 The SA Centre for Economic Studies
Nigel Austin from The Advertiser notes in a recent article “The mine that could change our future”, (February 12th, 2013),
“that once the mine is operational it is expected to earn more than $2 billion a year, a return far greater than that produced by the farms on which the mine is situated. In terms of infrastructure it is estimated the mine will require $4.5 billion dollars in new infrastructure expenditure on power, roads, water, 150km of rail and a new port proposed at Cape Hardy capable of handling panamax size ships.
During construction 1,600 workers will be required and upon completion the mine will require 500 workers to operate. Given the proximity of the mine to Wudinna many of the workers will be based at Wudinna township.6 Iron Road was quoted as saying “we want the workforce to be as residential as possible i.e., drive-in-drive-out” such that the town will not be bypassed as in FIFO arrangements. The final plan is for 30 per cent of new workers to be based in Wudinna doubling the town’s size. Hundreds of new homes are expected to be built providing a boost for school services and health services, the rail and power system will be improved, local businesses will have increased turnover and community infrastructure such as sporting clubs will be upgraded. The life of the mine is expected to be 12 years but Iron Road would like to increase that to 20 or 30 years with further drilling and testing.”
The numbers referred to in the article appear to be on the high side given that it is difficult to develop robust workforce forecasts for especially construction phases of mines and related infrastructure. RESA in an earlier workforce study estimated total new construction jobs for the 10 projects they surveyed at 1,400 (2013) and this included Iron Road activities at Warramboo. Total new jobs were estimated to increase by 691 (from 2,769 in 2011 to 3,338 in 2020) for the 10 projects assuming probability weighting for mines going ahead and no staff turnover. If all seven mines proceeded to the operation stage then 2,070 on-going direct jobs could be created. So there needs to be a degree of caution in estimating impacts and planning for growth. Notwithstanding, what we do know is that the population of Wudinna is approximately 560 persons (Census 2011) with an unemployment rate at 1.6 per cent and that the location and life of the mine would support an increase in the local population, a local residential workforce and drive-in/drive-out situation.
2.3 General impacts of mining on regional communities
The following literature review examines the general impacts of mining on regional communities from an Australia wide perspective, with reference to the situation of the Eyre Peninsula. Impacts can be, economic, environmental or social in nature and can be both positive and negative.
Economic
Two speed economy with uneven wealth distribution
The most frequently mentioned impacts of mining on communities were economic in nature − the wealth generated for Australia’s communities and the new jobs created across a broad spectrum of occupations. Data from the Australian Taxation Office shows that postcodes in the Pilbara region of Western Australia and the Central Outback region of Queensland which are at the centre of the mining industry are now amongst the wealthiest in their respective states and Australia. Mining has also made a significant contribution to boosting whole of state incomes. For example, an examination of mean taxable income for taxable individuals in Australia for 2009/10 reveals a mean income of $59,951 while in the mining state of Western Australia mean income for taxable individuals was $65,829 almost 10 per cent higher than other mainland States.7
6 Wudinna and Warramboo would most likely be places for residential accommodation, primary schooling at Wudinna as the Warramboo Primary
School closed in December 2002. 7 Taxation Statistics 2009/10.

Impact of Mining and Resource Development: A Case Study for Eyre Peninsula Councils Page 9
The SA Centre for Economic Studies July 2013
While the mining industry has increased mean incomes, resulted in a boom in exports and contributed to strong economic growth, the benefits of mining are not spread evenly across Australian communities. States which are not naturally endowed with resources argue that the gains from the boom and the benefits of mining investment accrue largely to mining-related sectors and the states where these are concentrated, while the rest of the country is impacted by a higher exchange rate. Other export oriented industries are said to be impacted by the value of the $A, notably manufactured exporters, services exports such as tourism and education services, processed food and some agricultural exports. There is a “flip-side” in that consumer goods and capital goods are cheaper given the value of the Australian dollar and this acts to moderate inflation. For example in 2011/12 private new capital investment in minerals and energy in Western Australia (Australia’s largest mining state) was 55 per cent of the Australian total (Government of Western Australia Department of Mines and Petroleum). The stimulus from this investment means that output growth in a mining state such as Western Australia will grow faster than non-mining states while the mining industry is expanding. As a result resource rich states of Western Australia and to lesser extent Queensland have benefited disproportionately in comparison to New South Wales and Victoria leading to what economists describe as a two speed economy. Although mining output from South Australia accounts for a small proportion of total mining output nationally there is strong growth predicted for the Far North and Whyalla and Eyre Peninsula. Over the next ten years as new mines are opened on Eyre Peninsula incomes and wealth in local towns will grow and the population will increase as mine workers shift to the region permanently. This is one way in which regional communities will benefit through their ability to attract, settle and retain mine workers and their families. Potential Impacts
short term boost in population numbers during the infrastructure and construction phase, pressure on housing, rents, existing accommodation, potential need for demountable, short-term accommodation;
attract and retain new residents for on-going operations, single persons and married workers with families, with flow-on benefits to housing construction, personal consumption, school enrolments and access to services;
job opportunities for local residents although unemployment is low and current full-time employment is high; and
increase in local incomes (increase in expenditure) and wealth.
Job creation
The mining industry has the potential to create additional jobs for local communities across a broad range of occupations. Occupations most in demand are engineering, especially mechanical and mining, surveyors, scientists, geologists, metallurgists, technicians, truck drivers, plant operators and tradesmen. Clearly, persons in some of these occupations and with these qualifications are not currently residing in the region and represent a temporary or transient, mobile workforce. The Workforce Study for the Resources Sector in the Eyre Peninsula noted that 2,070 ongoing direct jobs will be created in mining and processing operations on the Eyre Peninsula between 2011 and 2020 if all the proposed mines listed in the study become operational. That study further estimated that 4,500 “man years of effort” over the period 2011-16 will be created on the Eyre Peninsula in the construction phase of new mines and through infrastructure development.

Page 10 Impact of Mining and Resource Development: A Case Study for Eyre Peninsula Councils
July 2013 The SA Centre for Economic Studies
Companies expressed a strong desire to create jobs for local residents with the preference for jobs going to those within local townships. It is also important to note that Eyre Peninsula mining companies have strong commitments to education, training and employment opportunities for the Aboriginal community. Iluka and Ironclad have Native Title Agreements with Indigenous communities which outline a range of obligations and initiatives to create jobs for remote Aboriginal communities. Iluka has set a 20 per cent indigenous employment target at its Jacinth-Ambrosia heavy mineral sands mine near Ceduna (Iluka Resources, 2013). Potential Impacts
preference for local employees, unemployment is low in some regional towns, transition of some workers from agricultural sector to mining particularly transport/road drivers and even skilled workers from councils and related employment; and
potential training and employment for local Indigenous communities that will require specialised (i.e., culturally specific) approaches to training and work placement.
Skills shortages
Mining companies face various challenges to find skilled labour for the construction of mines and operation. This leads to the recruitment of workers from local government agencies and the private sector in small regional communities creating acute shortages of skilled workers. One local government in Queensland notes,
The mining boom has leached many of the skilled workers and much of the support and people needed for the survival of the infrastructure of the town. Whether it is grader drivers abandoning their machines to drive at the mines or nurses, also needed by the mining companies, or plumbers or carpenters. (Local government QLD, quoted in Local government, mining companies and resource development: Meeting the governance challenge, 2012)
On the Eyre Peninsula growth in the mining sector will place increasing demands on the existing workforce as the demand for skilled labour escalates. Over the next five years demand for skilled tradespersons is expected to increase by 8.9 per cent annually followed by production and transport workers increasing by 7.9 per cent annually and labourers and related workers increasing by 7.3 per cent annually (RDA Roadmap Whyalla and Eyre Peninsula, 2011). Mining companies offer higher wages and may entice workers from other industries operating in the town creating shortages of workers needed for the survival and function of local towns. Successive rounds of job cuts at BHP Billiton are favourable for other mining regions in South Australia. The most recent round of job cuts at BHP Billiton’s Olympic Dam of 100 contract staff will provide skilled labour to other operating mines on Eyre Peninsula which will help to alleviate skills shortages. Likewise the cancellation of the expansion of the Olympic Dam mine which would have needed 6,000 workers during construction phase and 4,000 workers during operation (Olympic Dam Project: Draft EIS), reduces still further the demand for skilled and semi-skilled labour in the short to medium term. Potential Impacts
trades workers comprise approximately 18 per cent of a mining company’s workforce; stationary and mobile plant operators, road and rail drivers and mining labourers represent some 54 per cent of the workforce so that many of these skills already exist in the workforce of the region. That is to say, there will be movement within the currently employed workforce; and
there will be opportunities in clerical and administration sectors. Much of the demand for professionals, surveyors, engineering, specialist managers and environmental health professionals could be met from migration into the region.
Impact of Mining and Resource Development: A Case Study for Eyre Peninsula Councils Page 11
The SA Centre for Economic Studies July 2013
Social
Housing availability/affordability
Development of mines in regional areas can have a significant impact on the availability and affordability of accommodation. Two general examples taken from the “Local government, mining companies and resource development: Meeting the governance challenge”, (Centre for Social Responsibility in Mining, 2012) report cites the Pilbara region in Western Australia and the Bowen Basin in Queensland as examples of areas which have become unaffordable due to high demand for houses. Pilbara residents in Karratha and Port Hedland pay amongst the highest real estate prices and rental in the country caused by strong demand for accommodation and a slow supply response. Median house prices are well in excess of those paid in metropolitan Perth and other regional areas. In the Bowen Basin median rent is the highest in the State of Queensland at around $2,000 per week. On the Eyre Peninsula the expanding mining industry and associated population growth implies demand for housing will outstrip supply in some local government areas. Population growth and demand for housing is currently strongest in the towns of Whyalla, Ceduna and Cowell where the positive impact of the mining industry is already being felt following the development of new mines nearby. The availability of housing and land for housing is a critical issue for both local councils and mining companies where the benefits of pre-planning and joint discussions will be of immeasurable importance. Pressure on social and community infrastructure
Community infrastructure includes a wide range of built facilities, services and network of organisations which cater to the community’s needs. The influx of new mining workers increases demand for community infrastructure and services sometimes placing a strain on local councils. On the other hand, increased population makes health centres, schools, child care centres and other personal services more viable and avoids the pattern of the withdrawal of services which has been experienced across much of the regional landscape. Service organisations sometimes struggle to find skilled and experienced workers to fill the growing number of key positions and vacancies which open up in response to increased demand on services. Expansion of mining on the Eyre Peninsula and the anticipated growth in population of local communities will increase pressure on councils to provide the necessary social and community infrastructure that a growing population will require. Residents in the Whyalla and Eyre Peninsula region have access to a wide range of health services in a number of locations, including access to eleven hospitals. The Whyalla, Port Lincoln and Ceduna Hospitals are regional facilities attracting priority status and all have either undergone or are earmarked for major redevelopment – i.e., Ceduna Hospital had a $36 million redevelopment during 2009/10, Whyalla Hospital is undergoing a $69 million redevelopment scheduled for completion in May 2013, and the $39 million redevelopment of the Port Lincoln Hospital is currently at the planning stage. Eight smaller hospitals at Cummins, Elliston, Streaky Bay, Tumby Bay, Wudinna, Cleve, Cowell and Kimba provide a range of primary health services, including residential aged care. There are additional Community Health Centres located at Port Lincoln, Tumby Bay, Cleve, Whyalla, Lock, Wudinna and Ceduna. Dedicated Indigenous Health Centres are located in Port Lincoln (Port Lincoln Aboriginal Health Service); Ceduna (Ceduna Koonibba Aboriginal Health Service); Whyalla (Nunyara Wellbeing Centre) and Yalata (Yalata/Maralinga Health Service). Depending upon the final measure of population growth some of these facilities may require upgrading or expansion, particularly for schools in coastal districts, child care centres and recreational facilities for young people especially.

Page 12 Impact of Mining and Resource Development: A Case Study for Eyre Peninsula Councils
July 2013 The SA Centre for Economic Studies
Managing a fly-in/fly-out (FIFO) workforce
FIFO mining operations result from having mines located in remote regional areas which do not have the infrastructure to support a large workforce. Workers fly to remote locations where food and lodging accommodation is provided for employees at the mine site but not for their families. Schedules are established whereby each employee spends a fixed number of days working on-site and then a fixed number of days at home. In the construction phase of a new mine FIFO is the best way of managing the construction workforce which by its nature is short term and itinerant. Employees benefit from FIFO by providing the flexibility of working on the mine site and still being able to live in another destination of their choosing. Mining companies benefit through cheaper on-costs associated with housing workers. The higher costs of town construction and maintenance, costs and difficulties of providing social overhead capital, industrial relations, worker preferences for the opportunities offered by larger metropolitan areas, structural changes within the mining industry and changing taxation arrangements have contributed to making FIFO attractive and the preferred workforce arrangement for mining companies8 (Storey, 2010). FIFO has implications for future infrastructure development in local communities with discussions and planning underway to upgrade Port Lincoln, Whyalla, Ceduna and Wudinna airports to cater for growth of FIFO mine workers and increased passenger numbers (see RDA Roadmap Whyalla and Eyre Peninsula, 2011). These are significant projects the development of which will provide long-term benefits to each community and have spill-over effects for tourism and trade. In an earlier study of the mining industry, a survey was undertaken by the South Australian Centre for Economic Studies where mining companies were asked about the advantages and disadvantages that flow from fly-in/fly-out operations. The responses were wide ranging and show that the decision to operate this system is quite complex. From the perspective of mining companies, the advantages and disadvantages of the fly-in/fly-out system are listed below:
Advantages: 50 per cent of respondents stated that the lower capital cost incurred was a major advantage of the system,
better home and family life rather than a one company town, domestic issues are kept separate from work,
minimisation of impact on the area,
more flexibility with rosters,
the pain of closing down a community is avoided,
lower relocation costs for employees,
less absenteeism, lower turnover and a larger reservoir of employees,
fewer fringe benefit tax implications,
captive workforce so weekends can be treated as weekdays,
more stable workforce,
the difficulty of attracting qualified personnel to outback locations is avoided.
Disadvantages: high travel costs,
higher operating costs and a less social environment,
maintenance of an airport,
lack of normal family life,
8 The introduction of the Fringe Benefit Tax was also instrumental in changing the practices of mining companies as housing became a taxable
benefit.

Impact of Mining and Resource Development: A Case Study for Eyre Peninsula Councils Page 13
The SA Centre for Economic Studies July 2013
lower productivity on-site,(one and a half people are required to do one full time person's work),
safety (many hours spent in light aircraft),
high social cost (if one marriage partner is on the system, experience has shown a very high separation rate after a few months of fly-in/fly-out operations),
lack of overlap between employees,
difficulties can arise in maintaining effective continuity in key positions at the site while the regular incumbent is absent.
The responses show that the advantages and disadvantages are dependent upon location as some respondents advantages are others disadvantages, such as the quality of home life. The answers also show that not only economic factors need to be considered in any mining development but social factors that affect the workforce are important to the efficient operations of a mining enterprise. From the perspective of local councils, FIFO has drawbacks which can adversely affect local communities. Some local community members feel their community does not benefit from FIFO workers. There are concerns that FIFO workers use community services but spend their income elsewhere rather than on local businesses. In addition mining companies are keen to achieve economies of scale and bypass local businesses in their supply chains which perpetuates what is known as the “flyover effect” (Local government, mining companies and resource development: Meeting the governance challenge, 2012). One private sector representative in Queensland noted in relation to FIFO employment arrangements,
It will be the death of us. When people reside here, they add to the community. They buy products from town and they support other industries. If BHP do 100 per cent FIFO there will be no more people coming to town, but they’ll be taking out resources (Non-mining private sector QLD, quoted in Local government, mining companies and resource development: Meeting the governance challenge, 2012)
There were also concerns that non-resident mining workers were excluded from statistical counts and therefore assumed to place no extra demands on councils feeding into local government funding formulas. This exacerbates the significant deficit in available council revenue to fund the infrastructure and services required to service resource industry activity (Local government, mining companies and resource development: Meeting the governance challenge, 2012). However, the Eyre Peninsula faces a different set of circumstances to remote mines located in Queensland and Western Australia which are only accessible by plane. Eyre Peninsula mines are located close to townships, i.e., a commuting distance of 50km, which makes drive-in/drive-out (DIDO) arrangements more feasible. Mines potentially could be staffed almost exclusively of local workers who commute to work but reside in the local area and this would minimise the impact of FIFO and the flyover effect. An additional consideration is the research, development and planned exploration of drilling for oil and gas in the Great Australia Bight (GAB) by British Petroleum (BP) and partners. Already there are helicopter flights from Port Lincoln out to the drilling sites and this will expand in 2013/14. There are potential benefits to Port Lincoln in particular if they are able “to capture” both employment at the drilling sites and capture on-land expenditure, including if workforce members reside at places such as Coffin Bay and the Boston Marina.

Page 14 Impact of Mining and Resource Development: A Case Study for Eyre Peninsula Councils
July 2013 The SA Centre for Economic Studies
Environmental
Land use conflict
Land use conflicts can arise between local communities and mining companies. Conflict is most likely to arise when resource-rich land in question lies close to urban areas and in cases where resources are located on prime agricultural land such as the lower Eyre Peninsula. Interstate governments have countered the issue of land use by enacting legislation banning the development of mining operations within a 2 km radius of towns with at least 1,000 people (e.g., Queensland). The New South Wales Government has responded by developing regional strategic land use plans to ensure that conflict between agricultural producers and mining companies is minimised. As new mining operations are developed on the Eyre Peninsula the potential for land use conflict arises. For example Iron Road’s Central Eyre Iron project near Wudinna/Warramboo is located on fertile agricultural land running across several Eyre Peninsula farms. Although there are community benefits associated with the mine, land owners have expressed some reservations with the proposal as their farming operations could be negatively impacted. For example, trucks carrying mined product are likely to pass through their region during seeding and harvest periods. Cumulative environmental impacts of multiple mining operations
Cumulative impacts are defined as the aggregated positive and negative outcomes of an activity on society, the economy and the environment. Each individual effect may be minor on its own, but collectively the total impact may be greater than the sum of the individual parts. In relation to mining cumulative effects can arise from,
the compounding effects of a single mining or processing operation;
interference effects between multiple mining and processing operations; and
interaction between mining and non-mining activities. The central idea behind cumulative impacts is that it is insufficient to consider the impact of only one project or action. For sustainable development in the mining industry the full range of human generated stressors need to be examined and put into their environmental, social and economic context. Some of the general environmental impacts on the local community relate to threats to native plant and animal species, vegetation clearing and loss of biodiversity, reduced surface water quality in lakes and rivers, reduced groundwater quality, reduced quality of prime farming and grazing land, reduced air quality and greenhouse gas emissions. Mining development on the Eyre Peninsula is likely to have some of these types of impacts on the natural environment. For example the Jacinth-Ambrosia mine disturbs an area of 610 hectares near Ceduna involving removal of vegetation, top soil and sub soil while remaining overburden is removed with a truck and excavator (Iluka Resources, 2013). Seeds, vegetation, top soil and sub-soil is stockpiled separately for revegetation at the end of the mine’s life. Other environmental concerns centre around the impact of drilling on underground water aquifers which can become contaminated.
2.4 General impacts of mining on local government
Local government faces a number of challenges in relation to community expectations of their role and scope and a narrow revenue base which can be used to fund and support infrastructure development. These are discussed in more detail below.
Impact of Mining and Resource Development: A Case Study for Eyre Peninsula Councils Page 15
The SA Centre for Economic Studies July 2013
Challenges faced by local government on the Eyre Peninsula
Increased community expectations
The function of local government as set out in the Local Government Act 1999:
Plan at the local and regional level for the development and future requirements of their area;
Provide services and facilities that benefit their area, ratepayers and residents, and to visitors to that area;
Provide for the welfare, well being and interests of individuals and groups within their communities;
Take measures to protect their area from natural and other hazards and to mitigate the effects of such hazards;
Manage, develop, protect, restore, enhance and conserve the environment in an ecologically sustainable manner, and to improve amenity;
Provide infrastructure for their communities and for development within their area;
Promote their areas and to provide an attractive climate and locations for the development of business, commerce, industry and tourism;
Establish or support organisations or programs that benefit people in their areas or Local Government generally;
Manage and, if appropriate, develop public areas vested in or occupied by a Council;
Manage, improve and develop resources available to a council; and
Undertake other functions and activities conferred by or under an Act. As mining on the Eyre Peninsula grows and the population of towns increase the responsibilities and expectations of local government increase beyond its traditional scope. Pressure is likely on councils to provide new infrastructure such as land use for housing, accommodation, libraries, community centres etc and services such as rubbish disposal. Councils face resource constraints when trying to meet these expectations. Financial resources of councils are narrow in comparison to state and federal governments making it more difficult to fund and provide an acceptable level of services. Mining companies have generally been reluctant to make up the shortfall in local government; instead mining companies believe that state and federal governments should play a greater role in addressing shortfalls in funding. What is needed is a collaborative approach where local and state governments cooperate and plan with mining companies to assist councils to provide some of the required infrastructure. Given that mining companies have been provided access to resources in local areas they owe a duty of care to the local residents to invest in town infrastructure that will have a lasting benefit to the community such as roads, power utilities, hospitals and schools. In a research paper on “The Economics of Government Provision of Mining Infrastructure: A Case Study Approach” (SACES, 2011) the researchers examined the experience of small to medium sized mines in the Eyre Peninsula to consider principles and rationale for government investment in infrastructure, how best to achieve both economic and social dividends and provide an objective basis to determine future investment that maximises economic benefit. The principles and rationale were: 1. The provision of infrastructure by government for mining developments needs to be considered
on a case-by-case basis. Infrastructure should not be provided prior to a full financial review of the expected returns from the development. If a development is submarginal in the absence of funding, other things being equal, then it should not be pursued. Sensitivity analysis needs to be undertaken on the likely benefits under a range of price scenarios.
Page 16 Impact of Mining and Resource Development: A Case Study for Eyre Peninsula Councils
July 2013 The SA Centre for Economic Studies
2. If it can be demonstrated that the mining development would act as a catalyst to substantial further development of a region or allow other proven mining deposits to be developed that are economic as a group (in the absence of infrastructure) but not individually then government might wish to become involved in the provision of infrastructure for mining developments. The evidence in support of this is not convincing.
3. The user-pays principle is appropriate in the case of developments in isolated areas where virtually all infrastructure (physical and social) is project specific. Non-refundable grants should be required of the developer to partially cover the cost of the social infrastructure if the development is not likely to operate for one cycle of infrastructure.
4. If intergovernmental bidding for investment attraction purposes (or other reasons) lead the State
government to provide incentives through infrastructure provision or otherwise to ensure specific mining projects go ahead, such incentives should be provided only to projects which in all other respects are economic; should be project-specific and tailored to minimise the cost to government; and should be available only where, net of the cost of other opportunities foregone by this use of funds, they increase the present value of the South Australian community's wealth.
5. If the cost minimising approach to mining development, in the absence of government provision of infrastructure, is for a fly-in/fly-out operation then government should not be involved in the provision of social infrastructure. Both economic and social costs are involved in this costing exercise.
6. The government may need to become involved in the provision of infrastructure for mining developments to ensure equity between generations.
7. There is an argument for government providing infrastructure to mining developments as a form of equity investment to overcome the distortion to private sector discount rates caused by sovereign risk. Government equity investment needs to recoup a return to the South Australian government commensurate with the level of equity provided. Part ownership of the infrastructure is a means by which the government can obtain a share of the rents of the mineral resource.
8. The South Australian government should aim to charge the appropriate user charge for physical infrastructure provided for mining developments. Government should expect to earn a rate of return on assets equal to the marginal pre-tax rate of return on assets in the private sector.
9. The provision of transport infrastructure to mining developments would provide the South Australian government with the opportunity to raise revenue through infrastructure pricing policies. Transport infrastructure charges need to be set that do not significantly distort production decisions.

Impact of Mining and Resource Development: A Case Study for Eyre Peninsula Councils Page 17
The SA Centre for Economic Studies July 2013
3. Profile of Local Councils: The Baseline
Mining on the Eyre Peninsula has the potential to be a major new industry. The list of different resources in the region is extensive as noted previously. As well as containing different resources, a number are high quality (e.g., the kaolin deposit at Poochera is claimed to contain the “brightest deposits of kaolin known in the world”).9 The construction of new mines is certain to have an impact on councils across the region. Employment will be created not only at mine sites, but also in support industries such as housing construction, transport, and shopping and personal services. First round impacts will be direct employment in mining, a shift of labour from existing industries and an even lower unemployment rate. Second round impacts will flow from investment in housing, household consumption expenditure and a potential boost to the population.
3.1 Population growth
Councils on the Eyre Peninsula by population size (not by area) are small with the exception of Whyalla and Port Lincoln ranging from 1,048 persons (Elliston) to 4,916 persons (Lower Eyre Peninsula)10. Population growth in the Eyre Peninsula has not been as significant as state wide population growth over the period 2001 to 2011. Whilst the majority of Councils show an increase in population there are a few that experienced a decline in population. Those that experienced a decline in population are fairly small communities with population numbers of less than 2,000. Figures 3.1a and 3.1b show the changes in the ABS estimates11 of population in these regional communities over the decade to 2011. It can be seen that communities that are growing are doing so very slowly. Figure 3.1c shows the population trends for Port Lincoln and Whyalla. Overall, the regional communities under study have been growing at a slower rate than the State average. Figure 3.1a: Population trends, Eyre Councils: Elliston, Franklin Harbor, Kimba and Wudinna, 2001 to 2011
Source: ABS, Regional Population Growth, Australia, 2011, Table 4 (Cat No. 3218.0).
9 Andrews, 2012. 10 ABS 2011, 2011 Census of Population and Housing, using ABS Table builder. 11 The ABS Cat 3218.0, Regional Population Growth, Australia, provides estimates of population levels by State and local government area for each
year based on census data collected. The estimates for 2001 to 2006 are final, however the estimates for 2007 to 2011 are preliminary based on the 2011 census and as such may change as a result of future census outcomes.
1,000
1,100
1,200
1,300
1,400
1,500
1,600
1,700
1,800
1,900
2,000
2001 2002 2003 2004 2005 2006 2007pr 2008pr 2009pr 2010pr 2011pr
Estim
ated
pop
ulat
ion
(ABS
)
Elliston (DC)
Franklin Harbour (DC)
Kimba (DC)
Wudinna (DC)
Cleve (DC)

Page 18 Impact of Mining and Resource Development: A Case Study for Eyre Peninsula Councils
July 2013 The SA Centre for Economic Studies
Figure 3.1b: Population trends, Eyre Councils: Ceduna, Cleve, Lower Eyre Peninsula, Streaky Bay and Tumby Bay, 2001 to 2011
Source: ABS, Regional Population Growth, Australia, 2011, Table 4 (Cat No. 3218.0).
Figure 3.1c: Population trends, Port Lincoln and Whyalla, 2001 to 2011
Source: ABS, Regional Population Growth, Australia, 2011, Table 4 (Cat No. 3218.0).
1,000
1,500
2,000
2,500
3,000
3,500
4,000
4,500
5,000
5,500
2001 2002 2003 2004 2005 2006 2007pr 2008pr 2009pr 2010pr 2011pr
Estim
ated
pop
ulatio
n (A
BS)
Ceduna (DC)
Lower Eyre Peninsula (DC)
Streaky Bay (DC)
Tumby Bay (DC)
13,000
14,000
15,000
16,000
17,000
18,000
19,000
20,000
21,000
22,000
23,000
24,000
2001 2002 2003 2004 2005 2006 2007pr 2008pr 2009pr 2010pr 2011pr
Estim
ated
po
pula
tion
(ABS
)
Port Lincoln (C)
Whyalla (C)

Impact of Mining and Resource Development: A Case Study for Eyre Peninsula Councils Page 19
The SA Centre for Economic Studies July 2013
3.2 Employment in various industries
Figure 3.2 shows the growth in mining employment in South Australia from February 1994 to November 2012.12 The peak of mining employment in South Australia occurred in May 2012 with an estimated 14,400 individuals employed in mining. The growth of the mining sector over the last decade with the majority of this growth occurring since 2003 is evidenced by an increase of almost 10,000 employees in the decade to November 2012. Figure 3.2: Persons employed, mining South Australia, by quarter, 1994 to 2012, (‘000)
Source: ABS, Labour Force, Australia, Detailed, Quarterly, November 2012, Table 5 (Cat No. 6291.0.55.003).
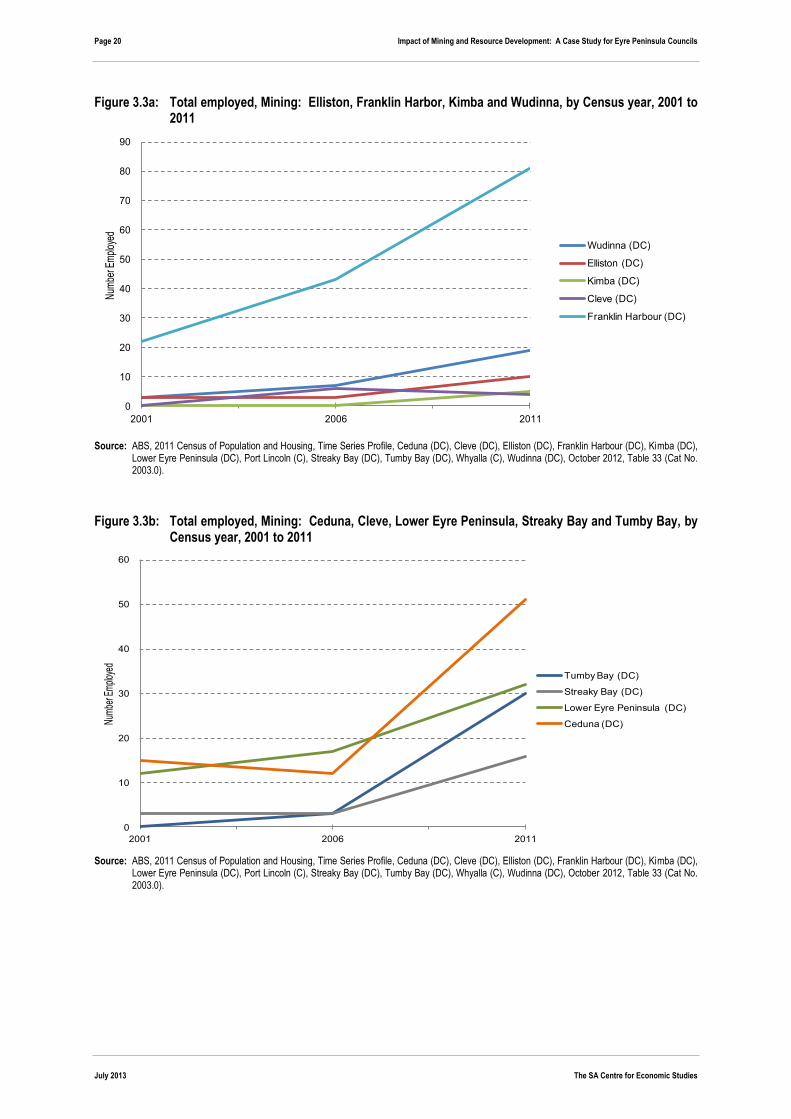
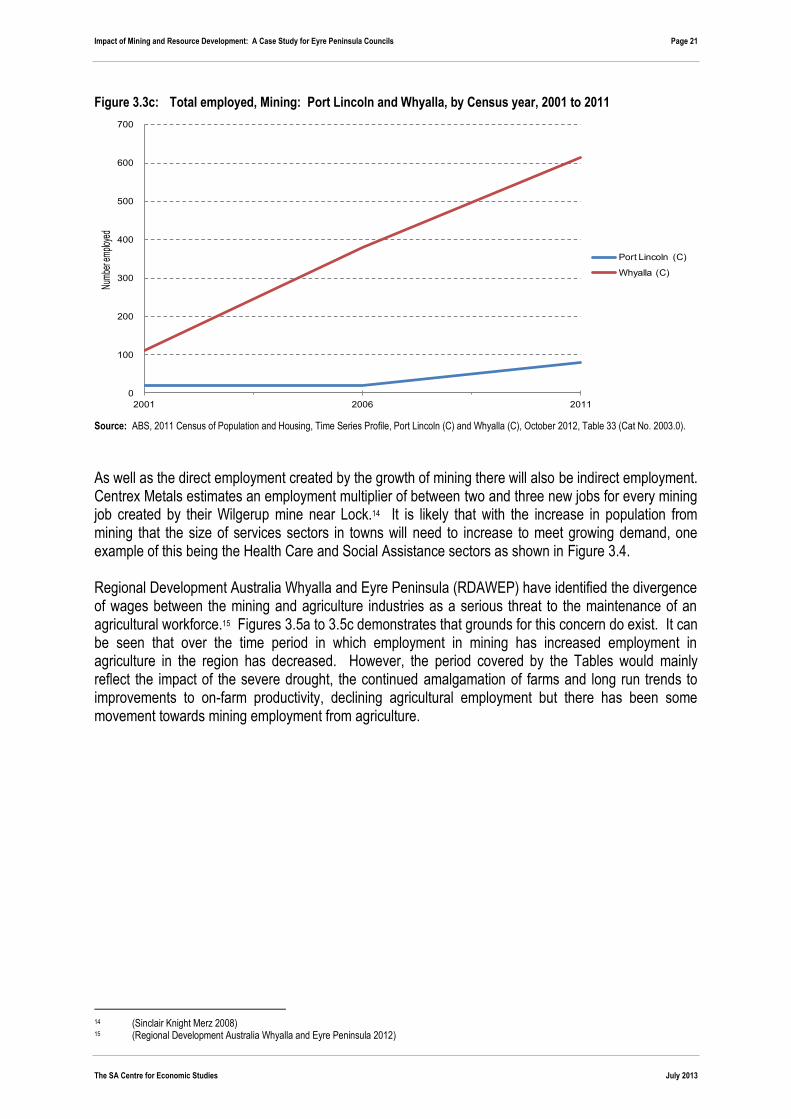
In the five years between 2006 and 2011 the majority of Eyre Peninsula councils experienced an increase in levels of employment in the mining industry with the exception being Cleve District Council.13 Figures 3.3a to 3.3c illustrate the growth in mining in each council district separately. Whyalla experienced the largest increase in mining employment in the region over the preceding decade with Ceduna (due to Iluka) and Franklin Harbour due to the Iron Duke mine also experiencing significant employment growth. The increase in mining employment in Whyalla is as a result of the development of the Iron Chieftain mine and the expansion of the Middleback Range project. These results are indicative that a similar expansion is likely to be experienced in years to come in other communities as a result of planned and developing mines such as the Menninie Dam and Wilcherry Hill projects which are both near the town of Kimba and the Iron Road Warramboo mine site. These community expansions will of course be dependent on the size of operations. Whilst these population expansions are likely to result in more revenue for councils they will also result in the need for more services provision.
12 The ABS Cat 6291.0.55.003, Labour Force Australia, Detailed Quarterly provides estimates of labour force by industry and state based on
population data from the 2006 census. 13 The ABS Cat 2003.0 provides time series profiles for each Local Government area compiled from data from the previous three censuses. These
are accessible through the ABS’s Census page.
0.0
2.0
4.0
6.0
8.0
10.0
12.0
14.0
16.0
Feb-
1994
Oct
-199
4
Jun-
1995
Feb-
1996
Oct
-199
6
Jun-
1997
Feb-
1998
Oct
-199
8
Jun-
1999
Feb-
2000
Oct
-200
0
Jun-
2001
Feb-
2002
Oct
-200
2
Jun-
2003
Feb-
2004
Oct
-200
4
Jun-
2005
Feb-
2006
Oct
-200
6
Jun-
2007
Feb-
2008
Oct
-200
8
Jun-
2009
Feb-
2010
Oct
-201
0
Jun-
2011
Feb-
2012
Oct
-201
2
Pers
ons
'000
Page 20 Impact of Mining and Resource Development: A Case Study for Eyre Peninsula Councils
July 2013 The SA Centre for Economic Studies
Figure 3.3a: Total employed, Mining: Elliston, Franklin Harbor, Kimba and Wudinna, by Census year, 2001 to 2011
Source: ABS, 2011 Census of Population and Housing, Time Series Profile, Ceduna (DC), Cleve (DC), Elliston (DC), Franklin Harbour (DC), Kimba (DC),
Lower Eyre Peninsula (DC), Port Lincoln (C), Streaky Bay (DC), Tumby Bay (DC), Whyalla (C), Wudinna (DC), October 2012, Table 33 (Cat No. 2003.0).
Figure 3.3b: Total employed, Mining: Ceduna, Cleve, Lower Eyre Peninsula, Streaky Bay and Tumby Bay, by
Census year, 2001 to 2011
Source: ABS, 2011 Census of Population and Housing, Time Series Profile, Ceduna (DC), Cleve (DC), Elliston (DC), Franklin Harbour (DC), Kimba (DC),
Lower Eyre Peninsula (DC), Port Lincoln (C), Streaky Bay (DC), Tumby Bay (DC), Whyalla (C), Wudinna (DC), October 2012, Table 33 (Cat No. 2003.0).
0
10
20
30
40
50
60
70
80
90
2001 2006 2011
Num
ber E
mpl
oyed
Wudinna (DC)
Elliston (DC)
Kimba (DC)
Cleve (DC)
Franklin Harbour (DC)
0
10
20
30
40
50
60
2001 2006 2011
Num
ber E
mplo
yed
Tumby Bay (DC)
Streaky Bay (DC)
Lower Eyre Peninsula (DC)
Ceduna (DC)
Impact of Mining and Resource Development: A Case Study for Eyre Peninsula Councils Page 21
The SA Centre for Economic Studies July 2013
Figure 3.3c: Total employed, Mining: Port Lincoln and Whyalla, by Census year, 2001 to 2011
Source: ABS, 2011 Census of Population and Housing, Time Series Profile, Port Lincoln (C) and Whyalla (C), October 2012, Table 33 (Cat No. 2003.0).
As well as the direct employment created by the growth of mining there will also be indirect employment. Centrex Metals estimates an employment multiplier of between two and three new jobs for every mining job created by their Wilgerup mine near Lock.14 It is likely that with the increase in population from mining that the size of services sectors in towns will need to increase to meet growing demand, one example of this being the Health Care and Social Assistance sectors as shown in Figure 3.4. Regional Development Australia Whyalla and Eyre Peninsula (RDAWEP) have identified the divergence of wages between the mining and agriculture industries as a serious threat to the maintenance of an agricultural workforce.15 Figures 3.5a to 3.5c demonstrates that grounds for this concern do exist. It can be seen that over the time period in which employment in mining has increased employment in agriculture in the region has decreased. However, the period covered by the Tables would mainly reflect the impact of the severe drought, the continued amalgamation of farms and long run trends to improvements to on-farm productivity, declining agricultural employment but there has been some movement towards mining employment from agriculture.
14 (Sinclair Knight Merz 2008) 15 (Regional Development Australia Whyalla and Eyre Peninsula 2012)
0
100
200
300
400
500
600
700
2001 2006 2011
Num
ber e
mplo
yed
Port Lincoln (C)
Whyalla (C)

Page 22 Impact of Mining and Resource Development: A Case Study for Eyre Peninsula Councils
July 2013 The SA Centre for Economic Studies
Figure 3.4a: Total employed, Health Care and Social Assistance: Elliston, Franklin Harbor, Kimba and Wudinna, by Census year, 2001 to 2011
Source: ABS, 2011 Census of Population and Housing, Time Series Profile, Ceduna (DC), Cleve (DC), Elliston (DC), Franklin Harbour (DC), Kimba (DC),
Lower Eyre Peninsula (DC), Port Lincoln (C), Streaky Bay (DC), Tumby Bay (DC), Whyalla (C), Wudinna (DC), October 2012, Table 33 (Cat No. 2003.0).
Figure 3.4b: Total employed, Health Care and Social Assistance: Ceduna, Cleve, Lower Eyre Peninsula,
Streaky Bay and Tumby Bay, by Census year, 2001 to 2011
Source: ABS, 2011 Census of Population and Housing, Time Series Profile, Ceduna (DC), Cleve (DC), Elliston (DC), Franklin Harbour (DC), Kimba (DC),
Lower Eyre Peninsula (DC), Port Lincoln (C), Streaky Bay (DC), Tumby Bay (DC), Whyalla (C), Wudinna (DC), October 2012, Table 33 (Cat No. 2003.0).
30
40
50
60
70
80
90
100
2001 2006 2011
Num
ber e
mplo
yed Wudinna (DC)
Elliston (DC)
Kimba (DC)
Cleve (DC)
Franklin Harbour (DC)
0
50
100
150
200
250
300
2001 2006 2011
Num
ber E
mplo
yed
Tumby Bay (DC)
Streaky Bay (DC)
Lower Eyre Peninsula (DC)
Ceduna (DC)

Impact of Mining and Resource Development: A Case Study for Eyre Peninsula Councils Page 23
The SA Centre for Economic Studies July 2013
Figure 3.4c: Total employed, Health Care and Social Assistance: Port Lincoln and Whyalla, by Census year, 2001 to 2011
Source: ABS, 2011 Census of Population and Housing, Time Series Profile, Port Lincoln (C) and Whyalla (C), October 2012, Table 33 (Cat No. 2003.0).
Figure 3.5a: Total employed, Agriculture, Forestry and Fishing: Elliston, Franklin Harbor, Kimba and
Wudinna, by Census year, 2001 to 2011
Source: ABS, 2011 Census of Population and Housing, Time Series Profile, Ceduna (DC), Cleve (DC), Elliston (DC), Franklin Harbour (DC), Kimba (DC),
Lower Eyre Peninsula (DC), Port Lincoln (C), Streaky Bay (DC), Tumby Bay (DC), Whyalla (C), Wudinna (DC), October 2012, Table 33 (Cat No. 2003.0).
400
500
600
700
800
900
1,000
1,100
1,200
2001 2006 2011
Num
bere
mpl
oyed
Port Lincoln (C)
Whyalla (C)
100
150
200
250
300
350
400
450
500
2001 2006 2011
Num
ber e
mpl
oyed Wudinna (DC)
Elliston (DC)
Kimba (DC)
Cleve (DC)
Franklin Harbour (DC)

Page 24 Impact of Mining and Resource Development: A Case Study for Eyre Peninsula Councils
July 2013 The SA Centre for Economic Studies
Figure 3.5b: Total employed, Agriculture, Forestry and Fishing: Ceduna, Cleve, Lower Eyre Peninsula, Streaky Bay and Tumby Bay, by Census year, 2001 to 2011
Source: ABS, 2011 Census of Population and Housing, Time Series Profile, Ceduna (DC), Cleve (DC), Elliston (DC), Franklin Harbour (DC), Kimba (DC),
Lower Eyre Peninsula (DC), Port Lincoln (C), Streaky Bay (DC), Tumby Bay (DC), Whyalla (C), Wudinna (DC), October 2012, Table 33 (Cat No. 2003.0).
Figure 3.5c: Total employed, Agriculture, Forestry and Fishing: Port Lincoln and Whyalla, by Census year,
2001 to 2011
Source: ABS, 2011 Census of Population and Housing, Time Series Profile, Port Lincoln (C) and Whyalla (C), October 2012, Table 33 (Cat No. 2003.0).
200
250
300
350
400
450
500
550
600
650
2001 2006 2011
Num
ber e
mpl
oyed
Tumby Bay (DC)
Streaky Bay (DC)
Lower Eyre Peninsula (DC)
Ceduna (DC)
500
550
600
650
700
750
800
850
2001 2006 2011
Num
ber e
mplo
yed
Whyalla (C)
Port Lincoln (C)

Impact of Mining and Resource Development: A Case Study for Eyre Peninsula Councils Page 25
The SA Centre for Economic Studies July 2013
3.3 Post-school qualifications
The levels of post-school education vary greatly between council areas. Port Lincoln and Whyalla council areas have higher levels of post-school education than other councils in the Eyre Peninsula which in part reflects the professional occupational profile afforded in the larger centres, construction activity which is dependent on trade qualifications and government services and administrations. Figures 3.6a to 3.6c show post-school qualifications held in the region by percentages. There are no major differences between the nine smaller council areas shown in Figure 3.6a. Figure 3.6a: Post-Secondary Education by Council Area: Ceduna, Cleve, Lower Eyre Peninsula, Streaky Bay,
Tumby Bay Elliston, Franklin Harbor, Kimba and Wudinna
Source: ABS Census Tablebuilder.
Figure 3.6b: Post-Secondary Education by Council Area: Port Lincoln and Whyalla
Source: ABS Census Tablebuilder.
0
100
200
300
400
500
600
700
800
Advanced Diploma and AssociateDegree Level
Diploma Level
Certificate III & IV Level
Certificate I & II Level
University Level Education
Pers
ons
0
500
1,000
1,500
2,000
2,500
3,000
3,500
4,000
Port Lincoln (C) Whyalla (C)
Pers
ons
Advanced Diploma and Associate
Degree Level
Diploma Level
Certificate III & IV Level
Certificate I & II Level
University Level Education

Page 26 Impact of Mining and Resource Development: A Case Study for Eyre Peninsula Councils
July 2013 The SA Centre for Economic Studies
3.4 Age distribution
Age distribution for the larger councils in the Eyre Peninsula area - Whyalla and Port Lincoln – follow the same pattern as the state overall. The smaller districts however have a more even distribution across ages. Within the Eyre and Western region the average age of the population has increased over time from an average age of 38 in 2001 to 41 years (2006) and 43 years in 2011 relative to South Australia of 37, 38 and 39 in each of these three years. Figures 3.7a and 3.7b compare age distributions for councils with that of the State. The smaller councils are grouped together and Whyalla and Port Lincoln are grouped together (Figure 3.7b). In order to make a reasonable comparison the percentages of population have been used. From the tables it can be seen that smaller council areas on the Eyre Peninsula have a different age structure to that of the State. Children make up a higher proportion of the population in the smaller councils but then from 15 through to age 39 both for males and females there is an outflow most noticeable in the 20-24 age range. To the extent this might be moderate through employment in the mining industry overtime is an unknown. The council areas then have higher proportions of middle-aged people. These facts are indicative of young adults moving out of the area, some returning when they are middle-aged and ageing in place. The age distributions in Port Lincoln and Whyalla are different to other parts of the Eyre Peninsula. Children still make up a higher proportion than that of the State and those aged 15-19 make up higher proportion than that of the State. Men aged 20-34 make up a lower proportion but for women of this age the distribution is more random. Overall, the demographic profile suggest that young people are less likely to move out of the regional cities. Figure 3.7a: Population Percentages by Council Area: Ceduna, Cleve, Elliston, Franklin Harbour, Kimba,
Lower Eyre Peninsula, Streaky Bay, Tumby Bay and Wudinna
Source: ABS 2011 Census of Population and Housing.
25 20 15 10 5 0 5 10 15 20 25
0-14 Years
15-19 years
20-24 years
25-29 years
30-34 years
35-39 years
40-44 years
45-49 years
50-54 years
55-59 years
60-64 years
65-69 years
70-74 years
75-79 years
80-84 years
85-89 years
90-94 years
95-99 years
100 years and over
All Females Eyre Peninsula
All Females SA
All Males Eyre Peninsula
All Males SA
Percentage of Population FEMALES
Per
sons
MALES

Impact of Mining and Resource Development: A Case Study for Eyre Peninsula Councils Page 27
The SA Centre for Economic Studies July 2013
Figure 3.7b: Population Percentages by Council Area: Port Lincoln and Whyalla combined compared to South Australia
Source: ABS 2011 Census of Population and Housing.
3.5 Council finances
Table 3.1 shows the total rates revenue received by Councils in 2010/11 classified by type of customer i.e., residential, commercial, industrial, rural and other. Residential and rural rates are the primary source of revenue for councils representing 85 per cent of total revenue. LGAs of Kimba, Wudinna and Franklin Harbour derive a relatively small income from residential rates; instead they derive a greater share of income from rural properties. These three council areas are expected to experience an increase in population in response to new mines going ahead in the region which will contribute to residential rates revenue but also increase the demands on councils. It is estimated that the existing housing stock in both Kimba and Wudinna16 will not be sufficient to handle population increase even though both regions have been in long term population decline. Once existing housing stock has been filled then construction of new houses along with physical infrastructure such as roads, footpaths etc. will be required. High population growth areas such as Streaky Bay and other beach-side councils have a more “even rate base” from the growth in residential population, including for retirement, and a rural rate base.
16 SACES was informed that there were currently only 10 vacant houses in Wudinna.
25 20 15 10 5 0 5 10 15 20 25
0-14 Years
15-19 years
20-24 years
25-29 years
30-34 years
35-39 years
40-44 years
45-49 years
50-54 years
55-59 years
60-64 years
65-69 years
70-74 years
75-79 years
80-84 years
85-89 years
90-94 years
95-99 years
100 years and over
All Females Port Lincoln and Whyalla
All Females SA
All Males Port Lincoln and Whyalla
All Males SA
Percentage of PopulationFEMALESMALES

Page 28 Impact of Mining and Resource Development: A Case Study for Eyre Peninsula Councils
July 2013 The SA Centre for Economic Studies
Table 3.1: Rates revenue by Local Government area 2010/11
LGA Name Total residential
rates 2010 ($) Total Commercial
Rates 2010 ($) Total Industrial Rates 2010 ($)
Total Rural Rates 2010 ($)
Total Other Rates 2010 ($) Total ($)
Tumby Bay 903,000 67,000 24,000 1,385,000 0 2,379,000
Wudinna 198,000 60,000 6,000 832,000 14,000 1,110,000
Elliston 528,000 70,000 8,000 749,000 161,000 1,516,000
Streaky Bay 1,003,000 111,000 125,000 821,000 2,000 2,062,000
Kimba 316,000 33,000 0 716,000 0 1,065,000
Cleve 454,000 55,000 88,000 1,202,000 0 1,799,000
Franklin Harbour 166,000 52,000 0 592,000 85,000 895,000
Lower Eyre Peninsula 1,739,000 0 0 1,747,000 0 3,486,000
Ceduna 1,883,000 0 211,000 710,000 35,000 2,839,000
Eyre Peninsula excl. Port Lincoln and Whyalla 7,190,000 448,000 462,000 8,754,000 297,000 17,151,000
Port Lincoln 5,333,000 1,098,000 293,000 73,000 483,000 7,280,000
Whyalla 9,789,000 1,385,000 918,000 106,000 105,000 12,303,000
Eyre Peninsula incl. Port Lincoln and Whyalla 22,312,000 2,931,000 1,673,000 8,933,000 885,000 36,734,000
Source: Local Grants Commission of South Australia.

Impact of Mining and Resource Development: A Case Study for Eyre Peninsula Councils Page 29
The SA Centre for Economic Studies July 2013
3.6 Number of rateable properties
Table 3.2 illustrates the rural nature of much of Eyre Peninsula unlike mining areas in other parts of the State. One implication for the mining industry is the potential for land use conflict as some mining infrastructure, such as roads and pipelines, may need to pass through private farms. This requires farmers and mining companies to consult and cooperate together so as to allow mining companies to transport their mined ore to ports on or adjacent to private farmland, with minimal impact on farm operations.
3.7 Student enrolment in Eyre Peninsula schools
Table 3.3 presents the changes in enrolments in public schools on the Eyre Peninsula over the five years to 2011. While many of the schools on the Eyre Peninsula have experienced a decrease in enrolment numbers the picture is more mixed than this with some schools that were expected to experience a stronger decline in enrolments, in fact have strengthened enrolments or slowed the decline (e.g., Cowell, Cummings, Kimba)..
3.8 Gross Regional Product, unemployment and the labour market
Table 3.4 shows estimates of Gross Regional Product by local government area, labour force indicators, the number of businesses and per capita calculations. Of particular importance and relevance to this study, when considering where a mining workforce will emanate from, is the low level of unemployment in all the smaller townships. Only Ceduna, Whyalla and Port Lincoln have at or above the State average unemployment rate, including higher Indigenous populations as well. So there is, by implication, a requirement to support school students and school leavers in the direction and knowledge of opportunities in the mining sector, to implement skill based (foundation and pre-employment) training programs that are capable of achieving high commencement and completion rates for Indigenous trainees and others and thirdly, the existing labour force will need to be supplemented by inward migration. In the last of these issues – attracting and retaining skilled and other necessary workers, and retaining workers and families throughout and beyond the life of a mine site – individual councils and mining companies share a common goal. Working collaboratively to support mine site development, minimising costs and maximising productivity and at the same time providing a high quality of life, low cost housing and social and community services will provide substantial benefits to the region.

Page 30 Impact of Mining and Resource Development: A Case Study for Eyre Peninsula Councils
July 2013 The SA Centre for Economic Studies
Table 3.2: Property type by Local Government Area 2010/11
LGA Name Residential properties
Commercial properties Industrial properties Rural properties Other properties Total
Tumby Bay 1,062 70 3 713 128 1,976
Wudinna 357 67 2 494 46 966
Elliston 459 53 2 427 46 987
Streaky Bay 857 79 5 649 63 1,653
Kimba 325 55 0 411 23 814
Cleve 632 82 1 551 36 1,302
Franklin Harbour 588 34 2 295 49 968
Lower Eyre Peninsula 1,692 93 6 929 85 2,805
Ceduna 1,235 143 7 421 85 1,891
Eyre Peninsula excl. Port Lincoln and Whyalla 7,207 676 28 4,890 561 13,362
Port Lincoln 6,212 733 58 34 607 7,644
Whyalla 10,555 608 37 42 221 11,463
Eyre Peninsula incl. Port Lincoln and Whyalla 23,974 2,017 123 4,966 1,389 32,469
Source: Local Grants Commission of South Australia.

Impact of Mining and Resource Development: A Case Study for Eyre Peninsula Councils Page 31
The SA Centre for Economic Studies July 2013
Table 3.3: Trends in Enrolments: Public Schools
SCHOOL AND ENROLMENT 2006 2007 2008 2009 2010 2011 Percentage change
JUNIOR PRIMARY SCHOOLS
Nicolson Avenue Junior Primary School 252 271 239 247 260 231 -8.3
Port Lincoln Junior Primary School 343 318.2 335 322.5 294 322 -6.1
PRIMARY SCHOOLS
Fisk Street Primary School 181 185 169 166 145 106 -41.4
Hincks Avenue Primary School 177 181 181 200 177 187 5.7
Karkoo Primary School* 18 21 20 15 14 0 -100
Kirton Point Primary School 435 424 403 356 336 305 -29.9
Lake Wangary Primary School 98 111 100 97 98 94 -4.1
Lincoln Gardens Primary School 90 100 96 89 87 75 -16.67
Long Street Primary School 268 264 298 298 302 315 17.5
Memorial Oval Primary School 245 238 219 214 224 214 -12.7
Nicolson Avenue Primary School 365 383 400 383 378 388 6.3
Penong Primary School 23 26 28 33 31 25 8.7
Poonindie Community Learning Centre 67 67 56 57.8 61 58 -13.4
Port Kenny Primary School 15.4 15 14 16 18 22 42.9
Port Lincoln Primary School 598 580 544 496 463 490 -18.1
Port Neill Primary School 23 20.8 14 6 10 11 -52.2
Ungarra Primary School 35 29 25 30 31 31 -11.4
Wharminda Primary School* 20 16 15 0 0 0 -100
Whyalla Stuart R-7 Campus 112 110 101 94 100 125 11.6
Whyalla Town Primary School 267 276 271 263 262 288 7.9
AREA SCHOOLS
Ceduna Area School 452.2 476.4 481.9 521.7 533 558.9 23.6
Cleve Area School 352.3 347.4 324.2 326.7 326 284 -19.4
Cowell Area School 184.2 180.6 179.9 171.4 177 178 -3.4
Cummins Area School 398.8 375.9 385.4 378.4 383 394.9 -1
Elliston Area School 75 69.3 77.4 68.8 74 62.5 -16.7
Karcultaby Area School 89.6 84.1 72.7 61.2 68 68.4 -23.7
Kimba Area School 184.4 182.5 170.1 169.4 172 168.7 -8.5
Lock Area School 107.1 95 97 90.8 88 77.3 -27.8
Miltaburra Area School 79.8 77 77.5 68.9 71 58.6 -26.6
Streaky Bay Area School 275.6 270.6 266.5 258.3 263 256.1 -7.1
Tumby Bay Area School 243.8 264.2 280.3 278.1 298 288.9 18.5
Wudinna Area School 174.5 173 170.3 173.4 185 168 -3.7
SECONDARY SCHOOLS
Edward John Eyre High School 369.2 334 348 380.6 335 334 -9.5
Port Lincoln High School 697.7 717.6 741.3 749.1 722 741.9 6.3
Stuart High School 285 292 298 297 313 299 4.9
Whyalla High School 370.9 366.2 347 343 312 346 -6.7
SPECIAL SCHOOLS PRIMARY/ SECONDARY
Port Lincoln Special School 21.8 22 26.2 24.6 26 27 23.9
Whyalla Special School 39 39 44 43 43 38.6 -1
ABORIGINAL/ANANGU SCHOOLS
Koonibba Aboriginal School 30 36 35 32 30 28 -6.7
Oak Valley Aboriginal School 33.5 24.5 26 14 27 19 -43.3
Yalata Anangu School 57 64 60 70 62 48 -15.8
TOTAL ENROLMENTS 8,153.8 8,127.3 8,036.7 7,903.7 7,799 7,732.8 -5.2
Note: * School now closed. Source: Regional Development Australia Whyalla and Eyre Peninsula 2012.

Page 32 Impact of Mining and Resource Development: A Case Study for Eyre Peninsula Councils
July 2013 The SA Centre for Economic Studies
Table 3.4: Estimates of Gross Regional Product (GRP) and Related Statistics
Local Government Area GRP Local
jobs
Worker productivity
(GRP/worker) Unemployment Businesses GRP per
business Population
$m No. $ % No. $ No.
Ceduna 195 1,919 101,593 8.6 327 596,330 3,662
Cleve 114 972 117,505 1.3 348 327,586 1,750
Elliston 84 612 137,346 3.5 233 360,515 1,055
Franklin Harbour 51 505 101,409 2.5 164 310,975 1,288
Kimba 85 642 133,238 0.7 240 354,166 1,100
Lower Eyre Peninsula 213 1,612 132,219 3.4 560 380,357 5,014
Streaky Bay 114 1,099 103,830 3.2 334 341,317 2,177
Tumby Bay 126 1,099 114,894 2.5 345 365,217 2,616
Wudinna 82 700 117,172 3.4 214 383,177 1,267
Port Lincoln 742 7,562 98,122 5.3 1,654 448,609 14,519
Whyalla 819 7,486 109,462 6.9 832 984,375 22,580
Total State 83,212 815,253 102,000 5.5 140,458 592,433 1,633,625
Source: Id and National Economics (2013).
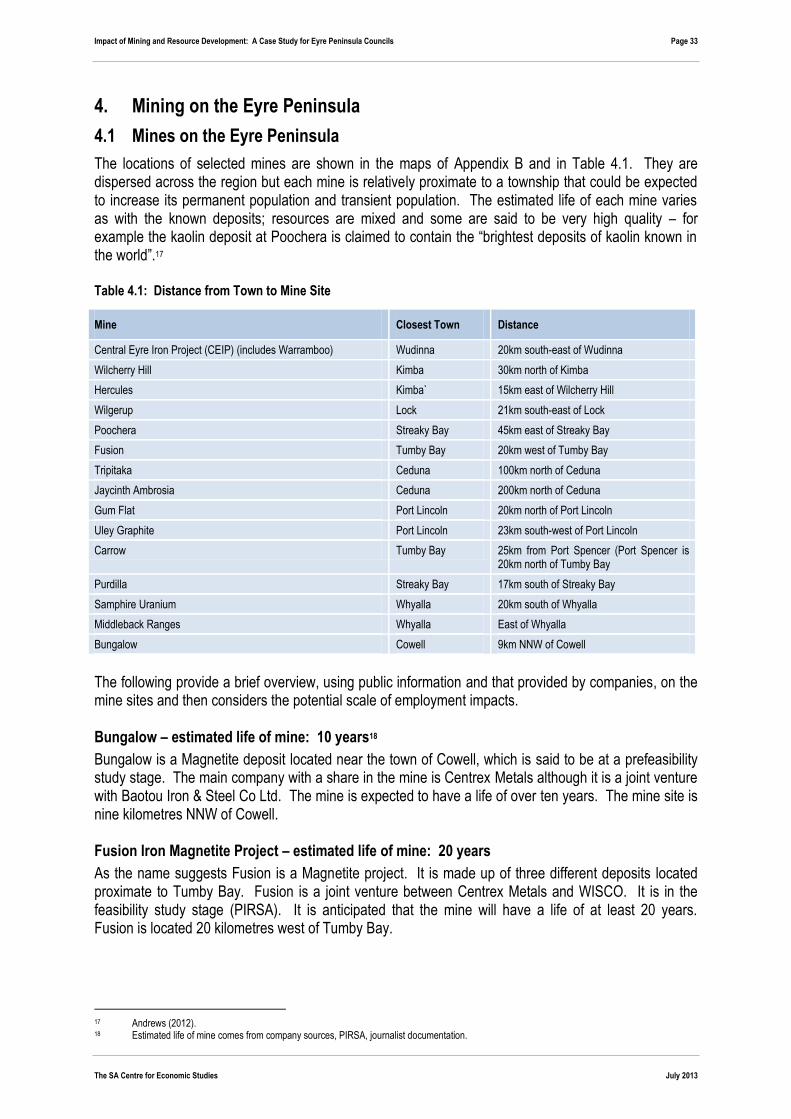
Impact of Mining and Resource Development: A Case Study for Eyre Peninsula Councils Page 33
The SA Centre for Economic Studies July 2013
4. Mining on the Eyre Peninsula
4.1 Mines on the Eyre Peninsula
The locations of selected mines are shown in the maps of Appendix B and in Table 4.1. They are dispersed across the region but each mine is relatively proximate to a township that could be expected to increase its permanent population and transient population. The estimated life of each mine varies as with the known deposits; resources are mixed and some are said to be very high quality – for example the kaolin deposit at Poochera is claimed to contain the “brightest deposits of kaolin known in the world”.17 Table 4.1: Distance from Town to Mine Site
Mine Closest Town Distance
Central Eyre Iron Project (CEIP) (includes Warramboo) Wudinna 20km south-east of Wudinna
Wilcherry Hill Kimba 30km north of Kimba
Hercules Kimba` 15km east of Wilcherry Hill
Wilgerup Lock 21km south-east of Lock
Poochera Streaky Bay 45km east of Streaky Bay
Fusion Tumby Bay 20km west of Tumby Bay
Tripitaka Ceduna 100km north of Ceduna
Jaycinth Ambrosia Ceduna 200km north of Ceduna
Gum Flat Port Lincoln 20km north of Port Lincoln
Uley Graphite Port Lincoln 23km south-west of Port Lincoln
Carrow Tumby Bay 25km from Port Spencer (Port Spencer is 20km north of Tumby Bay
Purdilla Streaky Bay 17km south of Streaky Bay
Samphire Uranium Whyalla 20km south of Whyalla
Middleback Ranges Whyalla East of Whyalla
Bungalow Cowell 9km NNW of Cowell
The following provide a brief overview, using public information and that provided by companies, on the mine sites and then considers the potential scale of employment impacts. Bungalow – estimated life of mine: 10 years18
Bungalow is a Magnetite deposit located near the town of Cowell, which is said to be at a prefeasibility study stage. The main company with a share in the mine is Centrex Metals although it is a joint venture with Baotou Iron & Steel Co Ltd. The mine is expected to have a life of over ten years. The mine site is nine kilometres NNW of Cowell. Fusion Iron Magnetite Project – estimated life of mine: 20 years
As the name suggests Fusion is a Magnetite project. It is made up of three different deposits located proximate to Tumby Bay. Fusion is a joint venture between Centrex Metals and WISCO. It is in the feasibility study stage (PIRSA). It is anticipated that the mine will have a life of at least 20 years. Fusion is located 20 kilometres west of Tumby Bay.
17 Andrews (2012). 18 Estimated life of mine comes from company sources, PIRSA, journalist documentation.

Page 34 Impact of Mining and Resource Development: A Case Study for Eyre Peninsula Councils
July 2013 The SA Centre for Economic Studies
Central Eyre Iron Project (CEIP) – estimated life of mine: 30+ years
CEIP is a venture by IronRoad. It is an iron ore project which is made up of several deposits located near the township of Warramboo. It is estimated that there will be approximately 1,600 jobs created during the construction stage of the project, with the number of jobs reducing to 500 during operation.19 The Central Eyre Iron Project is “billed as South Australia’s biggest resource project outside Olympic Dam.”20 This description of the project gives a visualisation of the size of the project. Iron Road proposes building a port at Cape Hardy to service the mine providing further employment to the area. It is expected that the mine will be operational by 2017 and is expected to earn over $2 billion per year. It is intended that 30 per cent of the workers will live in the town of Wudinna and other nearby townships such as Warramboo and Kyancutta. In order to reduce the impact of mining activity on the local agriculture industry Iron Road is considering ways in which mining rosters can be changed in order to accommodate harvesting time. Project planning assumes a mine life of 30 years. Wilgerup – estimated life of the mine: 6 years
Wilgerup is a hematite deposit located near Lock in Central Eyre Peninsula. Centrex Metals hoped to commence production in 2014, although there are now anticipated delays to the project until the port facility at Port Spencer is completed.21 It is estimated that in its six year life approximately 120-150 people will be employed each year, with a full time equivalent workforce of 78 jobs.22 There is a target to source at least 80 per cent of mine workers from the local areas.23 The mine site is 30 kilometres south east of Lock. Wilcherry Hill – estimated life of the mine: 5 years
Wilcherry Hill is a magnetite deposit 30km north of Kimba. It has been approved for commencement. The tenement is owned by Ironclad Mining who plan to start production in late 2013. They estimate that in the construction of the mine 100 people will be employed and that in the five year life of the mine between 100 and 160 people will be employed. Whilst acknowledging that some specialist skilled jobs will need to be filled by an external workforce, Ironclad has indicated its preference for workers to live locally. A company accommodation village has been proposed (local council indicated an 80 person housing village), the company has indicated a desire to advertise locally and train local workers and considered (it is reported by PIRSA) the use of cash bonus incentives to support workers who live outside the company accommodation. Other strategies include advertising for workers locally and providing training to workers. The company have expressed a preference for workers who will involve themselves in the community and are willing to subsidise various social club memberships for workers.24 Poochera – estimated life of the mine: 50+ years
Poochera mine is a Kaolin deposit near the town of Poochera; the next closest town is Streaky Bay. The deposit at Poochera has been trumpeted as the brightest Kaolin known in the world. It has been estimated that the mine could have a life of over fifty years25; with a life of this length it is certain to have an impact on the nearby towns. The deposit is owned by Minotaur Exploration. It is currently in the concept study stage. It is anticipated that production will commence in 2015. It is planned that employees at the mine will live locally, given the potential long life of the mine the logical location for employees is local.
19 Austin, N. (2013) 20 Andrews (2012b). 21 Regional Development Australia Whyalla and Eyre Peninsula (2012). 22 Sinclair Knight Merz (2008). 23 Ibid. 24 IronClad Mining Limited (2011). 25 Andrews (2012).

Impact of Mining and Resource Development: A Case Study for Eyre Peninsula Councils Page 35
The SA Centre for Economic Studies July 2013
Menninnie Dam – estimated life of the mine: unknown
Terramin Australia Ltd, via its wholly owned subsidiary Menninnie Metals Pty Ltd, owns five contiguous exploration licences (ELs) covering 2,471km2 in the Gawler Craton known as the Menninnie project. The project is located on the Eyre Peninsula in South Australia and the licences are Menninnie Dam (EL5039), Nonning (EL4813), Kolendo (EL4285), Taringa (EL4669) and Wipipippee Hill (EL 4865). During 2012, Menninnie Metals applied for additional exploration tenements in the area. The tenement applications are located to the west of, and are contiguous with, the Taringa tenement. Terramin has been exploring in the region since 2003, at times with Joint Venture partners. In October 2012, Menninnie Metals announced the execution of a Heads of Agreement with Musgrave Minerals Ltd (Musgrave) for the farm-in and joint venture of the Menninnie Dam EL. Musgrave commenced exploration drilling on the Menninnie Dam licence during the last quarter of 2012, with recent results showing silver, zinc and graphite intersected. Regional exploration (geochemical and geophysical work) is being carried out and further drilling is expected to be undertaken once this is completed to assist in optimising drillhole locations. All exploration activity on Menninnie Dam is currently being conducted by Musgrave. Paris – estimated life of the mine: 5-10 years
Paris is a deposit of Silver near Kimba. The rights to the deposit are currently owned by Investigator Resources who are still in the early stages of exploration and drilling. It is estimated that production at Paris will commence in 2016. Tripitaka – estimated life of the mine: 3 years
Tripitaka is a heavy minerals deposit, owned by Iluka Resources, North West of Ceduna. It is currently in the feasibility study stage.26 Purdilla – estimated life of the mine: 40 years
Purdilla is a Gypsum deposit near Streaky Bay which is currently owned by Minotaur Exploration. The Purdilla project is still in the early stages of development, it is only in the Resource Definition Stage. It is anticipated that production from the project will start in 2017. The life of this mine has also been estimated to be long, at least 40 years. Given the expected mine life Purdilla is another project which will have a long term impact on the surrounding towns. Hercules – estimated life of the mine: 10 years
Hercules is located near the Wilcherry Hill mine site and is owned by Ironclad Mining. Ironclad estimates that that they will commence production in 2018 with a workforce of approximately 150 people, although the mine site is still in the exploration phase. It is estimated that Hercules will have a life of ten years. This combined with the timeline for Wilcherry Hill means that the potential is there for Ironclad to be a major employer in Kimba for the next 15 years. As with Wicherry Hill Ironclad also has a preference for local employment at Hercules. It is possible that Hercules could transfer some of the employment lost when production ceases at Wilcherrry Hill as the timing and the size of the workforce fits. Sonoran – estimated life of the mine: 9+ years
Sonoran is also owned by Iluka. Iluka has commenced a pre-feasibility study for the potential development of the first of three near field deposits to the Jacinth-Ambrosia operation, Eucla Basin, South Australia. The Sonoran deposit is located approximately 10 kilometres from Jacinth-Ambrosia. The development would represent a brownfield extension, with existing wet concentration capacity and
26 PIRSA.

Page 36 Impact of Mining and Resource Development: A Case Study for Eyre Peninsula Councils
July 2013 The SA Centre for Economic Studies
transportation logistics at Jacinth-Ambrosia utilised. The other near field deposits are Typhoon and Atacama. These deposits have undergone initial scoping and present subsequent development options in the Eucla Basin. The three deposits are situated within the Yellabinna Nature Reserve. The evaluation of the Tripitaka deposit is also ongoing. Jaycinth Ambrosia – estimated life of the mine: 8+ years
Jaycinth Ambrosia is a mineral sands project in operation 200 kilometres from Ceduna.27 Due to the distance to the mine it operates on a fly-in/fly-out basis with 70 staff on site at any one time. There is however a large proportion of workers from the local area. Staff at the mine fly in from both Ceduna and Adelaide and there is an existing accommodation village for 160 persons.28 The workforce is 81 per cent local, from the immediate region, the Far West Coast and the Indigenous community. Gum Flat – estimate life of the mine: 20+ years
Gum Flat is an iron ore project owned by Lincoln Minerals 20 kilometres from Port Lincoln. Lincoln Minerals expects to start mining at the earliest in 2013 and that the mine will have a life of over 20 years.29 Samphire – estimated life of the mine: 10 years
Uranium SA through its wholly owned subsidiary Samphire Uranium Pty Ltd owns rights to the Samphire uranium deposit 20 kilometres south of Whyalla. It will employ between 40 and 60 people. UraniumSA has commenced a program of work to determine the optimal mining process for its 42M Ib U3 O8 Inferred Resources of mineralisation in the Samphire project, on the Eyre Peninsula in South Australia. The company has advised the Australian Stock Exchange that:
“The discovery of uranium mineralisation in granite basement at Blackbush – within the Samphire project – will add substantially to the inventory of uranium mineralisation in the deposit and has the potential to completely change the scope and economic significance of the project and the Company. To optimise the actual and potential value of these developments the Company is completely reviewing the development and exploration options for the Blackbush deposit. Elsewhere across the Samphire project there are numerous good quality exploration targets emerging which the Company is confident will likely deliver exciting discoveries.:
Uley Graphite Project – estimated life of the mine: 10 years
Uley is owned by Strategic Graphite.30 It is 23 kilometres south west of Port Lincoln. The Uley Project is a world-class graphite deposit situated in the Eyre Peninsula, South Australia. The Uley Graphite property consists of five contiguous tenements, including two retention licences (412.5 ha), two mining leases (66 ha combined) and one exploration licence (75 km2). Uley was discovered in the 1910s and has been worked intermittently since the late 1920s. When in operation, the plant was capable of producing up to 14,000 tonnes of graphite concentration per year. The mine has been idle since 1993. MEGA Graphite Inc believes that the property contains significant potential for the discovery of additional graphite resources and the re-establishment of a successful graphite mining operation. It is planned that mining operations at the site will commence in late 2013.
27 DMITRE (2012). 28 Iluka Resources (2013). 29 Ibid. 30 Ewendt (2013).

Impact of Mining and Resource Development: A Case Study for Eyre Peninsula Councils Page 37
The SA Centre for Economic Studies July 2013
Carrow – estimated life of mine: 10 years
Centrex Metals are currently completing a pre-feasibility study at the Carrow site. Carrow is another part of the larger Eyre Peninsula Joint Venture. It is located 25 kilometres from the proposed site of Port Spencer31 and six kilometres northwest of Port Neill. It is expected that the mine will have a life of over ten years. The Greenpatch deposit is ten kilometres out of Port Lincoln. It is another part of Centrex’s WISCO Joint Venture along with a number of other tenements that are still to be explored on the Eyre Peninsula.
4.2 Travel of residents for work
Table 4.2 illustrates the place of residence and journey to work data for each of the 11 councils; the Eyre Region is large and townships are dispersed, and this is well reflected in the journey to work data, where only population movements to work across council areas are significant between Port Lincoln Council and Lower Eyre Peninsula (DC) and perhaps also Tumby Bay, otherwise they are within the council region. This is an important finding. If residential patterns followed existing journey to work patterns then Wudinna, Kyancutta and Warramboo would be closest to the Iron Road mine site; population would continue to reside in Cowell and bus to the Iron Duke mine site, and the Bungalow mine site. Table 4.1 indicates the closest town to the proposed mine site with most within a 20 to 40 kilometre radius.
31 Centrex Metals.

Preparing for the impact of the resources industry on social infrastructure and council services in regional communities: a case study of the Eyre Peninsula Page 38
The SA Centre for Economic Studies July 2013
Table 4.2: Place of Residence and Journey to Work
LGA of Work Ceduna (DC)
Cleve (DC)
Elliston (DC)
Franklin Harbour (DC)
Kimba (DC)
Lower Eyre Peninsula (DC)
Port Lincoln (C)
Streaky Bay (DC)
Tumby Bay (DC)
Whyalla (C)
Wudinna (DC)
LGA (Place of Residence)
Ceduna (DC) 1407 0 0 0 0 0 7 17 0 0 0
Cleve (DC) 0 715 10 9 9 0 7 0 5 6 0
Elliston (DC) 0 4 407 0 0 6 3 7 0 0 9
Franklin Harbour (DC) 0 31 0 354 3 0 5 0 4 18 0
Kimba (DC) 0 5 0 6 485 0 0 0 0 5 6
Lower Eyre Peninsula (DC) 0 5 8 0 0 928 912 0 24 9 0
Port Lincoln (C) 3 15 12 4 0 201 5059 0 36 16 3
Streaky Bay (DC) 20 0 20 0 0 5 3 717 0 0 10
Tumby Bay (DC) 0 27 0 4 3 72 108 0 762 3 0
Whyalla (C) 0 0 0 0 4 0 4 0 0 6204 0
Wudinna (DC) 4 3 4 0 3 0 0 10 0 0 529
Note: Cells in this table have been randomly adjusted to avoid the release of confidential data. No reliance should be placed on small cells. Source: ABS 2011 using 2011 Census of Population and Housing using ABS Tablebuilder.
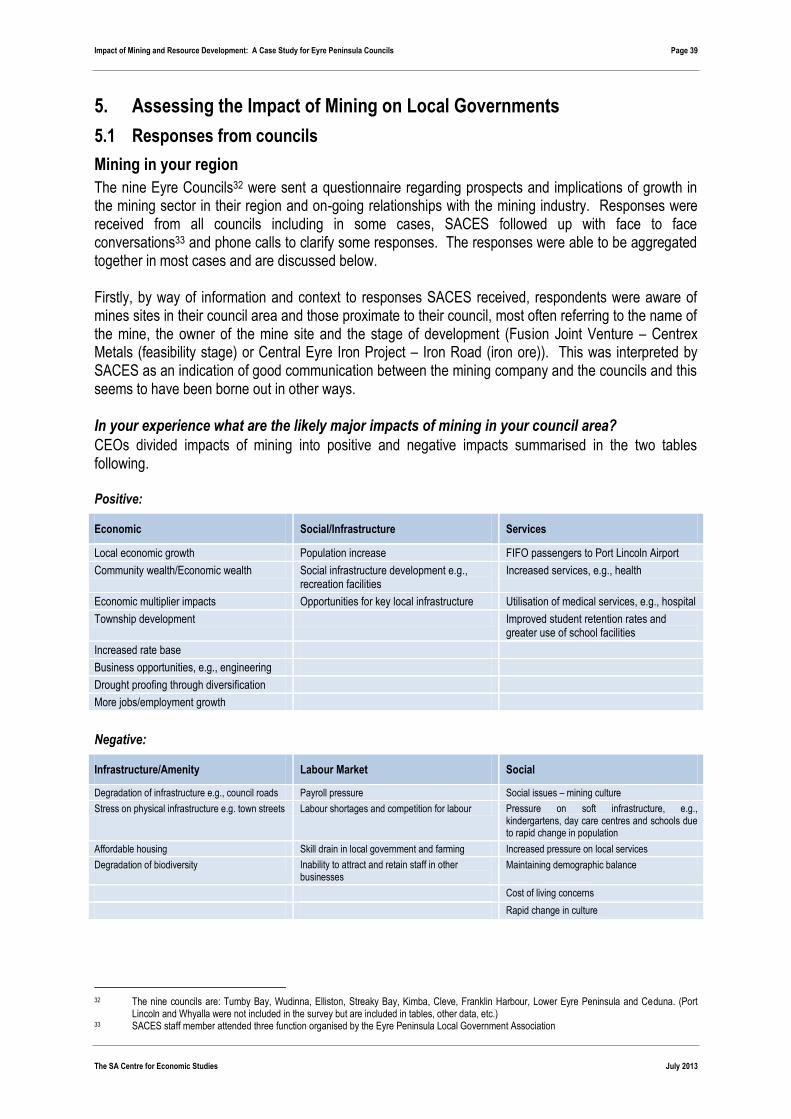
Impact of Mining and Resource Development: A Case Study for Eyre Peninsula Councils Page 39
The SA Centre for Economic Studies July 2013
5. Assessing the Impact of Mining on Local Governments
5.1 Responses from councils
Mining in your region
The nine Eyre Councils32 were sent a questionnaire regarding prospects and implications of growth in the mining sector in their region and on-going relationships with the mining industry. Responses were received from all councils including in some cases, SACES followed up with face to face conversations33 and phone calls to clarify some responses. The responses were able to be aggregated together in most cases and are discussed below. Firstly, by way of information and context to responses SACES received, respondents were aware of mines sites in their council area and those proximate to their council, most often referring to the name of the mine, the owner of the mine site and the stage of development (Fusion Joint Venture – Centrex Metals (feasibility stage) or Central Eyre Iron Project – Iron Road (iron ore)). This was interpreted by SACES as an indication of good communication between the mining company and the councils and this seems to have been borne out in other ways. In your experience what are the likely major impacts of mining in your council area?
CEOs divided impacts of mining into positive and negative impacts summarised in the two tables following. Positive:
Economic Social/Infrastructure Services
Local economic growth Population increase FIFO passengers to Port Lincoln Airport
Community wealth/Economic wealth Social infrastructure development e.g., recreation facilities
Increased services, e.g., health
Economic multiplier impacts Opportunities for key local infrastructure Utilisation of medical services, e.g., hospital
Township development Improved student retention rates and greater use of school facilities
Increased rate base
Business opportunities, e.g., engineering
Drought proofing through diversification
More jobs/employment growth
Negative:
Infrastructure/Amenity Labour Market Social
Degradation of infrastructure e.g., council roads Payroll pressure Social issues – mining culture
Stress on physical infrastructure e.g. town streets Labour shortages and competition for labour Pressure on soft infrastructure, e.g., kindergartens, day care centres and schools due to rapid change in population
Affordable housing Skill drain in local government and farming Increased pressure on local services
Degradation of biodiversity Inability to attract and retain staff in other businesses
Maintaining demographic balance
Cost of living concerns
Rapid change in culture
32 The nine councils are: Tumby Bay, Wudinna, Elliston, Streaky Bay, Kimba, Cleve, Franklin Harbour, Lower Eyre Peninsula and Ceduna. (Port
Lincoln and Whyalla were not included in the survey but are included in tables, other data, etc.) 33 SACES staff member attended three function organised by the Eyre Peninsula Local Government Association

Page 40 Impact of Mining and Resource Development: A Case Study for Eyre Peninsula Councils
July 2013 The SA Centre for Economic Studies
How have these impacts been managed at a local level to date?
Several local councils have set aside residential allotments within their towns to attract mine workers to their district including those councils which currently have no operating mines hoping that there will be “spill-over” effects from adjoining councils which will provide jobs for local residents. Some councils have begun negotiation with mining companies to enter into a contractual arrangement where all damage caused by mining is repaired by the mining company at their expense. Councils have also asked State Government to take over ownership of roads used to transport ore and mining products traditionally maintained by councils, placing the cost of maintenance and repair on the State Government. Other councils where mining projects at a ‘preliminary or scoping stage or seeking approval’ indicated they had not had the requirement to manage impacts to date. There are mining sites outside of your council boundary but they may impact on your council (e.g., pipeline, port, transport and storage). Do you anticipate impacts and what are they likely to be?
Councils indicate the following impacts from mining sites outside their council boundary, and again their responses indicate discussions with mining companies and consideration of the requirements of mining operators:
impacts on existing local transport infrastructure, such as road and rail used to ship finished products from the mine site to ports would result in an increase wear and tear and maintenance costs, including local access roads being used to access the highway network; it was reported that Centrex Metals intends to truck their ore through Cleve district from their Wilgerup mine;
impacts felt through the construction of new infrastructure; it was reported that Iron Road intends to construct a new rail-line through Cleve which will require council approval plus approval from any property owners whose land will be impacted. Councils indicated that access to their road transport network will only be granted if mining companies cover a suitable portion of the maintenance costs;
secondary impacts including catering for short-term growth in the population and managing labour shortages;
Kimba notes there will be impacts on town facilities once the 80 person village to house mining workers is complete;
Koppio iron ore development may potentially impact District Council of Lower Eyre Peninsula increasing the demand for residential land, although the majority of demand will be in Tumby Bay township;
increased residential development due to DIDO workers will result in increased demand for land, construction and community and education services;
possible business development around Cummins with the development of Fusion Mine, the distance from Koppio where the Fusion mine is located to Cummins is a similar distance of Koppio to Tumby Bay; and
there will be impact on townships from road and rail movements from the mine e.g., noise issues, increased traffic, and requirement for passing lanes.
What planning are you doing in anticipation of new mines going ahead in your council area?
Councils with limited or small scale mining development have undertaken only limited planning in response to the growth of mining. Councils recognise it is important to ensure land supply is sufficient for residential and industrial zoned land, and are awaiting further development of mining before planning is considered. One Council notes that sea port capacity will be the main inhibitor of future volume growth in mining.

Impact of Mining and Resource Development: A Case Study for Eyre Peninsula Councils Page 41
The SA Centre for Economic Studies July 2013
Councils considered it was difficult to plan for the impact of the mining industry because of the volatile nature of the industry citing the recent cancellation of BHP Billiton’s Olympic Dam expansion. More extensive planning has been undertaken by some councils including Tumby Bay through the release of the Tumby Bay Wastewater Management plan and the Tumby Bay structure plan. Franklin Harbour requires a waste water management scheme to assist in the freeing up of building allotments. A number of Councils have conducted stakeholder and community engagement meetings followed by regular focus groups via the mining company. In addition to the focus groups several Councils have established internal planning committees within Council reporting on a monthly basis to council staff. Although new mining operations are only at the scoping stage or approval stage, the District Council of Lower Eyre Peninsula is proposing to do a Master Plan over the township of Cummins and has commenced a Joint Structure Plan with the City of Port Lincoln to identify transport needs, possible residential expansion and commercial needs of Port Lincoln and surrounds. What assistance do you require to help cope with growth in the mining sector and an increase in drive-in-drive-out workers residing in local communities, e.g., town planners, etc?
Councils highlighted a number of avenues through which they could be assisted to cope with an increase in DIDO workers residing locally, including:
a share of royalties from mining to be transferred to Local Government to address mining related issues;
the need for increased staffing levels across a broad range of activities i.e., building, planning, community development, health, public relations and compliance/complaints;
assistance with the administrative burden of planning for infrastructure including sourcing funding to obtain expertise and support necessary to plan for growth in the mining sector and cope with future population growth;
assistance with Community Wastewater Management System (CWMS) capacity, stormwater management, shops etc.; and
social planning and impacts on local communities.
Relationship with mining sector
What information of mine plans has your council been provided with by mining companies (e.g., on-site, off-site, transport, storage, etc)?
Mining companies have engaged local councils keeping them well informed with general details regarding mine size and scale, through meetings with council staff and public consultations, briefings and presentations to relevant stakeholders. Minotaur has provided extensive details to Council regarding their Poochera mine and its production facility i.e., expected production, employment, shipping and transportation methods etc. Most mines are in the proposal stage and mining companies have promised to provide more specific and detailed information through 2013 as further details are known. Councils have been given some background information with regards to trucking of mined product from mine site to coastal ports while other councils indicate they have had open and honest preliminary discussions with mining companies. Councils noted that the Eyre Peninsula Mining Alliance had played a key role in liaison.

Page 42 Impact of Mining and Resource Development: A Case Study for Eyre Peninsula Councils
July 2013 The SA Centre for Economic Studies
How (if) has this information been fed back into council plans?
Given most mines are at the proposal stage apart from being discussed within council, it is too early for information to be fed back into Council plans. Councils note it is difficult to commit to a specific planning outcome until definitive information has been received from the mining company that indicates the mine will proceed and provides information on the likely impacts of the mines operations such as employment, mine life etc. However several Councils have incorporated mining issues into their Strategic Plans regarding issues such as: examining the potential for industrial expansion (zoning) in Cummins and some of the social requirements related to mining growth and have supported industry funding applications for Port of Thevenard upgrade (i.e., volume, loading and vessel capacity upgrade). Most Councils were in the process of incorporating preliminary information into the current structure and planning process. For example, a community wastewater management system has been identified as a requirement in Franklin Harbour due to the possible increase in population in Cowell and Council has begun planning for this. Do you anticipate any conflicts within the community or between sectors of industry as the mining sector increases its activities?
Most councils concede there will be conflict within the community, especially between rural and mining sectors, as some landholders (farmers) will be directly or indirectly affected by mining activity and don’t want mining occurring on “their patch”. Land owners would like to restrict freight movements during seeding and harvest time as this can cause damage to crops through the impact of mine dust on agricultural products. There is also the concern that underground water resources may be depleted or damaged through consumption by mines. Conflict reduction requires negotiation between mining companies and farmers to arrange transport routes and construct necessary rail infrastructure that will minimise the impact on farming operations. Councils also note that there are some sectors of the community that are antagonistic towards mining and will not support mining projects under any circumstances. Alternatively, several councils indicated they did not expect conflict principally because of the small scale of the mining project which was unlikely to place a strain on infrastructure and services. What do you identify as the potential benefits of growth in mining (hence economic activity) and how best can you capture and retain these benefits?
Councils identified a number of benefits most of which were economic in nature, including:
new employment opportunities for local communities, increase in disposable income;
increased population (at manageable rates);
retention of younger residents directly through the creation of new jobs;
enhancement of the social structure of the district as younger residents no longer need to move away for employment;
increased funding for Local Government;
attraction of younger families, increase in school numbers;
increased community wealth;
councils more sustainable due to the economies of scale generated by having more residents;
drought proof local communities, diversifying the economy, reduce reliant on agriculture and its seasonal nature;
opportunity for key infrastructure to be built in collaboration with mining companies;
Impact of Mining and Resource Development: A Case Study for Eyre Peninsula Councils Page 43
The SA Centre for Economic Studies July 2013
sourcing of accommodation under the mining exploration and development phases will lift property values in local towns;
increased infrastructure demands will provide greater utilisation of existing town facilities;
development and support for local engineering businesses, increased business opportunities for local residents;
opportunities for health and education sectors. Councils indicate that the best way to retain the benefits created by the mining industry is to achieve an increase in population that will use services provided. Are mining companies in your area contributing towards community development and social infrastructure? If so, in what way?
Several councils indicated they had received a small level of support through sporting club event sponsorship and sponsorship of community events by the local mining company. One Council indicated they have indirectly received benefits from mining companies through the receipt of funding for private works that have been used to upgrade various asset classes. At this point in time it was “early days” as mine sites were not yet developed. Are mining companies working with council to develop housing and accommodation policies that ensure the availability of housing for mine workers?
Mining companies have advised their intention to work alongside councils to provide housing and accommodation. Some preliminary discussions have been held with councils regarding the type of contribution mining companies will make involving a number of “what if scenarios” around potential mining development. Many councils indicated there had been no correspondence with mining companies on developing housing and accommodation for mine workers. Kimba Council notes their 80 person village has been constructed on Council land and will be leased.
About your council
What is your council’s capacity to absorb additional population if it follows from growth in the mining sector?
For those councils which have experienced population decline over the last 15 to 20 years such as Wudinna and Cleve there is spare capacity to absorb the numbers foreshadowed by the mining industry. Cleve can support a further 500 persons which is the population lost over the past 20 years. Elliston has capacity to absorb population growth in the town of Lock which has vacant/underutilised property as does Kimba. The District Council of Lower Eyre Peninsula identified the region as having regional capacity to absorb reasonable growth in population but further work to support this growth will be required. Streaky Bay has an ample supply of residential land and with the stagnation in the local real estate market there is an oversupply of properties for sale. Ceduna has significantly increased population capacity through new residential land subdivisions and an additional residential development is currently being progressed. But the availability of an adequate water supply will constrain this growth. Franklin Harbour will not have the capacity to support future population growth without a community wastewater management system.

Page 44 Impact of Mining and Resource Development: A Case Study for Eyre Peninsula Councils
July 2013 The SA Centre for Economic Studies
For councils experiencing high population growth such as Tumby Bay a substantial amount of land owned by the council is proposed to be rezoned residential and allotted for development. If mining growth were to accelerate over a short timeframe then providing adequate accommodation will be more difficult. Council resources will also be tested in terms of being able to provide adequate staffing levels to meet demands and the provision of soft infrastructure for the community. Does council have sufficient infrastructure to meet the needs of a growing population i.e. power, water, roads etc.? What are the priorities?
Overall, it was reported (at least in the short-term) that Councils have sufficient infrastructure to meet most of the needs of a growing population. However, Councils also indicate that power and water infrastructure is insufficient across the Eyre Peninsula in the long-term and requires augmentation to keep pace with expected long-term population growth. With respect to each Council:
road infrastructure in Tumby Bay is in good condition and will be maintained and upgraded with assistance from mining companies;
Tumby Bay indicated that power infrastructure is in urgent need of an upgrade;
District Council of Lower Eyre Peninsula noted that Council would need to upgrade strategic roads in the event of new mines opening in the region;
Wudinna indicated they can cope with population growth across some areas but will find it difficult to meet new population demands for health services, education and a new airport.
Franklin Harbour town roads and footpaths need improving while power and water supply is insufficient and requires a major upgrade.
Elliston most infrastructure is adequate except for power supply which needs upgrading. Water infrastructure may also be an issue depending on the numbers of new residents drawn to the town. Roads may also require additional upgrades and maintenance;
It was reported that Kimba has sufficient infrastructure to meet the needs of a growing population;
Streaky Bay has sufficient infrastructure but notes that the water requirements of Minotaur’s processing facility may present a challenge; and
Ceduna’s water supply for residential purposes (volume and quality) will be a significant limitation. Are expectations of Local Government increasing in terms of their role in providing a greater range of services to an expanding population? Is council finding it difficult to meet these expectations?
Most Councils indicated that community expectations have continued to grow and councils are finding it more difficult to remain compliant in a number of areas. Any rapid increase in population caused by growth of the mining industry presents a further challenge for councils in meeting and resourcing additional demand for services according to growing community expectations. Council can only provide what it can afford, although an increase in population will lead to higher rate revenue, community demand will always exceed councils ability to deliver. Three Councils indicated that expectations of Local Government had not increased and one these indicated that they had generally been able to manage the financial burden imposed by associated population growth. Are there any legislative barriers preventing local councils taking a more active role in planning for major resource projects?
Councils have limited say in planning for major resource projects. Councils “are relegated to the role of responding to developments.” Councils noted that the ever increasing burden of compliance is shifting staff focus and consuming council resources. Several Councils noted issues with regards to the State
Impact of Mining and Resource Development: A Case Study for Eyre Peninsula Councils Page 45
The SA Centre for Economic Studies July 2013
Government either taking too long to handle development planning for major resource projects within the region or State Government not providing enough infrastructure at a capacity and quality to cope with growth. Remaining Councils noted that there are no legislative barriers to a more active role in planning. What are the priorities for State Government to fulfil its role in assistance to local councils to meet the challenges of a rapidly expanding resources sector?
State Government should:
provide councils with a share of mining royalties;
assist with the upgrade of transport, power and water infrastructure;
assist with the development of residential facilities;
planning and construction of infrastructure corridors to cope with varying developments;
plan and fund the construction of new ports and the infrastructure required to access them;
assist by approving alterations to development plans;
take responsibility for the repair and maintenance of some council roads which were not designed for ore trucks;
provide water and power infrastructure;
review and consistently monitor the need for health and education services. State Government are perceived to be “hands-off” and hoping that mining companies will provide the funding necessary to support infrastructure development and service provision via specific need and good neighbour obligations.
Additional comments
“All the hype is great but our council can’t see much happening without the injection of some serious government funding to upgrade Eyre Peninsula’s power and water. The mining companies involved on Eyre Peninsula don’t have the capacity to do it all themselves”. “District Council of Elliston has a few mining proposals being explored but it is too early to provide further information”. “Residential subdivision and development has progressed on the basis of water supply self-sufficiency (no mains supply) however Council is concerned that responsibility will ultimately fall on Council to provide mains reticulated water. The current infrastructure does not have the capacity to meet this need and supply”.
5.2 Demand for infrastructure
Assessment of Existing Infrastructure
The Deloitte study (in progress) assessed the existing infrastructure profile of the Eyre and Western region – its condition, capacity and capability to meet current needs in support of the mining industry and came to the conclusion after a review of the “big 5 infrastructure” requirements of ports, rail, roads, power and water that
“the assessment demonstrates that existing infrastructure can adequately accommodate the mining output being produced by major mines in the Eyre and Western region. The bulk freight solutions available (and adopted by operators) coupled with the low output profile for the region placed the infrastructure in a strong position to meet current mining demand. While power and water have been

Page 46 Impact of Mining and Resource Development: A Case Study for Eyre Peninsula Councils
July 2013 The SA Centre for Economic Studies
identified as needing to be improved to support an expanded mining footprint, at this stage current demand requirements are being accommodated by”.34
The key deficiencies in existing infrastructure and those assessed as likely to be impediments to future development of the mining industry where four factors as summarised in Table 5.1 for two periods 2013-2017 and 2018-2022 as further mines reach production. Table 5.1: Key emerging mining infrastructure issues for the Eyre and Western region (2013-2022)
Issue 2013-2017 2018-2022
A Lack of suitable bulk commodities export port accessible by South Gawler mines
Lack of suitable bulk commodities export port accessible by South Gawler mines
B Inadequate electricity transmission links to South Gawler mines
Inadequate electricity transmission links to South Gawler and Central Eyre mines
C Lack of mine to port bulk transport links for Central and Southern Eyre mines
Lack of mine to port bulk transport links for Central and Southern Eyre mines
D No identified suitable source of water for South Gawler mines
No identified suitable source of water for South Gawler mines
Source: Deloitte (2013).
The provision of ports or improvements to rail, power, water could act as a catalyst for further exploitation in the region or bringing into production mining deposits that are uneconomic as a single mine, but are economic when considered as a group of mines. This is an example of principle 2 (referred to earlier) where infrastructure acts as a catalyst. Councils will need to cover the costs of local roads (including many that are unsealed), access to port facilities and social infrastructure. It has been indicated by councils that the electricity and water infrastructure on the Eyre Peninsula in general is already insufficient to handle requirements; this is evidenced by information presented in the Deloitte infrastructure report. The upgrading of this infrastructure is the responsibility of the companies providing the utilities services. These upgrades will need to take into account expected population increases as a result of mining. When these upgrades are carried out the benefits will be experienced by the whole community. The South Australian Department for Water in its 2011 Eyre Peninsula water plan has predicted that in the future desalinated seawater will become the main source of water on the Eyre Peninsula. The State government will not provide the water for mines as it is expected that mining companies source their own water. Therefore any desalination plants will have to be paid for by mining companies. The increase in population however will place strain on general water supplies. The Department for Water estimated that by 2050 the demand for water for private consumption on the Eyre Peninsula will increase by 2.2 GL. Given that excess water is expected to be supplemented into the Eyre Peninsula general supply this can be of benefit to the Eyre Peninsula region. Electricity infrastructure has been indicated by many councils as requiring upgrading. The planned electricity network upgrades for the Eyre Peninsula are detailed in the Deloitte Infrastructure report.
34 Ibid, p. 37.
Impact of Mining and Resource Development: A Case Study for Eyre Peninsula Councils Page 47
The SA Centre for Economic Studies July 2013
6. Methodology
In order to estimate the population impacts of mining development on the Eyre Peninsula research was first conducted into what companies are operating or exploring on the Eyre Peninsula. The first examination was of the Department for Manufacturing, Innovation, Trade, Resources and Energy (DMITRE) lists of approved and developing mines in South Australia. Based on this a list of mining companies operating on the Eyre Peninsula was formed. The websites of each of these companies was examined in order to ensure that all projects owned by companies on the Eyre Peninsula were covered in the research. In addition to this list the website of Archer Exploration was also examined due to their membership of the Eyre Peninsula Mining Alliance (EPMA). The list of companies surveyed then became Archer Exploration Ltd, Centrex Metals Ltd, Investigator Resources Ltd, Iron Road Ltd, Lincoln Minerals Ltd, Minotaur Exploration, Arrium, Terramin Australia, Iluka Resources, IronClad Mining and Samphire Uranium. The list of “modelled mines” is in Table 6.1. Where information was not available or not provided for projects their employment impacts were not able to be modelled. Table 6.2 shows the mines which are used to estimate employment impacts and their expected operational timelines. It also provides yearly employment estimates. The peak of mining employment on the Eyre Peninsula is expected to be in 2018. It is important to note that there is no guarantee all developing mines will proceed to the operational stage and that mining development is sensitive to global economic conditions and demand for raw materials. What follows are estimations of the impacts of mining should selected mines reach the operational stage. There are four employment scenarios modelled: a baseline scenario and three others. Each of these scenarios is explained in greater detail below.
Baseline
This models the employment in mines which were operating at the beginning of 2011, i.e., mines that started production prior to 2011. The year 2011 is used as a baseline year due to census data; employment impacts of mining developments which commenced after 2011 are not captured in the Census and therefore need to be modelled. In the baseline, modelling population growth from trend growth is also included. The mines included here are Jacinth-Ambrosia and the Middleback Ranges projects. The employment impacts of these mines would have been captured in the 2011 Census.
Scenario One
Scenario One models the impacts of mines which are determined to be most likely to enter into operation as well as the impacts in the Baseline scenario. This also includes mines which have commenced operations since 2011. The selection of mines most likely to commence operation is based on a number of factors. All mines which are approved but not yet built are included in this list, on the assumption that the company intends on progressing that project to operation. Also included in this list are mines determined by researchers to be highly likely based on the commodity35 or the capital expenditure on the mine to date. The other method for inclusion in this list is if a domestic company has a joint venture arrangement with an international partner. The ten mines included in Scenario One are:
35 Note the majority of Iron Ore mines have been included here.

Page 48 Impact of Mining and Resource Development: A Case Study for Eyre Peninsula Councils
July 2013 The SA Centre for Economic Studies
Table 6.1: Modelled mines
Mine Company Resource Time Closest town Distance
Central Eyre Iron Project (CEIP) (Includes Warramboo) (b)
Iron Road Magnetite 2018-2048 Wudinna 20 km SE of Wudinna
Wilcherry Hill(b) Iron Clad Mining Magnetite 2013-2018 Kimba 30 km north of Kimba
Hercules Iron Clad Mining Iron Ore 2018-2028 Kimba 15 km east of Wilcherry Hill
Wilgerup(b) Centrex Metals Hematite 2016-2026 Lock 30 km SE of Lock
Poochera(b) Minotaur Exploration Kaolin 2015-2115 Streaky Bay 45 km east of Streaky Bay
Fusion(b) Centrex Metals Magnetite 2016-2036 Tumby Bay 20 km west of Tumby Bay
Hematite Extension Project(b) Arrium Iron Ore Whyalla 60 km East of Whyalla
Jaycinth Ambrosia Iluka Heavy Mineral Sands 2009-2021 Penong, next is Ceduna 200 km north of Ceduna
Gum Flat(b) Lincoln Minerals Hematite and Magnetite 2014-2037(a) Port Lincoln 20 km north of Port Lincoln
Uley Graphite Strategic Energy Resources Graphite Port Lincoln 23 km SW of Port Lincoln
Menninnie Dam Terramin Australia Silver, Zinc, Graphite Kimba
Purdilla Minotaur Exploration Gypsum 2017-2057 Streaky Bay 17 km s of Streaky Bay
Samphire Uranium(b) Uranium SA Uranium Whyalla 20 km South of Whyalla
Middleback Ranges Arrium Iron ore Whyalla 60 km East of Whyalla
Bungalow(b) Centrex Metals Magnetite 2017-2027 Cowell 9 km North of Cowell
Iron Chieftain Arrium Iron ore Whyalla 60 km East of Whyalla
Paris Investigator Resources Silver 2016-2026 Kimba 70 km NW of Kimba
Sonoran Iluka Heavy Mineral Sands 2015-2020 Penong, next is Ceduna 200 km NW of Ceduna
Atacama Iluka Heavy Mineral Sands 2020-2023 Penong, next is Ceduna 200 km NW of Ceduna
Typhoon Iluka Heavy Mineral Sands 2017-2018 Penong, next is Ceduna 200 km NW of Ceduna
Note: (a) Phase 1 is expected to have a life of 3-5 years but Phase 2 will extend the life of the mine according to Australia's Paydirt June 2012 Phase 2 could be a 20 year project. (b) These projects have been listed as major developments in the South Australian Major Developments Directory. Source: Information gathered from survey returns and websites.

Impact of Mining and Resource Development: A Case Study for Eyre Peninsula Councils Page 49
The SA Centre for Economic Studies July 2013
Table 6.2: Modelled mines timeframes
2011 2012 2013 2014 2015 2016 2017 2018 2019 2020 2021 2022 2023 2024 2025 2026
Jacinth Ambrosia
Production began 2009
Middleback Ranges (a)
Continues
Wilcherry Hill
Iron Chieftan (a)
Production began 2010
Wilgerup
Finishes
Central Eyre Iron Project (Warramboo)
Continues
Bungalow
Continues
Fusion
Continues
Poochera
Continues
Hematite Extension Project (a)
Timeline unknown
Gum Flat (a)
Continues
Atacama
Uley (b) (a)
Timeline unknown
Paris
Finishes
Sonoran
Purdilla Gypsum Project
Continues
Hercules
Continues
Samphire
Menninnie Dam (c)
Timeline unknown
Typhoon
Minimal total employment (If all projects follow expected timeline)
790 790 950 950 990 1,715 2,360 3,060 2,960 2,995 2,960 2,820 2,820 2,725 2,690 2,690
Note: (a) Employment and commencement figures not provided or not available (b) Not sent a survey form because it was owned by a Canadian company (c) SACES has been advised that this it is too early to make any estimates for this project.
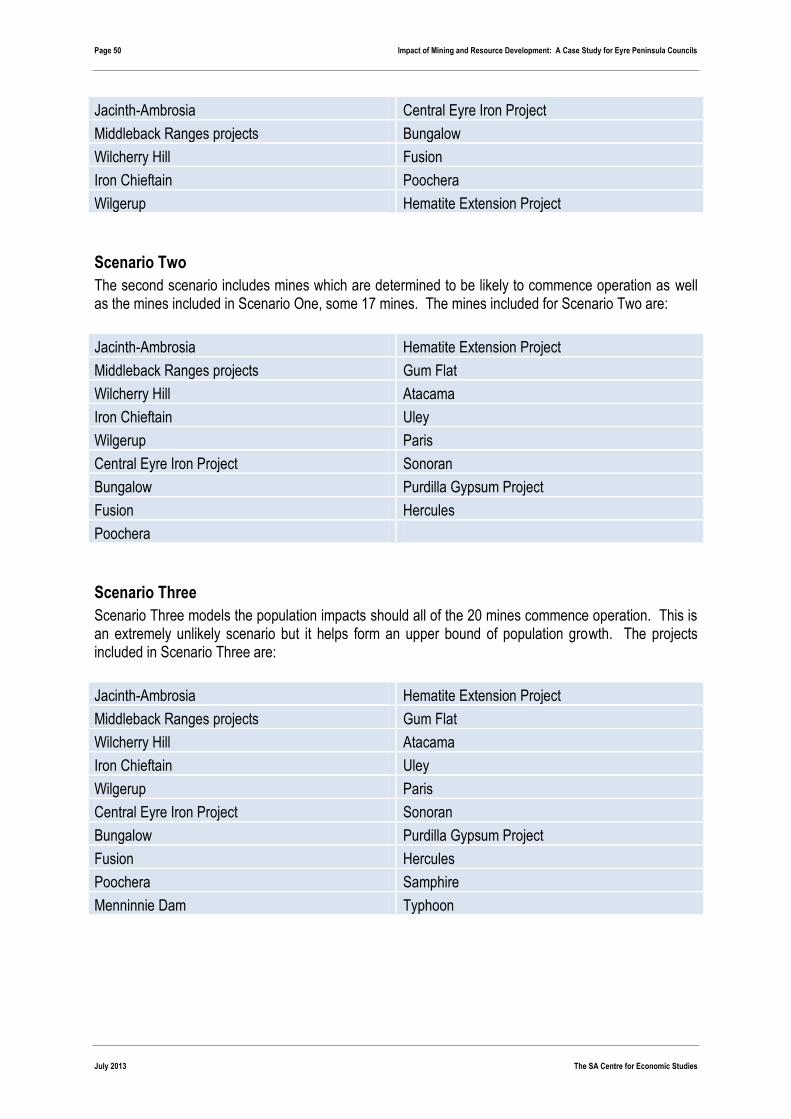
Page 50 Impact of Mining and Resource Development: A Case Study for Eyre Peninsula Councils
July 2013 The SA Centre for Economic Studies
Jacinth-Ambrosia Central Eyre Iron Project
Middleback Ranges projects Bungalow
Wilcherry Hill Fusion
Iron Chieftain Poochera
Wilgerup Hematite Extension Project
Scenario Two
The second scenario includes mines which are determined to be likely to commence operation as well as the mines included in Scenario One, some 17 mines. The mines included for Scenario Two are:
Jacinth-Ambrosia Hematite Extension Project
Middleback Ranges projects Gum Flat
Wilcherry Hill Atacama
Iron Chieftain Uley
Wilgerup Paris
Central Eyre Iron Project Sonoran
Bungalow Purdilla Gypsum Project
Fusion Hercules
Poochera
Scenario Three
Scenario Three models the population impacts should all of the 20 mines commence operation. This is an extremely unlikely scenario but it helps form an upper bound of population growth. The projects included in Scenario Three are:
Jacinth-Ambrosia Hematite Extension Project
Middleback Ranges projects Gum Flat
Wilcherry Hill Atacama
Iron Chieftain Uley
Wilgerup Paris
Central Eyre Iron Project Sonoran
Bungalow Purdilla Gypsum Project
Fusion Hercules
Poochera Samphire
Menninnie Dam Typhoon

Impact of Mining and Resource Development: A Case Study for Eyre Peninsula Councils Page 51
The SA Centre for Economic Studies July 2013
Missing Data
In total there were five projects for which employment data was not available. Where employment data was not available or not provided it is not possible to model the impacts of these mines. They are therefore excluded from the employment modelling. Excluded mines are:
Iron Chieftain Uley
Hematite Extension Project Menninnie Dam
Gum Flat
Who might be mine workers by demographic profile?
A mining population profile was also derived as an input into the modelling. Table 6.3 presents a comparison of the age distributions of Roxby Downs, as an example of a population profile in a mining location, and councils on the Eyre Peninsula (excluding Whyalla and Port Lincoln). The future population and workforce profile of mines on the Eyre Peninsula is more likely to be similar to that of Roxby Downs rather than mining centres in the Pilbara (Western Australia) or Bowen Basin (Queensland), as these latter mines sites have much higher rates of FIFO. An examination of the population profile of Roxby Downs provides an early indication of the potential change in demographics on the Eyre Peninsula should various mines proceed. In Roxby Downs, greater than 50 per cent of the population are aged between 20 and 44 years old. This compares with an older age profile on the Eyre Peninsula where only 30 per cent are within the same age range. An expansion of mining activity on the Eyre Peninsula will most likely result in a gradual change in the demographic profile, including a higher proportion of 20-44 year olds. The changing profile will incorporate younger families and additional school aged children. As such, social services such as access to child care, schools, medical clinics and health services and a wider array of recreational services will be required. Those in regional Eyre Peninsula would also anticipate (and welcome) net additions to the local tennis, cricket, football and netball teams. Table 6.3: Age Comparison: Roxby Downs and nine Eyre Peninsula Council Areas
Population in Roxby Downs Population in Eyre Peninsula Councils(a)
Number Per cent Number Per cent
0-4 years 434 7.5 1,286 6.6
5-14 years 614 10.6 2,760 14.1
15-19 years 206 3.5 1,046 5.3
20-24 years 547 9.4 881 4.5
25-34 years 1,360 23.4 2,059 10.5
35-44 years 1,208 20.8 2,602 13.3
45-54 years 973 16.7 2,933 15.0
55-64 years 407 7.0 2,868 14.6
65-74 years 56 1.0 1,847 9.4
75-84 10 0.2 943 4.8
85 years and over 3 0.1 393 2.0
Total 5,818 100.0 19,618 100.0
Note: (a) Excluding Whyalla and Port Lincoln. Source: ABS, 2011 Census of Population and Housing, Time Series Profile, Ceduna (DC), Cleve (DC), Elliston (DC), Franklin Harbour (DC), Kimba (DC),
Lower Eyre Peninsula (DC), Streaky Bay (DC), Tumby Bay (DC), Roxby Downs (M), Cat No 2003.0.

Page 52 Impact of Mining and Resource Development: A Case Study for Eyre Peninsula Councils
July 2013 The SA Centre for Economic Studies
Table 6.4 presents a similar comparison, by gender, with Roxby Downs. Males aged between 20 and 44 years old make up much higher proportion of the population in Roxby Downs than their female counterparts. Currently, across the nine Eyre Peninsula councils, the demographic spread between genders is much more even. So, in prospect, while it might be that more of any future mining workforce is in the family formation stage or already have a young family it could also be anticipated that a sizeable number of single males will be employed at mining locations. It is not axiomatic that this should result in any greater social and community problems provided the services and non-work recreational opportunities are available across the age ranges. Table 6.4: Age and Gender Comparison: Roxby Downs and nine Eyre Peninsula Council Areas
Population in Roxby Downs Population in Eyre Peninsula Councils(a)
Males Females Males Females
Number Per cent Number Per cent Number Per cent Number Per cent
0-4 years 234 4.0 200 3.4 631 3.2 655 3.3
5-14 years 311 5.4 303 5.2 1,392 7.1 1,368 7.0
15-19 years 114 2.0 92 1.6 573 2.9 473 2.4
20-24 years 361 6.2 186 3.2 475 2.4 406 2.1
25-34 years 872 15.0 488 8.4 1,055 5.4 1,004 5.1
35-44 years 875 15.0 333 5.7 1,324 6.8 1,278 6.5
45-54 years 726 12.5 247 4.3 1,547 7.9 1,386 7.1
55-64 years 317 5.5 90 1.6 1,587 8.1 1,281 6.5
65-74 years 34 0.6 22 0.4 1,018 5.2 829 4.2
75-84 3 0.1 7 0.1 459 2.3 484 2.5
85 years and over 3 0.1 0 0.0 140 0.7 253 1.3
Total 3,850 100.0 1,968 100.0 10,201 100.0 9,417 100.0
Note: (a) Excluding Whyalla and Port Lincoln. Source: ABS, 2011 Census of Population and Housing, Time Series Profile, Ceduna (DC), Cleve (DC), Elliston (DC), Franklin Harbour (DC), Kimba (DC),
Lower Eyre Peninsula (DC), Streaky Bay (DC), Tumby Bay (DC), Roxby Downs (M), Cat No 2003.0.
These comparisons and profiles are important for the reasons that the workforce, the family profile and hence need to access certain services will exert some influence on where families and individuals decide to locate. Settlement/location patterns including decisions to purchase or build a home will also influence workforce turnover rates, so again, there are many shared interests between mining operators and the townships across the Eyre region.
Employment
Based on responses received from mining companies and information gathered from internet searches it is estimated that new mines on the Eyre Peninsula will create between 2,285 and 2,320 mining jobs to the year 2020. This does not include the infrastructure projects related to mines. For some future mining activities there is the potential for transfer of workers from one mine to another at the end of the life of a mine. It is essential that estimates are done to take into account this possibility as it may lead to overestimation of the impacts of mining. Where a company has two potential deposits which are in proximity to each other and with coinciding conclusion and commencement timeframes, i.e., one mine is estimated to cease production in the same year as another is expected to commence production, the estimation above has been recalculated to reflect the assumption that workers from the closing mine transfer to the commencing mine. When this is done the estimated number of new jobs created directly in the mining industry is between 2,150 to 2,180.

Impact of Mining and Resource Development: A Case Study for Eyre Peninsula Councils Page 53
The SA Centre for Economic Studies July 2013
It is important to note that these employment figures are higher than the estimated number of mine workers moving to the area. In order to estimate the true population impacts of mining development an estimation first has to be made of the number of workers who will actually move to the area.
Estimating the true proportion of workers who will move to the area
An increase in mining will not lead to an equal increase in workers in mining operations moving to the area. The reasons behind this are as follows:
there may already be excess labour supply in towns;
jobs may transfer between mines e.g., when a mine closes;
transfer from other industries and already commenced mining operations. People may choose to work in mining rather than other industries due to the higher incomes or choose to supplement their current income with mining work; and
there will be fly-in/fly-out – not all mining workers will want to move to the area and some specialised jobs will need fly-in/fly-out.
Table 6.5 shows the estimated number of new mining workers who will move to the Eyre Peninsula region in order to take up jobs in the mining industry to 2026 for each of the three scenarios. Table 6.5: New mine workers who move to the region
Mining Scenario
1 2 3
New workers moving to the region 1,530 1,600 1,661
Subtracting from SACES previous estimate of the number of new jobs created in the mining industry (i.e., approximately 2,150 to 2,180) the likely number of fly-in/fly-out mining employees and those who already reside in the region (i.e., approximately 500 to 600 persons) then new mine workers are as shown in Table 6.5. This is the basic and most important calculation to determine population and flow-on impacts. In addition to the estimate of new mine workers (and their families) indirect employment will then follow – inter alia, for mining infrastructure employees (e.g., at the port(s)), teachers, retail workers, health services, construction.
Construction workers
Construction workers are required to construct new mines were to stay permanently on Eyre Peninsula this would increase the population and imply increased demand for residential dwellings to house workers and their families. However, most often the construction workforce is transitory so it is assumed permanent accommodation is not constructed for this group. Instead it is assumed mining companies construct temporary accommodation and consequentially construction workers are excluded from population increase. What could change and extend the stay of a construction workforce is economic activity that may flow from oil and gas exploration in the Great Australian Bight.
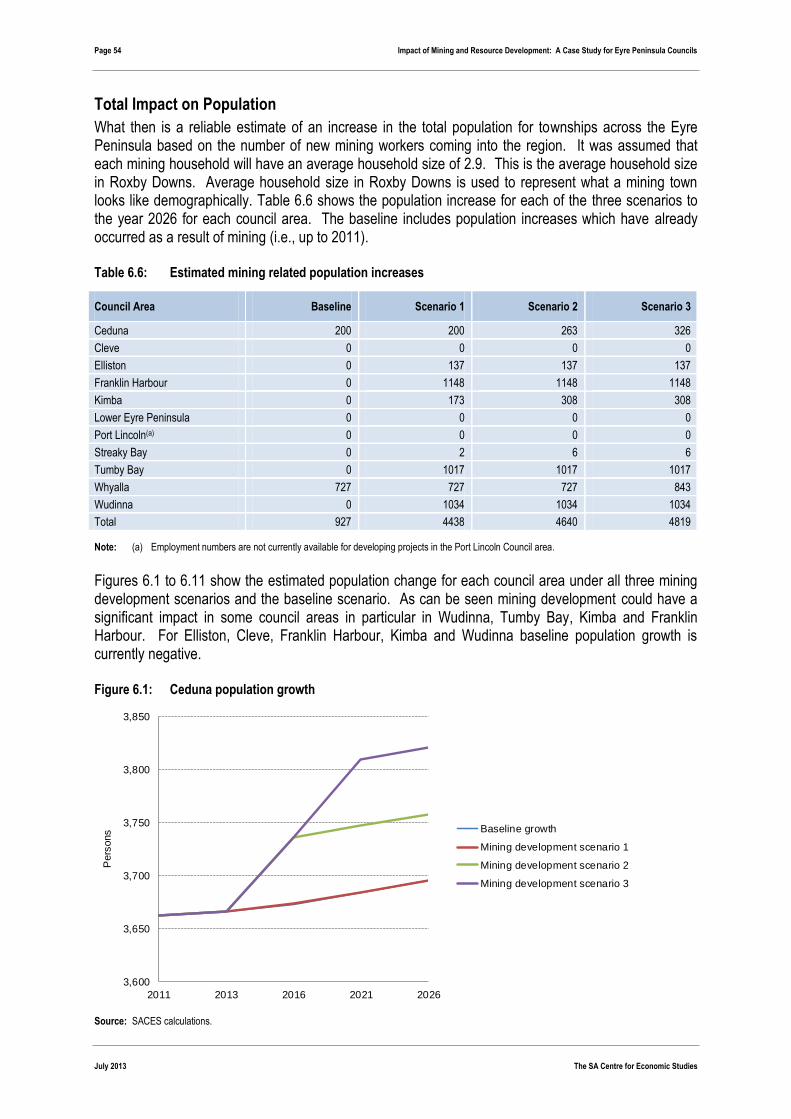
Page 54 Impact of Mining and Resource Development: A Case Study for Eyre Peninsula Councils
July 2013 The SA Centre for Economic Studies
Total Impact on Population
What then is a reliable estimate of an increase in the total population for townships across the Eyre Peninsula based on the number of new mining workers coming into the region. It was assumed that each mining household will have an average household size of 2.9. This is the average household size in Roxby Downs. Average household size in Roxby Downs is used to represent what a mining town looks like demographically. Table 6.6 shows the population increase for each of the three scenarios to the year 2026 for each council area. The baseline includes population increases which have already occurred as a result of mining (i.e., up to 2011). Table 6.6: Estimated mining related population increases
Council Area Baseline Scenario 1 Scenario 2 Scenario 3
Ceduna 200 200 263 326
Cleve 0 0 0 0
Elliston 0 137 137 137
Franklin Harbour 0 1148 1148 1148
Kimba 0 173 308 308
Lower Eyre Peninsula 0 0 0 0
Port Lincoln(a) 0 0 0 0
Streaky Bay 0 2 6 6
Tumby Bay 0 1017 1017 1017
Whyalla 727 727 727 843
Wudinna 0 1034 1034 1034
Total 927 4438 4640 4819
Note: (a) Employment numbers are not currently available for developing projects in the Port Lincoln Council area.
Figures 6.1 to 6.11 show the estimated population change for each council area under all three mining development scenarios and the baseline scenario. As can be seen mining development could have a significant impact in some council areas in particular in Wudinna, Tumby Bay, Kimba and Franklin Harbour. For Elliston, Cleve, Franklin Harbour, Kimba and Wudinna baseline population growth is currently negative. Figure 6.1: Ceduna population growth
Source: SACES calculations.
3,600
3,650
3,700
3,750
3,800
3,850
2011 2013 2016 2021 2026
Pers
ons Baseline growth
Mining development scenario 1
Mining development scenario 2
Mining development scenario 3

Impact of Mining and Resource Development: A Case Study for Eyre Peninsula Councils Page 55
The SA Centre for Economic Studies July 2013
Figure 6.2: Cleve population growth
Source: SACES calculations.
Figure 6.3: Elliston population growth
Source: SACES calculations.
1,450
1,500
1,550
1,600
1,650
1,700
1,750
1,800
2011 2013 2016 2021 2026
Pers
ons Baseline growth
Mining development Scenario 1
Mining development Scenario 2
Mining development Scenario 3
900
950
1,000
1,050
1,100
1,150
2011 2013 2016 2021 2026
Pers
ons Baseline growth
Mining development Scenario 1
Mining development Scenario 2
Mining development Scenario 3
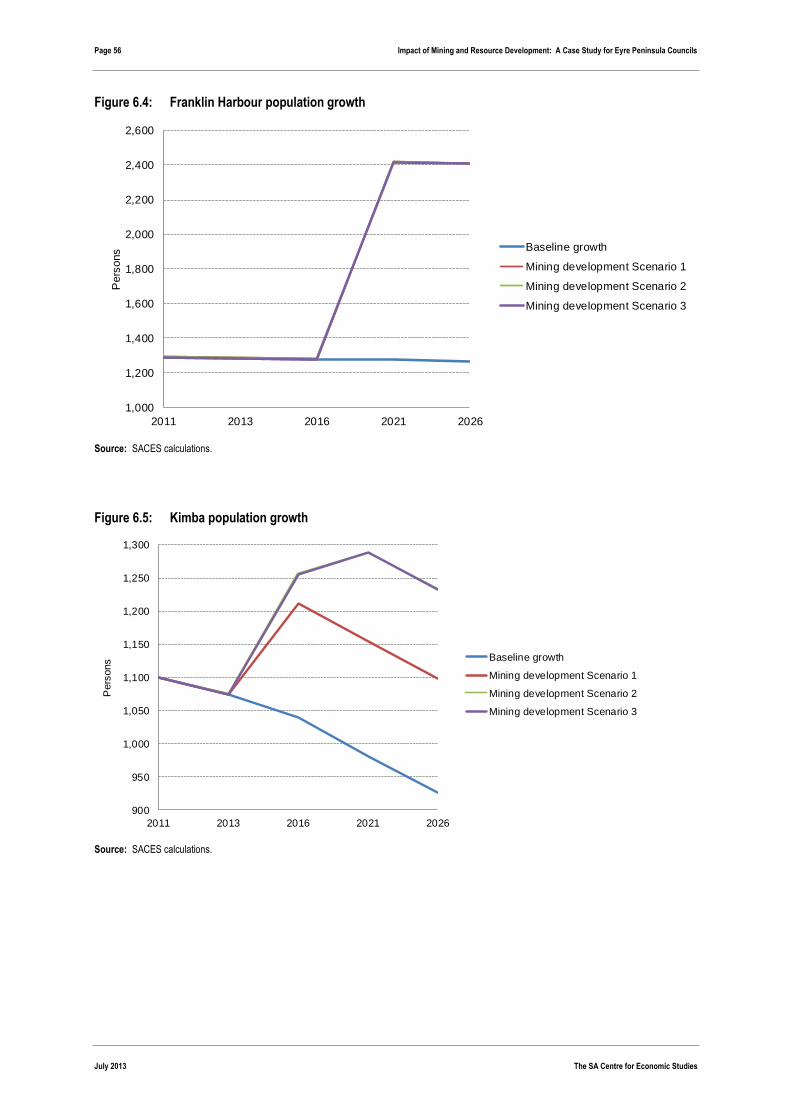
Page 56 Impact of Mining and Resource Development: A Case Study for Eyre Peninsula Councils
July 2013 The SA Centre for Economic Studies
Figure 6.4: Franklin Harbour population growth
Source: SACES calculations.
Figure 6.5: Kimba population growth
Source: SACES calculations.
1,000
1,200
1,400
1,600
1,800
2,000
2,200
2,400
2,600
2011 2013 2016 2021 2026
Pers
ons Baseline growth
Mining development Scenario 1
Mining development Scenario 2
Mining development Scenario 3
900
950
1,000
1,050
1,100
1,150
1,200
1,250
1,300
2011 2013 2016 2021 2026
Pers
ons Baseline growth
Mining development Scenario 1
Mining development Scenario 2
Mining development Scenario 3

Impact of Mining and Resource Development: A Case Study for Eyre Peninsula Councils Page 57
The SA Centre for Economic Studies July 2013
Figure 6.6: Lower Eyre Peninsula population growth
Source: SACES calculations.
Figure 6.7: Port Lincoln population growth
Source: SACES calculations.
4,500
5,000
5,500
6,000
6,500
7,000
2011 2013 2016 2021 2026
Pers
ons Baseline growth
Mining development scenario 1
Mining development scenario 2
Mining development scenario 3
14,400
14,600
14,800
15,000
15,200
15,400
15,600
2011 2013 2016 2021 2026
Pers
ons Baseline growth
Mining development scenario 1
Mining development scenario 2
Mining development scenario 3

Page 58 Impact of Mining and Resource Development: A Case Study for Eyre Peninsula Councils
July 2013 The SA Centre for Economic Studies
Figure 6.8: Streaky Bay population growth
Source: SACES calculations.
Figure 6.9: Tumby Bay population growth
Source: SACES calculations.
2,100
2,150
2,200
2,250
2,300
2,350
2,400
2,450
2,500
2011 2013 2016 2021 2026
Pers
ons Baseline growth
Mining development Scenario 1
Mining development Scenario 2
Mining development Scenario 3
2,500
2,700
2,900
3,100
3,300
3,500
3,700
3,900
2011 2013 2016 2021 2026
Pers
ons Baseline growth
Mining development Scenario 1
Mining development Scenario 2
Mining development Scenario 3

Impact of Mining and Resource Development: A Case Study for Eyre Peninsula Councils Page 59
The SA Centre for Economic Studies July 2013
Figure 6.10: Whyalla population growth
Source: SACES calculations.
Figure 6.11: Wudinna population growth
Source: SACES calculations.
Housing
The Eyre Peninsula will experience increased demand for housing due to the influx of new mining workers and their families over the next ten years. Potential mines are estimated to have lives in excess of ten years implying mine workers and their families will require permanent accommodation while employed. Rural centres closest to developing and approved mines will experience faster population growth through workers choosing to settle in towns and drive to the mine site. Existing housing stock in several of the townships will be insufficient to meet demand.
22,400
22,500
22,600
22,700
22,800
22,900
23,000
23,100
23,200
23,300
23,400
2011 2013 2016 2021 2026
Pers
ons Baseline growth
Mining development scenario 1
Mining development scenario 2
Mining development scenario 3
1,000
1,200
1,400
1,600
1,800
2,000
2,200
2011 2013 2016 2021 2026
Pers
ons Baseline growth
Mining development Scenario 1
Mining development Scenario 2
Mining development Scenario 3

Page 60 Impact of Mining and Resource Development: A Case Study for Eyre Peninsula Councils
July 2013 The SA Centre for Economic Studies
SACES has used the average household size of families in mining townships (and Roxby Downs) of 2.9 people per household to assess housing demand.36 This may represent an upper bound estimate for new mining workers and their families, but it is consistent with Census data, with the demographics of mining townships and employment by gender for mine workers (i.e., working women in mining 0.31 per cent of total Australian working population, men 1.45 per cent). To the extent existing house stock is used on a full-time basis – that is – beachside holiday homes are rented out, then the following estimates could reasonably be interpreted as upper bound estimates. SACES has estimated the additional demand for new dwellings up to 2026 under a “baseline growth” scenario, that is, townships experiencing population growing at the long-term trend, including population growth already experienced as a result of mining and the three mining development scenarios. Assumptions regarding population growth by LGA, the timing and size of growth of Eyre Peninsula’s mining workforce, number of new mines, their location and useful life and average household size have also been made. Combining assumptions together then provides an approximation of the number of new dwellings required to accommodate new mining workers and their families (see Table 6.7). Excluding Port Lincoln and Whyalla
under the baseline growth scenario 568 dwellings are required on the Eyre Peninsula by 2026;
under the mining development scenario 1, demand increases to 1,766 dwellings by 2026. This equates to an additional 1,198 houses required due to the development of mining;
under the mining development scenario 2, demand increases to 1,836 dwellings by 2026. This equates to an additional 1,268 houses required due to the development of mining; and
under the mining development scenario 3, demand increases to 1,858 dwellings by 2026. This equates to an additional 1,289 houses required due to the development of mining.
Including Port Lincoln and Whyalla
under the baseline growth scenario 1,066 dwellings are required on the Eyre Peninsula by 2026;
under the mining development scenario 1, demand increases to 2,264 dwellings by 2026. This equates to an additional 1,198 houses required due to the development of mining;
under the mining development scenario 2, demand increases to 2,334 dwellings by 2026. This equates to an additional 1,268 houses required due to the development of mining; and
under the mining development scenario 3, demand increases to 2,427 dwellings by 2026. This equates to an additional 1,360 houses required due to the development of mining.
Readers should keep in mind that Port Lincoln and Whyalla have positive baseline growth and the majority of the additional houses required in these two LGAs up until 2026 are due largely to long run population growth. However, long run baseline growth will be underpinned not just by traditional industries such as manufacturing, tourism, agriculture, and aquaculture but by mineral processing and growth in the number of FIFO workers.
36 It would not be appropriate to use average household size for the Eyre Peninsula as it has an older age profile, including retirees.

Impact of Mining and Resource Development: A Case Study for Eyre Peninsula Councils Page 61
The SA Centre for Economic Studies July 2013
Table 6.7: Dwellings required on the Eyre Peninsula by 2026
LGA ERP 2011
Number
CAGR of Population from 2001 to 2011
Baseline growth
(CAGR) Per cent
Number of dwellings needed 2013 to 2026
Baseline growth
Number
Mining development Additional dwellings required due to mining
Scenario 1 Number
Scenario 2 Number
Scenario 3 Number
Scenario 1 Number
Scenario 2 Number
Scenario 3 Number
Ceduna 3,662 0.06 10 10 32 53 0 22 43
Cleve 1,750 -0.80 0 0 0 0 0 0 0
Elliston 1,055 -0.90 0 38 38 38 38 38 38
Franklin Harbour 1,288 -0.13 0 393 393 393 393 393 393
Kimba 1,100 -1.14 0 47 74 74 47 74 74
Kimba(a) 1,100 0.00 0 60 106 106 60 106 106
Lower Eyre Peninsula 5,014 1.75 452 452 452 452 0 0 0
Streaky Bay 2,177 0.91 95 96 97 97 1 2 2
Tumby Bay 2,616 0.10 11 362 362 362 351 351 351
Wudinna 1,267 -1.37 0 329 329 329 329 329 329
Wudinna(a) 1,267 0.00 0 357 357 357 357 357 357
Eyre Peninsula excl. Port Lincoln and Whyalla
21,029 0.23 568 1,766 1,836 1,858 1,198 1,268 1,289
Port Lincoln 14,519 0.44 295 295 295 295 0 0 0
Whyalla 22,580 0.20 203 203 203 274 0 0 71
Eyre Peninsula incl. Port Lincoln and Whyalla
58,128 0.27 1,066 2,264 2,334 2,427 1,198 1,268 1,360
Note: (a) It would be expected that under a mining boom scenario on the Eyre Peninsula that the baseline decline in population in the LGAs of Kimba and Wudinna would cease as residents find work in local mines. Therefore two scenarios for each LGA are shown, one where baseline decline is at its negative trend and one where baseline decline is at zero per cent. Totals for the mining development scenario have been calculated using Kimba (a) and Wudinna (a) as this is the scenario most likely to occur under mining development.
Totals may not sum due to rounding. Source: ABS (2011), Regional Population Growth Australia, (Cat No. 3218.0) and SACES calculations.

Page 62 Impact of Mining and Resource Development: A Case Study for Eyre Peninsula Councils
July 2013 The SA Centre for Economic Studies
LGAs exclusive of Whyalla and Port Lincoln that experience the greatest additional demand for dwellings under the mining development scenarios are: Franklin Harbour (393 houses in all three scenarios), Wudinna (357 houses in all three scenarios), Tumby Bay (351 houses in all three scenarios) and Kimba (60 houses in scenario one and 106 houses in scenarios two and three). Kimba and Wudinna are both impacted by the development of new mines. Both LGAs have experienced long-term population decline greater than one per cent. With mining development, long-term population decline would be expected to reverse and would further increase demand for housing. Residential development is already underway in Kimba with a new $4.7 million purpose built village to be constructed initially to house 40 people in high quality low density housing, with a future possible expansion likely to increase capacity to 80 people when IronClad’s Wilcherry Hill Mine is at full operation (IronClad Mining Limited, 2013). The Central Eyre Iron Ore project at Warramboo would likely see an influx of new residents and demand for new houses in the rural community of Wudinna.
Residential Land Required
Residential land for new allotments will need to be set aside to support growing populations in local communities. Using assumptions regarding the estimated number of new houses to be constructed (shown in Table 6.8) and the number of new dwellings per hectare, SACES has estimated hectares of residential land required to meet the demand for new houses. The Residential Densities Handbook produced by the SA Government, for Metropolitan Adelaide defines four levels of net density37. Density as defined by the Handbook ranges from very low density (lower bound), at 17 dwellings per hectare, to high density, at 67 dwellings per hectare (upper bound), while low density and medium density both fall in between the upper and lower bounds. Together these upper and lower densities describe the full range of urban development patterns that can occur across Metropolitan Adelaide. However, the pattern of urban development differs in rural areas relative to metropolitan Adelaide such that densities for Metropolitan Adelaide do not accurately describe the pattern of urban development in rural towns. Land is more readily available in rural areas and virtually all rural residential developments have less than 17 dwellings per hectare. This implies rural densities are similar to that of the outer suburbs of Adelaide. It is unlikely rural areas would have any medium or high density residential developments unless there was specialised development around a golf course or marina. Therefore two scenarios have been chosen that are considered to reflect the lower density of allotments in rural areas. Very low density is assumed to be 8 dwellings/hectare, and low density is assumed to be 12.5 dwellings/hectare. Both of these densities assume average block sizes vary between 1,250 square metres and 800 square metres. Table 6.8 Shows these scenarios for each mining scenario.
37 Net density refers to the number of dwellings per hectare on land devoted solely to residential development. While it includes private driveways
and private open space, it does not include public roads and areas of public open space.
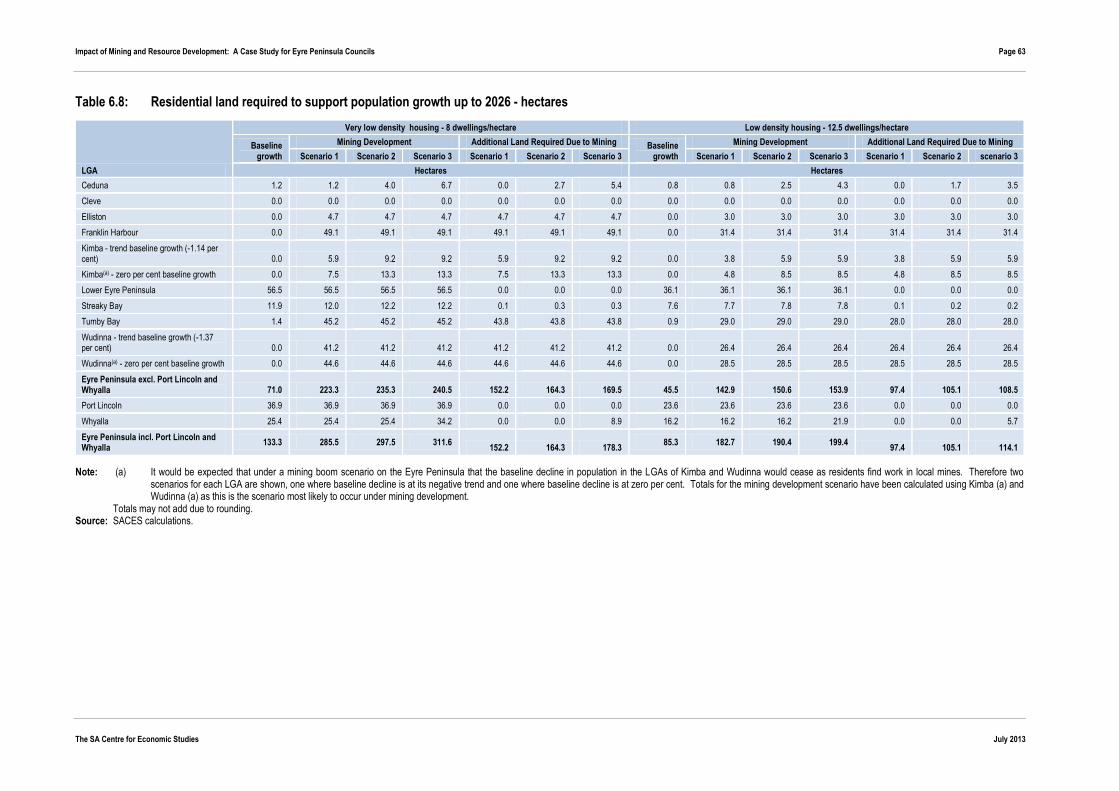
Impact of Mining and Resource Development: A Case Study for Eyre Peninsula Councils Page 63
The SA Centre for Economic Studies July 2013
Table 6.8: Residential land required to support population growth up to 2026 - hectares
LGA
Very low density housing - 8 dwellings/hectare Low density housing - 12.5 dwellings/hectare
Baseline growth
Mining Development Additional Land Required Due to Mining Baseline growth
Mining Development Additional Land Required Due to Mining
Scenario 1 Scenario 2 Scenario 3 Scenario 1 Scenario 2 Scenario 3 Scenario 1 Scenario 2 Scenario 3 Scenario 1 Scenario 2 scenario 3
Hectares Hectares
Ceduna 1.2 1.2 4.0 6.7 0.0 2.7 5.4 0.8 0.8 2.5 4.3 0.0 1.7 3.5
Cleve 0.0 0.0 0.0 0.0 0.0 0.0 0.0 0.0 0.0 0.0 0.0 0.0 0.0 0.0
Elliston 0.0 4.7 4.7 4.7 4.7 4.7 4.7 0.0 3.0 3.0 3.0 3.0 3.0 3.0
Franklin Harbour 0.0 49.1 49.1 49.1 49.1 49.1 49.1 0.0 31.4 31.4 31.4 31.4 31.4 31.4
Kimba - trend baseline growth (-1.14 per cent) 0.0 5.9 9.2 9.2 5.9 9.2 9.2 0.0 3.8 5.9 5.9 3.8 5.9 5.9
Kimba(a) - zero per cent baseline growth 0.0 7.5 13.3 13.3 7.5 13.3 13.3 0.0 4.8 8.5 8.5 4.8 8.5 8.5
Lower Eyre Peninsula 56.5 56.5 56.5 56.5 0.0 0.0 0.0 36.1 36.1 36.1 36.1 0.0 0.0 0.0
Streaky Bay 11.9 12.0 12.2 12.2 0.1 0.3 0.3 7.6 7.7 7.8 7.8 0.1 0.2 0.2
Tumby Bay 1.4 45.2 45.2 45.2 43.8 43.8 43.8 0.9 29.0 29.0 29.0 28.0 28.0 28.0
Wudinna - trend baseline growth (-1.37 per cent) 0.0 41.2 41.2 41.2 41.2 41.2 41.2 0.0 26.4 26.4 26.4 26.4 26.4 26.4
Wudinna(a) - zero per cent baseline growth 0.0 44.6 44.6 44.6 44.6 44.6 44.6 0.0 28.5 28.5 28.5 28.5 28.5 28.5
Eyre Peninsula excl. Port Lincoln and Whyalla 71.0 223.3 235.3 240.5 152.2 164.3 169.5 45.5 142.9 150.6 153.9 97.4 105.1 108.5
Port Lincoln 36.9 36.9 36.9 36.9 0.0 0.0 0.0 23.6 23.6 23.6 23.6 0.0 0.0 0.0
Whyalla 25.4 25.4 25.4 34.2 0.0 0.0 8.9 16.2 16.2 16.2 21.9 0.0 0.0 5.7
Eyre Peninsula incl. Port Lincoln and Whyalla
133.3 285.5 297.5 311.6 152.2 164.3 178.3
85.3 182.7 190.4 199.4 97.4 105.1 114.1
Note: (a) It would be expected that under a mining boom scenario on the Eyre Peninsula that the baseline decline in population in the LGAs of Kimba and Wudinna would cease as residents find work in local mines. Therefore two scenarios for each LGA are shown, one where baseline decline is at its negative trend and one where baseline decline is at zero per cent. Totals for the mining development scenario have been calculated using Kimba (a) and Wudinna (a) as this is the scenario most likely to occur under mining development.
Totals may not add due to rounding. Source: SACES calculations.

Page 64 Impact of Mining and Resource Development: A Case Study for Eyre Peninsula Councils
July 2013 The SA Centre for Economic Studies
Excluding Port Lincoln and Whyalla
under the mining development scenario 1 and assuming very low density housing – 8 dwellings/hectare, total land required to accommodate residential growth on the Eyre Peninsula is 223.3 hectares. This represents an additional 152.2 hectares of land needed above and beyond the baseline scenario;
Under the mining development scenario 2 and assuming very low density housing – 8 dwellings/hectare, total land required to accommodate residential growth on the Eyre Peninsula is 235.3 hectares. This represents an additional 164.3 hectares of land needed above and beyond the baseline scenario.
Under the mining development scenario 3 and assuming very low density housing – 8 dwellings/hectare, total land required to accommodate residential growth on the Eyre Peninsula is 240.5 hectares. This represents an additional 169.5 hectares of land needed above and beyond the baseline scenario.
Under the mining development scenario 1 and assuming low density housing – 12.5 dwellings/hectare, total land required to accommodate residential growth on the Eyre Peninsula is 142.9 hectares. This represents an additional 97.4 hectares of land needed above and beyond the baseline scenario.
Under the mining development scenario 2 and assuming low density housing – 12.5 dwellings/hectare, total land required to accommodate residential growth on the Eyre Peninsula is 150.6 hectares. This represents an additional 105.1 hectares of land needed above and beyond the baseline scenario.
Under the mining development scenario 3 and assuming low density housing – 12.5 dwellings/hectare total land required to accommodate residential growth on the Eyre Peninsula is 153.9 hectares. This represents an additional 108.5 hectares of land needed above and beyond the baseline scenario.
Including Port Lincoln and Whyalla
under the mining development scenario 1 and assuming very low density housing – 8 dwellings/hectare, total land required to accommodate residential growth on the Eyre Peninsula is 285.5 hectares. This represents an additional 152.2 hectares of land needed above and beyond the baseline scenario;
under the mining development scenario 2 and assuming very low density housing – 8 dwellings/hectare, total land required to accommodate residential growth on the Eyre Peninsula is 297.5 hectares. This represents an additional 164.3 hectares of land needed above and beyond the baseline scenario;
under the mining development scenario 3 and assuming very low density housing – 8 dwellings/hectare, total land required to accommodate residential growth on the Eyre Peninsula is 311.6 hectares. This represents an additional 178.3 hectares of land needed above and beyond the baseline scenario;
under the mining development scenario 1 and assuming low density housing – 12.5 dwellings/hectare, total land required to accommodate residential growth on the Eyre Peninsula is 182.7 hectares. This represents an additional 97.4 hectares of land needed above and beyond the baseline scenario;
under the mining development scenario 2 and assuming low density housing – 12.5 dwellings/hectare, total land required to accommodate residential growth on the Eyre Peninsula is 190.4 hectares. This represents an additional 105.1 hectares of land needed above and beyond the baseline scenario;

Impact of Mining and Resource Development: A Case Study for Eyre Peninsula Councils Page 65
The SA Centre for Economic Studies July 2013
under the mining development scenario 3 and assuming low density housing – 12.5 dwellings/hectare, total land required to accommodate residential growth on the Eyre Peninsula is 199.4 hectares. This represents an additional 114.1 hectares of land needed above and beyond the baseline scenario.
LGAs excluding Port Lincoln and Whyalla with the largest additional residential land requirements due to mining (assuming housing is constructed at a very low density) are Franklin Harbour (49.1 hectares in all three scenarios) Wudinna (44.6 hectares in all three scenarios), Tumby Bay (43.8 hectares in all three scenarios), and Kimba (7.5 hectares in scenario one and 13.3 hectares in scenarios two and three). A caveat for readers to keep in mind is that these estimates do not allow for the situation where old dwellings are demolished and new dwellings erected; under this situation no new land is required for the dwelling.
Additional Rate Revenue
Households are required to pay annual council rates on their property. This is a source of revenue to local councils and is used to provide infrastructure and services. Although the addition of new residents will increase council revenue there are additional costs to councils through the provision of additional infrastructure and services. The Local Government Grants Commission (LGGC) has provided SACES with 2010/11 data on the number of residential properties and total rates revenue by LGA. Rates have been adjusted using the 2010/11 Consumer Price Index for Adelaide, (see ABS, Cat. No. 6401.0 Consumer Price Index) which assumes an annual inflation rate of 2.5 per cent for Adelaide. Table 6.9 below shows average rates per residential property adjusted to 2012/13 prices. Table 6.9: Average rates by property type and local government area – Eyre Peninsula 2012/13
LGA Name Average rates per residential property 2012/13
($)
Tumby Bay 893.3
Wudinna 582.7
Elliston 1,208.6
Streaky Bay 1,229.6
Kimba 1,021.5
Cleve 754.7
Franklin Harbour 296.6
Lower Eyre Peninsula 1,079.8
Ceduna 1,601.9
Eyre Peninsula excl. Port Lincoln and Whyalla 1,048.1
Port Lincoln 902.0
Whyalla 974.4
Eyre Peninsula incl. Port Lincoln and Whyalla 977.8
Source: South Australian Local Government Grants Commission.
Combining average rates received per residential property and the predicted number of dwellings required in each LGA provides an approximation of additional rates revenue received by councils on the Eyre Peninsula. Tables 6.10, 6.11 and 6.12 show the additional rates revenue expected to be generated under the three mining development scenarios for 2016, 2021 and 2026. Table 6.13 shows the total additional rates revenues for LGAs.

Page 66 Impact of Mining and Resource Development: A Case Study for Eyre Peninsula Councils
July 2013 The SA Centre for Economic Studies
Most additional rates revenue is obtained by the years 2016 and 2021 over which most of Eyre Peninsula’s population growth is expected to occur. Excluding Port Lincoln and Whyalla
under mining development scenario one in 2016 the Eyre Peninsula will generate an additional $472,830 on top of its 2012/13 baseline revenue;
under mining development scenario two in 2016 the Eyre Peninsula will generate an additional $507,597 on top of its 2012/13 baseline revenue;
under mining development scenario three in 2016 the Eyre Peninsula will generate an additional $507,597 on top of its 2012/13 baseline revenue;
under mining development scenario one in 2021 the Eyre Peninsula will generate an additional $311,446 on top of its 2012/13 baseline revenue;
under mining development scenario two in 2021 the Eyre Peninsula will generate an additional $357,737 on top of its 2012/13 baseline revenue;
under mining development scenario three in 2021 the Eyre Peninsula will generate an additional $392,504 on top of its 2012/13 baseline revenue.
Including Port Lincoln and Whyalla
under mining development scenario one in 2016 the Eyre Peninsula will generate an additional $502,799 on top of its 2012/13 baseline revenue;
under mining development scenario two in 2016 the Eyre Peninsula will generate an additional $553,403 on top of its 2012/13 baseline revenue;
under mining development scenario three in 2016 the Eyre Peninsula will generate an additional $553,403 on top of its 2012/13 baseline revenue;
under mining development scenario one in 2021 the Eyre Peninsula will generate an additional $308,496 on top of its 2012/13 baseline revenue;
under mining development scenario two in 2021 the Eyre Peninsula will generate an additional $353,098 on top of its 2012/13 baseline revenue;
under mining development scenario one in 2021 the Eyre Peninsula will generate an additional $408,299 on top of its 2012/13 baseline revenue.
LGAs experiencing the greatest total increase in additional revenue due to mining development are Tumby Bay, Wudinna, Kimba and Franklin Harbour.
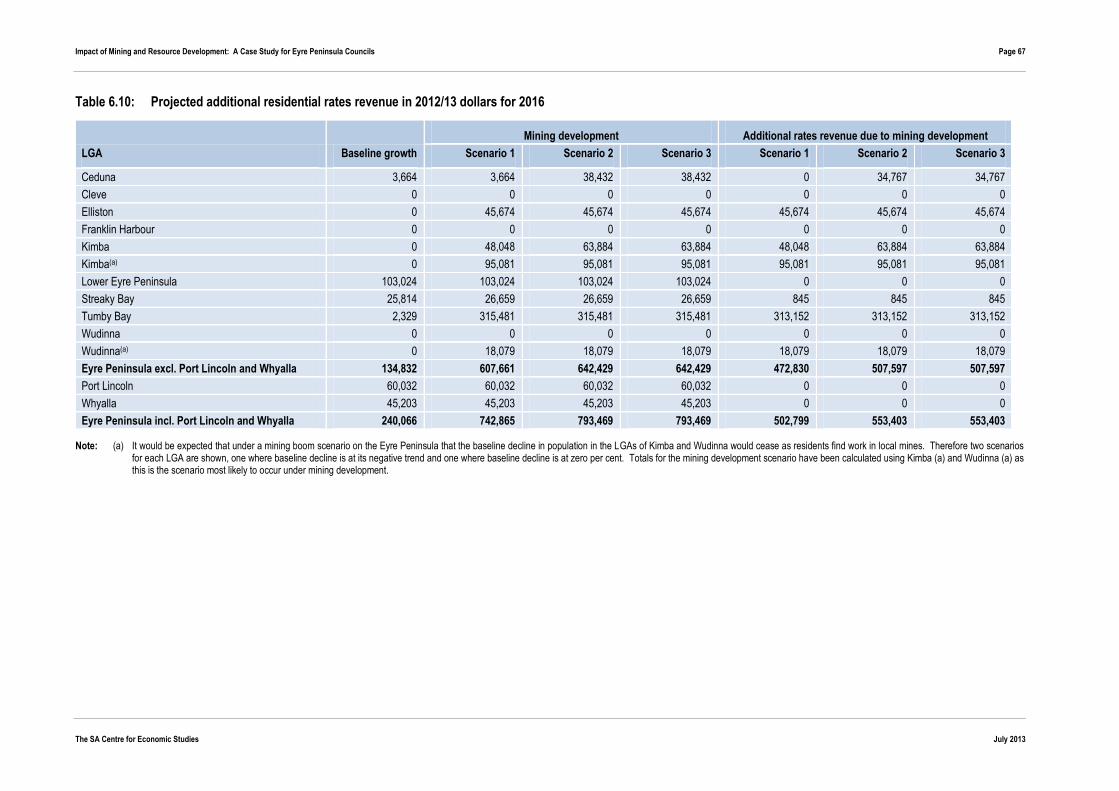
Impact of Mining and Resource Development: A Case Study for Eyre Peninsula Councils Page 67
The SA Centre for Economic Studies July 2013
Table 6.10: Projected additional residential rates revenue in 2012/13 dollars for 2016
LGA Baseline growth
Mining development Additional rates revenue due to mining development
Scenario 1 Scenario 2 Scenario 3 Scenario 1 Scenario 2 Scenario 3
Ceduna 3,664 3,664 38,432 38,432 0 34,767 34,767
Cleve 0 0 0 0 0 0 0
Elliston 0 45,674 45,674 45,674 45,674 45,674 45,674
Franklin Harbour 0 0 0 0 0 0 0
Kimba 0 48,048 63,884 63,884 48,048 63,884 63,884
Kimba(a) 0 95,081 95,081 95,081 95,081 95,081 95,081
Lower Eyre Peninsula 103,024 103,024 103,024 103,024 0 0 0
Streaky Bay 25,814 26,659 26,659 26,659 845 845 845
Tumby Bay 2,329 315,481 315,481 315,481 313,152 313,152 313,152
Wudinna 0 0 0 0 0 0 0
Wudinna(a) 0 18,079 18,079 18,079 18,079 18,079 18,079
Eyre Peninsula excl. Port Lincoln and Whyalla 134,832 607,661 642,429 642,429 472,830 507,597 507,597
Port Lincoln 60,032 60,032 60,032 60,032 0 0 0
Whyalla 45,203 45,203 45,203 45,203 0 0 0
Eyre Peninsula incl. Port Lincoln and Whyalla 240,066 742,865 793,469 793,469 502,799 553,403 553,403
Note: (a) It would be expected that under a mining boom scenario on the Eyre Peninsula that the baseline decline in population in the LGAs of Kimba and Wudinna would cease as residents find work in local mines. Therefore two scenarios for each LGA are shown, one where baseline decline is at its negative trend and one where baseline decline is at zero per cent. Totals for the mining development scenario have been calculated using Kimba (a) and Wudinna (a) as this is the scenario most likely to occur under mining development.
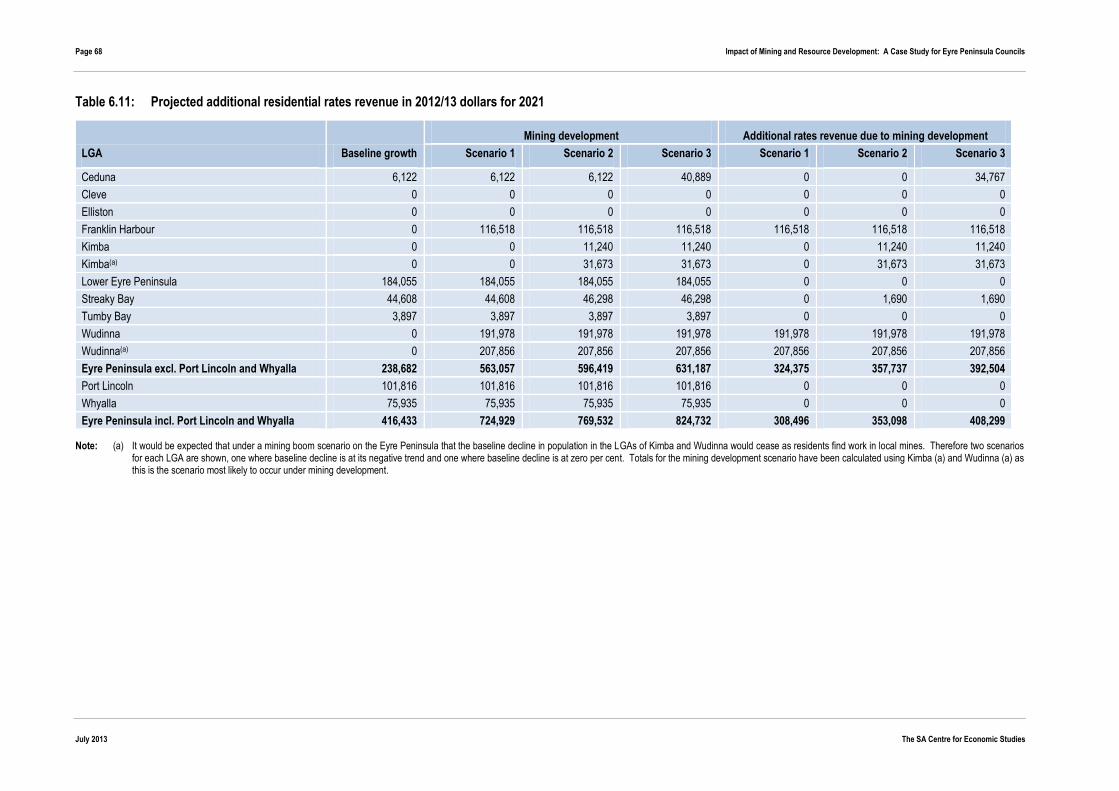
Page 68 Impact of Mining and Resource Development: A Case Study for Eyre Peninsula Councils
July 2013 The SA Centre for Economic Studies
Table 6.11: Projected additional residential rates revenue in 2012/13 dollars for 2021
LGA Baseline growth
Mining development Additional rates revenue due to mining development
Scenario 1 Scenario 2 Scenario 3 Scenario 1 Scenario 2 Scenario 3
Ceduna 6,122 6,122 6,122 40,889 0 0 34,767
Cleve 0 0 0 0 0 0 0
Elliston 0 0 0 0 0 0 0
Franklin Harbour 0 116,518 116,518 116,518 116,518 116,518 116,518
Kimba 0 0 11,240 11,240 0 11,240 11,240
Kimba(a) 0 0 31,673 31,673 0 31,673 31,673
Lower Eyre Peninsula 184,055 184,055 184,055 184,055 0 0 0
Streaky Bay 44,608 44,608 46,298 46,298 0 1,690 1,690
Tumby Bay 3,897 3,897 3,897 3,897 0 0 0
Wudinna 0 191,978 191,978 191,978 191,978 191,978 191,978
Wudinna(a) 0 207,856 207,856 207,856 207,856 207,856 207,856
Eyre Peninsula excl. Port Lincoln and Whyalla 238,682 563,057 596,419 631,187 324,375 357,737 392,504
Port Lincoln 101,816 101,816 101,816 101,816 0 0 0
Whyalla 75,935 75,935 75,935 75,935 0 0 0
Eyre Peninsula incl. Port Lincoln and Whyalla 416,433 724,929 769,532 824,732 308,496 353,098 408,299
Note: (a) It would be expected that under a mining boom scenario on the Eyre Peninsula that the baseline decline in population in the LGAs of Kimba and Wudinna would cease as residents find work in local mines. Therefore two scenarios for each LGA are shown, one where baseline decline is at its negative trend and one where baseline decline is at zero per cent. Totals for the mining development scenario have been calculated using Kimba (a) and Wudinna (a) as this is the scenario most likely to occur under mining development.

Impact of Mining and Resource Development: A Case Study for Eyre Peninsula Councils Page 69
The SA Centre for Economic Studies July 2013
Table 6.12: Projected additional residential rates revenue in 2012/13 dollars for 2026
LGA Baseline growth
Mining development Additional rates revenue due to mining development
Scenario 1 Scenario 2 Scenario 3 Scenario 1 Scenario 2 Scenario 3
Ceduna 6,141 6,141 6,141 6,141 0 0 0
Cleve 0 0 0 0 0 0 0
Elliston 0 0 0 0 0 0 0
Franklin Harbour 0 0 0 0 0 0 0
Kimba 0 0 0 0 0 0 0
Kimba(a) 0 0 0 0 0 0 0
Lower Eyre Peninsula 200,695 200,695 200,695 200,695 0 0 0
Streaky Bay 46,669 46,669 46,669 46,669 0 0 0
Tumby Bay 3,916 3,916 3,916 3,916 0 0 0
Wudinna 0 0 0 0 0 0 0
Wudinna(a) 0 0 0 0 0 0 0
Eyre Peninsula excl. Port Lincoln and Whyalla 257,420 257,420 257,420 257,420 0 0 0
Port Lincoln 104,062 104,062 104,062 104,062 0 0 0
Whyalla 76,687 76,687 76,687 76,687 0 0 0
Eyre Peninsula incl. Port Lincoln and Whyalla 438,170 438,170 438,170 438,170 0 0 0
Note: (a) It would be expected that under a mining boom scenario on the Eyre Peninsula that the baseline decline in population in the LGAs of Kimba and Wudinna would cease as residents find work in local mines. Therefore two scenarios for each LGA are shown, one where baseline decline is at its negative trend and one where baseline decline is at zero per cent. Totals for the mining development scenario have been calculated using Kimba (a) and Wudinna (a) as this is the scenario most likely to occur under mining development.

Page 70 Impact of Mining and Resource Development: A Case Study for Eyre Peninsula Councils
July 2013 The SA Centre for Economic Studies
Table 6.13: Total projected additional rates revenues ($)
LGA
Additional rates revenue due to mining development
Scenario 1 Scenario 2 Scenario 3
Ceduna 0 34,767 69,534
Cleve 0 0 0
Elliston 45,674 45,674 45,674
Franklin Harbour 116,518 116,518 116,518
Kimba 48,048 75,124 95,557
Kimba(a) 142,621 142,622 142,623
Lower Eyre Peninsula 0 0 0
Streaky Bay 845 2,534 2,534
Tumby Bay 313,152 313,152 313,152
Wudinna 191,978 191,978 191,978
Wudinna(a) 225,935 225,935 225,935
Eyre Peninsula excl. Port Lincoln and Whyalla 797,204 865,334 900,101
Port Lincoln 0 0 0
Whyalla 0 0 0
Eyre Peninsula incl. Port Lincoln and Whyalla 811,295 906,501 961,702
Note: (a) It would be expected that under a mining boom scenario on the Eyre Peninsula that the baseline decline in population in the LGAs of Kimba and Wudinna would cease as residents find work in local mines. Therefore two scenarios for each LGA are shown, one where baseline decline is at its negative trend and one where baseline decline is at zero per cent. Totals for the mining development scenario have been calculated using Kimba (a) and Wudinna (a) as this is the scenario most likely to occur under mining development.
Demand for Services
Education
Over the period 2006 to 2011 the majority of public schools in the Eyre Peninsula region experienced a decrease in enrolment numbers (see Table 3.3) with the region overall experiencing a decrease in public school enrolments of 5.2 per cent. Of the schools that experienced an increase in enrolments half were within Whyalla. Excluding schools in Whyalla and Port Lincoln only four schools experienced an increase in enrolments in the five years to 2011. An increase in mining activity in the region is expected to result in an increase in enrolment numbers for schools in towns where mines are nearby. Given the preference of the majority of mining companies for employees to live locally and the provision of incentives to move to towns by some companies it is expected that a lot of new mine workers will bring families, which will then impact on enrolment numbers for schools. Table 6.14 shows the expected increases in the number of children, school staff and teachers as a result of increases in mining activity. The calculation is based on the proportion of young people to the total population in Roxby Downs. Based on the three mining development scenarios it is expected that there will be an increase of between 957 and 1,040 children on the Eyre Peninsula as a result of mining. This is regarded as an upper bound estimate for planning purposes under each scenario. Based on the latest Productivity Commission figure of student to school staff ratios in South Australia of 10.2 students to each staff member and 14.4 students to each teacher, that increases in mining activity will result in increases of between 60 and 98 school staff including between 42 and 69 teachers.

Impact of Mining and Resource Development: A Case Study for Eyre Peninsula Councils Page 71
The SA Centre for Economic Studies July 2013
Table 6.14: Increases in children, school staff and teachers as a result of mining
Scenario 1 Scenario 2 Scenario 3
Extra children 957 1,000 1,039
School staff numbers 60 94 98
Teachers 42 66 69
Police
According to the Productivity Commission in 2011/12 there were 320 Police per 100,000 of population in South Australia.38 Therefore mining on the Eyre Peninsula unlikely to have a large impact on police numbers. Based on this number and population estimates made in the three mining scenarios it is estimated that increases in mining activity will only cause an increase of 14 or 15 police officers on the entire Eyre Peninsula as shown in Table 6.15. Table 6.15: Increase in police officers
Scenario 1 Scenario 2 Scenario 3
Population increase 4,437 4,639 4,819
Police increases 14 15 15
Health
There are eleven hospitals on the Eyre Peninsula, eight of which are small hospitals.39 Mine workers and their families will need access to health care. The increase in population will require greater provision of health services on the Eyre Peninsula, partly in response to population and partly the demographic of younger families. According to the latest Productivity Commission Report on Government Services in South Australia for every 100,000 people there were 94.6 full time workload equivalent GP’s bulk billing Medicare. This means that mining related population increases will only result in four or five additional full time workload equivalent GP’s on the Eyre Peninsula. Table 6.16 shows these changes. Table 6.16: Increases in GP’s
Scenario 1 Scenario 2 Scenario 3
Population increase 4,437 4,639 4,819
Bulk Billing GP increase 4 4 5
We have not estimated demand on other health services including nursing, pre-natal and post-natal care, etc.
38 Productivity Commission (2013). 39 Regional Development Australia Whyalla and Eyre Peninsula (2012).

Page 72 Impact of Mining and Resource Development: A Case Study for Eyre Peninsula Councils
July 2013 The SA Centre for Economic Studies
7. Case Study of Tumby Bay
7.1 Why Tumby Bay
The District Council of Tumby Bay was selected as a case study due to the types of mining and infrastructure development expected to occur within the district bounds. Currently the projects in the Tumby Bay district are all in development and planning stages. Therefore the district will first experience the temporary impacts of construction (increased numbers of transient workers, large amounts of capital expenditure, etc.) and then will experience the long term effects of permanent mining activity, a number of which are associated with potentially an increase in the permanent population. For this case study the long term effects of a permanent mining population are the focus as construction effects are temporary. Tumby Bay has two developing mine sites within the Local Government Area boundaries, Carrow and Fusion, both of which are part of Centrex’s Eyre Peninsula Joint Venture.40 As well as the mine sites two proposed ports also are within the Tumby Bay District Council area. Centrex Metals plan to develop Port Spencer at Sheep Hill on 260 acres of land41 in order to export products from their Wilgerup mine and the Eyre Peninsula Joint Venture. The port will be situated almost equidistant from Port Neill and Tumby Bay.42 As well as using Port Spencer for their own projects Centrex will also allow use for other purposes such as grain export so the port will therefore foster further economic development on the Eyre Peninsula. This offers a potential cost saving to agricultural producers in the Tumby Bay district as they will not have to transport goods as far as Port Lincoln or Whyalla. The use of the port by third parties will also result in the export industry being resilient to changes in the mining industry. Centrex has approval from the State government for Port Spencer; however they still require Federal government approval.43 Iron Road also has plans to develop their own port at Cape Hardy to service their Central Eyre Iron Project. Iron Road has purchased 1100 hectares of land to build a port.44 Iron Road also plans to allow third party access to their port. They are planning to allow for a quarter of the total product exported from their port to be from third parties.45 Iron Road plan to operate from the port for at least 30 years and have a permanent operating workforce of 25 people. In construction of the port they estimate to have 250 employees.46 Although there are currently proposals for two ports it is likely that only one will actually be built47, given that there is only 15 kilometres between the two proposed sites.48 However given the expected size of these ports the development of even one will have a significant impact on the Tumby Bay district. The State government has indicated that the port to be built will be whichever has approvals and financing in place first.49 There are also mines located near the borders of the District Council of Tumby Bay. Centrex’s Wilgerup mine is located 30 kilometres south east of Lock50, near the border between the District Council of Elliston and the District Council of Tumby Bay. Should employees choose to live by the seaside, the
40 The third site involved in the Eyre Peninsula Joint Venture is Greenpatch, which is within the borders of the District Council of Eyre Peninsula and
therefore is not considered as impacts would likely be observed in other towns. 41 Centrex Metals Limited (2011). 42 Centrex Metals Limited. 43 Russell, C (2012). 44 Austin, N., 2013. 45 Iron Road Limited. 46 Iron Road Limited (2012b). 47 Changarathil, V (2012). 48 Russell, C., 2013. 49 Ibid. 50 Department for Manufacturing, Innovation, Trade, Resources and Energy (DMITRE), (2012b).

Impact of Mining and Resource Development: A Case Study for Eyre Peninsula Councils Page 73
The SA Centre for Economic Studies July 2013
township of Tumby Bay is one of the closest seaside locations to the mine. There is potential for population spillover effects from other mines.
7.2 What will result for Tumby Bay from mining?
There are both positive and negative impacts for communities which are in proximity to mining projects. For example the area is likely to experience an increase in population. This increase in population is likely to include not only mine and infrastructure workers but also their families due to the nature of developments in the area in particular the life of mine sites and the prospect of a significant drive-in/drive-out (DIDO) workforce. As well as this direct population increase there will also be flow-on indirect impacts due to increases in the population and demand for services.
Timeframes for impacts
According to RESA, the Carrow mine site is estimated to commence production in 2015, however it has since been put on hold and now has an indeterminate commencement date. Centrex’s other project in the Tumby Bay district, the Fusion project has been estimated to commence production in 2016. Given that it is intended that mining output from Fusion will be exported from Port Spencer it is anticipated that Port Spencer will be operational by the time Fusion is operational sometime in 2016. Considering that Iron Road intends to export products from its Central Eyre Iron Project from the proposed port at Cape Hardy it is expected that the port will be operational sometime in 2018. Based on these figures Tumby Bay should expect mining related population increases from 2016 onwards.
Social/Community Impacts
Mining activity expansion through providing a boost to population has been shown to impact house prices.51 As demand for housing increases it is expected that real estate prices will increase to meet demand (and in fact this process has already commenced). Whilst for mine workers the increase in real estate prices may not be a problem (due to the higher wages in mining) it creates financial difficulties for others who do not work in the mines. This may result in non-mining households moving out of the area to locations where housing costs are lower. At the last census (2011) there were a significant number of dwellings in the District Council of Tumby Bay area unoccupied. The ABS estimated a figure at 29.5 per cent, which is somewhat higher than the entire Eyre Peninsula and South West region52 (18.7 per cent) and higher than that of South Australia (11.9 per cent). The District Council informed SACES that “the reason for the high numbers of unoccupied dwellings would be the number located in the holiday town of Port Neill, where on Census night 59 of 177 dwellings (33 per cent) were occupied and that these figures probably have the potential to skew the entire district Council.” The township of Tumby Bay has a number of absentee owners of essentially holiday homes. In prospect, there are a large number of unoccupied dwellings that are principally used for short-term, holiday purposes but it is not possible to gauge how many might be let to mining employees on a full-time basis. On balance, in Tumby Bay and nearby Port Neill there are not significant numbers of year-long rental properties or vacant houses available for purchase.
51 BHP Billiton, (2009). 52 This includes unincorporated areas.

Page 74 Impact of Mining and Resource Development: A Case Study for Eyre Peninsula Councils
July 2013 The SA Centre for Economic Studies
An increase in mining activity is often associated with an increase in social challenges such as crime and an increased pressure on social services due to an increase in non-resident workers. This outcome has been experienced in the Bowen Basin region of Queensland. This is will require monitoring in the Tumby Bay district, however it is less likely that his will occur due to the expected nature of the longer-term residence of the population and that there will be only limited fly-in/fly-out during construction. The disparity between mining wages and current wage rates for those employed in the district can lead to high rates of job changing. In an area with a high level of agricultural employment (Sheep, Beef Cattle and Grain Farming made up 29.3 per cent of employed people at the last census compared with 1.9 per cent in South Australia) this can then lead to skills shortages in agricultural and similar industries due to the transferability of skills between agriculture and mining, i.e. driving heavy vehicles and operating heavy machinery. In other towns with high mining activity some businesses have reported difficulty in recruiting staff due to the higher wages offered in the mining industry. This then results in less provision of services such as construction. Pham et.al. (2013) suggested that mining can also cause skills shortages in tourism related industries as those willing to do shift work may choose mining work instead of tourism due to the higher wages. An increase in mining activity utilising additional workers who choose to reside locally and bring families with them is likely to result in an improvement in the quality of schooling available, as schools with higher numbers of students are able to attract greater amounts of funding. This is due to a number of factors including the increased viability of schools. There are two main ways in which mining will impact on the Tumby Bay Council in a financial way. The expected increase in population and rate paying households in the district will mean that the council has additional financial resources. However it also means that the council will have to provide more services. An increase in mining activity is expected to bring an increase in wealth to the region due to higher paying employment, an increase in the number of local residents and consumption expenditure. This increase in wealth will have a number of indirect effects. The assumed increase in expenditure will add to the number of non-mining jobs available through greater need for services.
Infrastructure Impacts
Given the needs of the mining industry it is anticipated that economic and community infrastructure will need to be upgraded around the Tumby Bay district and the entire Eyre Peninsula in general. The expected increase in infrastructure will be a benefit to the Tumby Bay area. Mining companies are expected to assist in upgrades to road infrastructure in the Tumby Bay area and/or local roads will possibly need to be transferred to State government.
Employment, Population and Housing Impacts
Given the location of mines, in that they are in close proximity to townships it is expected that an expansion in mining will result in a decrease in the unemployment rate of the area. Although the council area already has a low unemployment rate (2.5 per cent, SA 5.0 per cent53) this is expected to decrease further if mine operators source workers from within the region. There were only 34 people unemployed in Tumby Bay54 meaning the majority of new mine workers will either have to come from outside the region or from other industries in the region (i.e., agricultural workers or construction workers). As a comparison Roxby Downs has an unemployment rate of .6 per cent55, this is an example of the sort of impact mining can have on the job market in a town.
53 Department of Education, Employment and Workplace Relations (DEEWR). 54 Ibid. 55 Ibid.
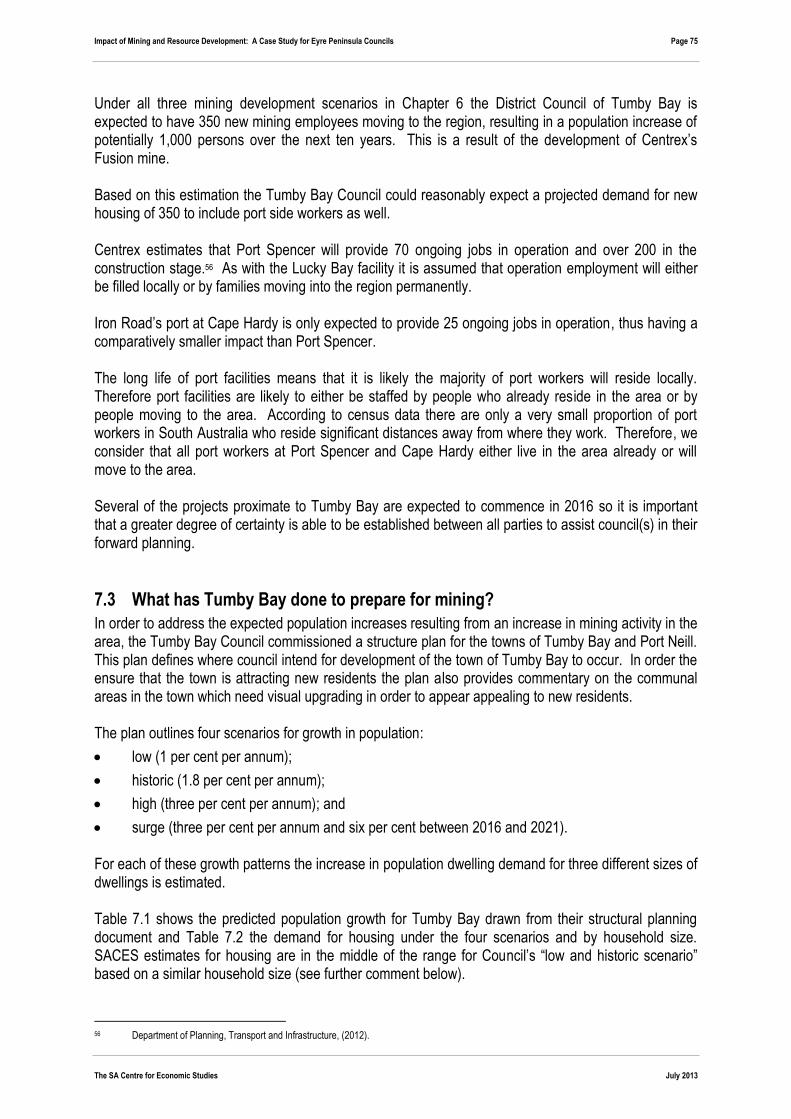
Impact of Mining and Resource Development: A Case Study for Eyre Peninsula Councils Page 75
The SA Centre for Economic Studies July 2013
Under all three mining development scenarios in Chapter 6 the District Council of Tumby Bay is expected to have 350 new mining employees moving to the region, resulting in a population increase of potentially 1,000 persons over the next ten years. This is a result of the development of Centrex’s Fusion mine. Based on this estimation the Tumby Bay Council could reasonably expect a projected demand for new housing of 350 to include port side workers as well. Centrex estimates that Port Spencer will provide 70 ongoing jobs in operation and over 200 in the construction stage.56 As with the Lucky Bay facility it is assumed that operation employment will either be filled locally or by families moving into the region permanently. Iron Road’s port at Cape Hardy is only expected to provide 25 ongoing jobs in operation, thus having a comparatively smaller impact than Port Spencer. The long life of port facilities means that it is likely the majority of port workers will reside locally. Therefore port facilities are likely to either be staffed by people who already reside in the area or by people moving to the area. According to census data there are only a very small proportion of port workers in South Australia who reside significant distances away from where they work. Therefore, we consider that all port workers at Port Spencer and Cape Hardy either live in the area already or will move to the area. Several of the projects proximate to Tumby Bay are expected to commence in 2016 so it is important that a greater degree of certainty is able to be established between all parties to assist council(s) in their forward planning.
7.3 What has Tumby Bay done to prepare for mining?
In order to address the expected population increases resulting from an increase in mining activity in the area, the Tumby Bay Council commissioned a structure plan for the towns of Tumby Bay and Port Neill. This plan defines where council intend for development of the town of Tumby Bay to occur. In order the ensure that the town is attracting new residents the plan also provides commentary on the communal areas in the town which need visual upgrading in order to appear appealing to new residents. The plan outlines four scenarios for growth in population:
low (1 per cent per annum);
historic (1.8 per cent per annum);
high (three per cent per annum); and
surge (three per cent per annum and six per cent between 2016 and 2021). For each of these growth patterns the increase in population dwelling demand for three different sizes of dwellings is estimated. Table 7.1 shows the predicted population growth for Tumby Bay drawn from their structural planning document and Table 7.2 the demand for housing under the four scenarios and by household size. SACES estimates for housing are in the middle of the range for Council’s “low and historic scenario” based on a similar household size (see further comment below).
56 Department of Planning, Transport and Infrastructure, (2012).
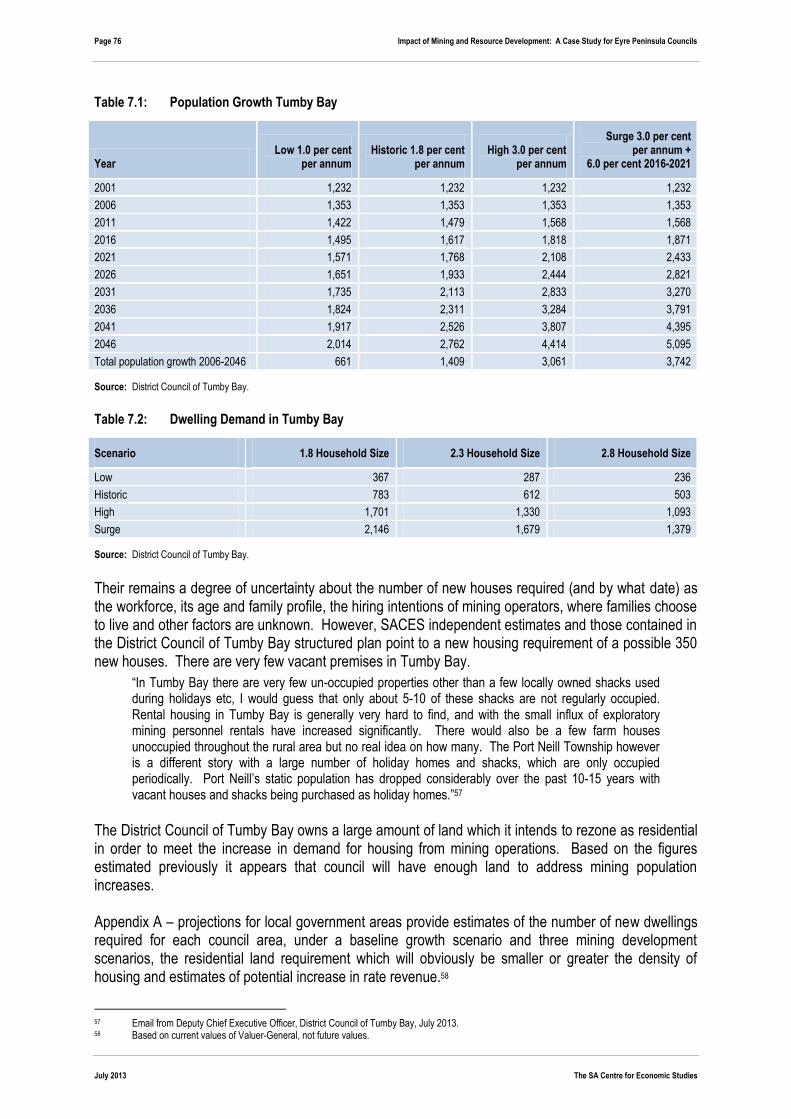
Page 76 Impact of Mining and Resource Development: A Case Study for Eyre Peninsula Councils
July 2013 The SA Centre for Economic Studies
Table 7.1: Population Growth Tumby Bay
Year Low 1.0 per cent
per annum Historic 1.8 per cent
per annum High 3.0 per cent
per annum
Surge 3.0 per cent per annum +
6.0 per cent 2016-2021
2001 1,232 1,232 1,232 1,232
2006 1,353 1,353 1,353 1,353
2011 1,422 1,479 1,568 1,568
2016 1,495 1,617 1,818 1,871
2021 1,571 1,768 2,108 2,433
2026 1,651 1,933 2,444 2,821
2031 1,735 2,113 2,833 3,270
2036 1,824 2,311 3,284 3,791
2041 1,917 2,526 3,807 4,395
2046 2,014 2,762 4,414 5,095
Total population growth 2006-2046 661 1,409 3,061 3,742
Source: District Council of Tumby Bay.
Table 7.2: Dwelling Demand in Tumby Bay
Scenario 1.8 Household Size 2.3 Household Size 2.8 Household Size
Low 367 287 236
Historic 783 612 503
High 1,701 1,330 1,093
Surge 2,146 1,679 1,379
Source: District Council of Tumby Bay.
Their remains a degree of uncertainty about the number of new houses required (and by what date) as the workforce, its age and family profile, the hiring intentions of mining operators, where families choose to live and other factors are unknown. However, SACES independent estimates and those contained in the District Council of Tumby Bay structured plan point to a new housing requirement of a possible 350 new houses. There are very few vacant premises in Tumby Bay.
“In Tumby Bay there are very few un-occupied properties other than a few locally owned shacks used during holidays etc, I would guess that only about 5-10 of these shacks are not regularly occupied. Rental housing in Tumby Bay is generally very hard to find, and with the small influx of exploratory mining personnel rentals have increased significantly. There would also be a few farm houses unoccupied throughout the rural area but no real idea on how many. The Port Neill Township however is a different story with a large number of holiday homes and shacks, which are only occupied periodically. Port Neill’s static population has dropped considerably over the past 10-15 years with vacant houses and shacks being purchased as holiday homes.”57
The District Council of Tumby Bay owns a large amount of land which it intends to rezone as residential in order to meet the increase in demand for housing from mining operations. Based on the figures estimated previously it appears that council will have enough land to address mining population increases. Appendix A – projections for local government areas provide estimates of the number of new dwellings required for each council area, under a baseline growth scenario and three mining development scenarios, the residential land requirement which will obviously be smaller or greater the density of housing and estimates of potential increase in rate revenue.58
57 Email from Deputy Chief Executive Officer, District Council of Tumby Bay, July 2013. 58 Based on current values of Valuer-General, not future values.
Impact of Mining and Resource Development: A Case Study for Eyre Peninsula Councils Page 77
The SA Centre for Economic Studies July 2013
References Andrews, M (2012a), 'The great bright, white hope for Minotaur', Australia's Paydirt, vol. 1, no. 195, p. 26.
_______________ (2012b), 'Paving the iron road on the Eyre Peninsula', Australia's Paydirt, vol. 1, no. 195, p. 30.
Andrews, M & Parker, J (2012), 'Pumping up gum flat', Australia's Paydirt, vol. 1, no. 195.
Archer Exploration (2011), Graphite, http://www.archerexploration.com.au/index.php?PID=108.
_______________ (2011), Gold, http://www.archerexploration.com.au/index.php?PID=112.
_______________ (2011), Copper, http://www.archerexploration.com.au/index.php?PID=111.
Austin, N (2013), “The mine that could change our future”, The Advertiser, 12th February.
Australian Bureau of Statistics (ABS) (2011), Mineral and Petroleum Exploration, Australia, December, (Cat. No. 8412.0).
_______________ (2012), '2011 Census of Population and Housing: Port Lincoln Time Series Profile'.
_______________ (2012), '2011 Census of Population and Housing: Ceduna Time Series Profile'.
_______________ (2012), '2011 Census of Population and Housing: Cleve Time Series Profile'.
_______________ (2012), '2011 Census of Population and Housing: Elliston Time Series Profile'.
_______________ (ABS) (2012), '2011 Census of Population and Housing: Franklin Harbour Time Series Profile'.
_______________ (2012), '2011 Census of Population and Housing: Kimba Time Series Profile'.
_______________ (2012), '2011 Census of Population and Housing: Eyre Peninsula and South West Time Series Profile'.
_______________ (2012), '2011 Census of Population and Housing: Lower Eyre Peninsula Time Series Profile'.
_______________ (2012), '2011 Census of Population and Housing: Tumby Bay Time Series Profile'.
_______________ (2012), '2011 Census of Population and Housing: Streaky Bay Time Series Profile'.
_______________ (2012), '2011 Census of Population and Housing: Wudinna Time Series Profile'.
_______________ (2012), '2011 Census of Population and Housing: Whyalla Time Series Profile'.
_______________ (2013), 2011 Census QuickStats, viewed 24/04/2013, http://www.abs.gov.au/websitedbs/censushome.nsf/home/quickstats?opendocument&navpos=220.
_______________ (2012), Regional Population Growth, Australia, July, (Cat. No. 3218.0).
Australian Taxation Office (2013), Taxation Statistics , http://www.ato.gov.au/About-ATO/Research-and-statistics/In-detail/Tax-statistics/Taxation-statistics-2010-11/
BHP Billiton (2009), 'Olympic Dam Expansion Draft Environmental Impact Statement'.
Carrington, K, Hogg, R & McIntosh, A (2011), 'The resource boom's underbelly: Criminological impacts of mining development', Australian & New Zealand Journal of Criminology, vol. 44, no. 3, pp. 335-354.
Centre for Social Responsibility in Mining (2012), “Local government, mining companies and resource development in regional Australia – Meeting the governance challenge”.
Centrex Metals, Projects – Port Spencer Port Facility, http://www.centrexmetals.com.au/projects/proj_port.html viewed 7/05/13.
_______________ (2006), Centrex metals – Projects, http://www.centrexmetals.com.au/projects/projects.html viewed 22/01/2013.
_______________ (2011), Sheep Hill Port Project Update 4.
Changarathil, V (2012), 'Iron Road unveils proposal to build export facility at Cape Hardy, between Tumby Bay and Port Neill on the Eyre Peninsula', The Advertiser, 4th December.
City of Port Lincoln, 2012-2013 BUDGET.
City of Whyalla (2012), General Purpose Financial Reports.
Coffey Environments Australia Pty Ltd (2011), Wilcherry Hill Iron Project Mining Lease Proposal, commissioned by Ironclad Mining Limited.

Page 78 Impact of Mining and Resource Development: A Case Study for Eyre Peninsula Councils
July 2013 The SA Centre for Economic Studies
Deloitte Access Economics (2013), Regional Mining and Infrastructure Planning Project - Eyre and Western Region. Prepared for the South Australian Department of Planning and Infrastructure and the Commonwealth Department of Infrastructure and Transport.
Department for Manufacturing, Innovation, Trade, Resources and Energy (DMITRE) (2012/13), “South Australian Major Developments Directory”.
_______________ (2012), MESA Journal 64, March.
_______________ (2013), Mines and developing projects, retrieved from: http://www.pir.sa.gov.au/minerals
_______________ (2012), “Uranium in South Australia”, Earth Resources Information Sheet, retrieved from: https://sarigbasis.pir.sa.gov.au/WebtopEw/ws/samref/sarig1/image/DDD/ISM50.pdf
_______________ (2012a), Approved Mines, viewed 22/01/2013, http://www.minerals.dmitre.sa.gov.au/mines__and__developing_projects/approved_mines.
_______________ (2012b), Developing Projects, viewed 22/01/2013, http://www.minerals.dmitre.sa.gov.au/mines__and__developing_projects/approved_mines.
_______________ (2011), Flowchart of mining proposal approval processes, http://www.pir.sa.gov.au/minerals/licensing_and_regulation/mining_operations/flowchart_of_mining_proposal_approval_processes.
Department for Water (2011), Eyre Peninsula Demand and Supply Statement.
Department of Education, Employment and Workplace Relations (DEEWR) (2013), Small Area Labour Markets December Quarter 2012.
Department of Planning, Transport and Infrastructure (2012), Assessment Report for the Environmental Report Centrex Metals LTD Port Spencer (Sheep Hill) Deep Water Port Facility - Stage 1, Eyre Peninsula.
_______________ (2012), Eyre and Western Region Plan.
Department of Regional Australia, Local Government, Arts and Sport, Regional Development Australia Fund (RDAF), Lucky Bay Harbour Extension, Project fact sheet, retrieved from: http://www.regional.gov.au/regional/programs/files/lucky-bay-harbour-extension-rdaf-rd2-20120703.pdf
The District Council of Ceduna, Annual Business Plan & Budget 2012/2013.
District Council of Cleve, Draft Annual Budget 2011 - 2012.
District Council of Elliston (2012), 'The District Council of Elliston Annual Business Plan and Budget'.
District Council of Franklin Harbour, Annual Report 2011/2012.
District Council of Kimba, BUDGET 2011/2012.
District Council of Lower Eyre Peninsula (2012), Annual Business Plan – 2012/13.
District Council of Streaky Bay (2012), Annual Business plan 2012-2013.
District Council of Tumby Bay, 2012/13 Annual Business Plan.
England, C (2013), 'Increased demand behind graphite projects push in South Australia ', The Advertiser, 29th April.
Ewendt, N (2013), 'Companies turning attention to graphite', The Port Lincoln Times, 15th January.
Eyre Iron Pty. Ltd., Carrow, http://www.eyreiron.com.au/aspx/carrow.shtml.
Eyre Peninsula Mining Alliance, Frequently Asked Questions, http://epma.com.au/frequently-asked-questions/?doing_wp_cron=1373522228.1329948902130126953125.
Golder Associates (2012), Port Spencer Stage 1: Response to PER submissions, Appendix A: Port Spencer Stage 1 Regulator and Public Submissions.
Government of South Australia (2006), “Understanding Residential Densities: A Pictorial Handbook of Adelaide Examples”, November.
Government of Western Australia, Department of Mines and Petroleum, (2011/12), Quick resource facts, Private new capital investment, retrieved from: http://www.dmp.wa.gov.au/7846.aspx
Geoscience Australia 2012, Australian Atlas of Minerals Resources, Mines and Processing Centres, http://www.australianminesatlas.gov.au/?site=atlas.
.id & National Economics (2013), National Economic Indicators Series, viewed 15/05/2013, retrieved from: http://economic-indicators.id.com.au/?es=6

Impact of Mining and Resource Development: A Case Study for Eyre Peninsula Councils Page 79
The SA Centre for Economic Studies July 2013
Iluka Resources (2013), Jacinth Ambrosia fact sheet, retrieved from: http://www.iluka.com/docs/3.3-operations/jacinth-ambrosia-fact-sheet-2013.pdf?sfvrsn=2
_______________ (2012), Projects, viewed 22/01/2013, http://www.iluka.com/company-overview/projects.
Ironclad Mining Limited, 25th March 2011, “Ironclad lets $4.7 million contract for Wilcherry Hill Kimba Mine Village” ASX release, retrieved from: http://www.aspecthuntley.com.au/asxdata/20110325/pdf/01165233.pdf
_______________ (2013), Wilcherry Hill, viewed 22/01/2013, http://www.ironcladmining.com/.
_______________ (2013), Hercules, viewed 22/01/2013, http://www.ironcladmining.com/.
Iron Road Limited (2012a), 'Central Eyre Iron Project A Closer Look', Community update and discussion Lock, South Australia.
_______________ (2012b), 'ASX Release and Media Announcement. Iron Road Announces Proposed Export Solution', Retrieved from http://plrara.com.au/wp-content/uploads/2012/12/Iron-Road-ASX-Media-Announcement.pdf.
_______________ (2012), Central Eyre Iron Project, http://www.ironroadlimited.com.au/central-eyre-iron-project.html viewed 22/01/2013.
Lincoln Minerals (2011), Gum Flat, viewed 22/01/2013, http://www.lincolnminerals.com.au/projects.php?body_id=2?project=Gum%20Flat.
Minotaur Exploration (2012), Poochera Kaolin Project, viewed 22/01/2013, http://www.minotaurexploration.com.au/development/poochera-kaolin-project.
_______________ (2012), Purdilla Gypsum Project - South Australia, viewed 22/01/2013, http://www.minotaurexploration.com.au/exploration-australia/purdilla-gypsum
Norton Rose (2012), 'A guide to developing mining projects in Australia'.
Petkova-Timmer, V, Lockie, S, Rolfe, J & Ivanova, G (2009), 'Mining developments and social impacts on communities: Bowen Basin case studies', Rural Society, vol. 19, no. 3, pp. 211-228.
Petkova-Timmer, V & Rolfe, J (2007), Impacts of Mining on Businesses in Moranbah.
Pham, TD, Bailey, G, Marshall, J, Spurr, R & Dwyer, L (2013), The economic impact of the current mining boom on the Australian tourism industry, Tourism Research Australia, Canberra.
Resource and Engineering Skills Alliance (2011), “Workforce study for the Resources Sector in the Eyre Peninsula”, prepared for the South Australian Training and Skills Commission, October.
Regional Development Australia, Whyalla and Eyre Peninsula (2013), “Sheep Hill – Eastern Eyre Export Port Facility”, retrieved from: http://www.eyreregion.com.au/doing-business/major-projects/sheep-hilleastern-eyre-export-port-facility
_______________ (2012), Regional Plan, retrieved from: http://www.eyreregion.com.au/images/stories/PDFs/RDAWEP%20Regional%20Plan%202012-Final.pdf
Russell, C (2012), 'Centrex' port proposal, backed by Chinese partner wins SA government approval 250 jobs to be created', The Advertiser, 20th December
_______________ (2013), 'Rival explorers Iron Road and Centrex told they must work together to build one port', The Advertiser, 15th February
SCRGSP (Steering Committee for the Review of Government Service Provision) (2013), Report on Government Services 2013, Productivity Commission, Canberra.
Sinclair Knight Merz (2008), Wilgerup Iron Ore Mining Proposal, commissioned by Centrex Metals Limited.
Storey, K. (2010), “Fly-in/Fly-out and Fly-Over: Mining and regional development in Western Australia”, Australian Geographer, Vol 32 (2), pp 133-148
South Australian Centre for Economic Studies (SACES) (2012), “Economic Briefing Report”, June, Vol 30 (1).
_______________ (2012), “Whyalla and Eyre Peninsula Regional Profile”, commissioned by the Local Government Association of South Australia.
Terramin Australia (2008), Menninnie Zinc Project, http://www.terramin.com.au/projects/menninnie/default.aspx viewed 22/01/2013.
Tumby Bay (2012), “Sustainable Future Structure Plan Consultation Report”, Prepared by Master plan town and country planners.

Page 80 Impact of Mining and Resource Development: A Case Study for Eyre Peninsula Councils
July 2013 The SA Centre for Economic Studies
Uranium SA (2013), Frequently Asked Questions, http://www.uraniumsa.com.au/projects/faqs.html viewed 28/06/2013.
_______________ (2011), Retention Lease Proposal on Mineral Claim 4280 for a Uranium In-situ Recovery Field Trial.
Wudinna District Council, 2012/13 Financial Budget.

Impact of Mining and Resource Development: A Case Study for Eyre Peninsula Councils Page 81
The SA Centre for Economic Studies July 2013
Appendix A – Projections for Local Government Areas
Tumby Bay
Table A.1: Number of new homes constructed by year - incremental
Year
Number of dwellings required by year - incremental
Baseline growth
Mining development Additional homes due to mining
development
Scenario 1 Scenario 2 Scenario 3 Scenario 1 Scenario 2 Scenario 3
2011
2013 0 0 0 0 0 0 0
2016 3 353 353 353 351 351 351
2021 4 4 4 4 0 0 0
2026 4 4 4 4 0 0 0
Total homes required to 2026 11 362 362 362 351 351 351
Note: Totals may not add due to rounding. Source: SACES calculations.
Table A.2: Hectares of residential land required by 2026 based on net density
Hectares of residential land required based on net density – 2026
Baseline growth
Mining development
Scenario 1 Scenario 2 Scenario 3
Very low density 1.4 45.2 45.2 45.2
Low density 0.9 29.0 29.0 29.0
Source: SACES assumptions.
Table A.3: Additional rates revenue received based in 2012/13 dollars - incremental
Year
Additional rates revenue received based in 2012/13 dollar - incremental
Baseline growth
Mining development Additional rates revenue due to mining
development
Scenario 1 Scenario 2 Scenario 3 Scenario 1 Scenario 2 Scenario 3
2016 2,329 315,481 315,481 315,481 313,152 313,152 313,152
2021 3,897 3,897 3,897 3,897 0 0 0
2026 3,916 3,916 3,916 3,916 0 0 0
Total 10,142 323,295 323,295 323,294 313,152 313,152 313,152
Source: SACES calculations.

Page 82 Impact of Mining and Resource Development: A Case Study for Eyre Peninsula Councils
July 2013 The SA Centre for Economic Studies
Wudinna Table A.4: Number of new homes constructed by year - incremental
Year
Number of dwellings required by year - incremental
Baseline growth
Mining development Additional homes due to mining
development
Scenario 1 Scenario 2 Scenario 3 Scenario 1 Scenario 2 Scenario 3
2011
2013 0 0 0 0 0 0 0
2016 0 0 0 0 0 0 0
2021 0 329 329 329 329 329 329
2026 0 0 0 0 0 0 0
Total homes required to 2026 0 329 329 329 329 329 329
Note: Totals may not add due to rounding. Source: SACES calculations.
Table A.5: Hectares of residential land required by 2026 based on net density
Hectares of residential land required based on net density – 2026
Baseline growth
Mining development
Scenario 1 Scenario 2 Scenario 3
Very low density 0.0 41.2 41.2 41.2
Low density 0.0 26.4 26.4 26.4
Source: SACES assumptions.
Table A.6: Additional rates revenue received based in 2012/13 dollars - incremental
Year
Additional rates revenue received based in 2012/13 dollar - incremental
Baseline growth
Mining development Additional rates revenue due to mining
development
Scenario 1 Scenario 2 Scenario 3 Scenario 1 Scenario 2 Scenario 3
2016 0 0 0 0 0 0 0
2021 0 191,978 191,978 191,978 191,978 191,978 191,978
2026 0 0 0 0 0 0 0
Total 0 191,978 191,978 191,978 191,978 191,978 191,978
Source: SACES calculations.
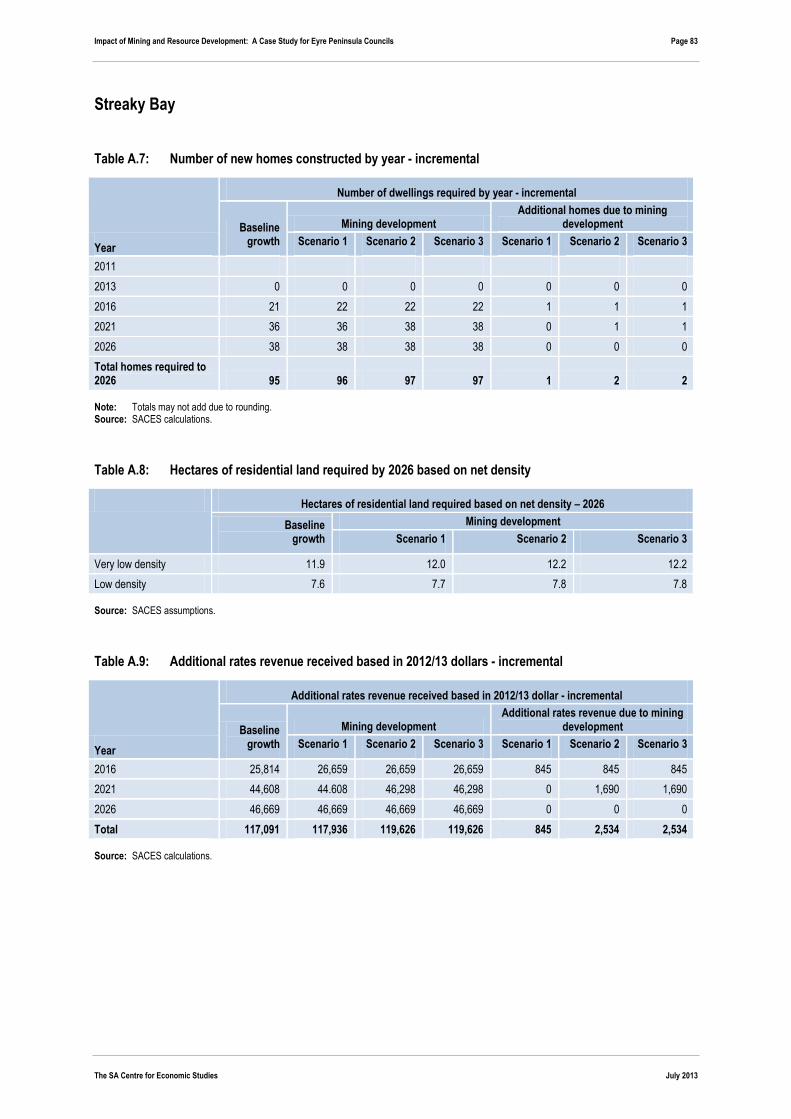
Impact of Mining and Resource Development: A Case Study for Eyre Peninsula Councils Page 83
The SA Centre for Economic Studies July 2013
Streaky Bay Table A.7: Number of new homes constructed by year - incremental
Year
Number of dwellings required by year - incremental
Baseline growth
Mining development Additional homes due to mining
development
Scenario 1 Scenario 2 Scenario 3 Scenario 1 Scenario 2 Scenario 3
2011
2013 0 0 0 0 0 0 0
2016 21 22 22 22 1 1 1
2021 36 36 38 38 0 1 1
2026 38 38 38 38 0 0 0
Total homes required to 2026 95 96 97 97 1 2 2
Note: Totals may not add due to rounding. Source: SACES calculations.
Table A.8: Hectares of residential land required by 2026 based on net density
Hectares of residential land required based on net density – 2026
Baseline growth
Mining development
Scenario 1 Scenario 2 Scenario 3
Very low density 11.9 12.0 12.2 12.2
Low density 7.6 7.7 7.8 7.8
Source: SACES assumptions.
Table A.9: Additional rates revenue received based in 2012/13 dollars - incremental
Year
Additional rates revenue received based in 2012/13 dollar - incremental
Baseline growth
Mining development Additional rates revenue due to mining
development
Scenario 1 Scenario 2 Scenario 3 Scenario 1 Scenario 2 Scenario 3
2016 25,814 26,659 26,659 26,659 845 845 845
2021 44,608 44.608 46,298 46,298 0 1,690 1,690
2026 46,669 46,669 46,669 46,669 0 0 0
Total 117,091 117,936 119,626 119,626 845 2,534 2,534
Source: SACES calculations.
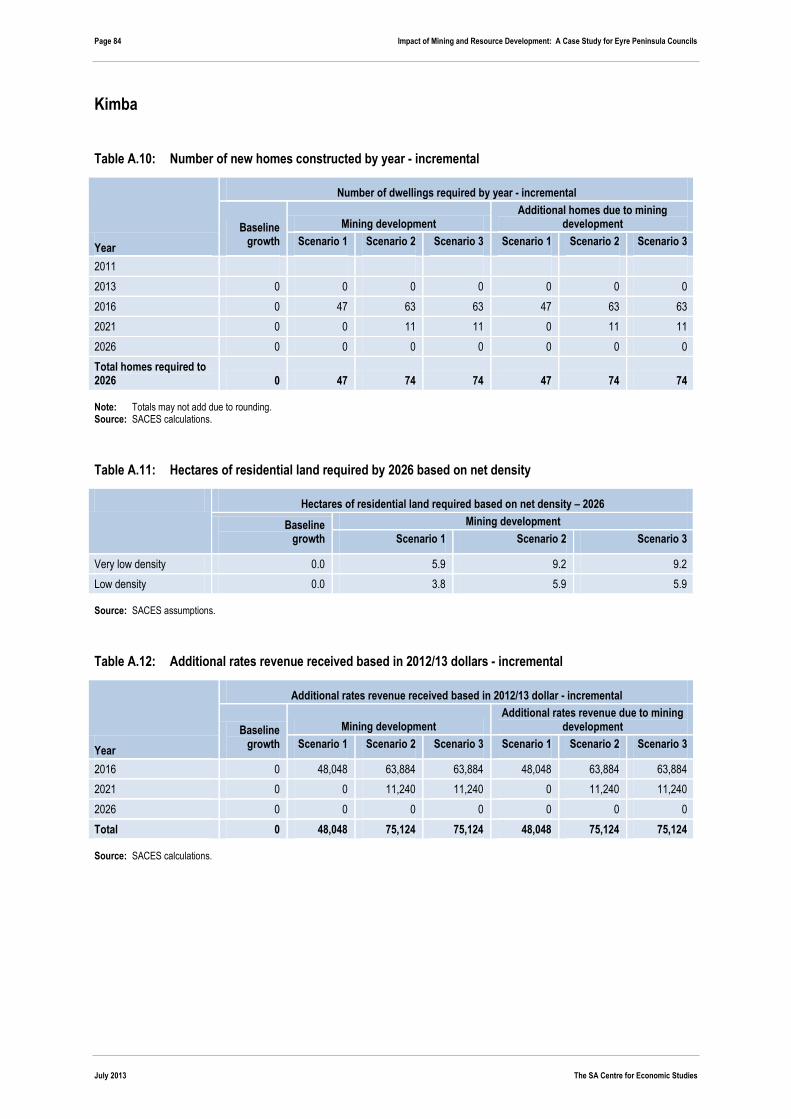
Page 84 Impact of Mining and Resource Development: A Case Study for Eyre Peninsula Councils
July 2013 The SA Centre for Economic Studies
Kimba Table A.10: Number of new homes constructed by year - incremental
Year
Number of dwellings required by year - incremental
Baseline growth
Mining development Additional homes due to mining
development
Scenario 1 Scenario 2 Scenario 3 Scenario 1 Scenario 2 Scenario 3
2011
2013 0 0 0 0 0 0 0
2016 0 47 63 63 47 63 63
2021 0 0 11 11 0 11 11
2026 0 0 0 0 0 0 0
Total homes required to 2026 0 47 74 74 47 74 74
Note: Totals may not add due to rounding. Source: SACES calculations.
Table A.11: Hectares of residential land required by 2026 based on net density
Hectares of residential land required based on net density – 2026
Baseline growth
Mining development
Scenario 1 Scenario 2 Scenario 3
Very low density 0.0 5.9 9.2 9.2
Low density 0.0 3.8 5.9 5.9
Source: SACES assumptions.
Table A.12: Additional rates revenue received based in 2012/13 dollars - incremental
Year
Additional rates revenue received based in 2012/13 dollar - incremental
Baseline growth
Mining development Additional rates revenue due to mining
development
Scenario 1 Scenario 2 Scenario 3 Scenario 1 Scenario 2 Scenario 3
2016 0 48,048 63,884 63,884 48,048 63,884 63,884
2021 0 0 11,240 11,240 0 11,240 11,240
2026 0 0 0 0 0 0 0
Total 0 48,048 75,124 75,124 48,048 75,124 75,124
Source: SACES calculations.

Impact of Mining and Resource Development: A Case Study for Eyre Peninsula Councils Page 85
The SA Centre for Economic Studies July 2013
Franklin Harbour Table A.13: Number of new homes constructed by year - incremental
Year
Number of dwellings required by year - incremental
Baseline growth
Mining development Additional homes due to mining
development
Scenario 1 Scenario 2 Scenario 3 Scenario 1 Scenario 2 Scenario 3
2011
2013 0 0 0 0 0 0 0
2016 0 0 0 0 0 0 0
2021 0 393 393 393 393 393 393
2026 0 0 0 0 0 0 0
Total homes required to 2026 0 393 393 393 393 393 393
Note: Totals may not add due to rounding. Source: SACES calculations.
Table A.14: Hectares of residential land required by 2026 based on net density
Hectares of residential land required based on net density – 2026
Baseline growth
Mining development
Scenario 1 Scenario 2 Scenario 3
Very low density 0.0 49.1 49.1 49.1
Low density 0.0 31.4 31.4 31.4
Source: SACES assumptions.
Table A.15: Additional rates revenue received based in 2012/13 dollars - incremental
Year
Additional rates revenue received based in 2012/13 dollar - incremental
Baseline growth
Mining development Additional rates revenue due to mining
development
Scenario 1 Scenario 2 Scenario 3 Scenario 1 Scenario 2 Scenario 3
2016 0 0 0 0 0 0 0
2021 0 116,518 116,518 116,518 116,518 116,518 116,518
2026 0 0 0 0 0 0 0
Total 0 116,518 116,518 116,518 116,518 116,518 116,518
Source: SACES calculations.

Page 86 Impact of Mining and Resource Development: A Case Study for Eyre Peninsula Councils
July 2013 The SA Centre for Economic Studies
Elliston Table A.16: Number of new homes constructed by year - incremental
Year
Number of dwellings required by year - incremental
Baseline growth
Mining development Additional homes due to mining
development
Scenario 1 Scenario 2 Scenario 3 Scenario 1 Scenario 2 Scenario 3
2011
2013 0 0 0 0 0 0 0
2016 0 38 38 38 38 38 38
2021 0 0 0 0 0 0 0
2026 0 0 0 0 0 0 0
Total homes required to 2026 0 38 38 38 38 38 38
Note: Totals may not add due to rounding. Source: SACES calculations.
Table A.17: Hectares of residential land required by 2026 based on net density
Hectares of residential land required based on net density – 2026
Baseline growth
Mining development
Scenario 1 Scenario 2 Scenario 3
Very low density 0.0 4.7 4.7 4.7
Low density 0.0 3.0 3.0 3.0
Source: SACES assumptions.
Table A.18: Additional rates revenue received based in 2012/13 dollars - incremental
Year
Additional rates revenue received based in 2012/13 dollar - incremental
Baseline growth
Mining development Additional rates revenue due to mining
development
Scenario 1 Scenario 2 Scenario 3 Scenario 1 Scenario 2 Scenario 3
2016 0 45,674 45,674 45,674 45,674 45,674 45,674
2021 0 0 0 0 0 0 0
2026 0 0 0 0 0 0 0
Total 0 45,674 45,674 45,674 45,674 45,674 45,674
Source: SACES calculations.

Impact of Mining and Resource Development: A Case Study for Eyre Peninsula Councils Page 87
The SA Centre for Economic Studies July 2013
Cleve Table A.19: Number of new homes constructed by year - incremental
Year
Number of dwellings required by year - incremental
Baseline growth
Mining development Additional homes due to mining
development
Scenario 1 Scenario 2 Scenario 3 Scenario 1 Scenario 2 Scenario 3
2011
2013 0 0 0 0 0 0 0
2016 0 0 0 0 0 0 0
2021 0 0 0 0 0 0 0
2026 0 0 0 0 0 0 0
Total homes required to 2026 0 0 0 0 0 0 0
Note: Totals may not add due to rounding. Source: SACES calculations.
Table A.20: Hectares of residential land required by 2026 based on net density
Hectares of residential land required based on net density – 2026
Baseline growth
Mining development
Scenario 1 Scenario 2 Scenario 3
Very low density 0.0 0.0 0.0 0.0
Low density 0.0 0.0 0.0 0.0
Source: SACES assumptions.
Table A.21: Additional rates revenue received based in 2012/13 dollars - incremental
Year
Additional rates revenue received based in 2012/13 dollar - incremental
Baseline growth
Mining development Additional rates revenue due to mining
development
Scenario 1 Scenario 2 Scenario 3 Scenario 1 Scenario 2 Scenario 3
2016 0 0 0 0 0 0 0
2021 0 0 0 0 0 0 0
2026 0 0 0 0 0 0 0
Total 0 0 0 0 0 0 0
Source: SACES calculations.

Page 88 Impact of Mining and Resource Development: A Case Study for Eyre Peninsula Councils
July 2013 The SA Centre for Economic Studies
Lower Eyre Peninsula Table A.22: Number of new homes constructed by year - incremental
Year
Number of dwellings required by year - incremental
Baseline growth
Mining development Additional homes due to mining
development
Scenario 1 Scenario 2 Scenario 3 Scenario 1 Scenario 2 Scenario 3
2011
2013 0 0 0 0 0 0 0
2016 95 95 95 95 0 0 0
2021 170 170 170 170 0 0 0
2026 186 186 186 186 0 0 0
Total homes required to 2026 452 452 452 452 0 0 0
Note: Totals may not add due to rounding. Source: SACES calculations.
Table A.23: Hectares of residential land required by 2026 based on net density
Hectares of residential land required based on net density – 2026
Baseline growth
Mining development
Scenario 1 Scenario 2 Scenario 3
Very low density 56.5 56.5 56.5 56.5
Low density 36.1 36.1 36.1 36.1
Source: SACES assumptions.
Table A.24: Additional rates revenue received based in 2012/13 dollars - incremental
Year
Additional rates revenue received based in 2012/13 dollar - incremental
Baseline growth
Mining development Additional rates revenue due to mining
development
Scenario 1 Scenario 2 Scenario 3 Scenario 1 Scenario 2 Scenario 3
2016 103,024 103,024 103,024 103,024 0 0 0
2021 184,055 184,055 184,055 184,055 0 0 0
2026 200,695 200,695 200,695 200,695 0 0 0
Total 487,774 487,774 487,774 487,774 0 0 0
Source: SACES calculations.
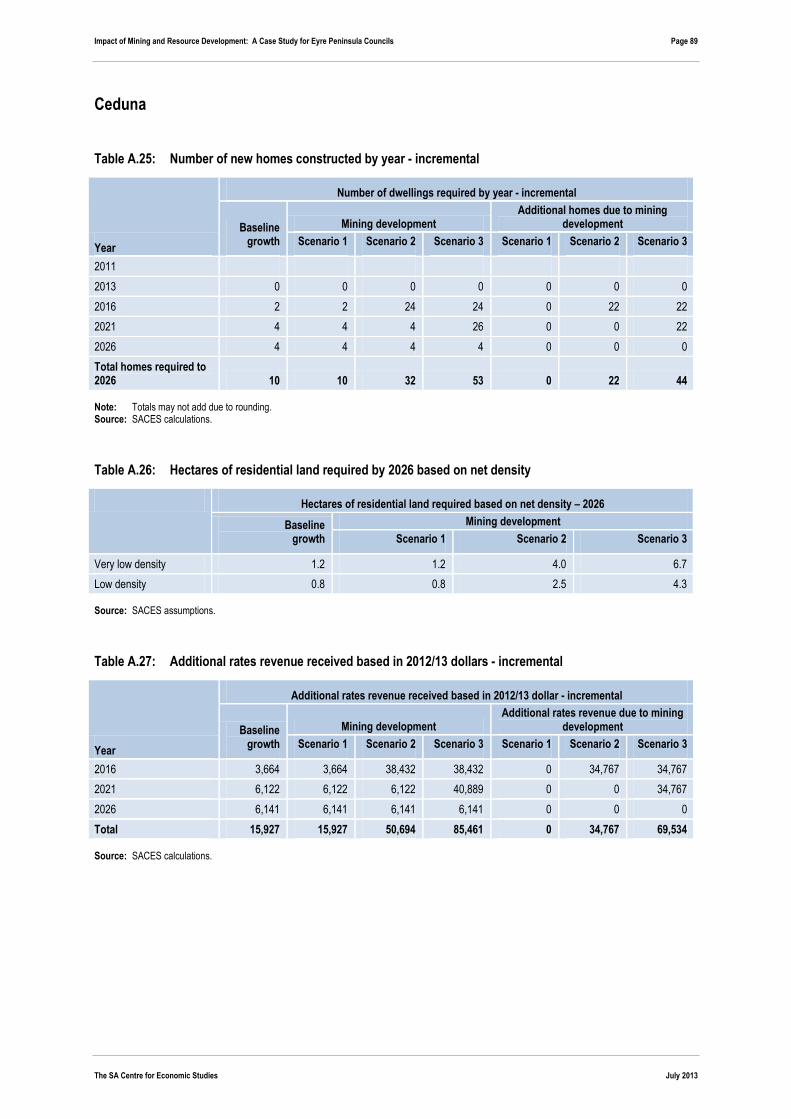
Impact of Mining and Resource Development: A Case Study for Eyre Peninsula Councils Page 89
The SA Centre for Economic Studies July 2013
Ceduna Table A.25: Number of new homes constructed by year - incremental
Year
Number of dwellings required by year - incremental
Baseline growth
Mining development Additional homes due to mining
development
Scenario 1 Scenario 2 Scenario 3 Scenario 1 Scenario 2 Scenario 3
2011
2013 0 0 0 0 0 0 0
2016 2 2 24 24 0 22 22
2021 4 4 4 26 0 0 22
2026 4 4 4 4 0 0 0
Total homes required to 2026 10 10 32 53 0 22 44
Note: Totals may not add due to rounding. Source: SACES calculations.
Table A.26: Hectares of residential land required by 2026 based on net density
Hectares of residential land required based on net density – 2026
Baseline growth
Mining development
Scenario 1 Scenario 2 Scenario 3
Very low density 1.2 1.2 4.0 6.7
Low density 0.8 0.8 2.5 4.3
Source: SACES assumptions.
Table A.27: Additional rates revenue received based in 2012/13 dollars - incremental
Year
Additional rates revenue received based in 2012/13 dollar - incremental
Baseline growth
Mining development Additional rates revenue due to mining
development
Scenario 1 Scenario 2 Scenario 3 Scenario 1 Scenario 2 Scenario 3
2016 3,664 3,664 38,432 38,432 0 34,767 34,767
2021 6,122 6,122 6,122 40,889 0 0 34,767
2026 6,141 6,141 6,141 6,141 0 0 0
Total 15,927 15,927 50,694 85,461 0 34,767 69,534
Source: SACES calculations.

Page 90 Impact of Mining and Resource Development: A Case Study for Eyre Peninsula Councils
July 2013 The SA Centre for Economic Studies
Port Lincoln Table A.28: Number of new homes constructed by year - incremental
Year
Number of dwellings required by year - incremental
Baseline growth
Mining development Additional homes due to mining
development
Scenario 1 Scenario 2 Scenario 3 Scenario 1 Scenario 2 Scenario 3
2011
2013 0 0 0 0 0 0 0
2016 67 67 67 67 0 0 0
2021 113 113 113 113 0 0 0
2026 115 115 115 115 0 0 0
Total homes required to 2026 295 295 295 295 0 0 0
Note: Totals may not add due to rounding. Source: SACES calculations.
Table A.29: Hectares of residential land required by 2026 based on net density
Hectares of residential land required based on net density – 2026
Baseline growth
Mining development
Scenario 1 Scenario 2 Scenario 3
Very low density 36.9 36.9 36.9 36.9
Low density 23.6 23.6 23.6 23.6
Source: SACES assumptions.
Table A.30: Additional rates revenue received based in 2012/13 dollars - incremental
Year
Additional rates revenue received based in 2012/13 dollar - incremental
Baseline growth
Mining development Additional rates revenue due to mining
development
Scenario 1 Scenario 2 Scenario 3 Scenario 1 Scenario 2 Scenario 3
2016 60,032 60,032 60,032 60,032 0 0 0
2021 101,816 101,816 101,816 101,816 0 0 0
2026 104,062 104,062 104,062 104,062 0 0 0
Total 265,910 265,910 265,910 265,910 0 0 0
Source: SACES calculations.
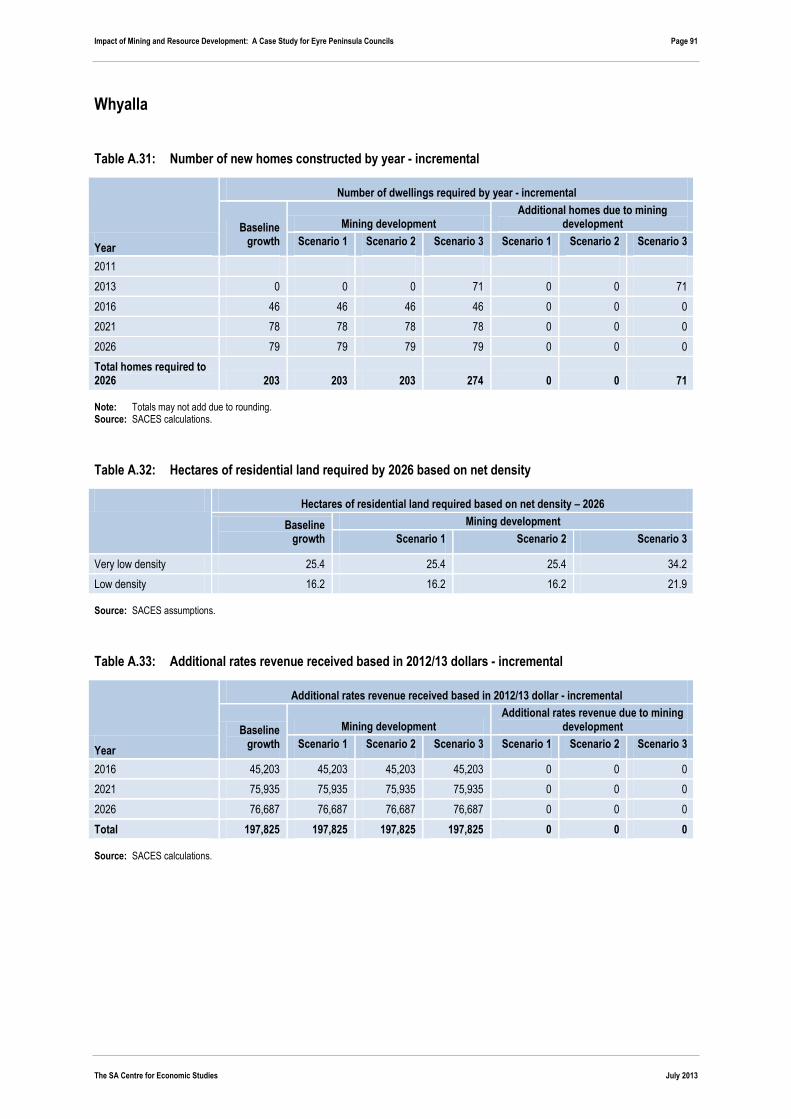
Impact of Mining and Resource Development: A Case Study for Eyre Peninsula Councils Page 91
The SA Centre for Economic Studies July 2013
Whyalla Table A.31: Number of new homes constructed by year - incremental
Year
Number of dwellings required by year - incremental
Baseline growth
Mining development Additional homes due to mining
development
Scenario 1 Scenario 2 Scenario 3 Scenario 1 Scenario 2 Scenario 3
2011
2013 0 0 0 71 0 0 71
2016 46 46 46 46 0 0 0
2021 78 78 78 78 0 0 0
2026 79 79 79 79 0 0 0
Total homes required to 2026 203 203 203 274 0 0 71
Note: Totals may not add due to rounding. Source: SACES calculations.
Table A.32: Hectares of residential land required by 2026 based on net density
Hectares of residential land required based on net density – 2026
Baseline growth
Mining development
Scenario 1 Scenario 2 Scenario 3
Very low density 25.4 25.4 25.4 34.2
Low density 16.2 16.2 16.2 21.9
Source: SACES assumptions.
Table A.33: Additional rates revenue received based in 2012/13 dollars - incremental
Year
Additional rates revenue received based in 2012/13 dollar - incremental
Baseline growth
Mining development Additional rates revenue due to mining
development
Scenario 1 Scenario 2 Scenario 3 Scenario 1 Scenario 2 Scenario 3
2016 45,203 45,203 45,203 45,203 0 0 0
2021 75,935 75,935 75,935 75,935 0 0 0
2026 76,687 76,687 76,687 76,687 0 0 0
Total 197,825 197,825 197,825 197,825 0 0 0
Source: SACES calculations.

Page 92 Impact of Mining and Resource Development: A Case Study for Eyre Peninsula Councils
July 2013 The SA Centre for Economic Studies
Appendix B – Statistical Subdivision & Statistical Local Areas

Impact of Mining and Resource Development: A Case Study for Eyre Peninsula Councils Page 93
The SA Centre for Economic Studies July 2013

Impact of Mining and Resource Development: A Case Study for Eyre Peninsula Councils Page 94
The SA Centre for Economic Studies July 2013
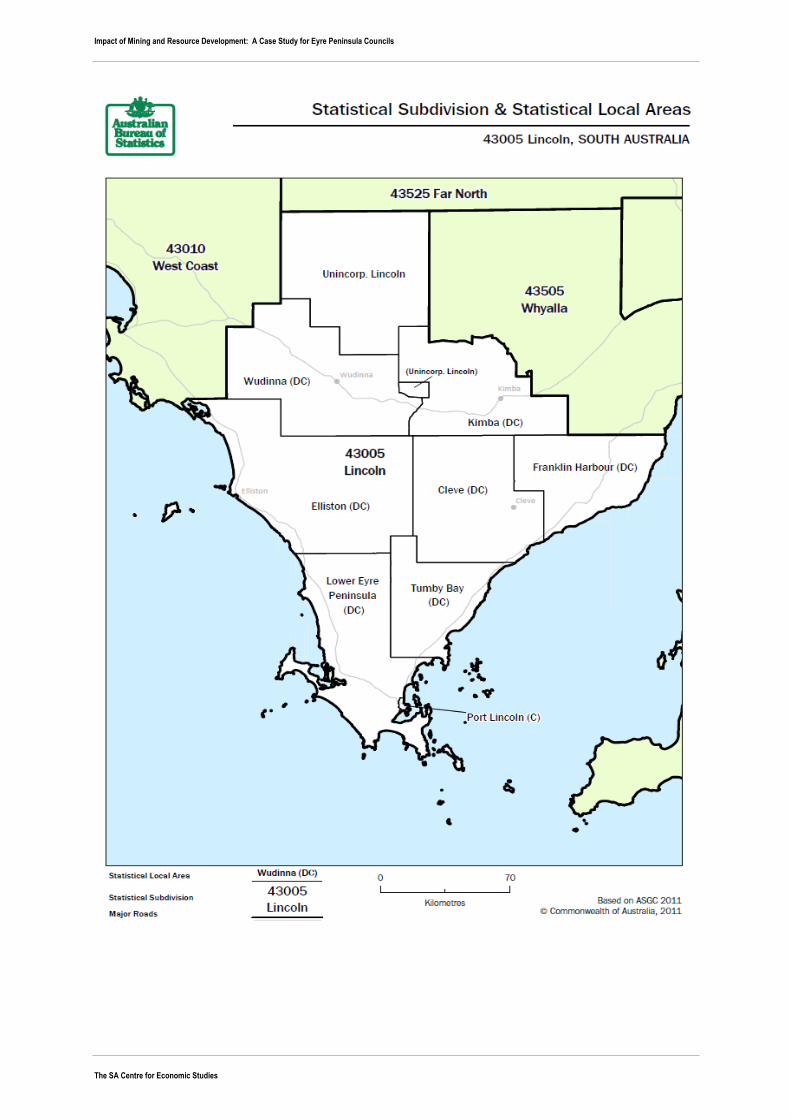
Impact of Mining and Resource Development: A Case Study for Eyre Peninsula Councils Page 95
The SA Centre for Economic Studies July 2013