impact of mechanical loading on the corrosion of steel ... · impact of mechanical loading on the...
TRANSCRIPT
ORIGINAL ARTICLE
Impact of mechanical loading on the corrosion of steelreinforcement in concrete structures
Ayman Ababneh • Mashal Sheban
Received: 11 January 2010 / Accepted: 5 November 2010 / Published online: 23 November 2010
� RILEM 2010
Abstract This paper presents results of an experi-
mental investigation on the effect of mechanical
loading on the corrosion of steel reinforcement in
concrete. Reinforced concrete beams were cast,
subjected to mechanical loadings and then exposed
to corrosive environment. Successive drying and
wetting cycles using 3% sodium chloride salt solution
were used to accelerate the corrosion attack. Elec-
trochemical techniques such as macrocell corrosion
current, linear polarization resistance (LPR), corro-
sion potential (Ecorr) and electrochemical imped-
ance spectroscopic (EIS), were used to evaluate the
corrosion behavior of the reinforcement. Also, chlo-
ride penetration profile and visual inspection of the
beam rebars were obtained. The results shows that the
pre-exposure mechanical load has no influence on
the corrosion initiation or corrosion rate thereafter,
unless it reaches to some limit where it develops
connected cracks through which the chloride ions
flow and depassivate the rebars. The load of 25% of
the ultimate capacity seems to be the critical load
limit where some microcracks onset to be connected,
facilitate the chloride ions flow, and initiate the rebar
corrosion.
Keywords Loading � Corrosion � Steel � LPR �EIS � Concrete
1 Introduction
Corrosion of steel reinforcement is a major deterio-
ration mechanism for concrete structures in cold,
marine, and industrial environments. Corrosion dam-
age accelerates the aging of highway bridges,
concrete pavements, parking structures, waterfront
structures, and water and wastewater treatment
structures. This, in turn, shortens their remaining
service life, requires expenditures for maintenance,
repair or replacement, endangers the public safety,
and damages the environment. Corrosion of steel
reinforcement is a major deterioration mechanism for
the infrastructure systems worldwide, and the cou-
pling between the corrosion and mechanical loading
induced damage is expected to accelerate the
deterioration.
The interaction between applied mechanical load-
ing or loading capacity and reinforcement corrosion
were studied from two different views. It is well
known that the corrosion of reinforcing rebars
reduces the strength and stiffness, steel–concrete
A. Ababneh (&)
Department of Civil Engineering, Jordan University
of Science and Technology, P.O. Box 3030,
Irbid 22110, Jordan
e-mail: [email protected]
M. Sheban
Department of Civil Engineering, Hadramout University
of Science and Technology, P.O. Box 50512-50511,
Mukalla, Yemen
e-mail: [email protected]
Materials and Structures (2011) 44:1123–1137
DOI 10.1617/s11527-010-9688-3
bond strength and the cross sectional area of the
rebar. Therefore, a reduction in load carrying capac-
ity, resistance to excessive deformation, and resis-
tance to cracking clearly result from steel corrosion
[1–6]. On the other hand, in studies of the impact of
loading and cracking on the corrosion process of
reinforced concrete structures, researchers have
observed contradictory results. Benture et al. [7]
and Li [8] showed that the increase of the crack width
accelerates the time required to initiate the steel
corrosion, but it has no significant effect on the
corrosion rate thereafter. Jacobsen et al. [9] and
Francois et al. [10] showed that the development of
reinforcement corrosion was not influenced by crack
width (up to 0.5 mm). Castel et al. [11] and Francois
and Maso [12] found that the damage in the tensile
zone increase the carbonation and chloride penetra-
tion, but the penetration of carbonation was less than
20 mm after 13 years of loading and whenever the
crack opening, the penetration of harmful materials
locally occurs. However, Yoon et al. [13] showed that
the loading level and loading-induced cracks have
significant effects on both corrosion initiation and the
rate of corrosion propagation. Also, Kondratova et al.
[14] noticed that pre-cracking increased the corrosion
rate. The effect of mechanical loading and damage on
propagation of reinforcement corrosion needs more
studies to overcome this contradiction.
This research studied the impact of mechanical
loading on corrosion of steel reinforcement in concrete
structures. In this study, reinforced concrete beams
were cast, and mechanical loadings were applied on
the beams before exposed to the corrosive environ-
ment. The electrochemical techniques, i.e., macrocell
corrosion current, linear polarization resistance (LPR),
corrosion potential (Ecorr) and electrochemical imped-
ance spectroscopic (EIS), were used to evaluate the
corrosion behavior of the reinforcement. The results
show that the pre-exposure mechanical load has no
influence on the corrosion initiation or corrosion rate
thereafter, unless it reaches to some limit where it
develops connected cracks through which the chloride
ions flow and depassivate the rebar.
2 Experimental program
This section describes the laboratory experimental
program which was used to evaluate the effect of
mechanical loading on corrosion of reinforcing rebar.
The experimental procedure is similar to that outlined
in ASTM G109_99a with some modifications. The
material properties and mix proportion of concrete
are presented. The dimensions of specimens and the
exposure condition are discussed in the following
subsections.
2.1 Materials
2.1.1 Aggregate
Crushed stone with a maximum size of 9 mm was
used as coarse aggregates. The moisture content
was 0.09% in accordance to ASTM C566. The bulk
specific gravity (SSD) was 2.393, oven dry bulk
specific gravity was 2.361, and the absorption capac-
ity was 1.38% in accordance to ASTM C127. The dry
rodded unit weight was 1594.6 kg/m3 in accordance
to ASTM C29. The coarse aggregates met the
standard gradation requirements as specified in ASTM
C33.
Graded river sand was used as a fine aggregate
with the fineness modulus equal to 2.54 in accordance
to ASTM C136. The moisture content was 0.08% in
accordance to ASTM C566. The bulk specific gravity
(SSD) was 2.648, oven dry bulk specific gravity was
2.621, and the absorption capacity was 1.05% in
accordance to ASTM C127. The fine aggregates met
the standard gradation requirements as specified in
ASTM C33.
2.1.2 Cement
Type I Portland cement was used for all mixes
described in this study. The cement specific gravity
was 3.2 and the compound composition is: C3S =
51% and C3A = 8%. Table 1 provides a summary of
the cement composition as supplied by the manu-
facturer.
2.1.3 Steel rebars
The steel reinforcement was grade 60 deformed rebar
(ASTM A615) with diameter 0.5 in (12.5 mm). The
rebars were sand blasted to near white metal, cleaned
by soaking in acetone and allowed to air dry
according to ASTM G109_99a.
1124 Materials and Structures (2011) 44:1123–1137

2.2 Dimension of specimens
The specimen geometry used in this study is a concrete
beam; the beam has dimension of 11 9 6 9 4.5 in
(280 9 150 9 115 mm). Three rebars were installed
in each beam. The bar length was 14 in (360 mm)
drilled at one end to be fitted with a stainless steel
screw. Both ends of each bar were taped with
electroplater tape so that only an 8 in (200 mm)
portion at the middle of the rebar was bare. Therefore,
the exposure surface area was 12.57 in2 (8107 mm2).
Then neoprene tubes were placed on both ends, and
the neoprene tubes were filled with epoxy from both
sides.
2.3 Mixing proportion and curing condition
Normal concrete strength was used in this study
with w/c ratio 0.55. The mixing proportion ratio was
1:0.55:2:2 of water:cement:fine aggregate:coarse
aggregate (dry weight). The coarse aggregate and
one third of the mixing water was added prior to
starting the rotation of the mixer. Then, the mixer was
started and the fine aggregate, cement, and water were
added with the mixer running. The mixer was run for
3 min, followed by 3 min rest and then by 2 min of
final mixing. The concrete was placed in the molds
with three layers for beam specimens and two layers
for the cylinders; each layer was rodded uniformly 25
times with the rounded end of the rod. To prevent
evaporation of water from unhardened concrete, all
samples were covered with plastic and maintained at
standard room temperature. After 24 h, all specimens
were demolded and cured for 28 days in a moist curing
room where the relative humidity was higher than
95%. The mixing procedure was done according to
ASTM C192, and the curing procedure was done
according to ASTM C511. The average compressive
strength results of 300 9 600 cylinders are shown in
Table 2.
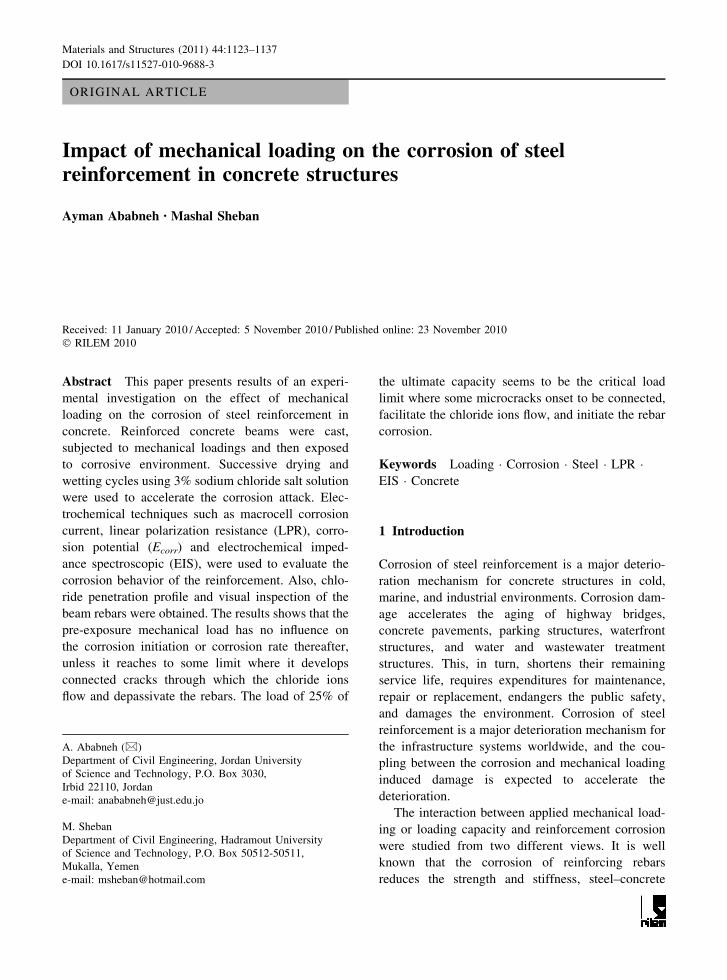
2.4 Pre-exposure loading
Four different types of loading were applied on the
beams before exposure to a corrosive environment.
The first case was three-point bending load, and the
loading was 50% of the ultimate capacity; for
simplicity, it was named 3P50% loading. The second
case was also three-point bending load, but the
loading was 25% of the ultimate capacity; it was
named 3P25% loading. The third case was four-point
bending load, and the loading was 25% of the
ultimate capacity; it was named 4P25% loading. The
last case was no pre-exposure loading condition; it
was named 0P00% loading. The locations of loads for
these cases are shown in Fig. 1. These loading
configurations initiated cracks on the top surface of
the specimen where the corrosive agent was later
applied. The ultimate section capacity of specimens
was calculated based on the step-by-step method
presented in Ersoy et al. [15].
2.5 Exposure test procedure
The corrosive environment was cycles of wetting and
drying with sodium chloride solution to accelerate the
corrosion process; these cycles were applied as
follows. After removing the specimens from the
curing room, the pre-exposure loading was applied.
Then, the specimens were exposed to a constant
humidity of 30 ± 5% relative humidity and at a
constant room temperature inside a humidity con-
trolled chamber. The period of the drying cycle was 2
weeks. Then, a Plexiglas dam was installed on the top
surface, and an epoxy sealer was used to coat the four
sides of the specimen and the top area outside the
Plexiglas dam. This was done to ensure one-direction
of solution intrusion. The ponding dam was filled
with 1.5 inches height of 3% sodium chloride
Table 1 Chemical composition of cement
Silica (SiO2) 20.60%
Alumina (Al2O3) 5.00%
Iron oxide (Fe2O3) 3.10%
Calcium oxide (CaO) 62.4%
Magnesium (MgO) 3.80%
Sulfur trioxide (SO3) 2.90%
Loss of ignition 1.3%
Insoluble residue 0.39%
Equivalent alkali (as Na2O) 0.58%
Table 2 Compressive strength results
Cementitious
materials
7 days
strength
(MPa)
28 days
strength
(MPa)
200 days
strength
(MPa)
365 days
strength
(MPa)
Concrete 20 22 24 25
Materials and Structures (2011) 44:1123–1137 1125
solution (see Fig. 2). The period of wetting cycle was
2 weeks. During the wetting cycles, the ponding dam
was covered to avoid solution evaporation. During
the wetting and drying cycles, the top and bottom
bars were connected by a 100 Ohm resistor to
complete the macrocell circuit where the top bar
worked as an anode and bottom bars as a cathode.
2.6 Experimental series
The effect of the pre-exposure loading was studied in
this research. Two parameters were studied in this
research: loading type, loading value. Four groups of
different combinations of parameters were prepared,
and each group had two replicate beams. Table 3
shows the group names and the experimental series.
3 Corrosion tests
The corrosion activity was measured at the middle of
the wetting cycle according to ASTM G109_99a.
Also, the corrosion potential, LPR and EIS tests were
used to evaluate the corrosion resistance. All these
tests were done once every 4 weeks (at the beginning
of the second week of wetting cycles). The chloride
penetration profiles of specimens also were mea-
sured. The application methods of those tests are
presented in the following sections.
3.1 Macrocell current
When the concrete beam exposed to the chloride salt
solution, the top rebar are typically ones to be
exposed to the chloride ions and moisture. Thus, an
electrochemical macrocell in concrete developed due
to the concentration gradients of moisture and
chloride. As the macrocell is initiated, the top rebar
becomes anodic than the bottom ones becomes
cathodic, and a macrocell corrosion current flows
between them. It is believed that these macrocells are
the major driving force of reinforcement corrosion in
concrete structures [16, 17].
The macrocell current as a function with time was
monitored once every 4 weeks (at the beginning of
the second week of wetting cycles). The macrocell
current, Ij, calculated from the voltage, Vj, across the
100-Ohm resistor as follows:
Ij ¼Vj
100ð1Þ
The total integrated current is defined in ASTM
G109_99a as follows:
TCj ¼ TCj�1 þ tj � tj�1
� �� Ij � Ij�1
� �=2
� �ð2Þ
where TC is the total corrosion (Coulombs), tj is the
time (s) at which measurement of the macrocell
current is carried out, and Ij is the macrocell current
at time tj.
3.2 Corrosion potential
The corrosion potential of each bar in the specimens
was measured against the saturated calomel electrode
(SCE) as a reference electrode which was placed in
the dam containing the salt solution.
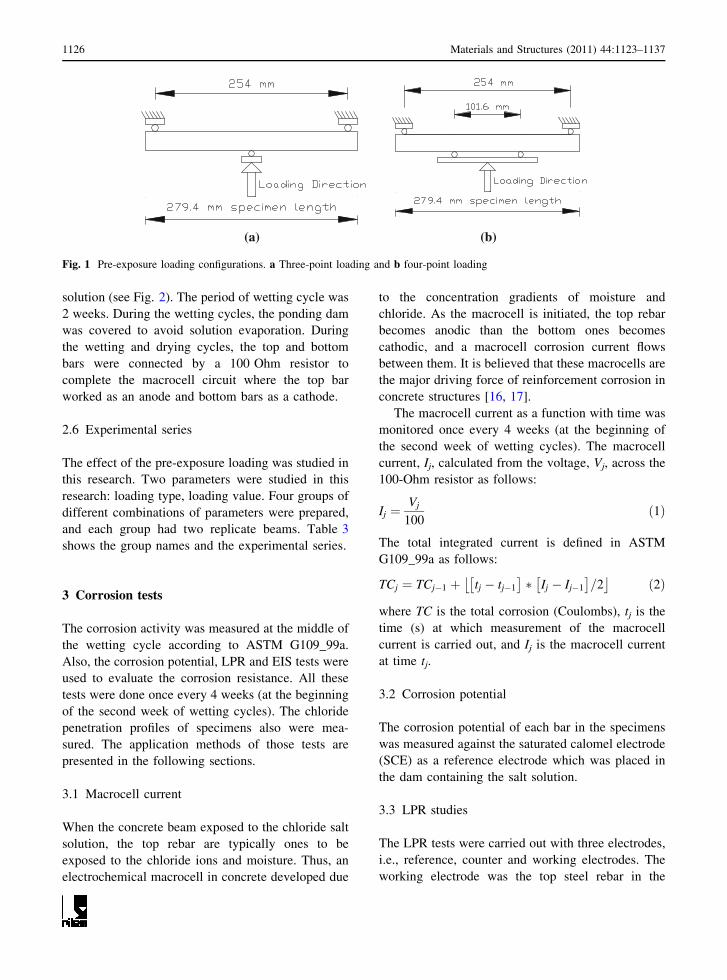
3.3 LPR studies
The LPR tests were carried out with three electrodes,
i.e., reference, counter and working electrodes. The
working electrode was the top steel rebar in the
(a) (b)
Fig. 1 Pre-exposure loading configurations. a Three-point loading and b four-point loading
1126 Materials and Structures (2011) 44:1123–1137

specimen. The counter electrode was the bottom steel
rebars. The reference electrode was SCE placed in the
dam containing the salt solution (see Fig. 3). The
polarization scanned from a potential 15 mV more
negative to 15 mV more positive of the corrosion
potential of the top rebar, with a constant potential
scan rate of 0.125 mV/s. A Gamry potentiostat
(model PCI4/300) was used to carry out the tests,
and the obtained data were analyzed using the Gamry
Echem Analyst software version 5.3.
Fig. 2 Specimen details of exposure condition
Table 3 Experimental groups and series
Name Pre-exposure
loading
Series (1) loading type effect
G7 3P25%
G8 4P25%
Series (2) loading value effect
G6 3P50%
G7 3P25%
G9 0P00%
Symbols for specimen identification: 3P three-point bending
load, 4P four-point bending load, 0P no pre-exposure loading;
50, 25, 00% level of loading (% of ultimate capacity); G#group number
Reference electrode: SCE
Working electrode: top rebar
Counter electrode: bottom rebars
Fig. 3 Photo shows the connection configuration of LPR and
EIS tests
Materials and Structures (2011) 44:1123–1137 1127
3.4 Electrochemical impedance studies
The electrochemical A.C. impedance spectra (EIS)
tests were carried out with the same configuration as
LPR test. The measurements were recorded at the
corrosion potential by applying a ±10 mV sine wave
in a frequency range from 100 kHz to 5 mHz (see
Fig. 3). The obtained data were analyzed using the
Gamry Echem Analyst software version 5.3.
3.5 The chloride penetration profiles
The chloride penetration profiles of concrete speci-
mens were obtained using Rapid Chloride Test
(RCT). RCT developed by Germann Instruments,
Inc, and it is equivalent to AASHTO T-260 and
ASTM C144. The RCT gives the percent of the total
chloride content to the concrete weight. Concrete
powder samples were collected from certain depth
ranges by using a hammer drill. The top surface of
specimens was cleaned from salt deposits by using a
wire brush. Drilling started from the top surface
which exposed to chloride penetration and extends at
� in (12.5 mm) depth increments. Six different
location samples were collected in each concrete
beam, and the powder from each two adjacent holes
mix as one sample. A 1.5 g of each concrete powder
was dissolved in an extraction solution and shacked 5
min, and then m-Volt reading was recorded by
Chloride Ion-Selective electrode. Then the recorded
mV-readings were converted to total chloride con-
centrations by using a calibration curve for the known
standard calibration solutions (more details are given
in [18]).
4 Results
The beams exposed to nine wetting/drying cycles and
the results are averaged for each group. Each test
result is presented separately in each following
sections.
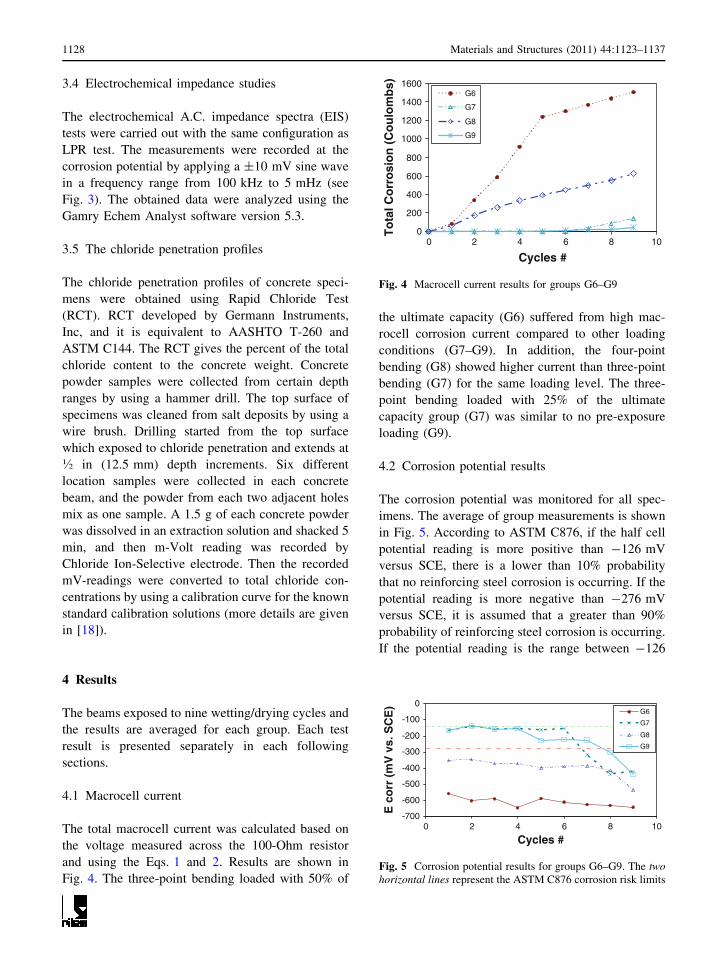
4.1 Macrocell current
The total macrocell current was calculated based on
the voltage measured across the 100-Ohm resistor
and using the Eqs. 1 and 2. Results are shown in
Fig. 4. The three-point bending loaded with 50% of
the ultimate capacity (G6) suffered from high mac-
rocell corrosion current compared to other loading
conditions (G7–G9). In addition, the four-point
bending (G8) showed higher current than three-point
bending (G7) for the same loading level. The three-
point bending loaded with 25% of the ultimate
capacity group (G7) was similar to no pre-exposure
loading (G9).
4.2 Corrosion potential results
The corrosion potential was monitored for all spec-
imens. The average of group measurements is shown
in Fig. 5. According to ASTM C876, if the half cell
potential reading is more positive than -126 mV
versus SCE, there is a lower than 10% probability
that no reinforcing steel corrosion is occurring. If the
potential reading is more negative than -276 mV
versus SCE, it is assumed that a greater than 90%
probability of reinforcing steel corrosion is occurring.
If the potential reading is the range between -126
0
200
400
600
800
1000
1200
1400
1600
0 2 4 6 8 10
Cycles #
To
tal C
orr
osi
on
(C
ou
lom
bs)
G6
G7
G8
G9
Fig. 4 Macrocell current results for groups G6–G9
-700
-600
-500
-400
-300
-200
-100
0
0 2 4 6 8 10
Cycles #
E c
orr
(m
V v
s. S
CE
) G6
G7
G8
G9
Fig. 5 Corrosion potential results for groups G6–G9. The twohorizontal lines represent the ASTM C876 corrosion risk limits
1128 Materials and Structures (2011) 44:1123–1137
and -276 mV versus SCE, it is assumed that the
corrosion activity is uncertain.
Figure 5 shows the corrosion potential for the
groups G6–G9. The matches between the corrosion
potential of these curves with the macrocell corrosion
current are very good. Both G7 and G9 are within
uncertain corrosion activates as seen in Fig. 5 and
their macrocell corrosion current readings were equal
to zero, also their macrocell current curves begin to
rise when their potential move to active zone. The G6
has more negative potential readings than the G9
which agrees with higher macrocell current shown in
Fig. 4. In the same trend, G8 has more negative
potential readings than both G7 and G9, and it has
higher macrocell corrosion current.
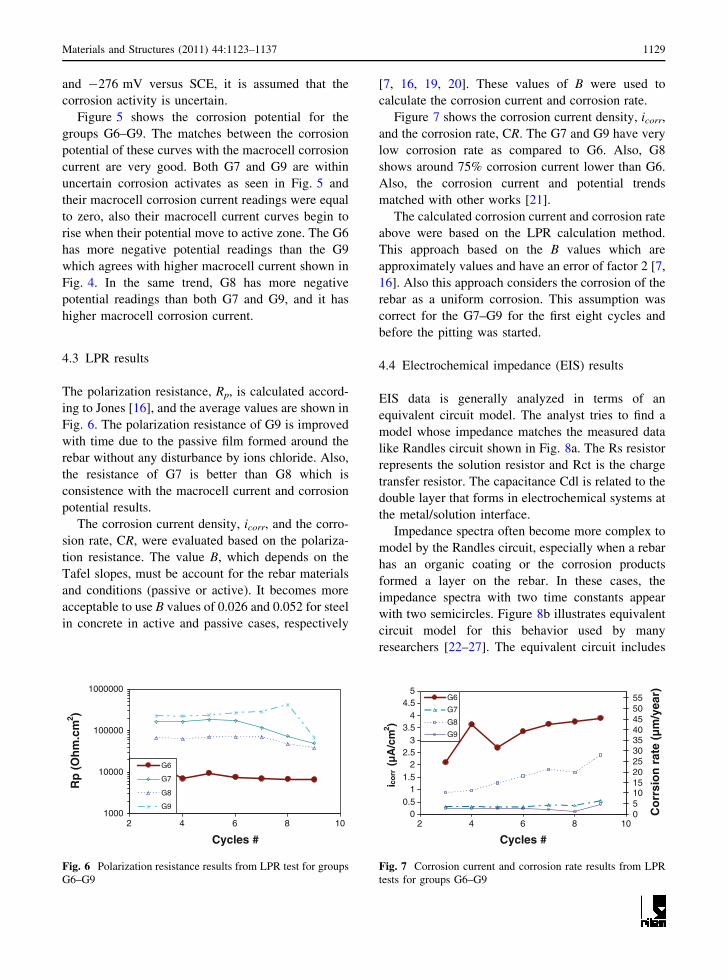
4.3 LPR results
The polarization resistance, Rp, is calculated accord-
ing to Jones [16], and the average values are shown in
Fig. 6. The polarization resistance of G9 is improved
with time due to the passive film formed around the
rebar without any disturbance by ions chloride. Also,
the resistance of G7 is better than G8 which is
consistence with the macrocell current and corrosion
potential results.
The corrosion current density, icorr, and the corro-
sion rate, CR, were evaluated based on the polariza-
tion resistance. The value B, which depends on the
Tafel slopes, must be account for the rebar materials
and conditions (passive or active). It becomes more
acceptable to use B values of 0.026 and 0.052 for steel
in concrete in active and passive cases, respectively
[7, 16, 19, 20]. These values of B were used to
calculate the corrosion current and corrosion rate.
Figure 7 shows the corrosion current density, icorr,
and the corrosion rate, CR. The G7 and G9 have very
low corrosion rate as compared to G6. Also, G8
shows around 75% corrosion current lower than G6.
Also, the corrosion current and potential trends
matched with other works [21].
The calculated corrosion current and corrosion rate
above were based on the LPR calculation method.
This approach based on the B values which are
approximately values and have an error of factor 2 [7,
16]. Also this approach considers the corrosion of the
rebar as a uniform corrosion. This assumption was
correct for the G7–G9 for the first eight cycles and
before the pitting was started.
4.4 Electrochemical impedance (EIS) results
EIS data is generally analyzed in terms of an
equivalent circuit model. The analyst tries to find a
model whose impedance matches the measured data
like Randles circuit shown in Fig. 8a. The Rs resistor
represents the solution resistor and Rct is the charge
transfer resistor. The capacitance Cdl is related to the
double layer that forms in electrochemical systems at
the metal/solution interface.
Impedance spectra often become more complex to
model by the Randles circuit, especially when a rebar
has an organic coating or the corrosion products
formed a layer on the rebar. In these cases, the
impedance spectra with two time constants appear
with two semicircles. Figure 8b illustrates equivalent
circuit model for this behavior used by many
researchers [22–27]. The equivalent circuit includes
1000
10000
100000
1000000
2 4 6 8 10
Cycles #
Rp
(O
hm
.cm
2 )
G6
G7
G8
G9
Fig. 6 Polarization resistance results from LPR test for groups
G6–G9
00.5
11.5
22.5
33.5
44.5
5
2 4 6 8 10
Cycles #
ico
rr (
µA
/cm
2 )
0510152025303540455055
Co
rrsi
on
rat
e (µ
m/y
ear)G6
G7
G8
G9
Fig. 7 Corrosion current and corrosion rate results from LPR
tests for groups G6–G9
Materials and Structures (2011) 44:1123–1137 1129
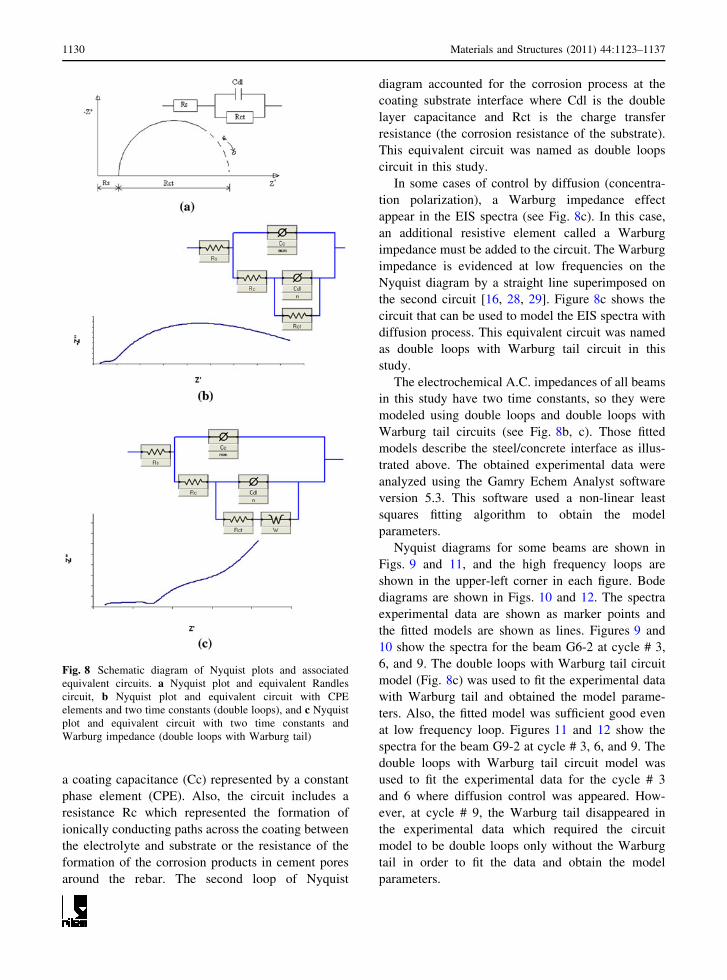
a coating capacitance (Cc) represented by a constant
phase element (CPE). Also, the circuit includes a
resistance Rc which represented the formation of
ionically conducting paths across the coating between
the electrolyte and substrate or the resistance of the
formation of the corrosion products in cement pores
around the rebar. The second loop of Nyquist
diagram accounted for the corrosion process at the
coating substrate interface where Cdl is the double
layer capacitance and Rct is the charge transfer
resistance (the corrosion resistance of the substrate).
This equivalent circuit was named as double loops
circuit in this study.
In some cases of control by diffusion (concentra-
tion polarization), a Warburg impedance effect
appear in the EIS spectra (see Fig. 8c). In this case,
an additional resistive element called a Warburg
impedance must be added to the circuit. The Warburg
impedance is evidenced at low frequencies on the
Nyquist diagram by a straight line superimposed on
the second circuit [16, 28, 29]. Figure 8c shows the
circuit that can be used to model the EIS spectra with
diffusion process. This equivalent circuit was named
as double loops with Warburg tail circuit in this
study.
The electrochemical A.C. impedances of all beams
in this study have two time constants, so they were
modeled using double loops and double loops with
Warburg tail circuits (see Fig. 8b, c). Those fitted
models describe the steel/concrete interface as illus-
trated above. The obtained experimental data were
analyzed using the Gamry Echem Analyst software
version 5.3. This software used a non-linear least
squares fitting algorithm to obtain the model
parameters.
Nyquist diagrams for some beams are shown in
Figs. 9 and 11, and the high frequency loops are
shown in the upper-left corner in each figure. Bode
diagrams are shown in Figs. 10 and 12. The spectra
experimental data are shown as marker points and
the fitted models are shown as lines. Figures 9 and
10 show the spectra for the beam G6-2 at cycle # 3,
6, and 9. The double loops with Warburg tail circuit
model (Fig. 8c) was used to fit the experimental data
with Warburg tail and obtained the model parame-
ters. Also, the fitted model was sufficient good even
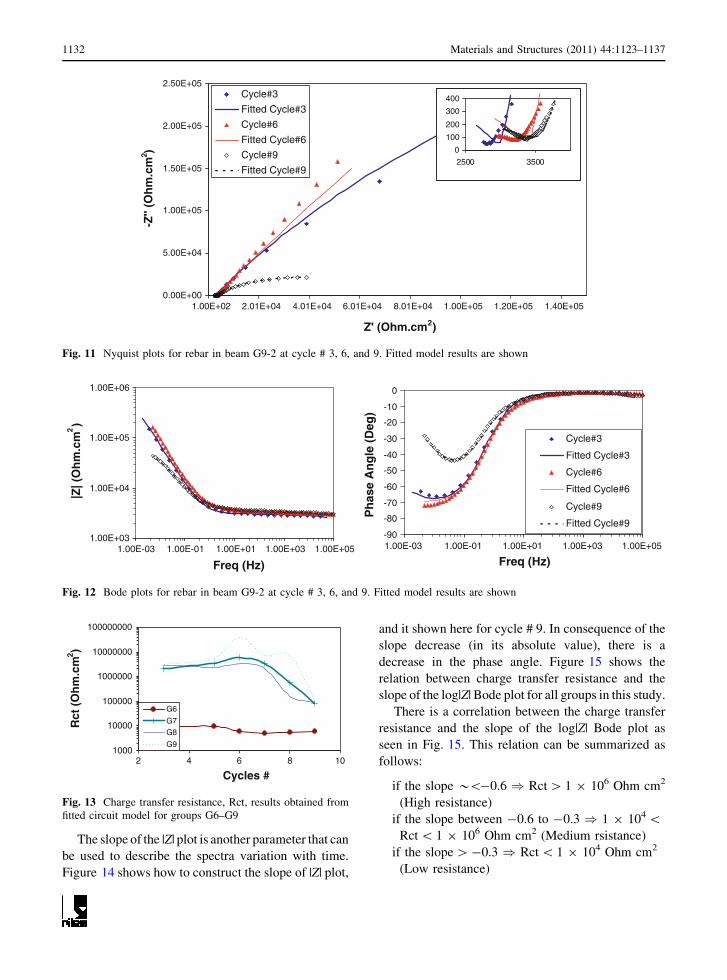
at low frequency loop. Figures 11 and 12 show the
spectra for the beam G9-2 at cycle # 3, 6, and 9. The
double loops with Warburg tail circuit model was
used to fit the experimental data for the cycle # 3
and 6 where diffusion control was appeared. How-
ever, at cycle # 9, the Warburg tail disappeared in
the experimental data which required the circuit
model to be double loops only without the Warburg
tail in order to fit the data and obtain the model
parameters.
Fig. 8 Schematic diagram of Nyquist plots and associated
equivalent circuits. a Nyquist plot and equivalent Randles
circuit, b Nyquist plot and equivalent circuit with CPE
elements and two time constants (double loops), and c Nyquist
plot and equivalent circuit with two time constants and
Warburg impedance (double loops with Warburg tail)
1130 Materials and Structures (2011) 44:1123–1137
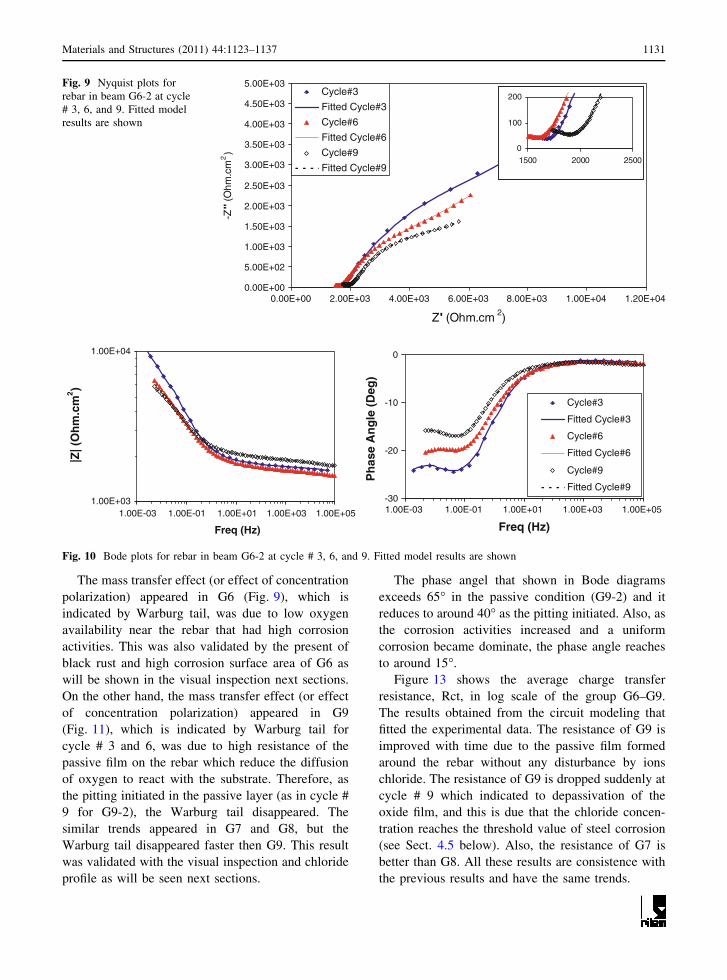
The mass transfer effect (or effect of concentration
polarization) appeared in G6 (Fig. 9), which is
indicated by Warburg tail, was due to low oxygen
availability near the rebar that had high corrosion
activities. This was also validated by the present of
black rust and high corrosion surface area of G6 as
will be shown in the visual inspection next sections.
On the other hand, the mass transfer effect (or effect
of concentration polarization) appeared in G9
(Fig. 11), which is indicated by Warburg tail for
cycle # 3 and 6, was due to high resistance of the
passive film on the rebar which reduce the diffusion
of oxygen to react with the substrate. Therefore, as
the pitting initiated in the passive layer (as in cycle #
9 for G9-2), the Warburg tail disappeared. The
similar trends appeared in G7 and G8, but the
Warburg tail disappeared faster then G9. This result
was validated with the visual inspection and chloride
profile as will be seen next sections.
The phase angel that shown in Bode diagrams
exceeds 65� in the passive condition (G9-2) and it
reduces to around 40� as the pitting initiated. Also, as
the corrosion activities increased and a uniform
corrosion became dominate, the phase angle reaches
to around 15�.
Figure 13 shows the average charge transfer
resistance, Rct, in log scale of the group G6–G9.
The results obtained from the circuit modeling that
fitted the experimental data. The resistance of G9 is
improved with time due to the passive film formed
around the rebar without any disturbance by ions
chloride. The resistance of G9 is dropped suddenly at
cycle # 9 which indicated to depassivation of the
oxide film, and this is due that the chloride concen-
tration reaches the threshold value of steel corrosion
(see Sect. 4.5 below). Also, the resistance of G7 is
better than G8. All these results are consistence with
the previous results and have the same trends.
0.00E+00
5.00E+02
1.00E+03
1.50E+03
2.00E+03
2.50E+03
3.00E+03
3.50E+03
4.00E+03
4.50E+03
5.00E+03
0.00E+00 2.00E+03 4.00E+03 6.00E+03 8.00E+03 1.00E+04 1.20E+04
Cycle#3
Fitted Cycle#3
Cycle#6
Fitted Cycle#6
Cycle#9
Fitted Cycle#9
0
100
200
1500 2000 2500
Fig. 9 Nyquist plots for
rebar in beam G6-2 at cycle
# 3, 6, and 9. Fitted model
results are shown
1.00E+03
1.00E+04
Freq (Hz)
|Z| (
Oh
m.c
m2)
-30
-20
-10
0
1.00E-03 1.00E-01 1.00E+01 1.00E+03 1.00E+05 1.00E-03 1.00E-01 1.00E+01 1.00E+03 1.00E+05
Freq (Hz)
Ph
ase
An
gle
(D
eg)
Cycle#3
Fitted Cycle#3
Cycle#6
Fitted Cycle#6
Cycle#9
Fitted Cycle#9
Fig. 10 Bode plots for rebar in beam G6-2 at cycle # 3, 6, and 9. Fitted model results are shown
Materials and Structures (2011) 44:1123–1137 1131
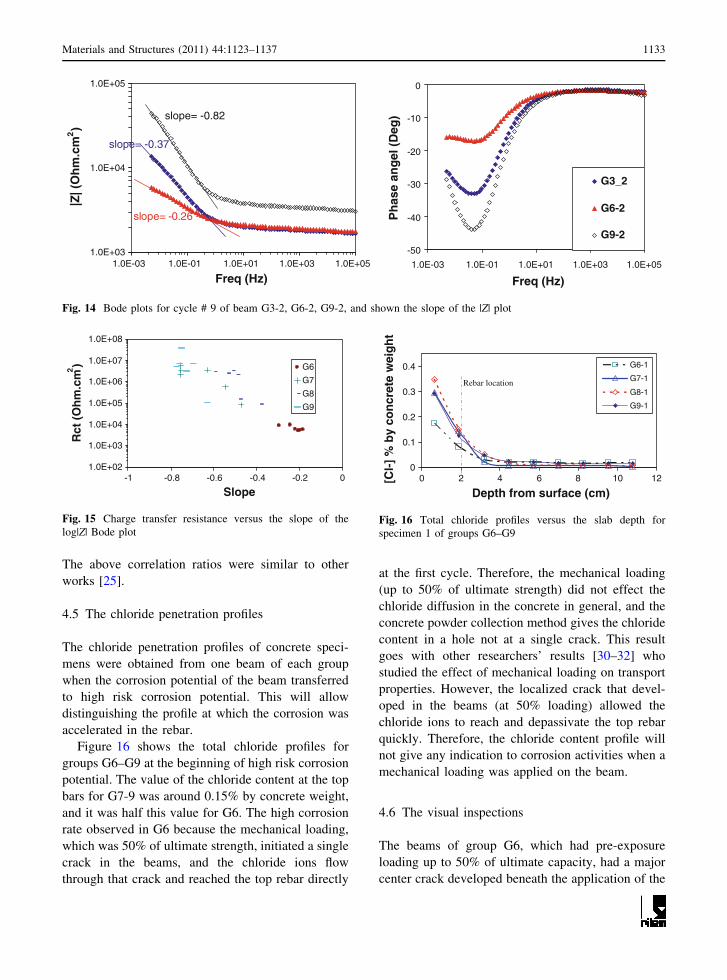
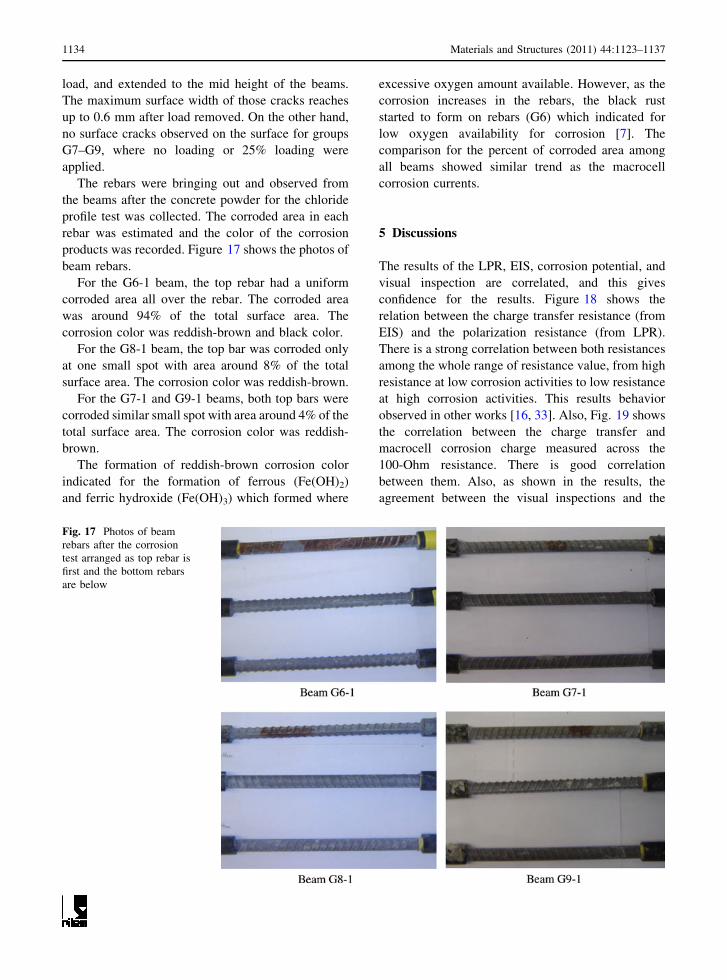
The slope of the |Z| plot is another parameter that can
be used to describe the spectra variation with time.
Figure 14 shows how to construct the slope of |Z| plot,
and it shown here for cycle # 9. In consequence of the
slope decrease (in its absolute value), there is a
decrease in the phase angle. Figure 15 shows the
relation between charge transfer resistance and the
slope of the log|Z| Bode plot for all groups in this study.
There is a correlation between the charge transfer
resistance and the slope of the log|Z| Bode plot as
seen in Fig. 15. This relation can be summarized as
follows:
if the slope *\-0.6 ) Rct [ 1 9 106 Ohm cm2
(High resistance)
if the slope between -0.6 to -0.3 ) 1 9 104 \Rct \ 1 9 106 Ohm cm2 (Medium rsistance)
if the slope [ -0.3 ) Rct \ 1 9 104 Ohm cm2
(Low resistance)
0.00E+00
5.00E+04
1.00E+05
1.50E+05
2.00E+05
2.50E+05
1.00E+02 2.01E+04 4.01E+04 6.01E+04 8.01E+04 1.00E+05 1.20E+05 1.40E+05
Cycle#3
Fitted Cycle#3
Cycle#6
Fitted Cycle#6
Cycle#9
Fitted Cycle#9
0
100
200
300
400
2500 3500
Fig. 11 Nyquist plots for rebar in beam G9-2 at cycle # 3, 6, and 9. Fitted model results are shown
1.00E+03
1.00E+04
1.00E+05
1.00E+06
Freq (Hz)
|Z| (
Oh
m.c
m2)
-90
-80
-70
-60
-50
-40
-30
-20
-10
0
1.00E-03 1.00E-01 1.00E+01 1.00E+03 1.00E+05 1.00E-03 1.00E-01 1.00E+01 1.00E+03 1.00E+05
Freq (Hz)
Ph
ase
An
gle
(D
eg)
Cycle#3
Fitted Cycle#3
Cycle#6
Fitted Cycle#6
Cycle#9
Fitted Cycle#9
Fig. 12 Bode plots for rebar in beam G9-2 at cycle # 3, 6, and 9. Fitted model results are shown
1000
10000
100000
1000000
10000000
100000000
2 4 6 8 10
Cycles #
Rct
(O
hm
.cm
2 )
G6
G7G8
G9
Fig. 13 Charge transfer resistance, Rct, results obtained from
fitted circuit model for groups G6–G9
1132 Materials and Structures (2011) 44:1123–1137
The above correlation ratios were similar to other
works [25].
4.5 The chloride penetration profiles
The chloride penetration profiles of concrete speci-
mens were obtained from one beam of each group
when the corrosion potential of the beam transferred
to high risk corrosion potential. This will allow
distinguishing the profile at which the corrosion was
accelerated in the rebar.
Figure 16 shows the total chloride profiles for
groups G6–G9 at the beginning of high risk corrosion
potential. The value of the chloride content at the top
bars for G7-9 was around 0.15% by concrete weight,
and it was half this value for G6. The high corrosion
rate observed in G6 because the mechanical loading,
which was 50% of ultimate strength, initiated a single
crack in the beams, and the chloride ions flow
through that crack and reached the top rebar directly
at the first cycle. Therefore, the mechanical loading
(up to 50% of ultimate strength) did not effect the
chloride diffusion in the concrete in general, and the
concrete powder collection method gives the chloride
content in a hole not at a single crack. This result
goes with other researchers’ results [30–32] who
studied the effect of mechanical loading on transport
properties. However, the localized crack that devel-
oped in the beams (at 50% loading) allowed the
chloride ions to reach and depassivate the top rebar
quickly. Therefore, the chloride content profile will
not give any indication to corrosion activities when a
mechanical loading was applied on the beam.
4.6 The visual inspections
The beams of group G6, which had pre-exposure
loading up to 50% of ultimate capacity, had a major
center crack developed beneath the application of the
1.0E+03
1.0E+04
1.0E+05
Freq (Hz)
|Z| (
Oh
m.c
m2)
slope= -0.82
slope= -0.37
slope= -0.26
-50
-40
-30
-20
-10
0
1.0E-03 1.0E-01 1.0E+01 1.0E+03 1.0E+05 1.0E-03 1.0E-01 1.0E+01 1.0E+03 1.0E+05
Freq (Hz)
Ph
ase
ang
el (
Deg
)
G3_2
G6-2
G9-2
Fig. 14 Bode plots for cycle # 9 of beam G3-2, G6-2, G9-2, and shown the slope of the |Z| plot
1.0E+02
1.0E+03
1.0E+04
1.0E+05
1.0E+06
1.0E+07
1.0E+08
-1 -0.8 -0.6 -0.4 -0.2 0
Slope
Rct
(O
hm
.cm
2) G6
G7
G8
G9
Fig. 15 Charge transfer resistance versus the slope of the
log|Z| Bode plot
0
0.1
0.2
0.3
0.4
0 2 4 6 8 10 12
Depth from surface (cm)
[Cl-
] %
by
con
cret
e w
eig
ht
G6-1
G7-1
G8-1
G9-1
Rebar location
Fig. 16 Total chloride profiles versus the slab depth for
specimen 1 of groups G6–G9
Materials and Structures (2011) 44:1123–1137 1133
load, and extended to the mid height of the beams.
The maximum surface width of those cracks reaches
up to 0.6 mm after load removed. On the other hand,
no surface cracks observed on the surface for groups
G7–G9, where no loading or 25% loading were
applied.
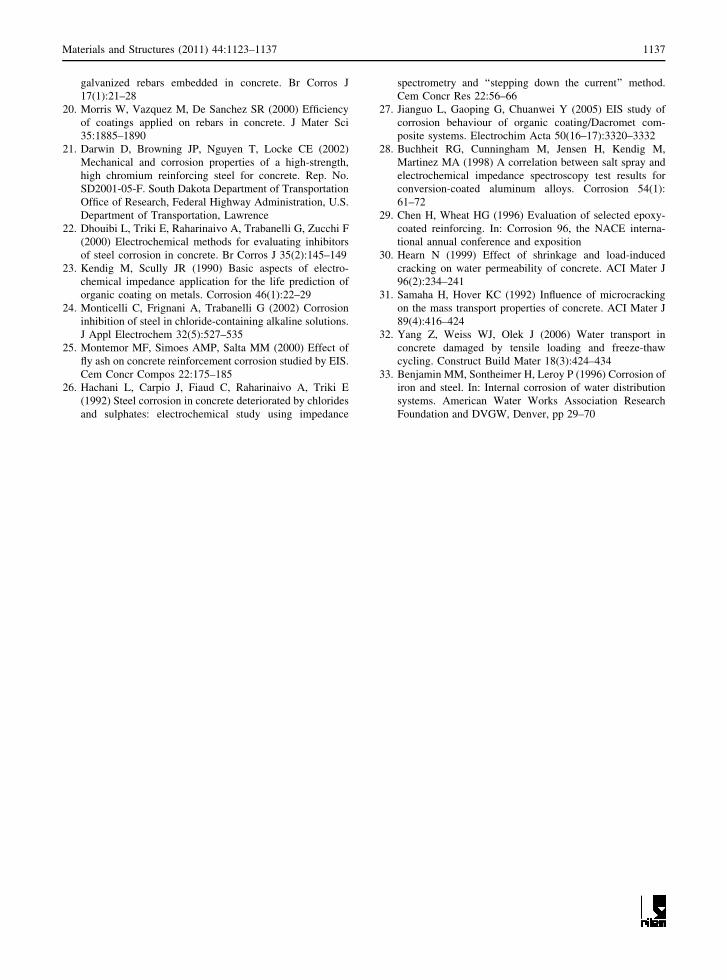
The rebars were bringing out and observed from
the beams after the concrete powder for the chloride
profile test was collected. The corroded area in each
rebar was estimated and the color of the corrosion
products was recorded. Figure 17 shows the photos of
beam rebars.
For the G6-1 beam, the top rebar had a uniform
corroded area all over the rebar. The corroded area
was around 94% of the total surface area. The
corrosion color was reddish-brown and black color.
For the G8-1 beam, the top bar was corroded only
at one small spot with area around 8% of the total
surface area. The corrosion color was reddish-brown.
For the G7-1 and G9-1 beams, both top bars were
corroded similar small spot with area around 4% of the
total surface area. The corrosion color was reddish-
brown.
The formation of reddish-brown corrosion color
indicated for the formation of ferrous (Fe(OH)2)
and ferric hydroxide (Fe(OH)3) which formed where
excessive oxygen amount available. However, as the
corrosion increases in the rebars, the black rust
started to form on rebars (G6) which indicated for
low oxygen availability for corrosion [7]. The
comparison for the percent of corroded area among
all beams showed similar trend as the macrocell
corrosion currents.
5 Discussions
The results of the LPR, EIS, corrosion potential, and
visual inspection are correlated, and this gives
confidence for the results. Figure 18 shows the
relation between the charge transfer resistance (from
EIS) and the polarization resistance (from LPR).
There is a strong correlation between both resistances
among the whole range of resistance value, from high
resistance at low corrosion activities to low resistance
at high corrosion activities. This results behavior
observed in other works [16, 33]. Also, Fig. 19 shows
the correlation between the charge transfer and
macrocell corrosion charge measured across the
100-Ohm resistance. There is good correlation
between them. Also, as shown in the results, the
agreement between the visual inspections and the
Fig. 17 Photos of beam
rebars after the corrosion
test arranged as top rebar is
first and the bottom rebars
are below
1134 Materials and Structures (2011) 44:1123–1137

electrochemical test results support the following
discussion and conclusions.
5.1 Series (1) loading type effect
The loading for three-point bending (G7) and for
four-point bending (G8) was up to 25% of the
ultimate capacity, but the results showed that G8 had
lower corrosion resistance, higher macrocell corro-
sion current, and higher corrosion rate as compared to
G7. Also, the visual bars inspection showed similar
results. The chloride profiles are similar for both
groups (Fig. 16). The explanation for this is that, the
maximum moment for three-point bending (G7)
(shown in Fig. 1a) occurred only at a single section,
whereas the maximum moment for four-point bend-
ing (G8) (shown in Fig. 1b) was constant between the
two loads. Because the probability of having defects
(like voids, local cracks, large aggregates, etc.) over a
finite length is greater than at a single section, the
formation of connected microcracks for G8 will be
greater than G7 [15].
5.2 Series (2) loading value effect
The pre-exposure mechanical loading did not affect
the chloride diffusion properties for the concrete
where the chloride profiles are similar under different
loadings as shown in Fig. 16. This results consistence
with other works [30–32] with low level of applied
load (less than 75%). Those previous research studied
the diffusion properties on cylinder specimens where
the load is equally distributed over the whole section.
However, in this study the load applied on the beam
where a single crack propagated beneath the appli-
cation of the load (50% of the ultimate capacity), and
extended to the mid height of the beams. This
localized crack allowed the chloride ions to reach and
depassivate the top rebar quickly. Therefore, the
corrosion current for G6 was higher than G9.
The corrosion current obtained by macrocell or
LPR for groups G7 and G9 are similar, and it
indicated for low corrosion activities. Also, the
corrosion potentials for both groups are not in the
active zone. This confirmed that low level of loading
(before continues cracks formed) does not effect the
corrosion initiation. On the other hand, there is a
large difference between the corrosion resistances of
G7 and G9 (Fig. 6 for Rp, and Fig. 13 for Rct). The
polarization and charge resistances of G9 increased
with time up to certain limits then a sudden decrease
were observed at cycle # 9. The polarization and
charge resistances of G7 did not show a similar
improvement as G9. The continuous rising of G9
resistance can be explained by the growth of the
passive layer around the rebar due to high alkalinity
of intact concrete. This passive layer was destroyed
suddenly when the chloride content reached critical
value at cycle # 9. On the other hand, the application
of mechanical load may induced a disturbance in the
concrete-steel interfacial zone which reduce the
growth of the passive layer around the rebar, thus
no improvement was observed in the G7 polarization
resistance. However, the high resistance of G9 did not
delay the corrosion initiation, where at cycle # 9 both
G7 and G9 showed similar resistance and corrosion
potential (Figs. 5, 6, 13).
The passive layer formed on the rebars during the
curing period for G6–G9, and it continued to
enrichment in group G9 (where no load was applied)
which indicated by the improvement in the polariza-
tion resistance. The application of the mechanical
1.0E+03
1.0E+04
1.0E+05
1.0E+06
1.0E+07
1.0E+08
1.0E+03 1.0E+04 1.0E+05 1.0E+06
Rp(Ohm.cm2)
Rct
(O
hm
.cm
2)
G6
G7
G8
G9
Fig. 18 Charge transfer resistance, Rct, versus polarization
resistance, Rp
1.0E+03
1.0E+04
1.0E+05
1.0E+06
1.0E+00 1.0E+01 1.0E+02 1.0E+03
Macrocell charge (Coulombs)
Rct
(O
hm
.cm
2)
G6
G7
G8
G9
Fig. 19 Charge transfer resistance, Rct, versus macrocell
corrosion charge obtained from macrocell test results
Materials and Structures (2011) 44:1123–1137 1135

loading after the curing period suppressed the growth
of the passive layer and its resistance for both G7 and
G8. However, the extra growth in the passive layer of
G9 had no role on the corrosion initiation. In general,
the pre-exposure mechanical load does not effect the
concrete diffusion. Also, it has not influence on the
corrosion initiation or corrosion rate thereafter, unless
it reaches to some limit where it develops connected
microcracks through which the chloride ions flow and
depassivate the rebar. This results was shown in other
works [7–10, 12].
6 Conclusions
The impact of the pre-exposure mechanical loading
was studied and the following points can be con-
cluded from this research:
1. The pre-exposure mechanical load (up to 50%
of ultimate capacity) does not effect the
concrete diffusion, and the chloride content
profiles of the different load cases were similar.
The impact of the load on the steel corrosion
was localized where a visible continuous crack
formed.
2. The pre-exposure mechanical load has not influ-
ence on the corrosion initiation or corrosion rate
thereafter, unless it reaches to some limit where
it develops connected cracks through which the
chloride ions flow and depassivate the rebar.
3. The 25% of the ultimate capacity load seems to
be at the critical limit where some microcracks
onset to be connected and facilitate the chloride
ions flow.
4. The passive layer formed on the rebars during the
curing period, and it continued to enrichment (if
no load was applied) which indicated by the
improvement in the polarization resistance.
However, the application of the mechanical
loading after the curing period suppressed the
growth of the passive layer and its resistance.
5. The range of corrosion resistance of the rebar can
be classified according to the slope and phase
angle of the Bode diagrams. Also, corrosion of
steel reinforcement in concrete can be monitored
using EIS test, and this test is able to distinguish
the different stages of corrosion, e.g., passive,
initiation, and growth of corrosion.
References
1. Cabrera JG (1996) Deterioration of concrete due to rein-
forcement steel corrosion. Cem Concr Compos 18(1):
47–59
2. Huang R, Yang CC (1997) Condition assessment of rein-
forced concrete beams relative to reinforcement corrosion.
Cem Concr Compos 19(2):131–137
3. Sherwood EG, Soudki KA (2000) Rehabilitation of cor-
rosion damaged concrete beams with CFRP laminates—a
pilot study. Compos B Eng 31(6–7):453–459
4. Fang C, Gylltoft K, Lundgren K, Plos M (2006) Effect of
corrosion on bond in reinforced concrete under cyclic
loading. Cem Concr Res 36(3):548–555
5. Mangat PS, Elgarf MS (1999) Strength and serviciability
of repaired reinforced concrete beams undergoing rein-
forcement corrosion. Mag Concr Res 51(2):97–112
6. Castel A, Francois R, Arliguie G (2006) Mechanical
behaviour of corroded reinforced concrete beams—Part 1:
experimental study of corroded beams. Mater Struct 33(9):
539–544
7. Bentur A, Diamond S, Berke NS (1997) Steel corrosion in
concrete, 1st edn. E & FN Spon, London
8. Li CQ (2000) Corrosion initiation of reinforcing steel in
concrete under natural slat spry and service loading—
results and analysis. ACI Mater J 97(6):690–697
9. Jacobsen S, Marchand J, Gerard B (1998) Concrete cracks
I: durability and self healing—a review. In: Gjorv OE,
Sakai K, Banthia N (eds) The second international con-
ference on concrete under severe conditions. E & FN Spon,
Tromso, pp 217–231
10. Francois R, Arliguie G, Castel A (1998) Influence of ser-
vice cracking on service life of reinforced concrete. In:
Gjorv OE, Sakai K, Banthia N (eds) The second interna-
tional conference on concrete under severe conditions. E &
FN Spon, Tromso, pp 143–152
11. Castel A, Francois R, Arliguie G (1999) Effect of loading
on carbonation penetration in reinforced concrete elements.
Cem Concr Res 29(4):561–565
12. Francois R, Maso JC (1988) Effect of damage in reinforced
concrete on carbonation or chloride penetration. Cem
Concr Res 18(6):961–970
13. Yoon S, Wang K, Weiss WJ, Shah SP (2000) Interaction
between loading, corrosion, and serviceability of rein-
forced concrete. ACI Mater J 97(6):637–644
14. Kondratova IL, Montes P, Bremner TW (2003) Natural
marine exposure results for reinforced concrete slabs with
corrosion inhibitors. Cem Concr Compos 25(4–5):483–490
15. Ersoy U, Ozcebe G, Tankut T (2003) Reinforced concrete,
2nd edn. Middle East Technical University, Ankara
16. Jones DA (1996) Principles and prevention of corrosion,
2nd edn. Prentice-Hall, Inc., Upper Saddle River
17. Bertolini L, Elsense B, Pedeferri P, Polder R (2004) Cor-
rosion of steel in concrete: prevention, diagnosis, repair.
Wiley-VCH Verlag GmbH & Co. KGaA, Weinheim
18. Ababneh A (2002) The coupled effect of moisture diffu-
sion chloride penetration and freezing-thawing on concrete
durability. PhD Dissertation, University of Colorado
19. Gonzalez JA, Andrade C (1982) Effect of carbonation,
chloride and relative ambient humidity on the corrosion of
1136 Materials and Structures (2011) 44:1123–1137
galvanized rebars embedded in concrete. Br Corros J
17(1):21–28
20. Morris W, Vazquez M, De Sanchez SR (2000) Efficiency
of coatings applied on rebars in concrete. J Mater Sci
35:1885–1890
21. Darwin D, Browning JP, Nguyen T, Locke CE (2002)
Mechanical and corrosion properties of a high-strength,
high chromium reinforcing steel for concrete. Rep. No.
SD2001-05-F. South Dakota Department of Transportation
Office of Research, Federal Highway Administration, U.S.
Department of Transportation, Lawrence
22. Dhouibi L, Triki E, Raharinaivo A, Trabanelli G, Zucchi F
(2000) Electrochemical methods for evaluating inhibitors
of steel corrosion in concrete. Br Corros J 35(2):145–149
23. Kendig M, Scully JR (1990) Basic aspects of electro-
chemical impedance application for the life prediction of
organic coating on metals. Corrosion 46(1):22–29
24. Monticelli C, Frignani A, Trabanelli G (2002) Corrosion
inhibition of steel in chloride-containing alkaline solutions.
J Appl Electrochem 32(5):527–535
25. Montemor MF, Simoes AMP, Salta MM (2000) Effect of
fly ash on concrete reinforcement corrosion studied by EIS.
Cem Concr Compos 22:175–185
26. Hachani L, Carpio J, Fiaud C, Raharinaivo A, Triki E
(1992) Steel corrosion in concrete deteriorated by chlorides
and sulphates: electrochemical study using impedance
spectrometry and ‘‘stepping down the current’’ method.
Cem Concr Res 22:56–66
27. Jianguo L, Gaoping G, Chuanwei Y (2005) EIS study of
corrosion behaviour of organic coating/Dacromet com-
posite systems. Electrochim Acta 50(16–17):3320–3332
28. Buchheit RG, Cunningham M, Jensen H, Kendig M,
Martinez MA (1998) A correlation between salt spray and
electrochemical impedance spectroscopy test results for
conversion-coated aluminum alloys. Corrosion 54(1):
61–72
29. Chen H, Wheat HG (1996) Evaluation of selected epoxy-
coated reinforcing. In: Corrosion 96, the NACE interna-
tional annual conference and exposition
30. Hearn N (1999) Effect of shrinkage and load-induced
cracking on water permeability of concrete. ACI Mater J
96(2):234–241
31. Samaha H, Hover KC (1992) Influence of microcracking
on the mass transport properties of concrete. ACI Mater J
89(4):416–424
32. Yang Z, Weiss WJ, Olek J (2006) Water transport in
concrete damaged by tensile loading and freeze-thaw
cycling. Construct Build Mater 18(3):424–434
33. Benjamin MM, Sontheimer H, Leroy P (1996) Corrosion of
iron and steel. In: Internal corrosion of water distribution
systems. American Water Works Association Research
Foundation and DVGW, Denver, pp 29–70
Materials and Structures (2011) 44:1123–1137 1137