impact of growth matrix on pharmacodynamics of
TRANSCRIPT
RESEARCH ARTICLE Open Access
Impact of growth matrix onpharmacodynamics of antimicrobial drugsfor pig pneumonia pathogensLucy Dorey* and Peter Lees
Abstract
Background: The most widely used measure of potency of antimicrobial drugs is Minimum Inhibitory Concentration(MIC). MIC is usually determined under standardised conditions in broths formulated to optimise bacterial growth on aspecies-by-species basis. This ensures comparability of data between laboratories. However, differences in values of MICmay arise between broths of differing chemical composition and for some drug classes major differences occur betweenbroths and biological fluids such as serum and inflammatory exudate. Such differences must be taken into account, whenbreakpoint PK/PD indices are derived and used to predict dosages for clinical use. There is therefore interest in comparingMIC values in several broths and, in particular, in comparing broth values with those generated in serum. For the pigpneumonia pathogens, Actinobacillus pleuropneumoniae and Pasteurella multocida, MICs were determined forthree drugs, florfenicol, oxytetracycline and marbofloxacin, in five broths [Mueller Hinton Broth (MHB), cation-adjusted Mueller Hinton Broth (CAMHB), Columbia Broth supplemented with NAD (CB), Brain Heart InfusionBroth (BHI) and Tryptic Soy Broth (TSB)] and in pig serum.
Results: For each drug, similar MIC values were obtained in all broths, with one exception, marbofloxacinhaving similar MICs for three broths and 4–5-fold higher MICs for two broths. In contrast, for both organisms,quantitative differences between broth and pig serum MICs were obtained after correction of MICs for drugbinding to serum protein (fu serum MIC). Potency was greater (fu serum MIC lower) in serum than in brothsfor marbofloxacin and florfenicol for both organisms. For oxytetracycline fu serum:broth MIC ratios were 6.30:1(P. multocida) and 0.35:1 (A. pleuropneumoniae), so that potency of this drug was reduced for the former speciesand increased for the latter species. The chemical composition of pig serum and broths was compared; major matrixdifferences in 14 constituents did not account for MIC differences. Bacterial growth rates were compared in broths andpig serum in the absence of drugs; it was concluded that broth/serum MIC differences might be due to differing growthrates in some but not all instances.
Conclusions: For all organisms and all drugs investigated in this study, it is suggested that broth MICs shouldbe adjusted by an appropriate scaling factor when used to determine pharmacokinetic/pharmacodynamicbreakpoints for dosage prediction.
Keywords: Minimum inhibitory concentration, Florfenicol, Oxytetracycline, Marbofloxacin, A. Pleuropneumoniae,P. Multocida
* Correspondence: [email protected] Royal Veterinary College, Hawkshead Campus, Herts, AL97TA, Hatfield, UK
© The Author(s). 2017 Open Access This article is distributed under the terms of the Creative Commons Attribution 4.0International License (http://creativecommons.org/licenses/by/4.0/), which permits unrestricted use, distribution, andreproduction in any medium, provided you give appropriate credit to the original author(s) and the source, provide a link tothe Creative Commons license, and indicate if changes were made. The Creative Commons Public Domain Dedication waiver(http://creativecommons.org/publicdomain/zero/1.0/) applies to the data made available in this article, unless otherwise stated.
Dorey and Lees BMC Veterinary Research (2017) 13:192 DOI 10.1186/s12917-017-1086-4

BackgroundDosage regimens of antimicrobial drugs should be opti-mized first to achieve clinical and bacteriological cureand second to provide minimal opportunities for the se-lection of resistant organisms. The successful outcomeof therapy depends on both the pharmacokinetic (PK)profile, which determines the drug concentration-timecourse at the site of infection and the pharmacodynamic(PD) profile that is drug effect on the pathogen [1–4].Hence, a rational approach to dose prediction, for subse-quent confirmation or adaptation in disease models andclinical trials, is dependent on PK/PD integration andmodelling methods. These establish PK/PD breakpointsfor pre-determined levels of kill [2–6].Minimum Inhibitory Concentration (MIC) is the pri-
mary PD parameter used to determine potency; it is thelowest drug concentration that inhibits visible bacterialgrowth after 16–24 h incubation. Standardised method-ologies for MIC determination are described in Euro-pean Committee on Antimicrobial Susceptibility Testing(EUCAST) and Clinical and Laboratory Standards Insti-tute (CLSI) [7] guidelines [VET01-A4 (formerly M31-A3)]. These ensure reproducibility between individualanalysts, between laboratories and across both geograph-ical regions and time [5, 8]. CLSI and EUCAST methodsrequire the use of broths formulated to standardises thegrowth of bacteria of each bacterial species. Thus, the al-most universal use of internationally recognised guide-lines, methods and standards for MIC determination ishighly beneficial. However, when the objective of po-tency determination is prediction of dosage for clinicalefficacy based on PK/PD breakpoints, conditions shouldbe representative of in vivo pathological circumstances.Zeitlinger et al. [9] commented that “bacteria with ap-propriate and well-defined growth in the selectedmedium should be employed” and “in order to be ableto extrapolate data from various models to in vivo situa-tions, models should always attempt to mimic physio-logical conditions as closely as possible”.Whilst serum is not identical to extravascular infection
site fluids, it is likely to be closer to the biophase thanbroths in chemical composition and indeed in respect ofimmunological components also [9, 10]. A comparisonof broth MICs with potency determined in biologicalfluids is therefore relevant to PK/PD breakpoint estima-tion, when the aim is optimal dose prediction for clinicaluse. For some drugs and pathogens, calculation of a scal-ing factor to bridge between broth and serum MICs maybe warranted [4, 6, 10].A second consideration, in relation to dose prediction,
is that CLSI and EUCAST guidelines have limitations re-garding accuracy for individual isolates, because they re-quire use of two-fold dilutions, giving potential forapproaching 100% error. For most purposes, this is wholly
acceptable, and indeed is necessary, when large numbersof isolates are examined to establish MIC distributions.When plotted on a histogram, using a log-base 2 distribu-tion, they are log-normal. These histograms facilitate theidentification of wild-type distributions. Standardisation ofmethodology thereby enables determination of epidemio-logical cut-offs (ECOFF) by EUCAST and wild type cut-offs (COWT) by CLSI. However, modification of the two-fold dilution approach may be appropriate, when MICsare correlated with PK data for establishing PK/PD break-points. Based on methods previously described [11, 12]five overlapping sets of doubling dilutions were used inthis study to decrease inaccuracy from up to 100% to nomore than 20% for a small number of individual isolates.Hence, the quantitative determination potency with im-proved accuracy and in biological fluids may be appropri-ate for some drug classes and some microorganisms,when calculating PK/PD indices [6, 10, 12–16].It is the hypothesis of this investigation that MICs de-
termined in pig serum (potentially reflecting moreclosely concentrations required to achieve clinical effi-cacy than those determined in artificial broths) mightdiffer from MICs determined in broths. The aims wereto: (1) compare MICs measured in five broths withMICs determined in pig serum, using five sets of over-lapping two-fold dilutions for three drugs, florfenicol,marbofloxacin and oxytetracycline, used in the treatmentof pig pneumonia caused by the pathogens, Actinobacil-lus pleuropneumoniae and Pasteurella multocida; (2) de-termine whether any broth/serum MIC differences wereattributable solely to drug binding to serum protein; (3)compare chemical compositions of CLSI recommendedbroths and pig serum; (4) determine rates of growth A.pleuropneumoniae and P. multocida in broths and pigserum in the absence of drugs. Aims 3 and 4 were in-cluded to investigate whether chemical composition dif-ferences and/or bacterial growth rate differencesbetween broth and serum might account for matrix MICdifferences over and above those attributable binding ofthe drugs to serum protein.
MethodsSelection of bacterial isolates for MIC studiesDon Whitley Scientific (Shipley, West Yorkshire, UK) sup-plied 20 isolates of P. multocida and three American TypeCulture Collection (ATCC) reference strains to validateMIC tests; A. pleuropneumoniae ATCC 27090, Entero-coccus faecalis ATCC 29212 and Escherichia coli ATCC25922. Eight isolates of A. pleuropneumoniae were sup-plied by A. Rycroft (Royal Veterinary College, Hatfield,Herts, UK). All P. multocida and A. pleuropneumoniaeisolates were obtained from European Union (EU) fieldcases of pig pneumonia, specifically the UK and France.
Dorey and Lees BMC Veterinary Research (2017) 13:192 Page 2 of 11

The quality control organisms were incorporated in eachMIC test. Organisms were stored at -80 °C.From the organisms supplied, three isolates of each
species were selected, based on three criteria: (1) exhibit-ing logarithmic growth in all broths (see below) and pigserum; (2) sensitivity to florfenicol, marbofloxacin andoxytetracycline in disk diffusion assays (data not shown);and (3) the highest and lowest CLSI defined broth MICsand one isolate of intermediate MIC, determined usingtwo-fold dilutions (data not shown).
Culture media and bacterial countsFor A. pleuropneumoniae Chocolate Mueller HintonAgar (CMHA) was used to grow the organism on a solidmedium. Mueller Hinton Agar (MHA), supplementedwith 5% defibrinated sheep blood, was used to grow P.multocida. Columbia broth (CB) supplemented with2 μg/mL nicotinamide adenine dinucleotide (NAD) wasused as the principal liquid broth for A. pleuropneumo-niae MIC determination. CLSI guidelines require use ofVeterinary Fastidious Medium (VFM) for the liquid cul-ture of A. pleuropneumoniae. However, for isolates usedin this study, MIC end-points were more readily and re-liably established using CB than with VFM. In the latterbroth, there was difficulty defining MIC end-points, be-cause the high density of red blood cells caused them tosettle at the base of the well obscuring the result ofMIC. The CLSI recommended broth for P. multocida isCation Adjusted Mueller Hinton broth (CAMHB), andthis was the principal liquid broth used in this study forthis organism.Both organisms were incubated in a static incubator at
37 °C for 18–24 h. For comparative purposes, MICswere determined for both organisms in five broths, CB,CAMHB, Mueller Hinton broth (MHB), Brain Heart In-fusion broth (BHI), Tryptic soy broth (TSB), and pigserum (Invitrogen Gibco Porcine Serum, Origin: NewZealand, ThermoFisher Scientific, UK).Bacterial counts were determined by serial dilution
and spot plate counts. Culture dilutions were carried outin phosphate buffered saline. Three 10 μL drops of theappropriate dilutions were dropped onto the agar surfaceand allowed to dry. After 24 h incubation, the mean col-ony forming unit (CFU) count for each 10 μL was deter-mined and multiplied by 100 and then multiplied by thedilution factor to give the original CFU/mL count.
Minimum inhibitory concentrations in six growth matricesMICs of florfenicol, marbofloxacin and oxytetracyclinewere determined by microdilution in 96-well plates forthree isolates each of A. pleuropneumoniae and P. mul-tocida, using CLSI guidelines, except that: (1) five sets ofoverlapping two-fold serial dilutions were used to reduceinaccuracy for individual isolates to no greater than 20%;
(2) determinations were made in five broths, MHB,CAMHB, CB, BHIB, TSB and pig serum; (3) the bacter-ial culture was grown to 0.5 McFarland Standard andthis was diluted ten-fold to obtain the intended startinginoculum of 1–2 × 10⁷ CFU/mL. This starting inoculumcount is higher than the CLSI recommendation of5 × 105 CFU/mL, the higher inoculum count being se-lected deliberately to be equivalent clinically to a mediumto heavy in vivo microbial challenge.Drug solutions, media and culture were added sequen-
tially to the wells of 96-well plates, with a total volume of200 μL. These were sealed and incubated statically at 37 °Cfor 24 h. Spot plate counts were prepared immediatelyafter plate inoculation. ATCC isolates were used in all as-says at the CLSI recommended strength of 5 × 10⁵ CFU/mL. A positive control well contained medium and patho-gen only and a negative control well contained mediumand drug only. Blank controls contained medium alone.MICs were determined in triplicate for each isolate of
each species and each drug. In previous studies in thislaboratory, binding to pig serum protein had been deter-mined for each drug over the therapeutic concentrationrange and shown to be independent of concentration[17–19]. Percentage binding was 49, 65 and 71 for mar-bofloxacin, florfenicol and oxytetracycline, respectively.As serum protein bound drug is microbiologically in-active, MICs for serum were reported first, as uncorrected,experimental values and second, as values corrected forfree drug (that is unbound) concentration, termed the fuserum MIC.
Chemical composition of growth matricesFor analysis of 14 chemical constituents, three batches ofeach broth were prepared in 10 mL quantities, accordingto manufacturer’s instructions and three batches each ofpig and calf serum were obtained commercially (Thermo-Fisher Scientific, Paisley, UK). Calf serum was included tocompare the composition of pig serum with another farmanimal species. Samples were analysed for total protein, al-bumin, globulin, sodium, potassium, calcium, magnesium,chloride, inorganic phosphorus, urea, creatinine, glucose,iron and Unsaturated Iron Binding Capacity (UIBC)(ILAB 600 Instrumentation Laboratory Ltd., Cheshire UK;Nova Biomedical CCX and Phox, Cheshire UK).
Bacterial growth in broth and serumTwenty isolates each of P. multocida and A. pleuropneu-moniae (Don Whitley Scientific (Shipley, West Yorkshire,UK) supplied 20 isolates of both organisms for the purposeof determining growth in media), from clinical cases of pigpneumonia, were used to investigate bacterial growth inthe absence of antimicrobial drugs. Growth rates were de-termined in pig serum and the CLSI recommended broths,
Dorey and Lees BMC Veterinary Research (2017) 13:192 Page 3 of 11

VFM for A. pleuropneumoniae and CAMHB for P.multocida.Three mL of serum, CAMHB or VFM were aseptically
added to the wells of a 96-well plate. Two control wellscontaining medium alone ensured the absence of contam-ination. Six independent colonies were removed from afresh agar plate aseptically and mixed into the mediumwithin the wells. The well plates were placed in a static in-cubator at 37 °C for 24 h. At times of 0, 6 and 24 h viablecounts were determined. Bacterial growth was monitoredin triplicate for each of 20 isolates of each species.
ResultsMinimum inhibitory concentrationTables 1, 2 and 3 present MIC data for each drug as geo-metric means and standard deviation for pig serum,MHB, CAMHB, CB, BHIB and TSB.
MarbofloxacinP. multocida MICs were similar for three broths, MHB,CAMHB and TSB (range = 0.05–0.07 μg/mL). MICswere 4–5-fold higher for CB and BHIB (0.25–0.27 μg/mL). Serum MIC was 0.09 μg/mL and, corrected forprotein binding, fu serum MIC was 0.04 μg/mL. Themean MIC ratio fu serum:CAMHB was 0.63:1.For A. pleuropneumoniae broth MICs were similar
(range = 0.91 μg/mL for CAMHB to 1.37 μg/mL for TSB).Serum MIC was 0.69 μg/mL and fu serum MIC was0.35 μg/mL; mean MIC ratio fu serum:CB was 0.35:1.
FlorfenicolFor P. multocida MICs in all broths were similar;range = 0.47 μg/mL for MHB to 0.55 μg/mL for CAMHB.Serum MIC was 0.30 μg/mL and fu serum MIC was0.10 μg/mL. The mean MIC ratio fu serum:CAMHBwas 0.19:1.
For A. pleuropneumoniae broth MICs ranged from0.36 μg/mL for both MHB and CAMHB to 0.45 μg/mLfor BHIB. Serum MIC was 0.47 μg/mL and fu serumMIC was 0.16 μg/mL, so that mean MIC ratio fu ser-um:CB was 0.38:1.
OxytetracyclineFor P. multocida broth MICs were similar, ranging from0.28 μg/mL (MHB) to 0.38 μg/mL (TSB). Serum MICwas 6.20 μg/mL and fu serum MIC was 1.80 μg/mL.The mean MIC ratio fu serum:CAMHB was 6.30:1.Broth MICs for A. pleuropneumoniae ranged from
2.34 μg/mL (CAMHB) to 3.22 μg/mL (TSB). Serum MICand fu serum MIC were 3.47 and 1.01 μg/mL, respectively,so that the mean MIC ratio fu serum:CB was 0.35:1.
Chemical composition of broths and serumTable 4 presents comparative data on the chemical com-position of six broths and pig serum for 14 constituents. Inaddition, for comparison with the latter, the composition
Table 1 P. multocida (PM) and A. pleuropneumoniae (APP)Minimum Inhibitory Concentrations for marbofloxacin; meanand standard deviation (SD) in pig serum and five brothsa
PM (n = 3) APP (n = 3)
Matrix Mean SD Mean SD
Serum 0.09 0.52 0.69 0.23
fu Serum 0.04 0.27 0.35 0.12
MHB 0.06 0.01 0.93 0.17
CAMHB 0.07 0.05 0.91 0.13
CB 0.25 0.14 1.00 0.00
BHIB 0.27 0.18 1.14 0.25
TSB 0.05 0.01 1.37 0.22aCation Adjusted Mueller Hinton Broth (CAMHB), Mueller Hinton Broth (MHB),Columbia Broth supplemented with NAD (CB), Brain Heart Infusion broth (BHI)and Tryptic Soy broth (TSB)
Table 2 P. multocida (PM) and A. pleuropneumoniae (APP)Minimum Inhibitory Concentrations for florfenicol; mean andstandard deviation (SD) in pig serum and five brothsa
PM (n = 3) APP (n = 3)
Matrix Mean SD Mean SD
Serum 0.30 0.13 0.47 0.18
fu Serum 0.10 0.05 0.16 0.06
MHB 0.47 0.03 0.36 0.02
CAMHB 0.55 1.19 0.36 0.04
CB 0.50 0.00 0.43 0.03
BHI 0.50 0.00 0.45 0.05
TSB 0.49 0.02 0.44 0.04aCation-adjusted Mueller Hinton Broth (CAMHB), Mueller Hinton Broth (MHB),,Columbia Broth supplemented with NAD (CB), Brain Heart Infusion broth (BHI)and Tryptic Soy broth (TSB)
Table 3 P. multocida (PM) and A. pleuropneumoniae (APP)Minimum Inhibitory Concentrations for oxytetracycline; meanand standard deviation (SD) in pig serum and five brothsa
PM (n = 3) APP (n = 3)
Matrix Mean SD Mean SD
Serum 6.20 2.06 3.47 2.38
fu Serum 1.80 0.60 1.01 0.69
MHB 0.28 0.04 2.56 0.29
CAMHB 0.29 0.04 2.34 0.24
CB 0.30 0.04 2.92 0.28
BHI 0.34 0.05 3.06 0.21
TSB 0.38 0.03 3.22 0.42aCation-adjusted Mueller Hinton Broth (CAMHB), Mueller Hinton Broth (MHB),,Columbia Broth supplemented with NAD (CB), Brain Heart Infusion broth (BHI)and Tryptic Soy broth (TSB)
Dorey and Lees BMC Veterinary Research (2017) 13:192 Page 4 of 11

Table
4Che
micalcompo
sitio
nof
broths
aandpigandcalfsera:m
eanandstandard
deviation(SD)(n
=3batche
s)a
Matrix
Totalp
rotein
(g/L)
Album
in(g/L)
Globu
lin(g/L)
Sodium
(mmol/L)
Potassium
(mmol/L)
Calcium
(mmol/L)
Magne
sium
(mmol/L)
Chloride
(mmol/L)
Inorganicph
osph
orus
(mmol/L)
Urea(m
mol/L)
Creatinine
(μmol/L)
Glucose
(mmol/L)
Iron
(μmol/L)
Unsaturated
Iron
Bind
ingCapacity
(μmol/L)
Porcineserum
79.3
40.3
39.0
153
7.13
2.59
0.98
115
2.82
4.67
139
5.47
19.1
78.00
SD2.20
0.17
2.03
4.4
0.06
0.14
0.09
8.96
0.61
3.35
5.5
0.84
0.15
0.36
Bovine
serum
74.3
38.1
37.1
148
7.07
2.55
1.00
108
3.28
5.23
149
4.43
22.2
71.00
SD3.65
2.11
1.31
15.4
1.04
0.55
0.17
7.55
0.98
0.60
9.9
0.29
0.61
0.43
MHB
3.23
0.00
3.23
125
2.49
0.13
0.23
99.23
2.55
0.93
61.3
2.57
9.47
-6.90
SD0.12
0.00
0.12
0.2
0.01
0.02
0.00
0.32
0.03
0.06
2.31
0.06
0.15
0.44
CAMHB
4.10
0.07
4.03
127
2.87
5.21
4.20
117
2.96
2.97
83.3
2.57
9.53
-7.20
SD0.44
0.06
0.46
11.5
0.21
2.14
1.68
5.29
0.34
0.64
2.08
0.25
0.17
1.24
CB
12.6
0.10
12.5
130
14.58
0.22
1.41
112
4.99
2.90
217
12.90
63.9
-56.50
SD0.20
0.00
0.20
0.1
0.01
0.01
0.02
0.26
0.02
0.10
2.31
0.00
0.62
1.74
BHI
9.67
0.10
9.57
168
10.01
0.13
0.25
123
6.86
5.97
418
10.20
7.50
-3.17
SD0.21
0.00
0.21
0.2
0.01
0.01
0.01
0.56
0.07
0.06
3.61
0.20
0.10
1.11
TSB
9.07
0.10
9.00
118
9.56
0.05
0.18
79.33
4.85
2.17
260
11.77
6.86
-2.20
SD0.06
0.06
0.10
0.1
0.01
0.02
0.00
0.06
0.02
0.06
1.53
0.15
0.25
1.74
VFM
11.4
0.87
10.5
132
38.73
0.33
1.16
104
14.31
4.87
198
3.40
25.9
-3.00
SD0.26
0.12
0.15
3.5
0.31
0.03
0.10
4.04
0.44
0.72
9.07
0.10
0.52
1.31
a Mue
llerHintonBroth(M
HB),C
ationAdjustedMue
llerHintonBroth(CAMHB),,Ve
terin
aryFastidious
Med
ium
(VFM
),Colum
biaBrothsupp
lemen
tedwith
NAD(CB),B
rain
HeartInfusion
broth(BHIB),Tryp
ticSo
ybroth
(TSB
)an
dVe
terin
aryFastidious
Med
ium
(VFM
)
Dorey and Lees BMC Veterinary Research (2017) 13:192 Page 5 of 11

of serum for another farm animal species, the calf, was de-termined (Fig. 1). The data were derived for the mean ofthree batch samples of each fluid.
Protein, albumin and globulinFor the six broths, total protein concentration was lowin MHB and CAMHB (3.23 and 4.10 g/L, respectively)but higher and similar for the four other broths (range9.07–12.6 g/L). Serum total protein concentrations werehigher, 79.3 g/L (pig) and 74.3 g/L (calf ). For all broths,the principal protein constituent was globulin (range3.23 to 12.5 g/L) whilst albumin concentrations wereuniformly low, ranging from 0.00 to 0.87 g/L, for MHBand VFM, respectively. Albumin serum concentrationswere much higher; 40.2 g/L (pig) and 38.1 g/L (calf ).Expressed as serum:broth albumin concentration ratios,these ranged from greater than 400:1 for CAMHB to46:1 for VFM.
ElectrolytesThere were moderate differences in sodium concentrationbetween the growth matrices; the lowest concentrationwas 118 mmol/L (TSB) and the highest was 168 mmol/L(BHI) and serum concentrations were intermediate, 153and 148 mmol/L, for pig and calf, respectively. Similarly,serum chloride ion concentrations for pig and calf were
intermediate (115 and 108 mmol/L, respectively) betweenthe lowest, 79 mmol/L for TSB, and highest broth concen-tration of 123 mmol/L for BHI. MHB had the lowest po-tassium concentration (2.49 mmol/L) whereas the highestconcentration was 39 mmol/L for VFM. Serum potassiumconcentrations were intermediate, 7.13 and 7.07 mmol/Lfor pig and calf, respectively.With the exception of CAMHB, the concentration of
calcium was much lower in broths, ranging from 0.05 to0.33 mmol/L, in comparison with serum, 2.59 and2.55 mmol/L for pig and calf, respectively. For CAMHBthe calcium concentration was 5.21 mmol/L. Concentra-tions of magnesium were lower in three broths(0.23 mmol/L MHB, 0.25 mmol/L BHI and 0.18 mmol/LTSB) than in serum of pig and calf, 0.98 and 1.00 mmol/L, respectively, whereas concentrations in CAMHB, CBand VFM were higher, 4.20, 1.41 and 1.16, respectively.
Inorganic phosphorus, urea, creatinine and glucoseBroth inorganic phosphorus concentrations ranged from2.55 mmol/L (MHB) to 14.3 mmol/L (VFM) and serumconcentrations were similar to MHB, 2.82 and 3.28 mmol/L for pig and calf, respectively. Broth urea concentrationsranged from 0.93 mmol/L (MHB) to 5.97 mmol/L (BHI)and concentrations in serum were slightly less than thehighest broth value, 4.67 and 5.23 mmol/L, pig and calf,
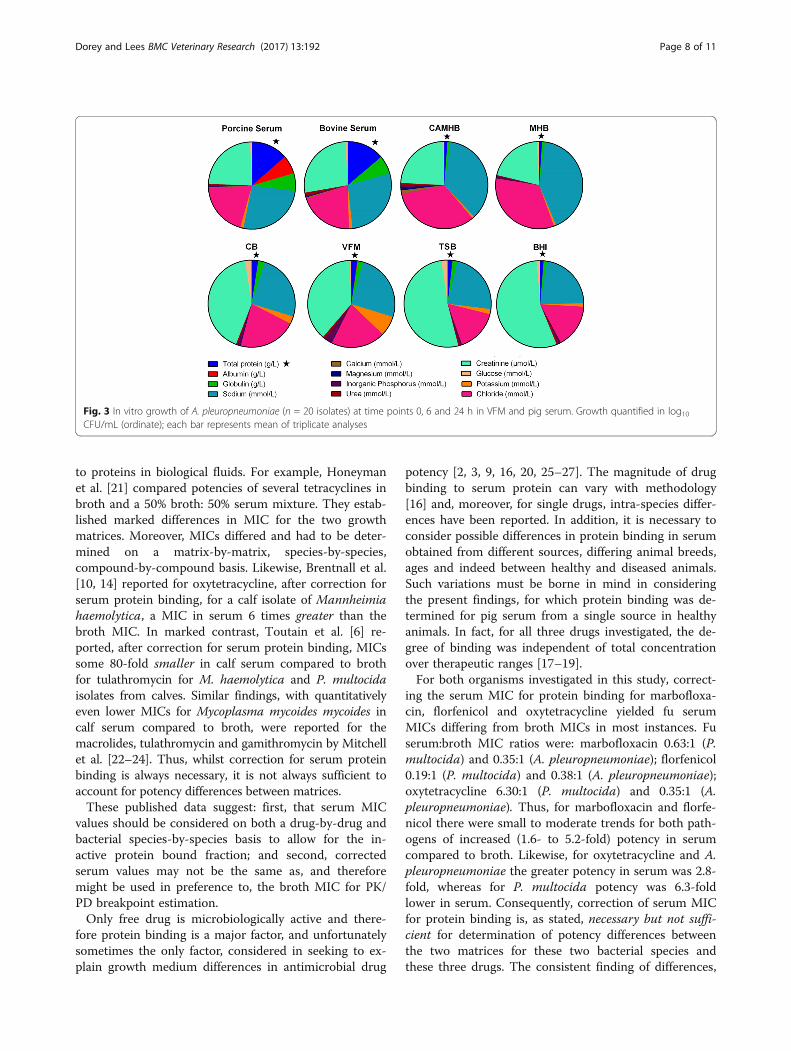
Fig. 1 Pie chart comparing the concentrations of constituents in eight matrices: Porcine serum, bovine serum, cation-adjusted Mueller HintonBroth (CAMHB), Mueller Hinton Broth (MHB), Columbia broth supplemented with NAD (CB), Veterinary Fastidious Medium (VFM), Trypic Soy broth(TSB) and Brain Heart Infusion broth (BHI). Highlighted with a star is one of the more notably important components, total protein
Dorey and Lees BMC Veterinary Research (2017) 13:192 Page 6 of 11

respectively. In broths, creatinine concentration was low-est in MHB (61 μmol/L) and highest in BHI (418 μmol/L)and serum concentrations were intermediate (139 and149 μmol/L, for pig and calf). Broth glucose concentra-tions ranged from 2.56 mmol/L (MHB and CAMHB) to12.9 mmol/L (CB) whilst serum concentrations wereintermediate, 5.47 mmol/L (pig) and 4.43 mmol/L (calf).
Iron and unsaturated iron binding capacityIron broth concentrations varied almost 10-fold, from6.86 μmol/L (TSB) to 63.9 μmol/L (CB) and serum con-centrations were intermediate, 19.1 μmol/L (pig) and22.2 μmol/L (calf ). Unsaturated iron binding capacityalso varied widely (data not shown).
Bacterial growth in absence of antimicrobial drugsFigures 2 and 3 illustrate bacterial growth rates of P.multocida and A. pleuropneumoniae, respectively. Therewere no apparent inter-isolate differences in P. multo-cida growth rates in CAMHB at 6 and 24 h. For all iso-lates at 6 h, bacterial counts had increased to 6-7x10⁹CFU/mL in broth and at 24 h counts exceeded1010 CFU/mL for all isolates. In serum, there was againminimal inter-isolate difference in growth of P. multo-cida at 6 h but the count, 5-6x10⁷CFU/mL, was lower atthis time than in CAMHB by some 2 × 10² CFU/mL.
After 24 h, there was further increase in growth butthere were some inter-isolate differences in count, whichranged from 8-10 × 1010 CFU/mL, and the serum countwas somewhat lower than the 24 h count in CAMHB atthis time.For A. pleuropneumoniae, bacterial growth was much
slower initially (at 6 h) in both media than for P. multo-cida. At 6 h the mean CFU/mL count for 20 isolates was5.37 × 105 in broth and in in serum it was significantlylower, 1.36x10²CFU/mL. In contrast with P. multocidathere was clear inter-isolate variability in growth rate at6 h. However, by 24 h considerable growth had occurredand counts were of a similar order in both media, ap-proaching or exceeding slightly 10log10 CFU/mL.
DiscussionFor some drug classes, MICs measured in broths usinginternationally standardised procedures (for example,those of CLSI and EUCAST) may not differ significantlyfrom potency estimated in biological fluids. The absenceof growth matrix differences implies no significant im-pact on PK/PD breakpoint estimation, as a basis for dosedetermination, provided that the protein bound serumdrug concentration is corrected for [4, 16, 20]. However,broth/biological fluid differences in potency do occur forother drug classes, even after correction for drug binding
Fig. 2 In vitro growth of P. multocida (n = 20 isolates) at time points 0, 6 and 24 h in CAMHB and pig serum (n = 20). Growth quantified in log10CFU/mL (ordinate); each bar represents mean of triplicate analyses
Dorey and Lees BMC Veterinary Research (2017) 13:192 Page 7 of 11
to proteins in biological fluids. For example, Honeymanet al. [21] compared potencies of several tetracyclines inbroth and a 50% broth: 50% serum mixture. They estab-lished marked differences in MIC for the two growthmatrices. Moreover, MICs differed and had to be deter-mined on a matrix-by-matrix, species-by-species,compound-by-compound basis. Likewise, Brentnall et al.[10, 14] reported for oxytetracycline, after correction forserum protein binding, for a calf isolate of Mannheimiahaemolytica, a MIC in serum 6 times greater than thebroth MIC. In marked contrast, Toutain et al. [6] re-ported, after correction for serum protein binding, MICssome 80-fold smaller in calf serum compared to brothfor tulathromycin for M. haemolytica and P. multocidaisolates from calves. Similar findings, with quantitativelyeven lower MICs for Mycoplasma mycoides mycoides incalf serum compared to broth, were reported for themacrolides, tulathromycin and gamithromycin by Mitchellet al. [22–24]. Thus, whilst correction for serum proteinbinding is always necessary, it is not always sufficient toaccount for potency differences between matrices.These published data suggest: first, that serum MIC
values should be considered on both a drug-by-drug andbacterial species-by-species basis to allow for the in-active protein bound fraction; and second, correctedserum values may not be the same as, and thereforemight be used in preference to, the broth MIC for PK/PD breakpoint estimation.Only free drug is microbiologically active and there-
fore protein binding is a major factor, and unfortunatelysometimes the only factor, considered in seeking to ex-plain growth medium differences in antimicrobial drug
potency [2, 3, 9, 16, 20, 25–27]. The magnitude of drugbinding to serum protein can vary with methodology[16] and, moreover, for single drugs, intra-species differ-ences have been reported. In addition, it is necessary toconsider possible differences in protein binding in serumobtained from different sources, differing animal breeds,ages and indeed between healthy and diseased animals.Such variations must be borne in mind in consideringthe present findings, for which protein binding was de-termined for pig serum from a single source in healthyanimals. In fact, for all three drugs investigated, the de-gree of binding was independent of total concentrationover therapeutic ranges [17–19].For both organisms investigated in this study, correct-
ing the serum MIC for protein binding for marbofloxa-cin, florfenicol and oxytetracycline yielded fu serumMICs differing from broth MICs in most instances. Fuserum:broth MIC ratios were: marbofloxacin 0.63:1 (P.multocida) and 0.35:1 (A. pleuropneumoniae); florfenicol0.19:1 (P. multocida) and 0.38:1 (A. pleuropneumoniae);oxytetracycline 6.30:1 (P. multocida) and 0.35:1 (A.pleuropneumoniae). Thus, for marbofloxacin and florfe-nicol there were small to moderate trends for both path-ogens of increased (1.6- to 5.2-fold) potency in serumcompared to broth. Likewise, for oxytetracycline and A.pleuropneumoniae the greater potency in serum was 2.8-fold, whereas for P. multocida potency was 6.3-foldlower in serum. Consequently, correction of serum MICfor protein binding is, as stated, necessary but not suffi-cient for determination of potency differences betweenthe two matrices for these two bacterial species andthese three drugs. The consistent finding of differences,
Fig. 3 In vitro growth of A. pleuropneumoniae (n = 20 isolates) at time points 0, 6 and 24 h in VFM and pig serum. Growth quantified in log10CFU/mL (ordinate); each bar represents mean of triplicate analyses
Dorey and Lees BMC Veterinary Research (2017) 13:192 Page 8 of 11

which were nevertheless unpredictable in direction (in-creased or reduced potency) and magnitude indicatesthe possibility of similar differences for human patho-gens also more frequently than is commonly recognised.Possibly the most important difference in chemical
composition between all broths and serum was in albu-min concentration, which was much higher in serum.Correction for drug binding to serum albumin revealedbroth/serum potency differences for all drugs. It is there-fore necessary to consider whether other differences, aswell as albumin content, in chemical composition mightexplain the protein binding corrected potency differ-ences. The chemical analyses indicated wide differencesin composition of five broths for electrolytes, iron andorganic compounds. Possibly surprisingly, these fre-quently large inter-broth differences resulted in, at most,very minor differences in MICs, with one exception,namely marbofloxacin, and for P. multocida only. How-ever, even for this drug and species, MICs were similarfor two broths and different but again similar for otherthree broths. In contrast, the broth and corrected serumMICs differed, despite the finding that chemical com-position of pig serum for every analyte was within thelower and upper ranges for the five broths. Therefore,chemical composition indicated no readily apparent ex-planation for the broth/serum MIC differences.In addition to the chemical differences between broths
and serum, for circulating blood there are other differ-ences e.g. the presence of white and red cells as well as awide range of immunological components in blood. Fu-ture studies should therefore be directed towards evalu-ating which of these might interact with drugs, and how,to modulate drug potency. One factor, pH, is known toinfluence the rate and extent of growth of microorgan-isms [28, 29]. An effect of pH on weakly basic drugssuch as macrolides and triamilides is well recognised [6].Zeitlinger et al. [26] compared growth curves of
Staphylococcus aureus and Pseudomonas aeruginosa inMHB and serum. Slower logarithmic growth was ob-tained for both species in serum compared to broth, andthis might be expected to provide more rapid kill inserum, as a consequence of a smaller microbial challenge[5, 30]. Indeed, Illambas et al. [31, 29] reported significanteffects of inoculum count (high, medium and low) onMIC for marbofloxacin and florfenicol and the calf pneu-monia pathogens, M. haemolytica and P. multocida, whileDorey et al. [17–19] reported similar dependency of MICon inoculum strength for the three drugs and the two pigpathogens investigated in this study.In the present study, bacterial growth was initially
greater in broths than serum for both P. multocida andA. pleuropneumoniae. This difference persisted for P.multocida at 24 h, whereas for A. pleuropneumoniaelogarithmic growth was similar for the two media at this
time. Slower growth, resulting potentially in lesser chal-lenge to bacterial kill, therefore might explain, at least inpart, the greater potency in serum compared to broth infive of six instances. The one notable exception, how-ever, was the 6-fold reduction in potency of oxytetracyc-line in serum compared to broth for P. multocida. Thisfinding indicates that some serum factor, presently un-known, operates to reduce potency of this drug for thisspecies, whilst conversely potency was increased inserum for A. pleuropneumoniae.The differences in MIC between serum and broth re-
ported in this study do not provide a rationale for abandon-ing broths by diagnostic laboratories reporting MICdistributions of wild type organisms. This would be imprac-tical and unnecessary. Rather, the present data suggest that,for marbofloxacin, florfenicol and oxytetracycline and thetwo bacterial species studied, it will be appropriate and pos-sible to apply a scaling factor, to bridge between MICs inbroths and pig serum when calculating PK/PD breakpoints.
ConclusionFor three commonly used drugs, florfenicol, oxytetracyc-line and marbofloxacin, and two pathogenic species of bac-teria causing pig pneumonia, A. pleuropneumoniae and P.multocida, differences between serum and broth MICswere obtained, after correction was made for binding toserum protein. In contrast, major differences were not ob-tained when MICs were determined in five broths, markeddifferences in chemical composition between the brothsnotwithstanding. In the absence of drugs, the rate of loga-rithmic growth of A. pleuropneumoniae and P. multocidawas slower in pig serum than in broth. It is suggested that,in using MIC data as a pharmacodynamic parameter to de-termine PK/PD breakpoints, the use of a scaling factor tobridge between broth and biological fluids may be requiredmore commonly than currently recognised.
Highlights
� For florfenicol, oxytetracycline and marbofloxacinand the pig pathogens, A. pleuropneumoniae and P.multocida, there were no major differences in MICsmeasured in five broths, widely differing in chemicalcomposition.
� Significant differences between serum and brothMICs were obtained, after correction for binding toserum protein, indicating that such correction isnecessary but that it does not alone account forpotency differences.
� With one exception potency was greater in serumthan broths.
� In using MIC data to predict dosages for clinicaluse, the use of a scaling factor to bridge betweenbroth and biological fluids may be required.
Dorey and Lees BMC Veterinary Research (2017) 13:192 Page 9 of 11

AbbreviationsATCC: American Type Culture Collection; BHI: Brain Heart Infusion Broth;CAMHB: cation-adjusted Mueller Hinton Broth; CB: Columbia Broth; CLSI: Clinicaland Laboratory Standards Institute; EUCAST: Committee on AntimicrobialSusceptibility Testing; MHB: Mueller Hinton Broth; MIC: Minimum inhibitoryconcentration; NAD: Nicotinamide Adenine Dinucleotide; PD: Pharmacodynamics;PK: Pharmacokinetics; TSB: Tryptic Soy Broth; VFM: Veterinary Fastidious Medium
AcknowledgementsLucy Dorey was a BBSRC CASE AWARD Scholar. A. Pridmore, Don WhitleyScientific, and A. Rycroft, Royal Veterinary College, supplied bacterial isolates.
FundingThis project was funded by a BBSRC and Norbrook Laboratories Ltd. CASEAward; grant number BB/101649X1.
Availability of data and materialsThe data sets supporting the results of this article are included within thearticle. Raw datasets used and/or analysed during the current study availablefrom the corresponding author on reasonable request.
Authors’ contributionsLD and PL were responsible for the study design and co-ordination, dataanalysis and both were involved in writing the manuscript. LD conductedthe experiments. Both authors approved the final manuscript.
Authors’ informationAddress: Comparative Biological Sciences, Royal Veterinary College, LondonUniversity, United Kingdom.
Competing interestsThe authors declare that they have no competing interests.
Consent for publicationNot applicable.
Ethics approval and consent to participateNot applicable.
Publisher’s NoteSpringer Nature remains neutral with regard to jurisdictional claims in publishedmaps and institutional affiliations.
Received: 16 December 2016 Accepted: 31 May 2017
References1. Toutain PL, Lees P. Integration and modelling of pharmacokinetic and
pharmacodynamic data to optimize dosage regimens in veterinarymedicine. J Vet Pharmacol Ther. 2004;27(6):467-7.
2. Nielsen EI, Cars O, Friberg LE. Pharmacokinetic/pharmacodynamic (PK/PD)indices of antibiotic predicted by a semimechanistic PK/PD model: a steptoward model-based dose optimization. Antimicrob Agents Chemother.2011;55(10):4619–30.
3. Nielsen EI, Friberg LE. Pharmacokinetic-Pharmacodynamic modeling ofantibacterial drugs. Pharmacol Rev. 2013;65(3):1053–90.
4. Lees P, Pelligand L, Illambas J, Potter T, Lacroix M, Rycroft A, et al.Pharmacokinetic/pharmacodynamic integration and modelling of amoxicillinfor the calf pathogens Mannheimia haemolytica and Pasteurella multocida.J Vet Pharmacol Ther. 2015;38(5):457–70.
5. Martinez MN, Papich MG, Drusano GL. Dosing regimen matters: theimportance of early intervention and rapid attainment of the pharmacokinetic/pharmacodynamic target. Antimicrob Agents Chemother. 2012;56(6):2795–805.
6. Toutain PL, Potter T, Pelligand L, Lacroix M, Illambas J, et al. Standard PK/PDconcepts can be applied to determine a dosage regimen for a macrolide:the case of tulathromycin in the calf. J Vet Pharmacol Ther 2016;doi: 10.1111/jvp.12333, in press.
7. CLSI. Performance Standards for Antimicrobial Disk and Dilution SusceptibilityTests for Bacteria Isolated from Animals: Approved Standard - Fourth Edition.CLSI document VET01-A4 (formerly M31-A3, 2008) Supplementary informationVET01-S, 2015. ISBN 1–56238–877-0 [print]; ISBN 1–56238–878-9 [electronic].
Clinical and Laboratory Standards Institute, 950 West Valley Road, Suite 2500,Wayne, Pennsylvania 19087 USA, 2013.
8. Papich MG. Pharmacokinetic-Pharmacodynamic (PK-PD) modelling and therational selection of dosage regimes for the prudent use of antimicrobialdrugs. Vet Micro. 2014;171(3):480–6.
9. Zeitlinger MA, Derendorf H, Mouton JW, Cars O, Craig WA, et al. ProteinBinding: Do We Ever Learn? Antimicrob Agents Chemother. 2011;55(7):3067–74.
10. Brentnall C, Cheng Z, McKellar QA, Lees P. Pharmacodynamics ofoxytetracycline administered alone and in combination with carprofen incalves. Vet Rec. 2012;171(11):273–7.
11. Aliabadi FS, Lees P. Pharmacokinetics and pharmacodynamics of danofloxacinin serum and tissue fluids of goats following intravenous and intramuscularadministration. Amer J Vet Res. 2001;62(12):1979–89.
12. Sidhu P, Landoni MF, Aliabadi FS, Lees P. Pharmacokinetic and pharmacodynamicmodelling of marbofloxacin administered alone and in combinationwith tolfenamic acid in goats. Vet J. 2010;184(2):219–29.
13. Aliabadi FS, Lees P. Pharmacokinetics and pharmacokinetic/pharmacodynamicintegration of marbofloxacin in calf serum, exudate and transudate. J VetPharmacol Ther. 2002;25(3):161–74.
14. Brentnall C, Cheng Z, McKellar QA, Lees P. Pharmacokinetic-pharmacodynamicintegration and modelling of oxytetracycline administered alone and incombination with carprofen in calves. Res Vet Sci. 2013;94(3):687–94.
15. Nightingale CH, Murakawa T. Microbiology and pharmacokinetics. InMicrobiology and pharmacokinetics Eds Nightingale, C.H., Murakawa, T. Ambrose,P.G. Marcel Dekker, A.G. New York: Marcel Dekker, Inc.; 2002. pp. 23–39.
16. Barbour AM, Schmidt S, Zhuang L. Application of pharmacokinetic/pharmacodynamic modelling and simulation for the prediction of targetattainment of ceftobiprole against meticillin-resistant Staphylococcus aureususing minimum inhibitory concentration and time–kill curve based approaches.Int J Antimicrob A. 2014;43(1):60–7.
17. Dorey L, Hobson S, Lees P. What is the true in vitro potency of oxytetracyclinefor the pig pneumonia pathogens A. pleuropneumoniae and P. multocida ?J Vet Pharmacol Ther. 2016. doi:10.1111/jvp.12386.
18. Dorey L, Hobson S, Lees P. Activity of florfenicol for the porcine pneumoniapathogens Actinobacillus pleuropneumoniae and Pasteurella multocidausing standardised versus non-standardised methodology. Vet J. 2016;doi:10.1016/j.tvjl.2016.11.004.
19. Dorey L, Hobson S, Lees P. Potency of marbofloxacin for pig pneumoniapathogens Actinobacillus pleuropneumoniae and Pasteurellamultocida: comparison of growth media. Res Vet Sci. 2016;doi:10.1016/j.rvsc.2016.11.001.
20. Gonzalez D, Schmidt S, Derendorf H. Importance of relating efficacymeasures to unbound drug concentrations for anti-infective Agents. ClinMicrobiol Rev. 2013;26(2):274–88.
21. Honeyman L, Ismail M, Nelson ML, Bhatia B, Bowser TE, Chen J, et al.Structure-activity relationship of the aminomethylcyclines and the discoveryof omadacycline. Antimicrob Agents Chemother. 2015;59:7044–53.
22. Mitchell JD, McKellar QA, McKeever DJ. Pharmacodynamics of antimicrobialsagainst Mycoplasma mycoides mycoides small colony, the causativeagent of contagious bovine pleuropneumonia: PLoS One 2012; v. 7,p. e44158.
23. Mitchell JD, Goh S, McKellar QA, DJ MK. In vitro pharmacodynamics ofgamithromycin against Mycoplasma mycoides subspecies mycoides smallColony. Vet J. 2013;197(3):806–11.
24. Mitchell JD, McKellar QA, McKeever DJ. Evaluation of antimicrobial activityagainst Mycoplasma mycoides subsp. mycoides small Colony using an invitro dynamic dilution pharmacokinetic/pharmacodynamic model. J MedMicrobiol. 2013;62(1):56–61.
25. Wise R. The clinical relevance of protein binding and tissue concentrationsin antimicrobial therapy. Clin Pharmacokinet. 1986;11(6):470–82.
26. Zeitlinger MA, Sauermann R, Traunmüller F, Georgopoulos A, MüllerM, Joukhadar C. Impact of plasma protein binding on antimicrobialactivity using time-killing curves. J Antimicrob Chemother. 2004;54(5):876–80.
27. Zeitlinger M, Sauermann R, Fille M, Hausdorfer J, Leitner I, Müller M. Plasmaprotein binding of fluoroquinolones affects antimicrobial activity. J AntimicrobChemother. 2008;61(3):561–7.
28. Russell JB, Dombrowski DB. Effect of pH on the efficiency of growth by purecultures of rumen bacteria in continuous culture. Appl Environ Microbiol.1980;39(3):604–10.
Dorey and Lees BMC Veterinary Research (2017) 13:192 Page 10 of 11

29. Illambas J, Potter T, Sidhu P, Rycroft AN, Cheng Z, et al. Pharmacodynamicsof florfenicol for calf pneumonia pathogens. Vet Rec. 2013;172(13):340–6.
30. Drusano GL. What are the properties that make an antibiotic acceptable fortherapy of community acquired pneumonia? J Antimicrob Chemother.2011;66(suppl 3):iii61–iii67. doi:10.1093/jac/dkr100. PMID: 21482571
31. Illambas J, Potter T, Cheng Z, Rycroft A, Fishwick J, et al. Pharmacodynamicsof marbofloxacin for calf pneumonia pathogens. Res Vet Sci. 2013;94(3):675–81.
• We accept pre-submission inquiries
• Our selector tool helps you to find the most relevant journal
• We provide round the clock customer support
• Convenient online submission
• Thorough peer review
• Inclusion in PubMed and all major indexing services
• Maximum visibility for your research
Submit your manuscript atwww.biomedcentral.com/submit
Submit your next manuscript to BioMed Central and we will help you at every step:
Dorey and Lees BMC Veterinary Research (2017) 13:192 Page 11 of 11