impact of external audit effort on accruals quality …
TRANSCRIPT
1
IMPACT OF EXTERNAL AUDIT EFFORT ON ACCRUALS
QUALITY WITH THE MODERATE IMPACT OF CORPORTE
GOVERNANCE: EVIDENCE FROM SRI LANKAN LISTED
COMPANIES
Shabeen, A.S.M ([email protected])
Mayadunna, A.M.A.K.C
Lakmal, G.U
Dissanayake, D.M.C.P
Thilakarathna, R.D.I.U
Ajward, A.R
ABSTRACT
This study examines the relationship between auditor`s effort in terms of audit fee and accruals
quality and how the corporate governance mechanism of the company moderates this relationship.
The sample consisted 98 companies listed in Colombo Stock Exchange (CSE) for the period
covering 2015 to 2017 representing the sectors with the highest market capitalization such as
Beverage Food and Tobacco, Diversified Holdings, Hotels and Travels and Manufacturing which
had accounted for 38% of the total market capitalization of CSE. Audit fee was considered as the
independent variable and discretionary accruals, absolute value of discretionary accruals, positive
value of discretionary accruals and negative value of discretionary accruals were used as alternative
dependent variables. Firm size, leverage, growth and being audited by a big three auditor were used
as control variables. The level of the variables were assessed and then correlation analysis and
regression analyses were performed to identify relationships between independent variable and
dependent variables and the impact of the moderator on this relationship. It was found that there is a
negative relationship between audit fee and three out of four accruals quality measures. Thus, a
positive relationship between auditor’s effort and accruals quality was found. Further, it was found
that corporate governance has moderate impact on the above relationship for certain accruals
quality measures. These findings are expected to have significant policy implications.
Keywords: Audit fee, accruals quality, earnings management, corporate governance
2
1. INTRODUCTION
Financial performance is one of the key indicators used by shareholders to assess the organization
that they have invested in (Gul, Chen & Tsui, 2003). Due to various corporate scandals (Enron,
WorldCom, etc.) that happened in the past few years due to manipulated financial reporting,
investors have become rather reluctant to invest in companies (Weerasinghe & Ajward, 2017). One
main reason for such corporate failures is the earnings management of the companies done by the
management at their discretion (Ajward, 2015). As a result, level of accruals quality or more
specifically discretionary accruals may tend to reflect opportunistic earnings management in
companies (Gul, Chen & Tsui, 2003).
According to Gul, Chen and Tsui (2003) in order to ensure that earnings are not mismanaged, the
corporates rely on external audit. As per research done by them, due to the inherent risk of earnings
management the external auditors put more effort which will in turn be associated with higher audit
fees. This study gives a valuable input to the ongoing argument about the degree of effort of the
external auditor and how an auditor should respond to the earnings management of a company
especially due to the existence of discretionary accruals (Larcker & Richardson, 2004). Several
critics argue that auditors face substantial economic costs when audit failures are observed
(DeAngelo, 1981), which specifically happens when there are discretionary accruals and the
inherent risk of the company being audited becomes high and therefore, auditors put more effort to
verify the opportunistic behaviour. Hence, the higher audit effort incurred to verify the accruals
might have an impact on the quality of accruals of the company (Gul, Chen & Tsui, 2003). Further,
if a proper corporate governance structure is not in place to direct and control the behaviour of the
managers, they may use their degree of influence in reporting financials of the company to boost up
by managing the level of accrual earnings. Thus, the role of auditor in such a situation will be
important, as mentioned above, due to the increase of risk (Larcker & Richardson, 2004).
Accordingly, it is interesting to examine whether there is relationship between audit effort in terms
of audit fee and the level of accruals quality. Prior researches have examined many sides of this, but
there is little evidence as to whether the level of an auditor`s effort in terms of the audit fee is
associated with earnings quality (Larcker & Richardson, 2004). Frankel, Johnson and Nelson
(2002) claim that there is a positive relationship between audit fees and level of accruals while
Larcker and Richardson (2004) has observed a negative relationship between level of audit fees and
discretionary accruals as more audit effort reduces the discretionary accruals. However, it was
evident when analysing the prior researches that there is a dearth of studies done in this area in both
3
Sri Lankan and foreign contexts. Further, many researchers have arrived at mixed evidence in
answering this research question. Therefore, through this study it is expected to contribute to the
ongoing debate about the relationship between the audit fee and level of accruals and the input of
this study will be significant both practically and theoretically. Further, it was observed in several
prior researches that level of corporate governance of the company also has an effect on the level of
earnings management (De Silva, Manawaduge & Ajward, 2017). Moreover, there is a dearth of
researches on audit fees and accruals quality, and the effect of corporate governance as a moderator.
Accordingly, the problem statement is whether there is a relationship between audit effort in terms
of audit fee and the level of accruals quality and how the corporate governance mechanism of the
companies moderate this relationship. Therefore, it provides a considerable validity to conduct this
study.
Based on the above research problem, there are three objectives of this study. The first objective is
to assess the level of audit fee, accruals quality and corporate governance in terms of the board
characteristics of the companies. The second objective can be stated as examining the relationship
between the fees paid to auditors and the accruals quality. The third objective is to examine the
impact of corporate governance measured in terms of board characteristics on the relationship
between audit fee and accruals quality. The variables are measured using various measurement
models such as Modified Jones model to measure the level of accruals and to establish the
relationship regression analysis is performed. Corporate governance was measured in terms of
board characteristics as the main governing body of a company is its Board of Directors (De Silva,
Manawaduge & Ajward, 2017). Accordingly, the variables used in this study have been defined in
several ways by prior researchers. Jones (1991) defines accruals as the difference between operating
cash flows and income before extraordinary items as reported in the cash flows. Quality of accruals
of a company can be defined as the probability of the accruals to be subsequently realized (Gul,
Chen & Tsui, 2003). Audit fee is the fee paid to external auditors for their effort in conducting the
statutory audit of a company and providing an opinion on the financial statements (Castro, Peleias
& De Silva, 2015). The literature defines audit effort as the number of days spent by the audit team
to complete the entire audit process (Caramanis & Lennox, 2008; Palmrose, 1984; Davidson &
Gist, 1996). A general definition of corporate governance is the system by which companies are
directed and controlled (Cabdury Committee, 1992).
4
The remainder of this paper is organized as follows. In section 2 the theories and related literature
are discussed and section 3 comprises of the methodology. In section 4 results and findings are
discussed and finally in section 5, the paper is concluded.
2. LITERATURE REVIEW
Under this section concepts, broader theories linking auditor`s effort and earnings quality and
results of empirical studies will be discussed.
2.1 Concepts
Auditor`s effort; audit fee is the fee paid to external auditors for their effort in conducting the
statutory audit of a company and providing audit opinion on the financial statements of that
company (Castro, Peleias & de Silva, 2015).Whereas Marra and Franco (2001) defines audit fee in
a more narrow perspective as a function of estimated number of hours into the hourly rate to be
charged by an auditor for the audit effort. In this study audit fee is studied as a proxy for auditor`s
effort. Several prior researches define that audit effort is the number of days spent by the audit team
(Caramanis & Lennox, 2008; Palmrose, 1984; Davidson & Gist, 1996).
Accruals quality; Jones (1991) defines accruals as the difference between operating cash flows and
income before extraordinary items as reported in the cash flows. Prior researchers have defined
accruals quality as the cash flow risk associated with misstatements that is the risk that accounting
earnings may not be converted into cash flows (Cho, 2015). It was observed by Cho that the quality
of accruals is the ability of those accruals to be converted into cash in the future. As per Dechow
and Dichev (2002) quality of accruals and earnings is the decrease of magnitude of accrual
estimation errors. Further, they state that accruals quality is the extent to which working capital
accruals map into operating cash flow realizations, where a poor match signifies a low accruals
quality and the main reason behind the poor match is estimation errors. Both the definitions
discussed earlier emphasize on the realization of earnings and in comparison to Cho (2015) Dechow
and Dichev (2002) incorporated estimation errors into defining earnings quality as well. Palepu
(2000) also discussed about estimation errors and states that estimation errors as a factor that
reduces accounting quality and suggests that quality of earnings depends on firm characteristics like
complexity of transactions and predictability of the firm`s environment.
Corporate governance; corporate governance can be defined in many ways according to the
perspective of the users. In a more operational perspective corporate governance is the process by
which companies are directed and controlled (Cadbury Report, 1992; OECD, 1999). OECD (2002)
5
defines corporate governance in a relationship perspective as a structure that specifies the
distribution of rights and responsibilities among the different participants in the organization – such
as the board, managers, shareholders and other stakeholders – and lays down the rules and
procedures for decision-making (OECD, 2002).In comparison to Cadbury report (1992), OECD
(2002) emphasizes the relationship perspective which discusses about the rights and responsibilities
of the stakeholders of the entity. In the stakeholder perspective corporate governance is the process
by which corporations are made responsive to the rights and wishes of stakeholders (Demb &
Neubauer, 1992). Demb and Neubauer (1992) state that this perspective broadly discusses about the
stakeholder inclusivity than in the relationship perspective of OECD (2002). In a financial
economics perspective corporate governance deals with the way suppliers of finance assure
themselves of getting a return on their investment (Shleifer & Vishny, 1997). And in the societal
perspective, the definition is expanded to the whole society and presents a much broader definition
to corporate governance as the whole set of legal, cultural, and institutional arrangements that
determine what (public) corporations can do, who controls them; how that control is exercised, and
how the risks and return from the activities they undertake are allocated (Blair, 1995). According to
the definitions discussed above in a more generalized view, corporate governance ensures that the
companies are governed and managed in an ethical manner with a holistic system including all the
stakeholders.
2.2 Broader theories linking auditor`s effort and earnings quality
The relationship between auditor`s effort and earnings quality can be linked to the established
theories such as agency theory and stakeholder theory. Hill and Jones (1992) states that an agency
relationship arises when one or more principles engage another person as their agent to perform
services on behalf of the principle. Similar to Hill and Jones (1992), both Jensen and Meckling
(1976) & Ross (1973) defines an agency relationship as one in which one or more persons (the
principal) engages another person (the agent) to perform some service on their behalf which
involves delegating some decision-making authority to the agent. An agency problem arises when
the interest of the principal and the agent differs and doesn’t align in the same way.
According to Institute of Chartered Accountants in England and Wales (2005) agency theory
suggests that as a result of information asymmetries and self-interest, principals’ lack reasons to
trust their agents and will put in place various mechanisms to avoid conflicts of interest and align
the principal and agents interest to reduce opportunistic behavior. In a company the role of the
principal is played by the shareholders and the role of the agent is played by the management of the
company. As a mechanism to align the interest of management and shareholder, the principal i.e.
6
can employ auditors to provide an independent review on the work of the agents and information
provided by the agent (Hill & Jones, 1992). Therefore, the entry of auditor in to the relationship
generates and agency cost which is the audit fee.
Further, the level of accruals of an organization is at the discretion of the managers who are agents
of an entity (Gul, Chen & Tsui, 2003). Thus, Gul, Chen and Tsui (2003) claims that when the
accruals of an entity is highly discretionary the auditor will have to assess the risk of misstatement
as high and will incur an extra effort to conduct the audit of the company. Therefore, the audit fee
will have to be amended according to the effort of the auditor. Thus, the agency theory provides a
foreground for the accruals quality and audit fee relationship as the auditor is employed as a
mechanism to monitor agent`s activities (Demsetz, 1983).
Apart from the agency theory the relationship between auditor`s effort and accruals quality can also
be analyzed in relation to stakeholder theory. The traditional definition of a stakeholder is “any
group or individual who can affect or is affected by the achievement of the organization’s
objectives” (Freeman, 1984). In contrast to Freeman (1984), Friedman (2006) states that the
organization itself should be thought of as grouping of stakeholders and the purpose of the
organization should be to manage their interests, needs and viewpoints. The managers should
manage the corporation for the benefit of its stakeholders in order to ensure their rights and the
participation in decision making on one hand and on the other hand the management must act as the
stockholder’s agent to ensure the survival of the firm to safeguard the long term stakes of each
group (Fontaine, 2006). Then the external auditor will be appointed by the shareholders to review
the management and provide an independent judgment on the firm`s performance and the
stakeholders will rely on this information for decision making and the cost of this appointment will
be the audit fee. The above mentioned theories imply the necessity of auditor and the incurring of
the audit fee to manage the earnings quality of the organization.
2.3 Empirical Studies
There are several prior researches done to identify the relationship between accrual quality and
auditor fees incorporating corporate governance impact. These results can be discussed as follows.
2.3.1 Assessing the level of audit fee, accruals quality and corporate governance
To assess the level of audit fee, various measures has been used by the previous researchers.
However, Alali (2011) and Gul, Chen and Tsui (2003) have used the general audit fee model used
in prior studies representing audit fees as a function of client size, client complexity, and client
7
risk and audit quality. According to the audit fee model, audit fees are expected to be high in
relation to firm size, complexity as measured by the log segments and risks associated with
inventory, receivables and debt. According to Alali (2011) and Gul, Chen and Tsui (2003) audit
fees exhibit a wide range variation as the standard deviation of the audit fee of both the studies are
1.535 and 1.181 respectively.
To assess the accruals quality, researches has used some specific models introduced by the
previous researchers. Doyle, Ge and McVay (2007) has used measure of accrual estimation error
developed in Dechow and Dichev (2002) and modified in McNichols (2002) and Francis (2005).
This measure defines the quality of accruals as the extent to which they map to present, past and
future cash flows. They have used standard deviation as the measure of accruals quality and a
higher standard deviation indicates lower accruals quality. However, the Dechow and Dichev
(2002) approach limits the applicability of the model to accruals that are short term in nature.
Therefore, in addition to this model, the modified Jones model has been widely used by the
researchers to assess the accruals quality (Gul, Chen & Tsui, 2003; Larcker & Richardson, 2004;
De Silva, Manawaduge & Ajward, 2017). As per the findings of De Silva, Manawaduge and
Ajward (2017) in Sri Lankan context, average value of absolute discretionary accruals is 0.077
and the median value is 0.060; while the standard deviation is recorded as 0.065 indicating that
there are no significant variances. Guay (1996) report evidence that the modified Jones model as
described in Dechow (1995) is superior to other models in isolating the effects of discretionary
accruals.
To assess the level of corporate governance, many measurements has been used by the
researchers. Many researchers have assessed the level of corporate governance in terms of board
characteristics (De Silva, Manawaduge & Ajward, 2017). According to their findings, in terms
of number of board directors, the results indicate that on average there are eight directors on the
board and three of them are independent non-executive directors and 85% of firms are observed to
have CEO Chairman duality where these firms had complied with corporate governance best
practices and six board meetings have been conducted by those selected firms, which is in
compliance with the requirements of the code of best practices. However, Larcker and Richardson
(2004) apart from using board composition, has measured the corporate governance in terms of
institutional holdings, insider holdings as well. Accordingly, there is a strong negative correlation
between institutional holdings and corporate insider holdings and institutional holdings are greater
for firms with larger and more independent boards (Larcker & Richardson, 2004).
8
2.3.2 Relationship between the audit fee and accruals quality
Many prior studies have assessed the relationship between the audit fee and accruals quality.
However, most of these researches provide mixed evidence on this relationship. These findings can
be summarized as follows:
2.3.2.1 Positive Relationship
Frankel, Johnson, and Nelson (2002) claim that there is a positive relationship between the
provision of non-audit services and accrual measures using data collected from proxy statements.
Mande and Son (2015) also found that high level of audit fees reflect high audit effort which in turn
enhances accruals quality using a sample of 25, 470 firm year observations of companies based on
USA. Hence, the high level of audit fees are associated with high level of accruals quality which
indicates that a positive relationship between audit fee and accruals quality.
According to the study done by Lin, Lin and Chen (2016) based on 17,510 firm year observations
of companies listed in US stock exchange, the regression results revealed that normal audit fees
have a positive association with good accruals and a negative association with accrual estimation
error. However, the associations are not the same for abnormal audit fees. They found that
abnormal audit fees do not reflect auditors’ effort or higher audit quality. Further Schelleman and
Knechel (2010) did a study to establish a relationship between short term accruals and audit fee.
Primary results of the study revealed that signed short-term accruals are positively associated with
audit fees as well as total audit effort.
2.3.2.2 Negative Relationship
However, in comparison to Frankel, Johnson and Nelson (2002), Larcker and Richardson (2004)
has performed a research to explore whether there is an association between audit fees & accruals
quality and have arrived at mixed evidence. Using pooled sample, they find that the ratio of non-
audit fees to total fees has a positive relationship with the absolute value of accruals. However,
using latent class mixture models to identify clusters of firms with a homogenous regression
structure reveals that this positive association only occurs for about 8.5% of the sample. In contrast
to the fee ratio results, they find consistent evidence of a negative relationship between the level of
fees (both audit and non-audit) paid to auditors and accruals (i.e., higher fees are associated with
smaller accruals) which implies that as more audit effort is put to verify the accruals resulting in an
increased audit fee while the discretionary accruals are minimized.
9
On the other hand, Gul, Chen and Tsui (2003) examined the linkages between discretionary
accruals (DAs), managerial share ownership, management compensation and audit fees of 648
Australian firms. They have found that there is a positive association between DAs and audit fees
which imply that more audit effort is put verify the accruals resulting in an increased audit fee and
managerial ownership negatively affects the positive relationship between DAs and audit fees.
Further, this negative impact is further found to be weaker for firms with high accounting-based
management compensation.
Further, Alali (2011) found that there is a positive and significant association between DAs and
audit fees using date from the sample of companies listed in US stock exchange and due to this
audit fee has a negative association with accruals quality. Evidence shows that this relationship is
significantly higher as CFO's bonuses increase and that this relationship is moderated as CFO's
salaries increase. It is also found that income‐increasing DAs are positively and significantly related
with audit fees and that increase in CFO's bonuses signifies this positive relationship. As per Alali
(2011), the findings indicated that the coefficient of CFOD*Bonus*DA is significantly positive
indicating that the higher the bonuses of the CFO, the relationship between DA and audit fees
become even more positive and significant.
Based on the above observations it is evident that there are mixed evidence with regard to the
relationship between audit effort in terms of audit fee and accruals quality.
2.3.3 Moderating impact of corporate governance on the relationship between audit fee and
accruals quality
As per the study conducted by De Silva, Manawaduge and Ajward (2017) to observe relationship
between earnings management and corporate governance mechanisms of selected companies in Sri
Lankan context, it was found that when the board of directors of the company comprises with more
directors with qualifications in accounting and finance, earnings management is less likely to occur.
It is also observed that any of the other board characteristics or audit committee characteristics did
not have any impact in reducing earnings management in the selected Sri Lankan companies. In the
foreign context, Larcker and Richardson (2003) have used corporate governance as a moderator and
they have measured corporate governance in terms of institutional holdings, insider holdings and
board composition. Accordingly, they have found that the negative relationship between audit fee
and earnings quality is strongest for the cluster of firms with weak corporate governance.
10
Some studies have been done to associate internal controls and accruals quality. According to
Doyle, Ge and McVay (2007) it was found that the firms with weak internal control over financial
reporting generally have lower accruals quality. Contrast to this Lu, Richardson and Salterio (2011)
found that there is a negative association between internal control weaknesses and accrual quality.
Further, Klein (2002) specify that there is a negative relationship between board independence and
abnormal accruals and that most pronounced effects occur when either the board or the audit
committee is comprised of a minority of outside directors.
When analyzing prior researches done in this area it could be observed that there is a dearth of
studies done associating audit fee and accrual quality with corporate governance as a moderate
variable. It is also observed that most of the researches had mixed evidence with regard to the
relationship between audit fee in terms of audit effort and accruals quality which is discussed under
the section 2.3.2 relationship between audit fee and accruals quality.
3. RESEARCH DESIGN AND METHODS
The methodology that was used in this study is described in this section in terms of the research
approach, population and the sample, conceptual diagram, hypotheses, variables under observation
and collection and analysis of data.
3.1 Research Approach
In this research, the relationship between audit fee and accruals quality is tested. Since a
relationship is established in the study, quantitative approach is used. This approach has been used
in the prior researches such as Larcker and Richardson (2004), De Silva, Manawaduge and Ajward
(2017) and Gul, Chen and Tsui (2003). Thus, it takes a deductive approach. Further, data on more
than one company (case) for more than one year (observations) is used in the research. Therefore,
the research approach of this study is quantitative cross sectional research approach.
3.2 Population and Study Sample
Public Limited Companies (PLC) which were listed in Colombo Stock Exchange (CSE) on 31st
March 2017 were used as the population. Accordingly, the population size is 295 which is
categorised into 20 sectors. However, the Banks, Finance and Insurance sector was excluded as they
are highly regulated and their financial statement structure is different from all other sectors and the
companies with 31st December as year-end were also excluded. Out of the companies listed in CSE,
companies in the four sectors with the highest market capitalization such as Beverage Food and
11
Tobacco, Diversified Holdings, Hotels and Travels and Manufacturing with March 31st as year-end
were taken into the sample. The sample covers 49% of the total market capitalization excluding
Banks, Finance and Insurance Sector. Moreover, it covers 77% of market capitalization of
companies excluding companies in Banks, Finance and Insurance Sector and companies with 31st
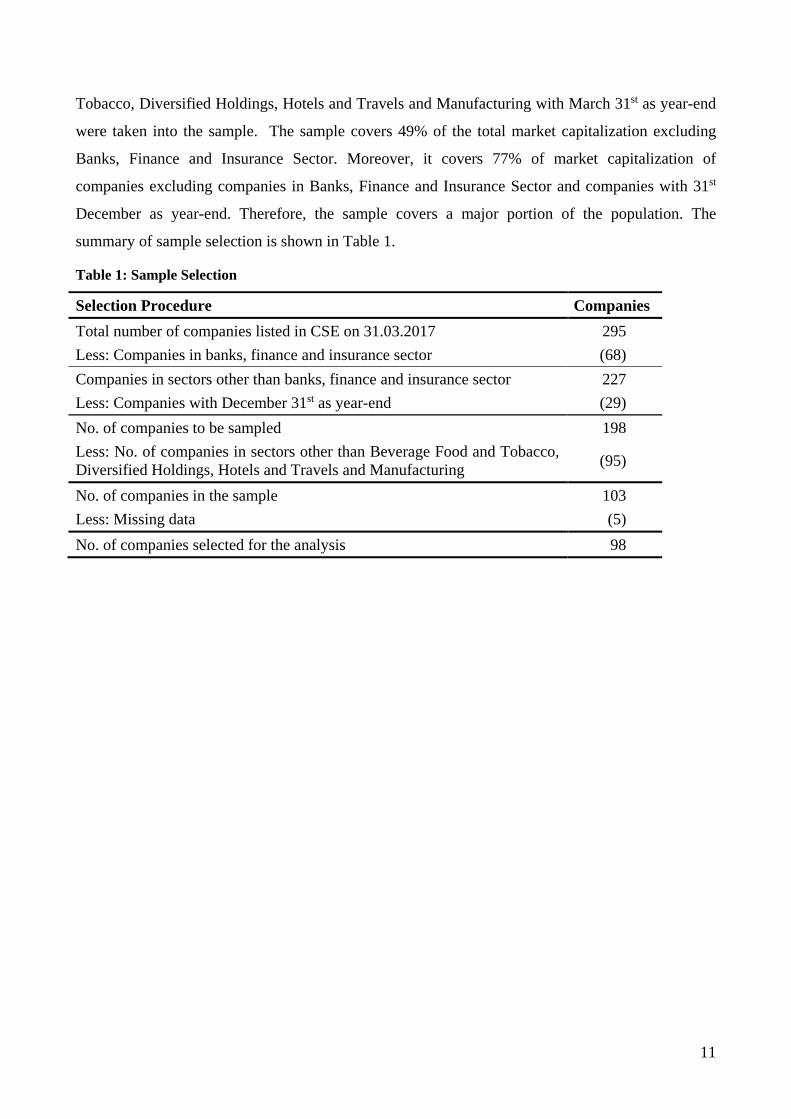
December as year-end. Therefore, the sample covers a major portion of the population. The
summary of sample selection is shown in Table 1.
Table 1: Sample Selection
Selection Procedure Companies Total number of companies listed in CSE on 31.03.2017 295 Less: Companies in banks, finance and insurance sector (68) Companies in sectors other than banks, finance and insurance sector 227 Less: Companies with December 31st as year-end (29) No. of companies to be sampled 198 Less: No. of companies in sectors other than Beverage Food and Tobacco, Diversified Holdings, Hotels and Travels and Manufacturing (95)
No. of companies in the sample 103 Less: Missing data (5) No. of companies selected for the analysis 98
12
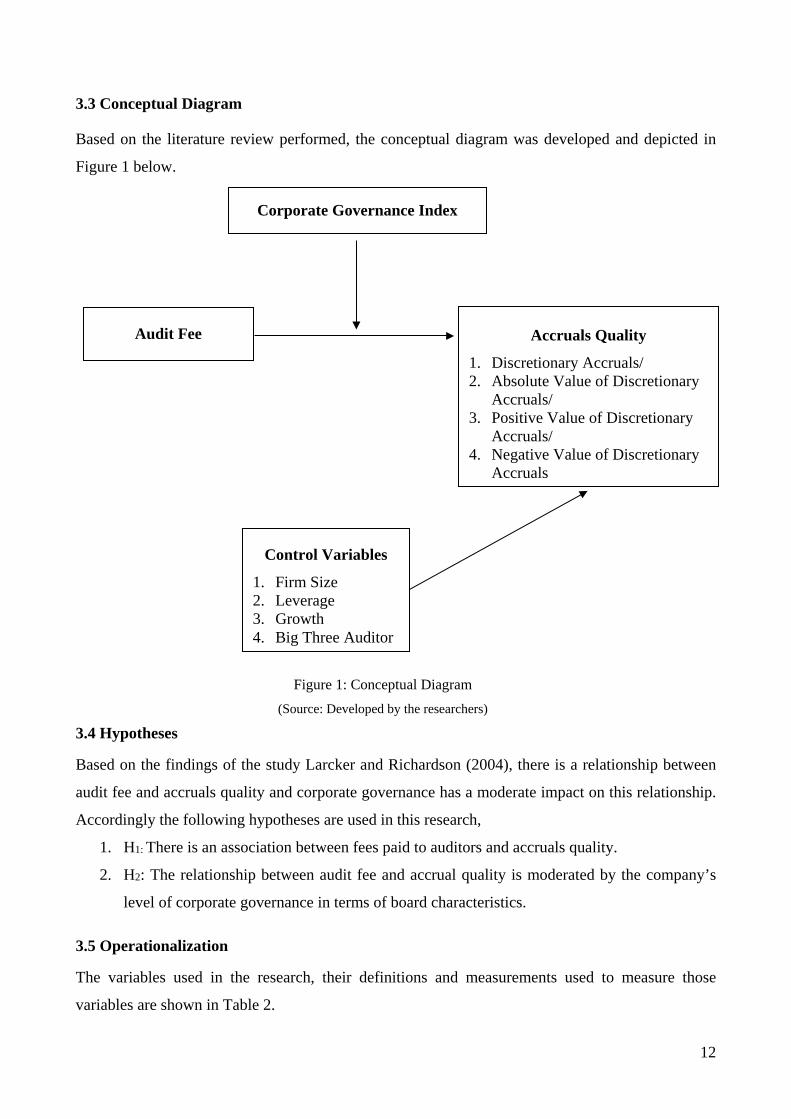
3.3 Conceptual Diagram
Based on the literature review performed, the conceptual diagram was developed and depicted in
Figure 1 below.
3.4 Hypotheses
Based on the findings of the study Larcker and Richardson (2004), there is a relationship between
audit fee and accruals quality and corporate governance has a moderate impact on this relationship.
Accordingly the following hypotheses are used in this research,
1. H1: There is an association between fees paid to auditors and accruals quality.
2. H2: The relationship between audit fee and accrual quality is moderated by the company’s
level of corporate governance in terms of board characteristics.
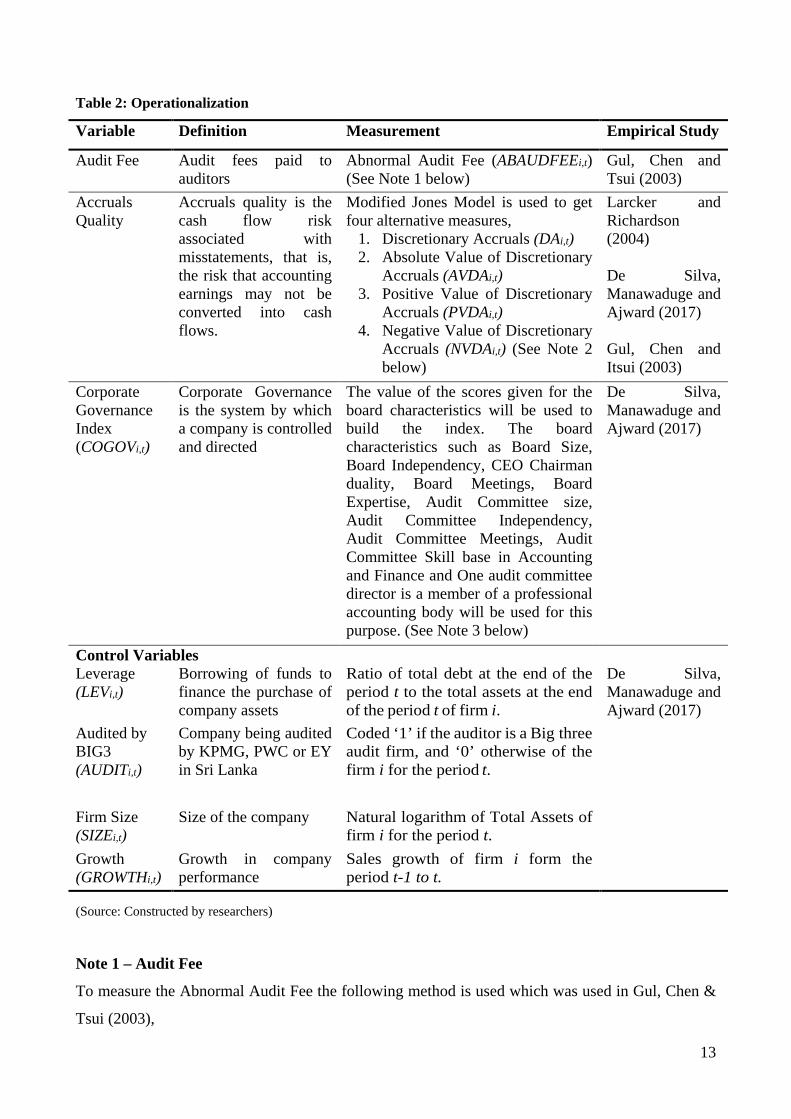
3.5 Operationalization
The variables used in the research, their definitions and measurements used to measure those
variables are shown in Table 2.
Audit Fee
Accruals Quality
1. Discretionary Accruals/ 2. Absolute Value of Discretionary
Accruals/ 3. Positive Value of Discretionary
Accruals/ 4. Negative Value of Discretionary
Accruals
Corporate Governance Index
Figure 1: Conceptual Diagram (Source: Developed by the researchers)
Control Variables
1. Firm Size 2. Leverage 3. Growth 4. Big Three Auditor
13
Table 2: Operationalization
Variable Definition Measurement Empirical Study
Audit Fee Audit fees paid to auditors
Abnormal Audit Fee (ABAUDFEEi,t) (See Note 1 below)
Gul, Chen and Tsui (2003)
Accruals Quality
Accruals quality is the cash flow risk associated with misstatements, that is, the risk that accounting earnings may not be converted into cash flows.
Modified Jones Model is used to get four alternative measures,
1. Discretionary Accruals (DAi,t) 2. Absolute Value of Discretionary
Accruals (AVDAi,t) 3. Positive Value of Discretionary
Accruals (PVDAi,t) 4. Negative Value of Discretionary
Accruals (NVDAi,t) (See Note 2 below)
Larcker and Richardson (2004) De Silva, Manawaduge and Ajward (2017) Gul, Chen and Itsui (2003)
Corporate Governance Index (COGOVi,t)
Corporate Governance is the system by which a company is controlled and directed
The value of the scores given for the board characteristics will be used to build the index. The board characteristics such as Board Size, Board Independency, CEO Chairman duality, Board Meetings, Board Expertise, Audit Committee size, Audit Committee Independency, Audit Committee Meetings, Audit Committee Skill base in Accounting and Finance and One audit committee director is a member of a professional accounting body will be used for this purpose. (See Note 3 below)
De Silva, Manawaduge and Ajward (2017)
Control Variables De Silva, Manawaduge and Ajward (2017)
Leverage (LEVi,t)
Borrowing of funds to finance the purchase of company assets
Ratio of total debt at the end of the period t to the total assets at the end of the period t of firm i.
Audited by BIG3 (AUDITi,t)
Company being audited by KPMG, PWC or EY in Sri Lanka
Coded ‘1’ if the auditor is a Big three audit firm, and ‘0’ otherwise of the firm i for the period t.
Firm Size (SIZEi,t)
Size of the company Natural logarithm of Total Assets of firm i for the period t.
Growth (GROWTHi,t)
Growth in company performance
Sales growth of firm i form the period t-1 to t.
(Source: Constructed by researchers)
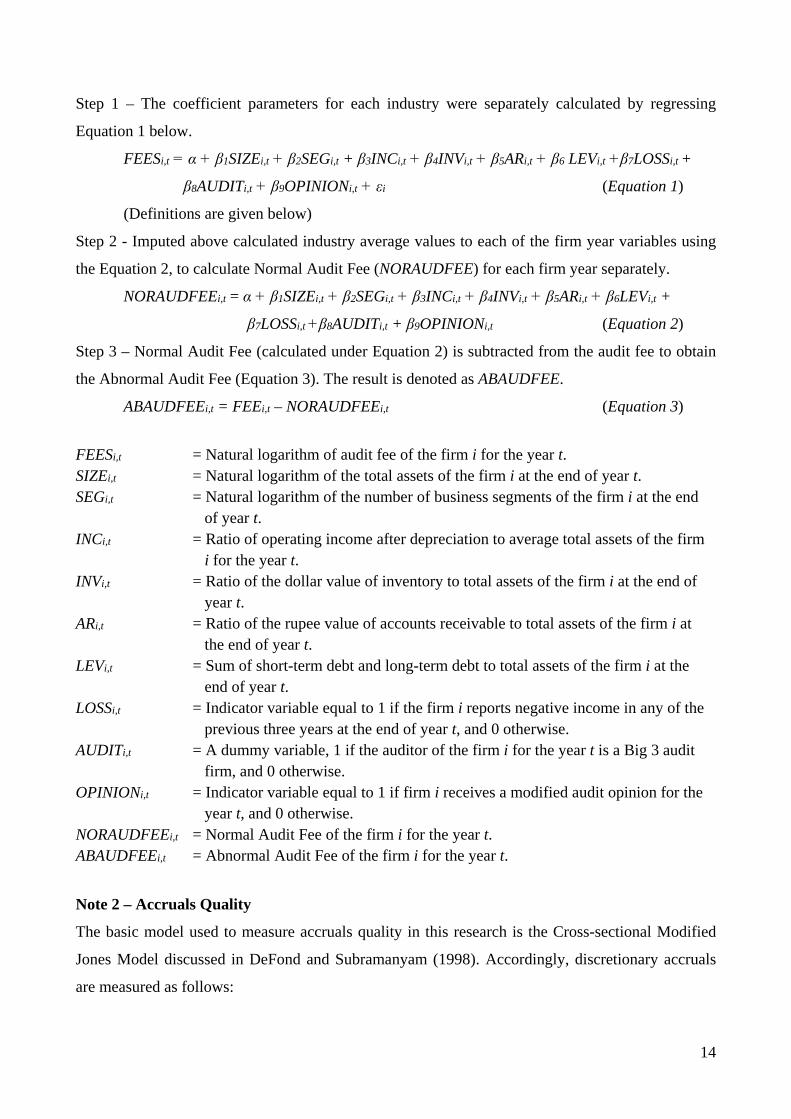
Note 1 – Audit Fee
To measure the Abnormal Audit Fee the following method is used which was used in Gul, Chen &
Tsui (2003),
14
Step 1 – The coefficient parameters for each industry were separately calculated by regressing
Equation 1 below.
FEESi,t = α + β1SIZEi,t + β2SEGi,t + β3INCi,t + β4INVi,t + β5ARi,t + β6 LEVi,t +β7LOSSi,t +
β8AUDITi,t + β9OPINIONi,t + εi (Equation 1)
(Definitions are given below)
Step 2 - Imputed above calculated industry average values to each of the firm year variables using
the Equation 2, to calculate Normal Audit Fee (NORAUDFEE) for each firm year separately.
NORAUDFEEi,t = α + β1SIZEi,t + β2SEGi,t + β3INCi,t + β4INVi,t + β5ARi,t + β6LEVi,t +
β7LOSSi,t +β8AUDITi,t + β9OPINIONi,t (Equation 2)
Step 3 – Normal Audit Fee (calculated under Equation 2) is subtracted from the audit fee to obtain
the Abnormal Audit Fee (Equation 3). The result is denoted as ABAUDFEE.
ABAUDFEEi,t = FEEi,t – NORAUDFEEi,t (Equation 3)
FEESi,t = Natural logarithm of audit fee of the firm i for the year t. SIZEi,t = Natural logarithm of the total assets of the firm i at the end of year t. SEGi,t = Natural logarithm of the number of business segments of the firm i at the end
of year t. INCi,t = Ratio of operating income after depreciation to average total assets of the firm
i for the year t. INVi,t = Ratio of the dollar value of inventory to total assets of the firm i at the end of
year t. ARi,t = Ratio of the rupee value of accounts receivable to total assets of the firm i at
the end of year t. LEVi,t = Sum of short-term debt and long-term debt to total assets of the firm i at the
end of year t. LOSSi,t = Indicator variable equal to 1 if the firm i reports negative income in any of the
previous three years at the end of year t, and 0 otherwise. AUDITi,t = A dummy variable, 1 if the auditor of the firm i for the year t is a Big 3 audit
firm, and 0 otherwise. OPINIONi,t = Indicator variable equal to 1 if firm i receives a modified audit opinion for the
year t, and 0 otherwise. NORAUDFEEi,t = Normal Audit Fee of the firm i for the year t. ABAUDFEEi,t = Abnormal Audit Fee of the firm i for the year t.
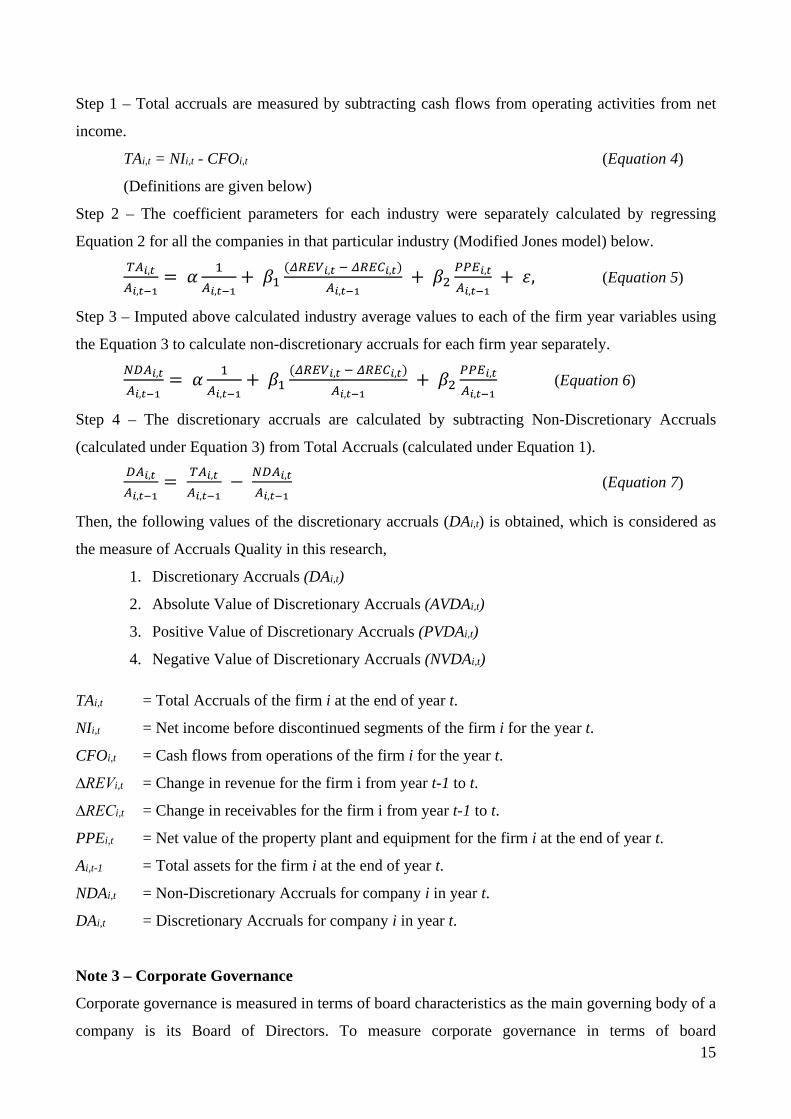
Note 2 – Accruals Quality
The basic model used to measure accruals quality in this research is the Cross-sectional Modified
Jones Model discussed in DeFond and Subramanyam (1998). Accordingly, discretionary accruals
are measured as follows:
15
Step 1 – Total accruals are measured by subtracting cash flows from operating activities from net
income.
TAi,t = NIi,t - CFOi,t (Equation 4)
(Definitions are given below)
Step 2 – The coefficient parameters for each industry were separately calculated by regressing
Equation 2 for all the companies in that particular industry (Modified Jones model) below. 𝑇𝑇𝑇𝑇𝑖𝑖,𝑡𝑡𝑇𝑇𝑖𝑖,𝑡𝑡−1
= 𝛼𝛼 1𝑇𝑇𝑖𝑖,𝑡𝑡−1
+ 𝛽𝛽1(𝛥𝛥𝑅𝑅𝑅𝑅𝑅𝑅𝑖𝑖,𝑡𝑡 − 𝛥𝛥𝑅𝑅𝑅𝑅𝑅𝑅𝑖𝑖,𝑡𝑡)
𝑇𝑇𝑖𝑖,𝑡𝑡−1 + 𝛽𝛽2
𝑃𝑃𝑃𝑃𝑅𝑅𝑖𝑖,𝑡𝑡𝑇𝑇𝑖𝑖,𝑡𝑡−1
+ 𝜀𝜀, (Equation 5)
Step 3 – Imputed above calculated industry average values to each of the firm year variables using
the Equation 3 to calculate non-discretionary accruals for each firm year separately. 𝑁𝑁𝑁𝑁𝑇𝑇𝑖𝑖,𝑡𝑡𝑇𝑇𝑖𝑖,𝑡𝑡−1
= 𝛼𝛼 1𝑇𝑇𝑖𝑖,𝑡𝑡−1
+ 𝛽𝛽1(𝛥𝛥𝑅𝑅𝑅𝑅𝑅𝑅𝑖𝑖,𝑡𝑡 − 𝛥𝛥𝑅𝑅𝑅𝑅𝑅𝑅𝑖𝑖,𝑡𝑡)
𝑇𝑇𝑖𝑖,𝑡𝑡−1 + 𝛽𝛽2
𝑃𝑃𝑃𝑃𝑅𝑅𝑖𝑖,𝑡𝑡𝑇𝑇𝑖𝑖,𝑡𝑡−1
(Equation 6)
Step 4 – The discretionary accruals are calculated by subtracting Non-Discretionary Accruals
(calculated under Equation 3) from Total Accruals (calculated under Equation 1). 𝑁𝑁𝑇𝑇𝑖𝑖,𝑡𝑡𝑇𝑇𝑖𝑖,𝑡𝑡−1
= 𝑇𝑇𝑇𝑇𝑖𝑖,𝑡𝑡𝑇𝑇𝑖𝑖,𝑡𝑡−1
− 𝑁𝑁𝑁𝑁𝑇𝑇𝑖𝑖,𝑡𝑡𝑇𝑇𝑖𝑖,𝑡𝑡−1
(Equation 7)
Then, the following values of the discretionary accruals (DAi,t) is obtained, which is considered as
the measure of Accruals Quality in this research,
1. Discretionary Accruals (DAi,t)
2. Absolute Value of Discretionary Accruals (AVDAi,t)
3. Positive Value of Discretionary Accruals (PVDAi,t)
4. Negative Value of Discretionary Accruals (NVDAi,t)
TAi,t = Total Accruals of the firm i at the end of year t.
NIi,t = Net income before discontinued segments of the firm i for the year t.
CFOi,t = Cash flows from operations of the firm i for the year t.
∆REVi,t = Change in revenue for the firm i from year t-1 to t.
∆RECi,t = Change in receivables for the firm i from year t-1 to t.
PPEi,t = Net value of the property plant and equipment for the firm i at the end of year t.
Ai,t-1 = Total assets for the firm i at the end of year t.
NDAi,t = Non-Discretionary Accruals for company i in year t.
DAi,t = Discretionary Accruals for company i in year t.
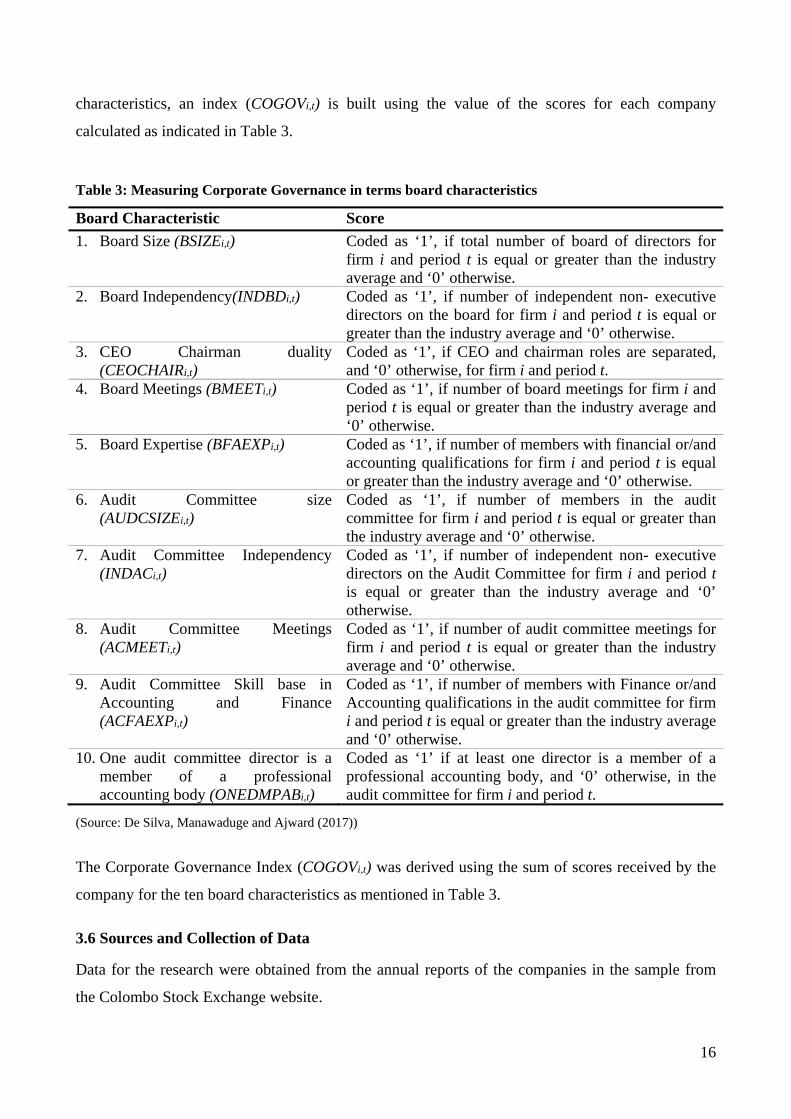
Note 3 – Corporate Governance
Corporate governance is measured in terms of board characteristics as the main governing body of a
company is its Board of Directors. To measure corporate governance in terms of board
16
characteristics, an index (COGOVi,t) is built using the value of the scores for each company
calculated as indicated in Table 3.
Table 3: Measuring Corporate Governance in terms board characteristics
Board Characteristic Score 1. Board Size (BSIZEi,t) Coded as ‘1’, if total number of board of directors for
firm i and period t is equal or greater than the industry average and ‘0’ otherwise.
2. Board Independency(INDBDi,t) Coded as ‘1’, if number of independent non- executive directors on the board for firm i and period t is equal or greater than the industry average and ‘0’ otherwise.
3. CEO Chairman duality (CEOCHAIRi,t)
Coded as ‘1’, if CEO and chairman roles are separated, and ‘0’ otherwise, for firm i and period t.
4. Board Meetings (BMEETi,t) Coded as ‘1’, if number of board meetings for firm i and period t is equal or greater than the industry average and ‘0’ otherwise.
5. Board Expertise (BFAEXPi,t) Coded as ‘1’, if number of members with financial or/and accounting qualifications for firm i and period t is equal or greater than the industry average and ‘0’ otherwise.
6. Audit Committee size (AUDCSIZEi,t)
Coded as ‘1’, if number of members in the audit committee for firm i and period t is equal or greater than the industry average and ‘0’ otherwise.
7. Audit Committee Independency (INDACi,t)
Coded as ‘1’, if number of independent non- executive directors on the Audit Committee for firm i and period t is equal or greater than the industry average and ‘0’ otherwise.
8. Audit Committee Meetings (ACMEETi,t)
Coded as ‘1’, if number of audit committee meetings for firm i and period t is equal or greater than the industry average and ‘0’ otherwise.
9. Audit Committee Skill base in Accounting and Finance (ACFAEXPi,t)
Coded as ‘1’, if number of members with Finance or/and Accounting qualifications in the audit committee for firm i and period t is equal or greater than the industry average and ‘0’ otherwise.
10. One audit committee director is a member of a professional accounting body (ONEDMPABi,t)
Coded as ‘1’ if at least one director is a member of a professional accounting body, and ‘0’ otherwise, in the audit committee for firm i and period t.
(Source: De Silva, Manawaduge and Ajward (2017))
The Corporate Governance Index (COGOVi,t) was derived using the sum of scores received by the
company for the ten board characteristics as mentioned in Table 3.
3.6 Sources and Collection of Data
Data for the research were obtained from the annual reports of the companies in the sample from
the Colombo Stock Exchange website.
17
3.7 Data Analysis Strategies
In order to analyse the data, initially cleaning and screening was performed where the missing data
and outliers were treated. Then, descriptive statistics was performed to describe and understand the
data. To achieve the objectives of this research the following analysis were performed.
Objective 1 - Assess the level of audit fee, accruals quality and corporate governance in terms
of board characteristics of the companies.
Descriptive statistics such as mean, median, standard deviation, quartiles, skewness and kurtosis
was used to assess the levels of audit fee, accruals quality and corporate governance in terms of
board characteristics of the companies.
Objective 2 - Examine the relation between the audit fee and the accruals quality.
The relationship between audit fee and accruals quality was analysed using three methods.
1. A Pearson’s’ Correlation analysis was done which analyses the relationship on a bivariate
basis (without considering the impact of the control variables)
2. An OLS regression analysis was done using the following regression model for each of the
accrual measures which considers the impact of the control variables,
(DAi,t) / (AVDAi,t) / (PVDAi,t) / (NVDAi,t) = α + β1ABAUDFEEi,t + β2LEVi,t + β3AUDITi,t
+ β4SIZEi,t + β5GROWTHi,t + εi,t (Equation 8)
(Definitions of each variable are provided in Table 2 on operationalization)
3. A multivariate panel regression analysis was done using the above regression model
(Equation 8) for each of the accrual measures. 1
Objective 3 - Examine the moderate impact of corporate governance measured in terms of
board characteristics on the relationship between audit fee and accruals quality.
The moderate impact of corporate governance measured in terms of board characteristics on the
relationship between audit fee and accruals quality was analyzed using three methods.
1. The companies were categorized into three categories as companies with strong, average
and weak corporate governance using Corporate Governance Index (COGOVi,t) as
mentioned in Table 2 and the above analysis (panel regression analysis performed for
1 The regression assumptions of normality, linearity, homoscedasticity and independence were tested and no
significant anomalies were identified. Further, Hausman Test was performed and as per the result of the
Hausman Test, Fixed effect was selected.
18
objective 2) was performed for each categories of companies and the strength of the R2
values were used to check whether the explanatory power of the model increases as
corporate governance level increase.
2. A OLS regression analysis was performed using the following regression model to test the
interaction affect by checking whether the interaction coefficient is significant,
(DAi,t) / (AVDAi,t) / (PVDAi,t) / (NVDAi,t) = α + β1ABAUDFEEi,t + β2COGOVi,t +
β3(ABAUDFEEi,t X COGOVi,t) + β4LEVi,t +
β5BIG3i,t + β6FSIZEi,t + β7GROWTHi,t + εi,t
(Equation 9)
(Definitions of each variable are provided in Table 2 on operationalization)
3. A multivariate panel regression analysis was performed using the above regression model
(Equation 9) to test the interaction affect by checking whether the interaction coefficient is
significant.
4 FINDINGS AND DISCUSSIONS
Several statistical analyses were conducted to identify the nature of the collected dataset and ensure
the validity of the sample before performing the main analyses. Results of descriptive statistics,
correlation analysis and regression analyses and related discussions on the results are presented
below.
4.1 Assessing the Level of Audit Fee, Accruals Quality and Corporate Governance (Objective
1)
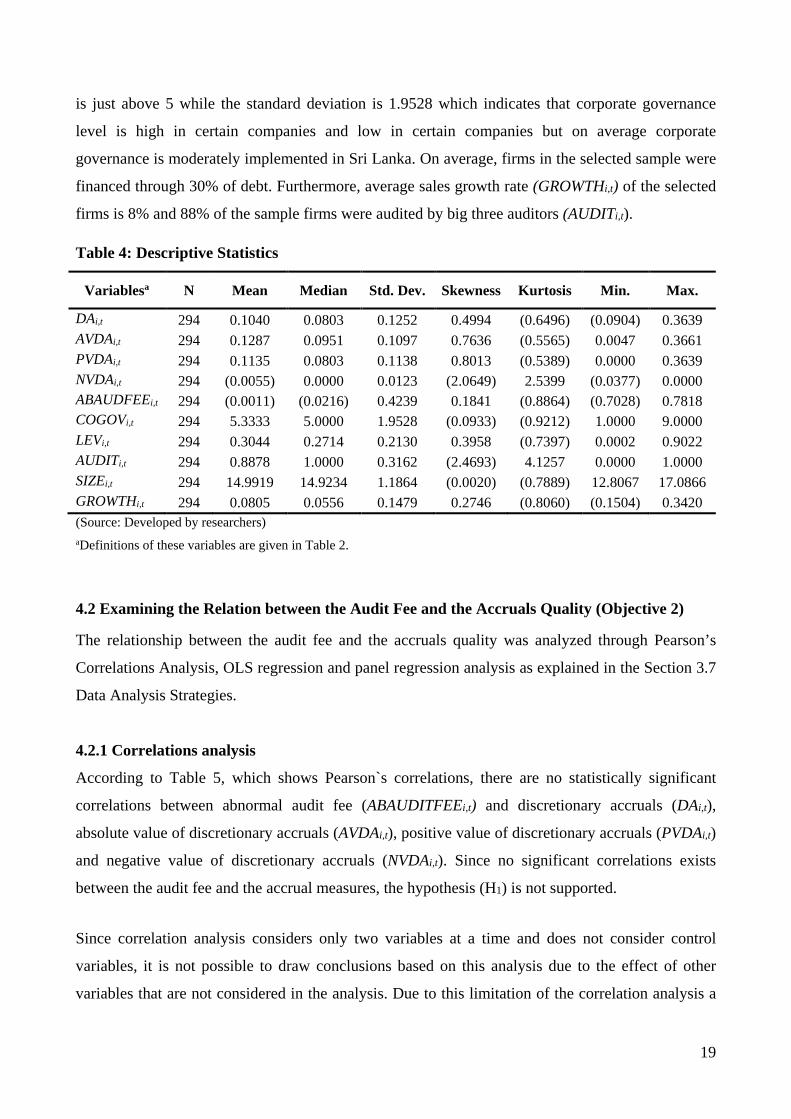
Descriptive statistics were used in order to summarize the collected data and assess the level of
audit fee, accruals quality, and corporate governance in terms of board characteristics of the
companies. Table 4 presents the descriptive statistics for the independent variable (ABAUDFEEi,t),
dependent variables (DAi,t / AVDAi,t / PVDAi,t / NVDAi,t) and moderate variable (COGOVi,t) as well
as for the control variables.
The mean value ABAUDFEEi,t is (0.0011) and the standard deviation is 0.4239 which is
comparatively high. The mean value of discretionary accruals (DAi,t) is 0.1040 and the median is
0.0803 while standard deviation is 0.1252. Moreover, standard deviations of absolute value of
discretionary accruals (AVDAi,t), positive value of discretionary accruals (PVDAi,t) and negative
value of discretionary accruals (NVDAi,t) respectively 0.1097, 0.1138 and 0.0123. Accordingly,
there are no any significant variations. The mean value of Corporate Governance Index (COGOVi,t)
19
is just above 5 while the standard deviation is 1.9528 which indicates that corporate governance
level is high in certain companies and low in certain companies but on average corporate
governance is moderately implemented in Sri Lanka. On average, firms in the selected sample were
financed through 30% of debt. Furthermore, average sales growth rate (GROWTHi,t) of the selected
firms is 8% and 88% of the sample firms were audited by big three auditors (AUDITi,t).
Table 4: Descriptive Statistics
Variablesa N Mean Median Std. Dev. Skewness Kurtosis Min. Max.
DAi,t 294 0.1040 0.0803 0.1252 0.4994 (0.6496) (0.0904) 0.3639 AVDAi,t 294 0.1287 0.0951 0.1097 0.7636 (0.5565) 0.0047 0.3661 PVDAi,t 294 0.1135 0.0803 0.1138 0.8013 (0.5389) 0.0000 0.3639 NVDAi,t 294 (0.0055) 0.0000 0.0123 (2.0649) 2.5399 (0.0377) 0.0000 ABAUDFEEi,t 294 (0.0011) (0.0216) 0.4239 0.1841 (0.8864) (0.7028) 0.7818 COGOVi,t 294 5.3333 5.0000 1.9528 (0.0933) (0.9212) 1.0000 9.0000 LEVi,t 294 0.3044 0.2714 0.2130 0.3958 (0.7397) 0.0002 0.9022 AUDITi,t 294 0.8878 1.0000 0.3162 (2.4693) 4.1257 0.0000 1.0000 SIZEi,t 294 14.9919 14.9234 1.1864 (0.0020) (0.7889) 12.8067 17.0866 GROWTHi,t 294 0.0805 0.0556 0.1479 0.2746 (0.8060) (0.1504) 0.3420 (Source: Developed by researchers) aDefinitions of these variables are given in Table 2.
4.2 Examining the Relation between the Audit Fee and the Accruals Quality (Objective 2)
The relationship between the audit fee and the accruals quality was analyzed through Pearson’s
Correlations Analysis, OLS regression and panel regression analysis as explained in the Section 3.7
Data Analysis Strategies.
4.2.1 Correlations analysis
According to Table 5, which shows Pearson`s correlations, there are no statistically significant
correlations between abnormal audit fee (ABAUDITFEEi,t) and discretionary accruals (DAi,t),
absolute value of discretionary accruals (AVDAi,t), positive value of discretionary accruals (PVDAi,t)
and negative value of discretionary accruals (NVDAi,t). Since no significant correlations exists
between the audit fee and the accrual measures, the hypothesis (H1) is not supported.
Since correlation analysis considers only two variables at a time and does not consider control
variables, it is not possible to draw conclusions based on this analysis due to the effect of other
variables that are not considered in the analysis. Due to this limitation of the correlation analysis a
20
multiple regression was performed. Multiple regression enables using more independent variables
and controlling variables at a time, and therefore is superior to correlation analysis.
Table 5: Correlation Analysis
Variablesa 1 2 3 4 5 1 ABAUDFEEi,t 2 DAi,t -0.0103 3 AVDAi,t 0.0444 .8239** 4 PVDAi,t 0.0016 .9844** .9023** 5 NVDAi,t -0.0379 .5867** .1236* .4461**
(Source: Developed by researchers) aDefinitions of these variables are given in Table 2. *p<0.05; **p<0.01
4.2.2 OLS Regression analysis
An OLS regression was performed for the three year data of the 98 companies in the sample by
using the each of the accruals quality measure separately and the results are depicted in Table 6.
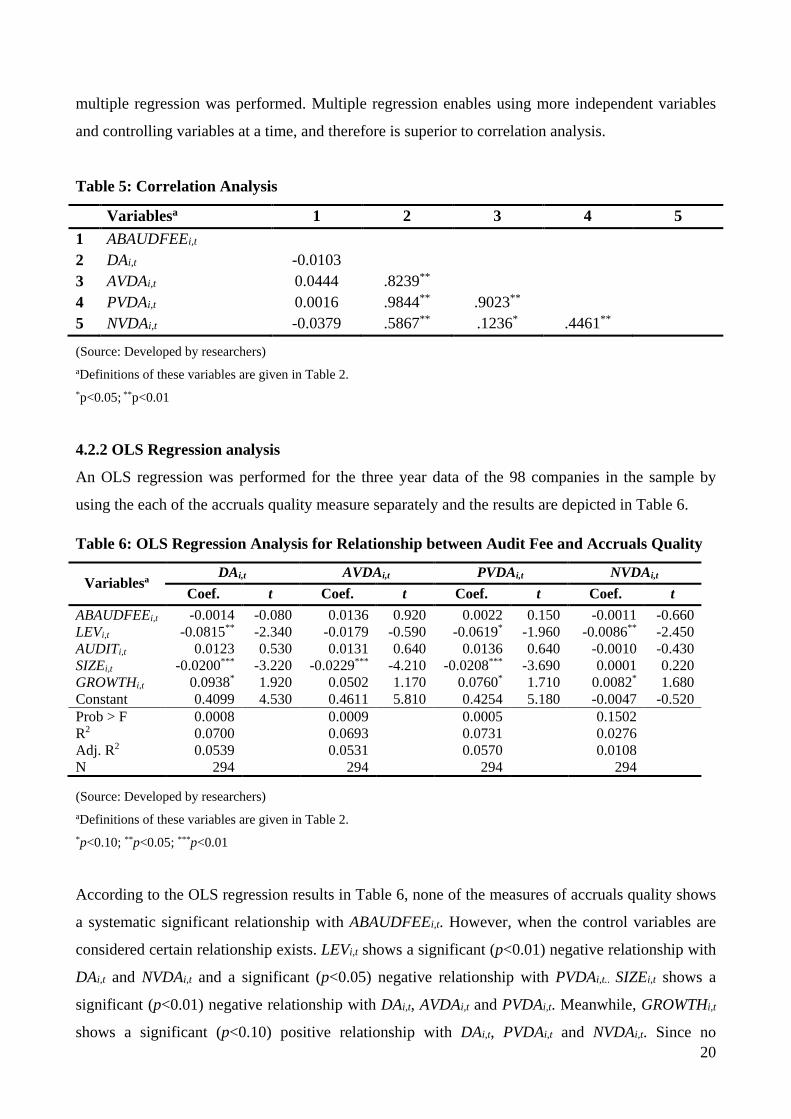
Table 6: OLS Regression Analysis for Relationship between Audit Fee and Accruals Quality
Variablesa DAi,t AVDAi,t PVDAi,t NVDAi,t
Coef. t Coef. t Coef. t Coef. t ABAUDFEEi,t -0.0014 -0.080 0.0136 0.920 0.0022 0.150 -0.0011 -0.660 LEVi,t -0.0815** -2.340 -0.0179 -0.590 -0.0619* -1.960 -0.0086** -2.450 AUDITi,t 0.0123 0.530 0.0131 0.640 0.0136 0.640 -0.0010 -0.430 SIZEi,t -0.0200*** -3.220 -0.0229*** -4.210 -0.0208*** -3.690 0.0001 0.220 GROWTHi,t 0.0938* 1.920 0.0502 1.170 0.0760* 1.710 0.0082* 1.680 Constant 0.4099 4.530 0.4611 5.810 0.4254 5.180 -0.0047 -0.520 Prob > F 0.0008 0.0009 0.0005 0.1502 R2 0.0700 0.0693 0.0731 0.0276 Adj. R2 0.0539 0.0531 0.0570 0.0108 N 294 294 294 294
(Source: Developed by researchers) aDefinitions of these variables are given in Table 2. *p<0.10; **p<0.05; ***p<0.01
According to the OLS regression results in Table 6, none of the measures of accruals quality shows
a systematic significant relationship with ABAUDFEEi,t. However, when the control variables are
considered certain relationship exists. LEVi,t shows a significant (p<0.01) negative relationship with
DAi,t and NVDAi,t and a significant (p<0.05) negative relationship with PVDAi,t.. SIZEi,t shows a
significant (p<0.01) negative relationship with DAi,t, AVDAi,t and PVDAi,t. Meanwhile, GROWTHi,t
shows a significant (p<0.10) positive relationship with DAi,t, PVDAi,t and NVDAi,t. Since no
21
systematic significant relationship exists between the audit fee and the accrual measures at all three
significance levels, the hypothesis (H1) is not supported.
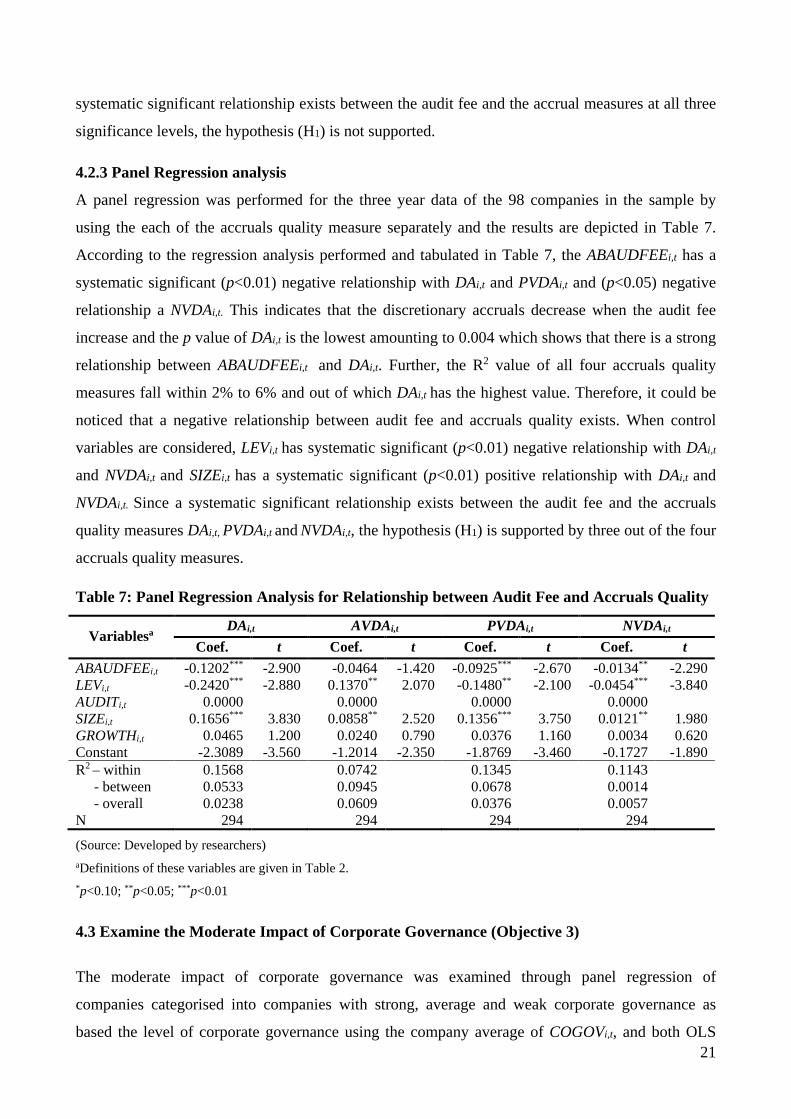
4.2.3 Panel Regression analysis
A panel regression was performed for the three year data of the 98 companies in the sample by
using the each of the accruals quality measure separately and the results are depicted in Table 7.
According to the regression analysis performed and tabulated in Table 7, the ABAUDFEEi,t has a
systematic significant (p<0.01) negative relationship with DAi,t and PVDAi,t and (p<0.05) negative
relationship a NVDAi,t. This indicates that the discretionary accruals decrease when the audit fee
increase and the p value of DAi,t is the lowest amounting to 0.004 which shows that there is a strong
relationship between ABAUDFEEi,t and DAi,t. Further, the R2 value of all four accruals quality
measures fall within 2% to 6% and out of which DAi,t has the highest value. Therefore, it could be
noticed that a negative relationship between audit fee and accruals quality exists. When control
variables are considered, LEVi,t has systematic significant (p<0.01) negative relationship with DAi,t
and NVDAi,t and SIZEi,t has a systematic significant (p<0.01) positive relationship with DAi,t and
NVDAi,t. Since a systematic significant relationship exists between the audit fee and the accruals
quality measures DAi,t, PVDAi,t and NVDAi,t, the hypothesis (H1) is supported by three out of the four
accruals quality measures.
Table 7: Panel Regression Analysis for Relationship between Audit Fee and Accruals Quality
Variablesa DAi,t AVDAi,t PVDAi,t NVDAi,t
Coef. t Coef. t Coef. t Coef. t ABAUDFEEi,t -0.1202*** -2.900 -0.0464 -1.420 -0.0925*** -2.670 -0.0134** -2.290 LEVi,t -0.2420*** -2.880 0.1370** 2.070 -0.1480** -2.100 -0.0454*** -3.840 AUDITi,t 0.0000 0.0000 0.0000 0.0000 SIZEi,t 0.1656*** 3.830 0.0858** 2.520 0.1356*** 3.750 0.0121** 1.980 GROWTHi,t 0.0465 1.200 0.0240 0.790 0.0376 1.160 0.0034 0.620 Constant -2.3089 -3.560 -1.2014 -2.350 -1.8769 -3.460 -0.1727 -1.890 R2 – within 0.1568 0.0742 0.1345 0.1143 - between 0.0533 0.0945 0.0678 0.0014 - overall 0.0238 0.0609 0.0376 0.0057 N 294 294 294 294
(Source: Developed by researchers) aDefinitions of these variables are given in Table 2. *p<0.10; **p<0.05; ***p<0.01
4.3 Examine the Moderate Impact of Corporate Governance (Objective 3)
The moderate impact of corporate governance was examined through panel regression of
companies categorised into companies with strong, average and weak corporate governance as
based the level of corporate governance using the company average of COGOVi,t, and both OLS
22
and panel regression with the interaction variable as explained in the Section 3.7 Data Analysis
Strategies.
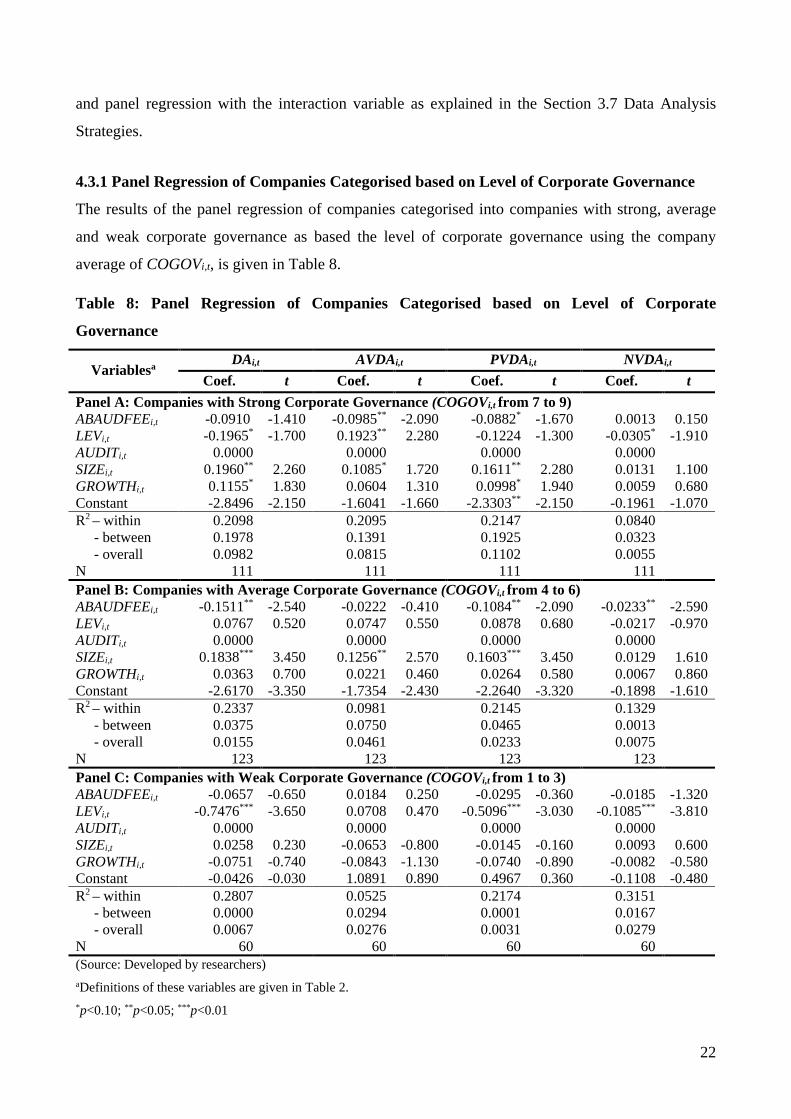
4.3.1 Panel Regression of Companies Categorised based on Level of Corporate Governance
The results of the panel regression of companies categorised into companies with strong, average
and weak corporate governance as based the level of corporate governance using the company
average of COGOVi,t, is given in Table 8.
Table 8: Panel Regression of Companies Categorised based on Level of Corporate
Governance
Variablesa DAi,t AVDAi,t PVDAi,t NVDAi,t
Coef. t Coef. t Coef. t Coef. t Panel A: Companies with Strong Corporate Governance (COGOVi,t from 7 to 9) ABAUDFEEi,t -0.0910 -1.410 -0.0985** -2.090 -0.0882* -1.670 0.0013 0.150 LEVi,t -0.1965* -1.700 0.1923** 2.280 -0.1224 -1.300 -0.0305* -1.910 AUDITi,t 0.0000 0.0000 0.0000 0.0000 SIZEi,t 0.1960** 2.260 0.1085* 1.720 0.1611** 2.280 0.0131 1.100 GROWTHi,t 0.1155* 1.830 0.0604 1.310 0.0998* 1.940 0.0059 0.680 Constant -2.8496 -2.150 -1.6041 -1.660 -2.3303** -2.150 -0.1961 -1.070 R2 – within 0.2098 0.2095 0.2147 0.0840 - between 0.1978 0.1391 0.1925 0.0323 - overall 0.0982 0.0815 0.1102 0.0055 N 111 111 111 111 Panel B: Companies with Average Corporate Governance (COGOVi,t from 4 to 6) ABAUDFEEi,t -0.1511** -2.540 -0.0222 -0.410 -0.1084** -2.090 -0.0233** -2.590 LEVi,t 0.0767 0.520 0.0747 0.550 0.0878 0.680 -0.0217 -0.970 AUDITi,t 0.0000 0.0000 0.0000 0.0000 SIZEi,t 0.1838*** 3.450 0.1256** 2.570 0.1603*** 3.450 0.0129 1.610 GROWTHi,t 0.0363 0.700 0.0221 0.460 0.0264 0.580 0.0067 0.860 Constant -2.6170 -3.350 -1.7354 -2.430 -2.2640 -3.320 -0.1898 -1.610 R2 – within 0.2337 0.0981 0.2145 0.1329 - between 0.0375 0.0750 0.0465 0.0013 - overall 0.0155 0.0461 0.0233 0.0075 N 123 123 123 123 Panel C: Companies with Weak Corporate Governance (COGOVi,t from 1 to 3) ABAUDFEEi,t -0.0657 -0.650 0.0184 0.250 -0.0295 -0.360 -0.0185 -1.320 LEVi,t -0.7476*** -3.650 0.0708 0.470 -0.5096*** -3.030 -0.1085*** -3.810 AUDITi,t 0.0000 0.0000 0.0000 0.0000 SIZEi,t 0.0258 0.230 -0.0653 -0.800 -0.0145 -0.160 0.0093 0.600 GROWTHi,t -0.0751 -0.740 -0.0843 -1.130 -0.0740 -0.890 -0.0082 -0.580 Constant -0.0426 -0.030 1.0891 0.890 0.4967 0.360 -0.1108 -0.480 R2 – within 0.2807 0.0525 0.2174 0.3151 - between 0.0000 0.0294 0.0001 0.0167 - overall 0.0067 0.0276 0.0031 0.0279 N 60 60 60 60 (Source: Developed by researchers) aDefinitions of these variables are given in Table 2. *p<0.10; **p<0.05; ***p<0.01
23
The overall R2 value has decreased as the level of corporate governance decrease except for NVDAi,t
which implies that the level of corporate governance has a moderating impact on the relationship
between ABAUDFEEi,t and the accruals quality measures DAi,t, AVDAi,t and PVDAi,t. Nevertheless, the
value of the overall R2 is very low. Thus, the hypothesis (H2) is weakly supported for the accruals
quality measures DAi,t, AVDAi,t and PVDAi,t.
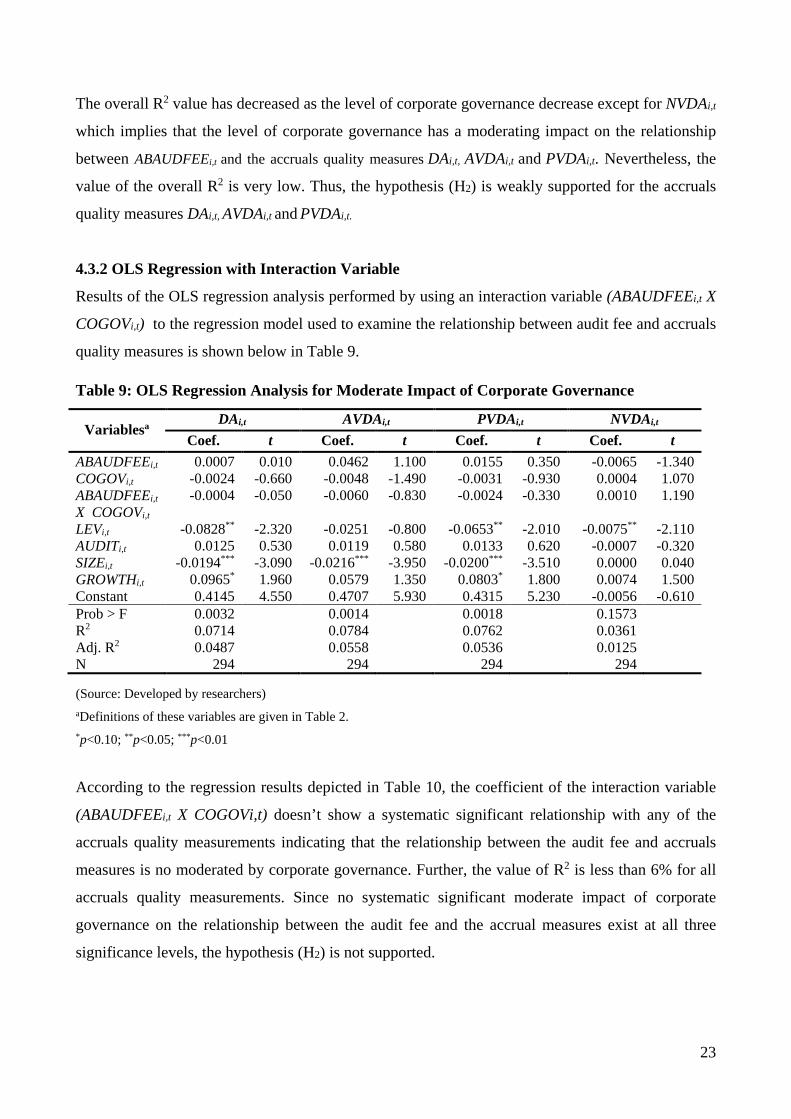
4.3.2 OLS Regression with Interaction Variable
Results of the OLS regression analysis performed by using an interaction variable (ABAUDFEEi,t X
COGOVi,t) to the regression model used to examine the relationship between audit fee and accruals
quality measures is shown below in Table 9.
Table 9: OLS Regression Analysis for Moderate Impact of Corporate Governance
Variablesa DAi,t AVDAi,t PVDAi,t NVDAi,t
Coef. t Coef. t Coef. t Coef. t ABAUDFEEi,t 0.0007 0.010 0.0462 1.100 0.0155 0.350 -0.0065 -1.340 COGOVi,t -0.0024 -0.660 -0.0048 -1.490 -0.0031 -0.930 0.0004 1.070 ABAUDFEEi,t
X COGOVi,t -0.0004 -0.050 -0.0060 -0.830 -0.0024 -0.330 0.0010 1.190
LEVi,t -0.0828** -2.320 -0.0251 -0.800 -0.0653** -2.010 -0.0075** -2.110 AUDITi,t 0.0125 0.530 0.0119 0.580 0.0133 0.620 -0.0007 -0.320 SIZEi,t -0.0194*** -3.090 -0.0216*** -3.950 -0.0200*** -3.510 0.0000 0.040 GROWTHi,t 0.0965* 1.960 0.0579 1.350 0.0803* 1.800 0.0074 1.500 Constant 0.4145 4.550 0.4707 5.930 0.4315 5.230 -0.0056 -0.610 Prob > F 0.0032 0.0014 0.0018 0.1573 R2 0.0714 0.0784 0.0762 0.0361 Adj. R2 0.0487 0.0558 0.0536 0.0125 N 294 294 294 294
(Source: Developed by researchers) aDefinitions of these variables are given in Table 2. *p<0.10; **p<0.05; ***p<0.01
According to the regression results depicted in Table 10, the coefficient of the interaction variable
(ABAUDFEEi,t X COGOVi,t) doesn’t show a systematic significant relationship with any of the
accruals quality measurements indicating that the relationship between the audit fee and accruals
measures is no moderated by corporate governance. Further, the value of R2 is less than 6% for all
accruals quality measurements. Since no systematic significant moderate impact of corporate
governance on the relationship between the audit fee and the accrual measures exist at all three
significance levels, the hypothesis (H2) is not supported.
24
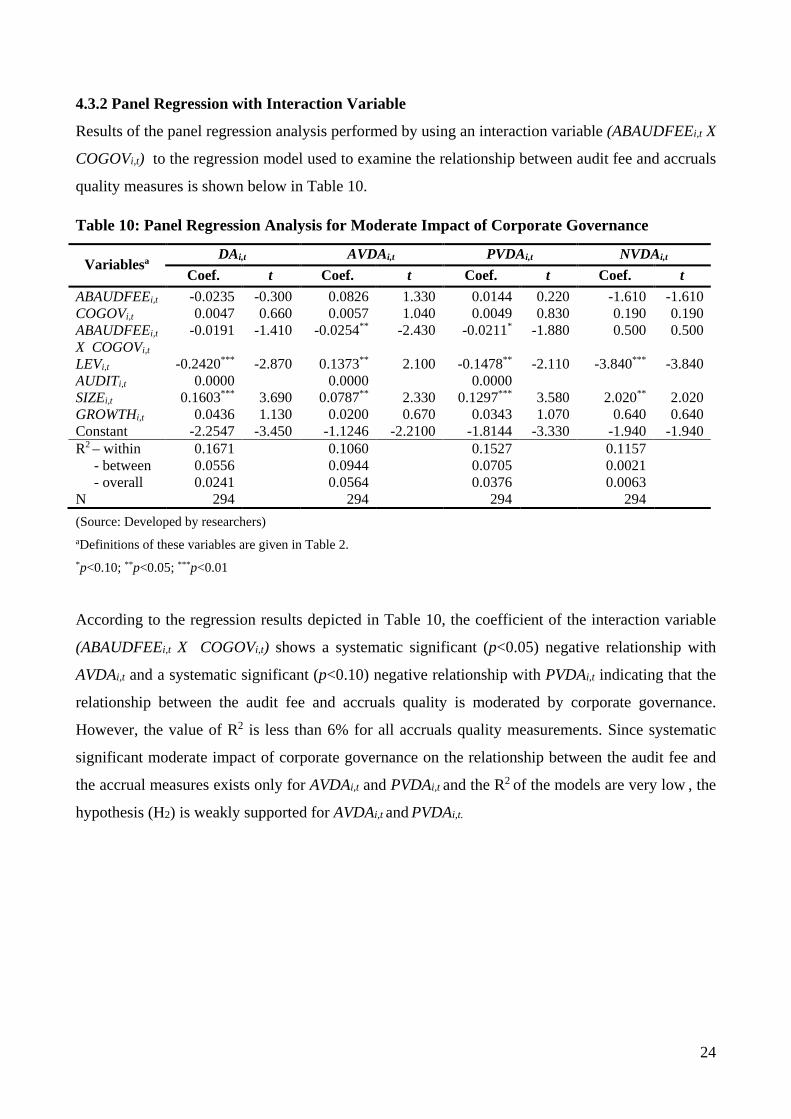
4.3.2 Panel Regression with Interaction Variable
Results of the panel regression analysis performed by using an interaction variable (ABAUDFEEi,t X
COGOVi,t) to the regression model used to examine the relationship between audit fee and accruals
quality measures is shown below in Table 10.
Table 10: Panel Regression Analysis for Moderate Impact of Corporate Governance
Variablesa DAi,t AVDAi,t PVDAi,t NVDAi,t
Coef. t Coef. t Coef. t Coef. t ABAUDFEEi,t -0.0235 -0.300 0.0826 1.330 0.0144 0.220 -1.610 -1.610 COGOVi,t 0.0047 0.660 0.0057 1.040 0.0049 0.830 0.190 0.190 ABAUDFEEi,t
X COGOVi,t -0.0191 -1.410 -0.0254** -2.430 -0.0211* -1.880 0.500 0.500
LEVi,t -0.2420*** -2.870 0.1373** 2.100 -0.1478** -2.110 -3.840*** -3.840 AUDITi,t 0.0000 0.0000 0.0000 SIZEi,t 0.1603*** 3.690 0.0787** 2.330 0.1297*** 3.580 2.020** 2.020 GROWTHi,t 0.0436 1.130 0.0200 0.670 0.0343 1.070 0.640 0.640 Constant -2.2547 -3.450 -1.1246 -2.2100 -1.8144 -3.330 -1.940 -1.940 R2 – within 0.1671 0.1060 0.1527 0.1157 - between 0.0556 0.0944 0.0705 0.0021 - overall 0.0241 0.0564 0.0376 0.0063 N 294 294 294 294
(Source: Developed by researchers) aDefinitions of these variables are given in Table 2. *p<0.10; **p<0.05; ***p<0.01
According to the regression results depicted in Table 10, the coefficient of the interaction variable
(ABAUDFEEi,t X COGOVi,t) shows a systematic significant (p<0.05) negative relationship with
AVDAi,t and a systematic significant (p<0.10) negative relationship with PVDAi,t indicating that the
relationship between the audit fee and accruals quality is moderated by corporate governance.
However, the value of R2 is less than 6% for all accruals quality measurements. Since systematic
significant moderate impact of corporate governance on the relationship between the audit fee and
the accrual measures exists only for AVDAi,t and PVDAi,t and the R2 of the models are very low , the
hypothesis (H2) is weakly supported for AVDAi,t and PVDAi,t.
25
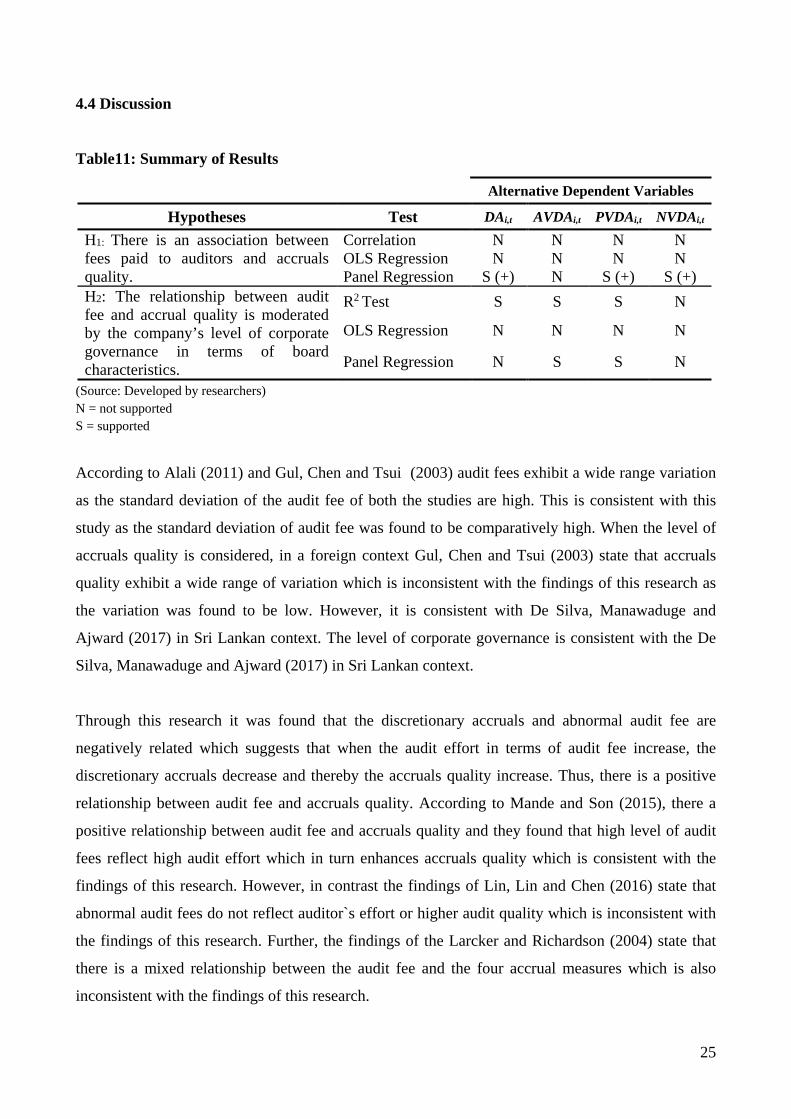
4.4 Discussion
Table11: Summary of Results
Alternative Dependent Variables
Hypotheses Test DAi,t AVDAi,t PVDAi,t NVDAi,t H1: There is an association between fees paid to auditors and accruals quality.
Correlation N N N N OLS Regression N N N N Panel Regression S (+) N S (+) S (+)
H2: The relationship between audit fee and accrual quality is moderated by the company’s level of corporate governance in terms of board characteristics.
R2 Test S S S N
OLS Regression N N N N
Panel Regression N S S N
(Source: Developed by researchers) N = not supported S = supported
According to Alali (2011) and Gul, Chen and Tsui (2003) audit fees exhibit a wide range variation
as the standard deviation of the audit fee of both the studies are high. This is consistent with this
study as the standard deviation of audit fee was found to be comparatively high. When the level of
accruals quality is considered, in a foreign context Gul, Chen and Tsui (2003) state that accruals
quality exhibit a wide range of variation which is inconsistent with the findings of this research as
the variation was found to be low. However, it is consistent with De Silva, Manawaduge and
Ajward (2017) in Sri Lankan context. The level of corporate governance is consistent with the De
Silva, Manawaduge and Ajward (2017) in Sri Lankan context.
Through this research it was found that the discretionary accruals and abnormal audit fee are
negatively related which suggests that when the audit effort in terms of audit fee increase, the
discretionary accruals decrease and thereby the accruals quality increase. Thus, there is a positive
relationship between audit fee and accruals quality. According to Mande and Son (2015), there a
positive relationship between audit fee and accruals quality and they found that high level of audit
fees reflect high audit effort which in turn enhances accruals quality which is consistent with the
findings of this research. However, in contrast the findings of Lin, Lin and Chen (2016) state that
abnormal audit fees do not reflect auditor`s effort or higher audit quality which is inconsistent with
the findings of this research. Further, the findings of the Larcker and Richardson (2004) state that
there is a mixed relationship between the audit fee and the four accrual measures which is also
inconsistent with the findings of this research.
26
The findings of this research indicate that a moderate impact of corporate governance on the
relationship between audit fee and accruals quality exists in R2 test of companies categorized as
strong, average and weak based on the level of corporate governance and panel regression with
interaction variable for certain measures of accruals quality. The results of R2 is consistent with
Larcker and Richardson (2004) as they found that the negative relationship between audit fee and
accruals quality is strongest for the cluster of firms with weak corporate governance. However, only
three characteristics of corporate governance were used in Larcker and Richardson (2004) whereas
ten corporate governance characteristics were used in this research. In contrast, the study conducted
by De Silva, Manawaduge and Ajward (2017) to observe relationship between earnings
management and corporate governance mechanisms of selected companies in Sri Lankan context,
state that only when the board of directors of the company which comprises with more directors
with qualifications in accounting and finance, earnings management is less likely to occur.
The hypotheses for this study were developed based on the literature review. However, it is evident
from the analysis that the H1 is supported by the panel regression for three out of four accruals
quality measures as a positive relationship between audit fee and accruals quality was found.
Further, the H2 is supported by R2 test for three accruals quality measures and for two accruals
quality measures by the panel regression as a moderate impact of corporate governance on the
relationship between audit fee and accruals quality was identified.
5 CONCLUSION, LIMITATIONS AND FUTURE DIRECTIONS
Many corporate scandals have taken place in recent years due to earnings management. The studies
indicate that the auditor’s effort is vital in reducing the earnings management and that proper
implementation of corporate governance practices too would trim the chances for earnings
management. Therefore, this study examined whether there is a relationship between auditor’s
effort in terms of audit fee and the level of accruals quality and how the corporate governance
mechanism of the companies moderate this relationship. The sample consisted 98 companies listed
in Colombo Stock Exchange (CSE) for the period covering 2015 to 2017 representing the sectors
with the highest market capitalization such as Beverage Food and Tobacco, Diversified Holdings,
Hotels and Travels and Manufacturing which had accounted for 38% of the total market
capitalization of CSE.
27
This study assessed the level of audit fee, accruals quality and corporate governance and examined
the relationship between the audit fee and accruals quality by using correlation analysis, OLS
regression and panel regression. Further, the study examined the moderate impact of corporate
governance on the relationship between audit fee and accruals quality by using an R2 test, OLS
regression and panel regression. The level of audit fee and corporate governance index showed a
comparatively high variation while accruals quality measures showed less variation. The correlation
analysis and OLS regression indicated that there is no significance relationship between the audit
fee and accruals quality but the panel regression indicated that there is a negative relationship
between audit fee and discretionary accruals and thereby that there is a positive relationship
between audit fee and accruals quality for three measures of accruals quality. Further, the R2 test
and panel regression indicated that there is a significant moderate impact of corporate governance
on the relationship between the audit fee and accruals quality for certain measures of accruals
quality.
Therefore, it could be concluded that higher audit effort increases accruals quality and that
corporate governance has a moderate impact on this relationship. The above findings are expected
to have significant policy implications. The policy makers and regulators should take measures to
increase the audit effort required for an audit of a company and should implement mechanisms to
improve the level of corporate governance of the companies so that adverse earnings management
practices could be curtailed
There are certain limitations in this study, and it is important to state these problems clearly as
future researcher will carry out their researches based on prior researches as well as this study
results will be used by several parties to take decisions. First, the results are based on Public Listed
Companies in Sri Lanka for three year’s data, and this limits the ability to generalize the results to
other financial periods, other type of businesses as well as other countries. With the exception of the
research by Kinney, Palmrose, and Scholz (2003) that uses proprietary data, and data from other
countries (e.g., U.K. data used in Antle et al. [2002] and Australian data used in Ruddock, Taylor &
Taylor [2003]), this is also a limitation in prior researches. Therefore, this study result can’t be used
in other counties to take the decision directly due to the differences in regulation and standards.
Future researches could incorporate data from more financial periods and include other types of
business and other countries as well. Second, despite Modified Jones Model being the most
common method used to calculate accruals quality, there are many alternative models available,
which future researchers could apply to measure accruals quality. Therefore, there could be a slight
28
variation in the results if other models were used. Finally, in this study Company’s Annual Reports
were used to analyse the corporate governance practices of the companies. Thus, here may be some
drawbacks due to working with secondary data such as lack of control over data quality and
inappropriateness of the data. Further, there could be other board characteristics which could be
used to measure corporate governance and future researches can include other corporate governance
characteristics.
REFERENCES
Alali, F 2011, ‘Audit fees and discretionary accruals: compensation structure effect’, Managerial Auditing Journal, vol. 26, no. 2, pp. 90 - 113. Baxter, P & Cotter, J 2009, ‘Audit committees and earnings quality’, Accounting and Finance Journal, vol. 49, no. 2, pp. 267 - 290. Cho, M, Soo, E.K & Kwon, Y 2015, ‘The effects of accruals quality on audit hours and audit fees’, Journal of Accounting Auditing and Finance, vol. 32, no. 3, pp. 372-400. De Silva, A.B.S, Manawaduge, A & Ajward, A.R 2017, ‘The relationship between selected corporate governance mechanisms and degree of earnings management in selected Sri Lankan listed companies’, CA Journal of Applied Research, vol. 1, no. 2613- 8255, pp. 38 – 56. Dechow, M & Dichev, L.D 2002, ‘The quality of accruals and earnings: the role of accrual estimation errors’, The Accounting Review, vol. 77, no. 2, pp. 35 - 59. Dechun, W.B. P. L 2016, ‘The earnings quality information content of dividend policies and audit pricing’, Contemporary Accounting Research, vol. 33, no. 4, pp. 1685-1719. Ferguson, M.J 2007, ‘Accruals quality and internal control’, The Accounting Review, vol. 82, no. 5, pp. 1141-1170. Ferguson, M.J, Seow, G.S & Young, D 2004, ‘Non audit services and earnings management: UK evidence’, Contemporary Accounting Research, vol. 21, no. 4, pp. 813 - 841. Greiner, A, Kohlbeck, M.J & Smith, T.J 2017, ‘The relationship between aggressive real earnings management and current and future audit fees’, Auditing: A Journal of Practice & Theory, vol. 36, no. 2, pp. 85–107. Gul, F.A, Chen, C.J.P & Tsui, J.S.L 2003, ‘Discretionary accounting accruals, managers’ incentives and audit fees’. Contemporary Accounting Research, vol. 20, no. 3, pp. 118-142. Institute of Chartered Accountants in England & Wales 2005, Agency theory and the role of audit, viewed 3 June 2018 https://www.icaew.com/-/media/corporate/files/technical/audit-and-assurance/audit-quality/audit-quality-forum/agency-theory-and-the-role-of-audit.ashx
29
Klein, A 2002, ‘Audit committee, board of director characteristics, and earnings management’, Journal of Accounting and Economics, vol. 33, no. 3, pp. 375 - 400. Lambert, T.A, Jones, K.L, Brazel, J.F & Showalter, D.S 2017, ‘Audit time pressure and earnings quality: An examination of accelerated filings’, Accounting, Organizations and Society, vol. 58, no. 2, pp. 50-66. Larcker, D.F & Richardson, S.A 2004, ‘Fees paid to audit firms, accrual choices, and corporate governance’, Journal of Accounting Research, vol. 42, no. 3, pp. 625 - 658. Lin, F.C, Lin, Y.C & Chieh, C.S 2016, ‘Accrual reversals and audit fees’, Asia-Pacific Journal of Accounting and Economics, vol. 25, no. 2, pp. 276-294. Lu, H 2011, ‘Direct and indirect effects of internal control weaknesses on accrual quality: evidence from a unique Canadian regulatory setting’, Contemporary Accounting Research, vol. 28, no. 2, pp. 675–707. Mande, V & Son, M 2015, ‘How do auditor fees affect accruals quality? Additional evidence’, International Journal of Auditing, vol. 19, no. 3, pp. 238–251. Schelleman, C & Knechel, W.R 2010, ‘Short-term accruals and the pricing and production of audit services’, Auditing: A Journal of Practice & Theory, vol. 29, no. 1, pp. 221-250.
30
APPENDICES
Appendix 1: Sample Selection (Industry wise)
Sector
Companies listed in CSE Companies with March Y/E Excluding BF&I Sector
No. Market Cap. Perc. on Market Cap.
No. Market Cap. Perc. on Market Cap.
1. Banks finance and insurance 68 613,272,432,461 23.03% - - -
2. Beverage food and tobacco 21 552,941,457,304 20.76% 18 274,531,769,212 21.00%
3. Diversified holdings 19 505,536,322,041 18.98% 19 505,536,322,041 38.67% 4. Hotels and travels 37 307,688,777,120 11.55% 34 105,760,090,239 8.09% 5. Manufacturing 38 164,302,408,278 6.17% 32 119,607,502,608 9.15% 6. Telecommunications 2 152,126,533,977 5.71% - - - 7. Health care 6 57,489,174,208 2.16% 5 43,729,645,815 3.34% 8. Oil palms 5 56,991,440,409 2.14% 5 56,991,440,409 4.36% 9. Land and property 18 49,166,521,024 1.85% 13 10,796,154,530 0.83% 10. Power and energy 8 37,417,724,594 1.41% 8 37,417,724,594 2.86% 11. Construction and
engineering 4 35,284,943,104 1.33% 3 29,823,664,880 2.28%
12. Trading 8 26,131,961,260 0.98% 8 26,131,961,260 2.00% 13. Plantations 19 23,674,733,388 0.89% 13 17,796,710,423 1.36% 14. Investment trusts 9 20,536,023,497 0.77% 9 20,536,023,497 1.57% 15. Motors 6 20,474,067,770 0.77% 6 20,474,067,770 1.57% 16. Chemicals and
pharmaceuticals 10 15,925,694,946 0.60% 9 15,100,544,946 1.15%
17. Footwear and textiles 3 11,477,151,578 0.43% 3 11,477,151,578 0.88%
18. Stores and supplies 4 6,935,837,604 0.26% 4 6,935,837,604 0.53% 19. Services 8 4,756,635,604 0.18% 8 4,756,635,604 0.36% 20. Information
technology 2 730,489,066 0.03% 1 34,340,000 0.00%
295 2,662,860,329,230 100.00% 198 1,307,437,587,009 100.00%
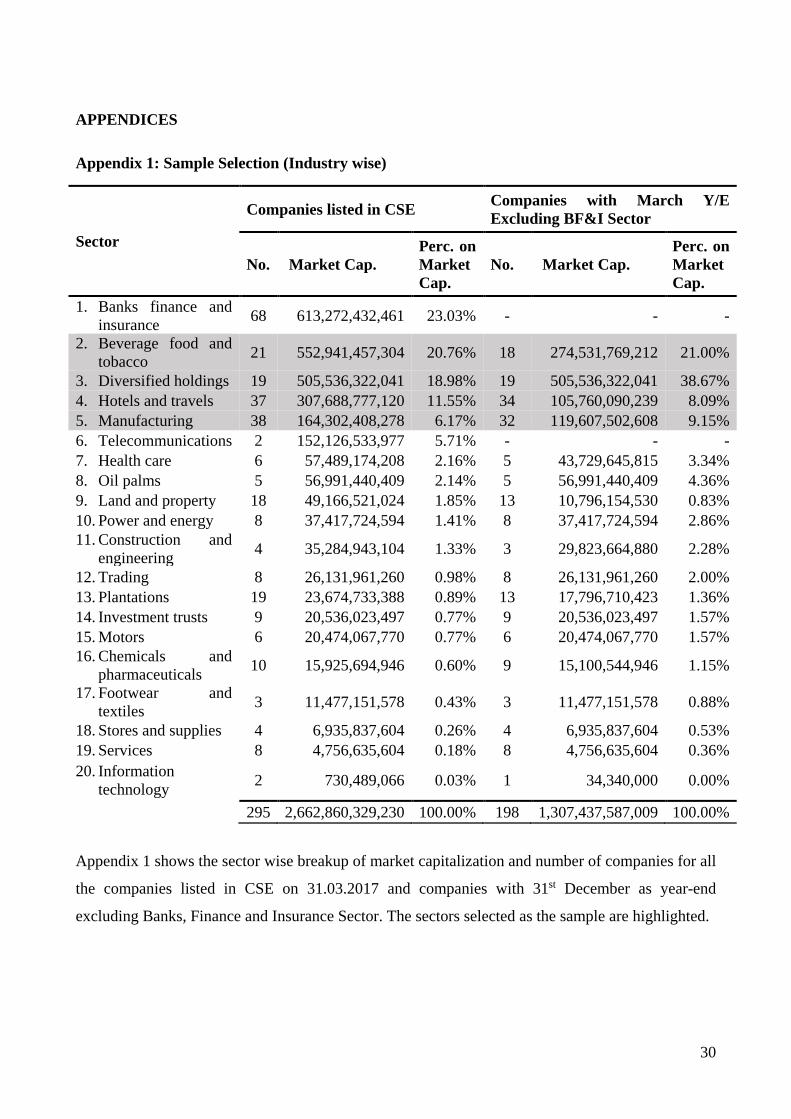
Appendix 1 shows the sector wise breakup of market capitalization and number of companies for all
the companies listed in CSE on 31.03.2017 and companies with 31st December as year-end
excluding Banks, Finance and Insurance Sector. The sectors selected as the sample are highlighted.
31
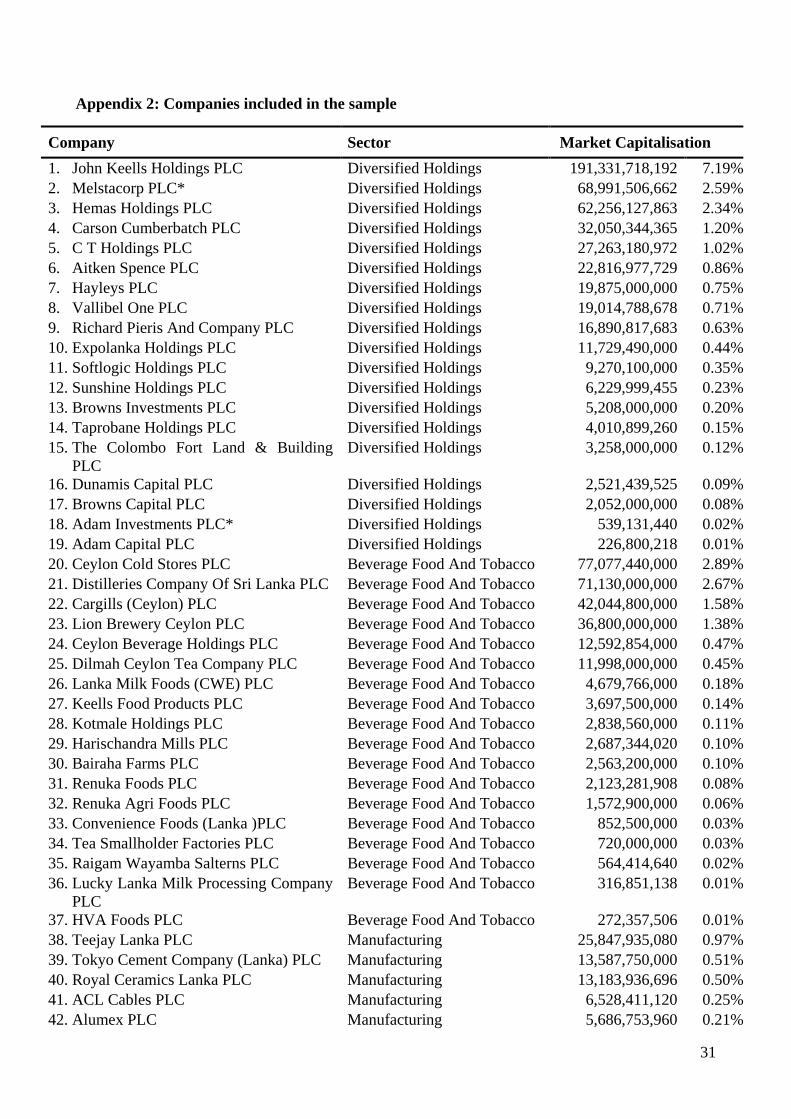
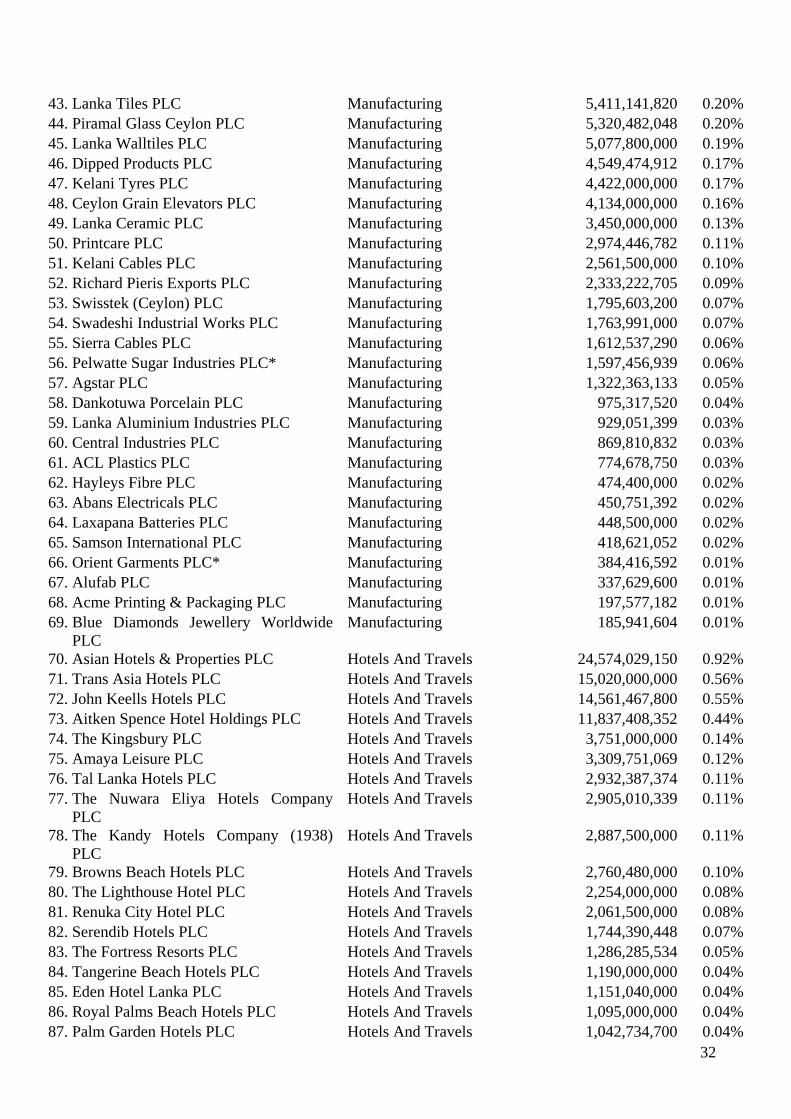
Appendix 2: Companies included in the sample
Company Sector Market Capitalisation 1. John Keells Holdings PLC Diversified Holdings 191,331,718,192 7.19% 2. Melstacorp PLC* Diversified Holdings 68,991,506,662 2.59% 3. Hemas Holdings PLC Diversified Holdings 62,256,127,863 2.34% 4. Carson Cumberbatch PLC Diversified Holdings 32,050,344,365 1.20% 5. C T Holdings PLC Diversified Holdings 27,263,180,972 1.02% 6. Aitken Spence PLC Diversified Holdings 22,816,977,729 0.86% 7. Hayleys PLC Diversified Holdings 19,875,000,000 0.75% 8. Vallibel One PLC Diversified Holdings 19,014,788,678 0.71% 9. Richard Pieris And Company PLC Diversified Holdings 16,890,817,683 0.63% 10. Expolanka Holdings PLC Diversified Holdings 11,729,490,000 0.44% 11. Softlogic Holdings PLC Diversified Holdings 9,270,100,000 0.35% 12. Sunshine Holdings PLC Diversified Holdings 6,229,999,455 0.23% 13. Browns Investments PLC Diversified Holdings 5,208,000,000 0.20% 14. Taprobane Holdings PLC Diversified Holdings 4,010,899,260 0.15% 15. The Colombo Fort Land & Building
PLC Diversified Holdings 3,258,000,000 0.12%
16. Dunamis Capital PLC Diversified Holdings 2,521,439,525 0.09% 17. Browns Capital PLC Diversified Holdings 2,052,000,000 0.08% 18. Adam Investments PLC* Diversified Holdings 539,131,440 0.02% 19. Adam Capital PLC Diversified Holdings 226,800,218 0.01% 20. Ceylon Cold Stores PLC Beverage Food And Tobacco 77,077,440,000 2.89% 21. Distilleries Company Of Sri Lanka PLC Beverage Food And Tobacco 71,130,000,000 2.67% 22. Cargills (Ceylon) PLC Beverage Food And Tobacco 42,044,800,000 1.58% 23. Lion Brewery Ceylon PLC Beverage Food And Tobacco 36,800,000,000 1.38% 24. Ceylon Beverage Holdings PLC Beverage Food And Tobacco 12,592,854,000 0.47% 25. Dilmah Ceylon Tea Company PLC Beverage Food And Tobacco 11,998,000,000 0.45% 26. Lanka Milk Foods (CWE) PLC Beverage Food And Tobacco 4,679,766,000 0.18% 27. Keells Food Products PLC Beverage Food And Tobacco 3,697,500,000 0.14% 28. Kotmale Holdings PLC Beverage Food And Tobacco 2,838,560,000 0.11% 29. Harischandra Mills PLC Beverage Food And Tobacco 2,687,344,020 0.10% 30. Bairaha Farms PLC Beverage Food And Tobacco 2,563,200,000 0.10% 31. Renuka Foods PLC Beverage Food And Tobacco 2,123,281,908 0.08% 32. Renuka Agri Foods PLC Beverage Food And Tobacco 1,572,900,000 0.06% 33. Convenience Foods (Lanka )PLC Beverage Food And Tobacco 852,500,000 0.03% 34. Tea Smallholder Factories PLC Beverage Food And Tobacco 720,000,000 0.03% 35. Raigam Wayamba Salterns PLC Beverage Food And Tobacco 564,414,640 0.02% 36. Lucky Lanka Milk Processing Company
PLC Beverage Food And Tobacco 316,851,138 0.01%
37. HVA Foods PLC Beverage Food And Tobacco 272,357,506 0.01% 38. Teejay Lanka PLC Manufacturing 25,847,935,080 0.97% 39. Tokyo Cement Company (Lanka) PLC Manufacturing 13,587,750,000 0.51% 40. Royal Ceramics Lanka PLC Manufacturing 13,183,936,696 0.50% 41. ACL Cables PLC Manufacturing 6,528,411,120 0.25% 42. Alumex PLC Manufacturing 5,686,753,960 0.21%
32
43. Lanka Tiles PLC Manufacturing 5,411,141,820 0.20% 44. Piramal Glass Ceylon PLC Manufacturing 5,320,482,048 0.20% 45. Lanka Walltiles PLC Manufacturing 5,077,800,000 0.19% 46. Dipped Products PLC Manufacturing 4,549,474,912 0.17% 47. Kelani Tyres PLC Manufacturing 4,422,000,000 0.17% 48. Ceylon Grain Elevators PLC Manufacturing 4,134,000,000 0.16% 49. Lanka Ceramic PLC Manufacturing 3,450,000,000 0.13% 50. Printcare PLC Manufacturing 2,974,446,782 0.11% 51. Kelani Cables PLC Manufacturing 2,561,500,000 0.10% 52. Richard Pieris Exports PLC Manufacturing 2,333,222,705 0.09% 53. Swisstek (Ceylon) PLC Manufacturing 1,795,603,200 0.07% 54. Swadeshi Industrial Works PLC Manufacturing 1,763,991,000 0.07% 55. Sierra Cables PLC Manufacturing 1,612,537,290 0.06% 56. Pelwatte Sugar Industries PLC* Manufacturing 1,597,456,939 0.06% 57. Agstar PLC Manufacturing 1,322,363,133 0.05% 58. Dankotuwa Porcelain PLC Manufacturing 975,317,520 0.04% 59. Lanka Aluminium Industries PLC Manufacturing 929,051,399 0.03% 60. Central Industries PLC Manufacturing 869,810,832 0.03% 61. ACL Plastics PLC Manufacturing 774,678,750 0.03% 62. Hayleys Fibre PLC Manufacturing 474,400,000 0.02% 63. Abans Electricals PLC Manufacturing 450,751,392 0.02% 64. Laxapana Batteries PLC Manufacturing 448,500,000 0.02% 65. Samson International PLC Manufacturing 418,621,052 0.02% 66. Orient Garments PLC* Manufacturing 384,416,592 0.01% 67. Alufab PLC Manufacturing 337,629,600 0.01% 68. Acme Printing & Packaging PLC Manufacturing 197,577,182 0.01% 69. Blue Diamonds Jewellery Worldwide
PLC Manufacturing 185,941,604 0.01%
70. Asian Hotels & Properties PLC Hotels And Travels 24,574,029,150 0.92% 71. Trans Asia Hotels PLC Hotels And Travels 15,020,000,000 0.56% 72. John Keells Hotels PLC Hotels And Travels 14,561,467,800 0.55% 73. Aitken Spence Hotel Holdings PLC Hotels And Travels 11,837,408,352 0.44% 74. The Kingsbury PLC Hotels And Travels 3,751,000,000 0.14% 75. Amaya Leisure PLC Hotels And Travels 3,309,751,069 0.12% 76. Tal Lanka Hotels PLC Hotels And Travels 2,932,387,374 0.11% 77. The Nuwara Eliya Hotels Company
PLC Hotels And Travels 2,905,010,339 0.11%
78. The Kandy Hotels Company (1938) PLC
Hotels And Travels 2,887,500,000 0.11%
79. Browns Beach Hotels PLC Hotels And Travels 2,760,480,000 0.10% 80. The Lighthouse Hotel PLC Hotels And Travels 2,254,000,000 0.08% 81. Renuka City Hotel PLC Hotels And Travels 2,061,500,000 0.08% 82. Serendib Hotels PLC Hotels And Travels 1,744,390,448 0.07% 83. The Fortress Resorts PLC Hotels And Travels 1,286,285,534 0.05% 84. Tangerine Beach Hotels PLC Hotels And Travels 1,190,000,000 0.04% 85. Eden Hotel Lanka PLC Hotels And Travels 1,151,040,000 0.04% 86. Royal Palms Beach Hotels PLC Hotels And Travels 1,095,000,000 0.04% 87. Palm Garden Hotels PLC Hotels And Travels 1,042,734,700 0.04%
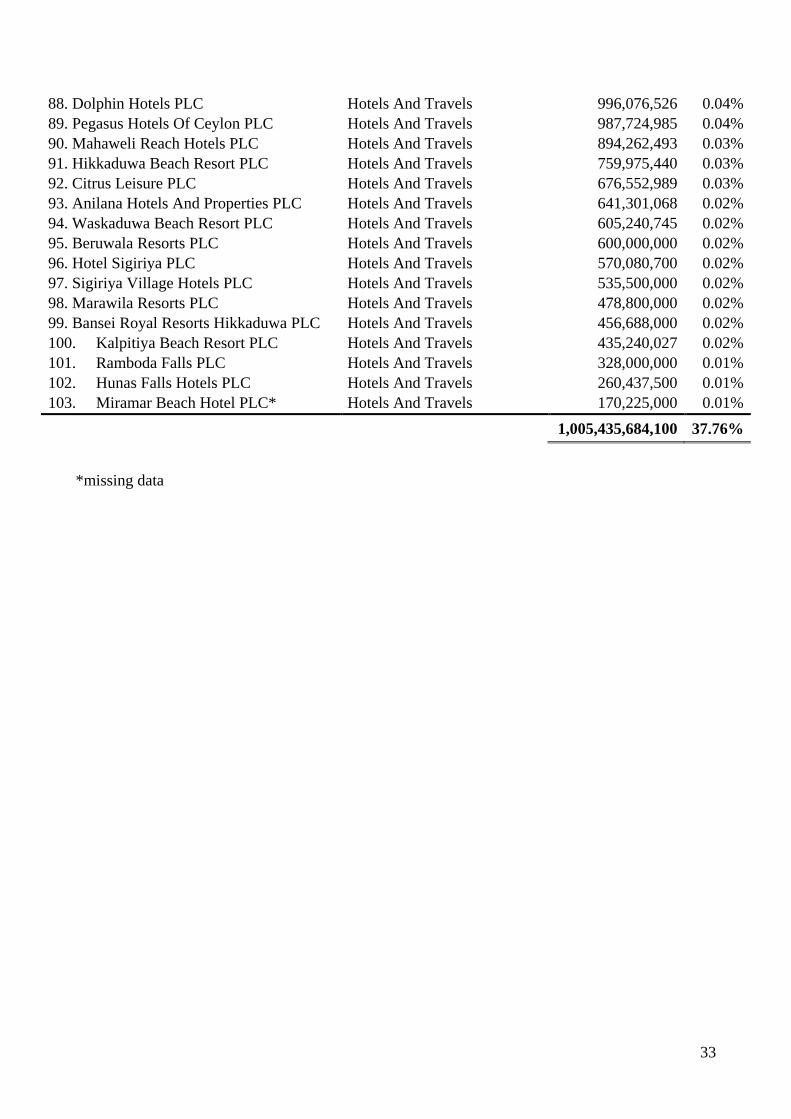
33
88. Dolphin Hotels PLC Hotels And Travels 996,076,526 0.04% 89. Pegasus Hotels Of Ceylon PLC Hotels And Travels 987,724,985 0.04% 90. Mahaweli Reach Hotels PLC Hotels And Travels 894,262,493 0.03% 91. Hikkaduwa Beach Resort PLC Hotels And Travels 759,975,440 0.03% 92. Citrus Leisure PLC Hotels And Travels 676,552,989 0.03% 93. Anilana Hotels And Properties PLC Hotels And Travels 641,301,068 0.02% 94. Waskaduwa Beach Resort PLC Hotels And Travels 605,240,745 0.02% 95. Beruwala Resorts PLC Hotels And Travels 600,000,000 0.02% 96. Hotel Sigiriya PLC Hotels And Travels 570,080,700 0.02% 97. Sigiriya Village Hotels PLC Hotels And Travels 535,500,000 0.02% 98. Marawila Resorts PLC Hotels And Travels 478,800,000 0.02% 99. Bansei Royal Resorts Hikkaduwa PLC Hotels And Travels 456,688,000 0.02% 100. Kalpitiya Beach Resort PLC Hotels And Travels 435,240,027 0.02% 101. Ramboda Falls PLC Hotels And Travels 328,000,000 0.01% 102. Hunas Falls Hotels PLC Hotels And Travels 260,437,500 0.01% 103. Miramar Beach Hotel PLC* Hotels And Travels 170,225,000 0.01%
1,005,435,684,100 37.76%
*missing data