impact of drought on crop production …...impact of drought on crop production and the food value...
TRANSCRIPT
IMPACT
OF DROUGHT
ON
CROP PRODUCTION
AND
THE FOOD VALUE CHAIN
July 2016
BRANCH: POLICY, PLANNING AND MONITORING AND EVALUATION
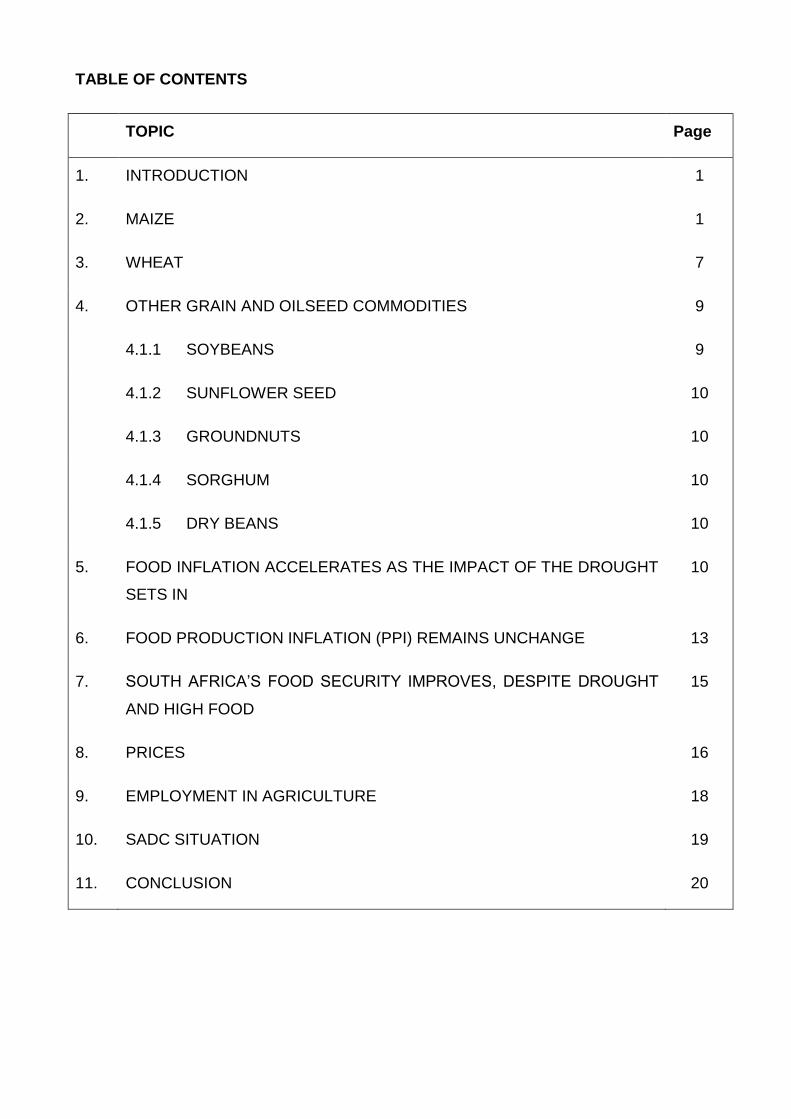
TABLE OF CONTENTS
TOPIC Page
1. INTRODUCTION 1
2. MAIZE 1
3. WHEAT 7
4. OTHER GRAIN AND OILSEED COMMODITIES 9
4.1.1 SOYBEANS 9
4.1.2 SUNFLOWER SEED 10
4.1.3 GROUNDNUTS 10
4.1.4 SORGHUM 10
4.1.5 DRY BEANS 10
5. FOOD INFLATION ACCELERATES AS THE IMPACT OF THE DROUGHT
SETS IN
10
6. FOOD PRODUCTION INFLATION (PPI) REMAINS UNCHANGE 13
7. SOUTH AFRICA’S FOOD SECURITY IMPROVES, DESPITE DROUGHT
AND HIGH FOOD
15
8. PRICES 16
9. EMPLOYMENT IN AGRICULTURE 18
10. SADC SITUATION 19
11. CONCLUSION 20

EXECUTIVE SUMMARY
The current drought has had a devastating effect on South African agriculture.
The area planted to maize for 2016 is estimated at 1,95 million ha, which is,
besides 2006 (1,60 million ha), the smallest area planted to maize since the 1928
season (1,926 million ha).
The maize crop having been reported at a level of 7,16 million tons in 2016 - a
tonnage already significantly below the norm, i.e. 11,00 million tons.
A looming grain deficit, especially the second half of 2016 resulting in maize
import requirements of up to 3,30 million tons, which will be the second highest
imports ever for South Africa.
The wheat planted in the country has declined drastically from levels close to 2
million ha in the late seventies to levels of less than 1 million ha shortly after the
abolishment of the marketing boards. For 2016, indications are that producers
intend to plant 481 850 ha of wheat.
For 2016, expected imports for wheat is about 60% (1,85 million tons) of South
Africa’s local consumption requirements (3,14 million tons).
Recent data from Statistics South Africa indicates that in May 2016, headline
inflation eased to 6,1% year-on-year (y/y) from 6,2% y/y in the previous month.
For the period May 2015 to May 2016, super maize meal (2,5kg) prices increased
by 35,12%, special maize meal (2,5kg) increased by 65,82%, whilst the domestic
price of white maize increased by 77,24%.
Between May 2015 and May 2016, the domestic wheat price increased by 30,07%,
brown bread (700g) price increased by 9,98% and white bread (700g) price
increased by 8,64%.
Rural communities are mostly impacted by inflation due to price transfers as a
result of costs incurred by business to transport finished goods from agro-
processors to the retailers situated in the rural areas.
South Africa’s farm debt at the end of December 2015 is estimated at R133 089
million, as against R116 576 million in 2014, which is an increase of 14,23%.
The employment level in agriculture was 15 000 jobs lower compared to a year
ago – from 891 000 jobs (Q1 of 2015) to 876 000 jobs (Q1 of 2016).

1
1. INTRODUCTION
South Africa is battling one of the worst droughts ever recorded that already started in early
2015. According to the South African Weather Service, 2015 was the driest year on record
in South Africa dating back to 1904.
Since 1904, rainfall in all nine provinces has averaged 608 mm per annum, while in 2015
South Africa received an average of only 403 mm (66% of the annual average). Previously,
the lowest rainfall received in a year was in 1945, when the country received 437 mm
(72%).
For the purpose of this report, we will focus on the impact of the drought on the maize and
wheat industries.
2. MAIZE
Maize is the largest produced field crop and is planted throughout the country under diverse
environments. South Africa is the main maize producer of maize on the African continent.
Using a 10-year average, approximately 2,5 million ha of maize is planted annually, of which
1,5 million ha is for white maize and 1,0 million ha for yellow maize.
Figure 1: Commercial maize – Area planted: 2006 - 2016
The estimated area that South African commercial producers planted to maize during the
2015/16 production season (equivalent to 2016 calendar year) is 1,947 million ha. This is
26,6% or 706 100 ha less than the 2,653 million ha planted the previous season (2015).
The area for white maize declined from 1,448 million ha in 2015 to 1,015 million ha in 2016
– which is 29,9% or 433 300 ha less on a year-by-year basis. For yellow maize, the area
declined from 1,205 million ha in 2015 to 932 000 ha in 2016.
1 6
00 2
00
2 5
51 8
00
2 7
99 0
00
2 4
27 5
00
2 7
42 4
00
2 3
72 3
00
2 6
99 2
00
2 7
81 2
00
2 6
88 2
00
2 6
52 8
50
1 9
46 7
50
10-yr-ave:
2 531 465 ha
1 000 000
1 200 000
1 400 000
1 600 000
1 800 000
2 000 000
2 200 000
2 400 000
2 600 000
2 800 000
3 000 000
2006
2007
2008
2009
2010
2011
2012
2013
2014
2015
2016
Ha Commercial Maize: Area planted
2006 - 2016
2
The area planted to maize since 1924, is depicted in the following graph.
Figure 2: Maize – Area planted: 1924 - 2016
Figure 2 clearly shows that, besides 2006, the current maize area of 1,947 million ha is the
smallest area planted to maize since the 1928 season (1,916 million ha).
Furthermore, the area planted to maize shows a decline since the mid-1970s, from its
highest level of close to 5 million ha in 1968, to a low of less than 2 million ha in the mid-
2000s. The reduction in the area planted since 1998 is mainly the result of the deregulation
of maize marketing through the abolishment of the fixed price single channel marketing
scheme.
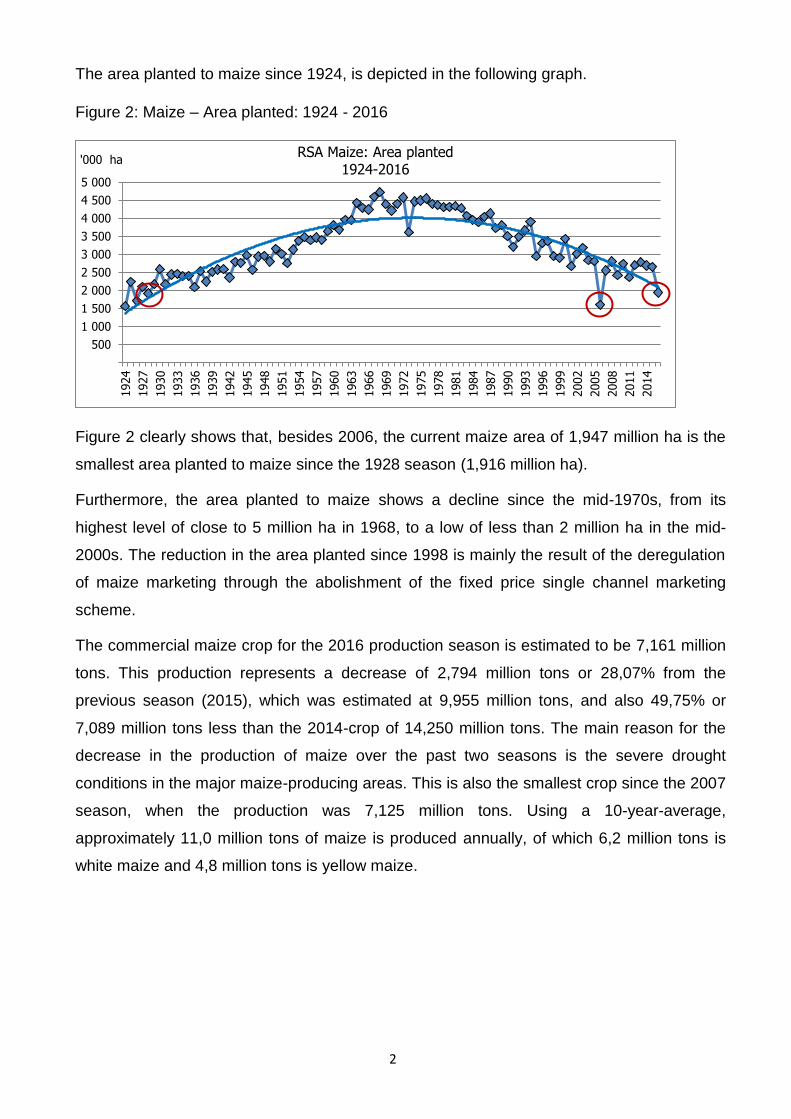
The commercial maize crop for the 2016 production season is estimated to be 7,161 million
tons. This production represents a decrease of 2,794 million tons or 28,07% from the
previous season (2015), which was estimated at 9,955 million tons, and also 49,75% or
7,089 million tons less than the 2014-crop of 14,250 million tons. The main reason for the
decrease in the production of maize over the past two seasons is the severe drought
conditions in the major maize-producing areas. This is also the smallest crop since the 2007
season, when the production was 7,125 million tons. Using a 10-year-average,
approximately 11,0 million tons of maize is produced annually, of which 6,2 million tons is
white maize and 4,8 million tons is yellow maize.
500
1 000
1 500
2 000
2 500
3 000
3 500
4 000
4 500
5 000
1924
1927
1930
1933
1936
1939
1942
1945
1948
1951
1954
1957
1960
1963
1966
1969
1972
1975
1978
1981
1984
1987
1990
1993
1996
1999
2002
2005
2008
2011
2014
'000 ha RSA Maize: Area planted
1924-2016
3
Figure 3: Commercial maize production: 2006 - 2016
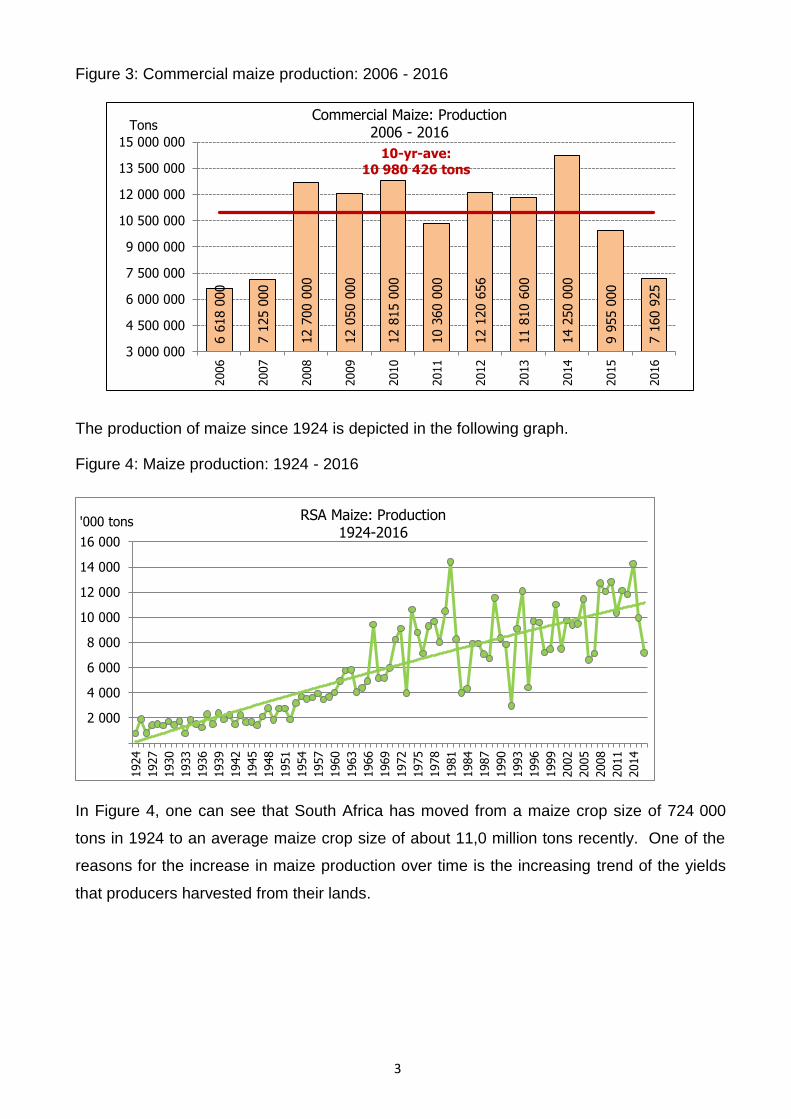
The production of maize since 1924 is depicted in the following graph.
Figure 4: Maize production: 1924 - 2016
In Figure 4, one can see that South Africa has moved from a maize crop size of 724 000
tons in 1924 to an average maize crop size of about 11,0 million tons recently. One of the
reasons for the increase in maize production over time is the increasing trend of the yields
that producers harvested from their lands.
6 6
18 0
00
7 1
25 0
00
12 7
00 0
00
12 0
50 0
00
12 8
15 0
00
10 3
60 0
00
12 1
20 6
56
11 8
10 6
00
14 2
50 0
00
9 9
55 0
00
7 1
60 9
25
10-yr-ave: 10 980 426 tons
3 000 000
4 500 000
6 000 000
7 500 000
9 000 000
10 500 000
12 000 000
13 500 000
15 000 000
2006
2007
2008
2009
2010
2011
2012
2013
2014
2015
2016
Tons Commercial Maize: Production
2006 - 2016
2 000
4 000
6 000
8 000
10 000
12 000
14 000
16 000
1924
1927
1930
1933
1936
1939
1942
1945
1948
1951
1954
1957
1960
1963
1966
1969
1972
1975
1978
1981
1984
1987
1990
1993
1996
1999
2002
2005
2008
2011
2014
'000 tons RSA Maize: Production 1924-2016

4
Figure 5: Maize yields 1924 - 2016
The increase in yields, especially since the start of the 1970s, late 1980s and early 1990s,
was driven by the trend of the withdrawal of marginal lands from production, mainly in the
more arid western production regions. In addition to this, producers started to implement
more efficient production technologies and practices coupled with the development of high-
yielding maize cultivars.
As indicated in Figure 5, the yields for the last two seasons were much lower than the
previous seven seasons due to the dry conditions, which had a negative impact on the
yields. The estimated maize yield for 2016 is 3,68 t/ha, and for 2015 it was 3,75 t/ha. This is
more than 1,50 t/ha lower than the yield obtained during 2014 (5,30 t/ha), which was the
highest yield ever recorded for maize in South Africa.
Most of the maize produced is consumed locally, and as a result, the domestic market is
very important to the industry.
0.00
0.50
1.00
1.50
2.00
2.50
3.00
3.50
4.00
4.50
5.00
5.50
1924
1927
1930
1933
1936
1939
1942
1945
1948
1951
1954
1957
1960
1963
1966
1969
1972
1975
1978
1981
1984
1987
1990
1993
1996
1999
2002
2005
2008
2011
2014
T/ha RSA Maize: Yields 1924-2016

5
Total maize supply and demand is indicated in the following table:
Marketing season 2014/15 2015/16 2016/17
Opening stocks (1 May) 589 028 2 073 600 2 475 000
Crop deliveries to
commercial structures 13 853 785 9 848 100 6 830 900
Imports 65 250 1 968 500 3 300 000
Total supply 14 508 063 13 890 200 12 605 900
RSA consumption 10 278 704 10 535 400 10 449 000
Exports 2 155 724 880 000 780 000
Total demand 12 434 428 11 415 400 11 229 000
Ending stocks (30 April) 2 073 635 2 474 800 1 376 900
The current maize crop is estimated at 7,16 million tons (on-farm use included), which is
well below the annual consumption of roughly 10,5 million tons. Against this background,
the country’s 2016/17 total maize import estimates are 3,30 million tons, of which 1,0 million
tons represents white maize and 2,30 million tons is yellow maize.
Figure 6: White maize imports and exports 2001 -2016
2011 2012 2013 2014 2015 2016
Imports 133 000 11 000 0 0 102 179 1 000 000
Exports 1 794 000 1 468 000 1 008 923 640 807 557 063 480 000
200 000
400 000
600 000
800 000
1 000 000
1 200 000
1 400 000
1 600 000
1 800 000
2 000 000
Tons White Maize: Imports and Exports
2001 - 2016
* 2016 Projection
6
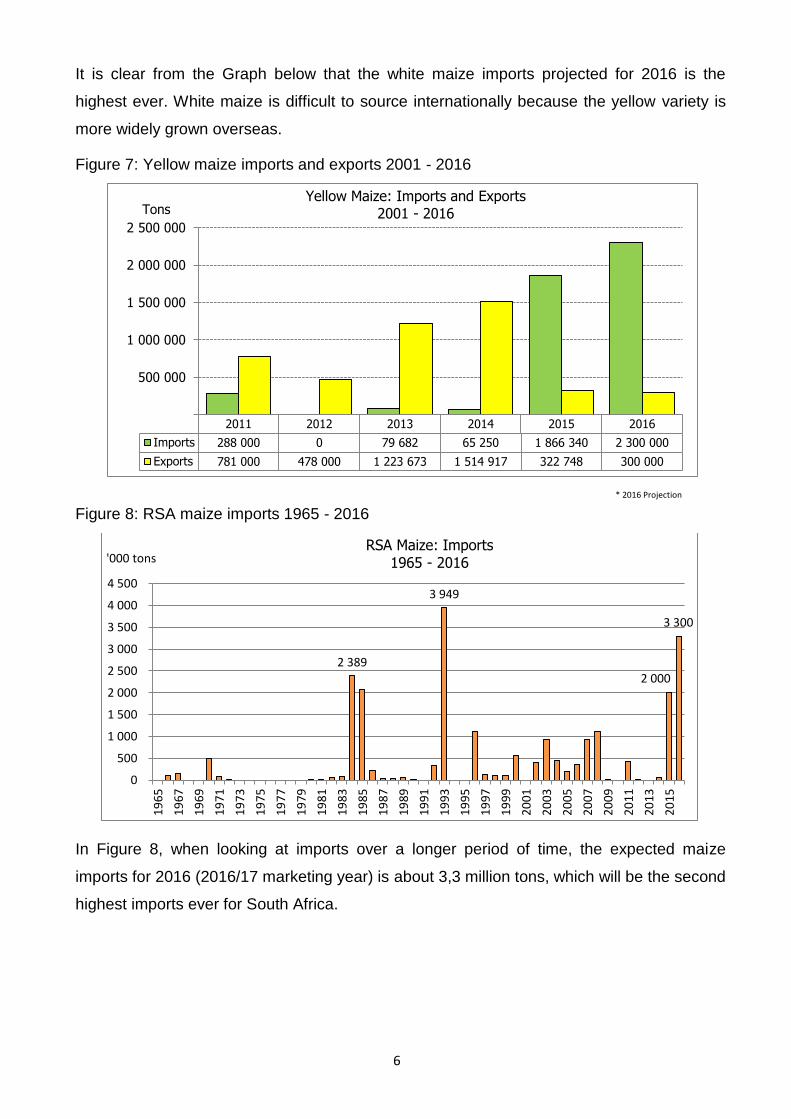
It is clear from the Graph below that the white maize imports projected for 2016 is the
highest ever. White maize is difficult to source internationally because the yellow variety is
more widely grown overseas.
Figure 7: Yellow maize imports and exports 2001 - 2016
Figure 8: RSA maize imports 1965 - 2016
In Figure 8, when looking at imports over a longer period of time, the expected maize
imports for 2016 (2016/17 marketing year) is about 3,3 million tons, which will be the second
highest imports ever for South Africa.
2011 2012 2013 2014 2015 2016
Imports 288 000 0 79 682 65 250 1 866 340 2 300 000
Exports 781 000 478 000 1 223 673 1 514 917 322 748 300 000
500 000
1 000 000
1 500 000
2 000 000
2 500 000
Tons Yellow Maize: Imports and Exports
2001 - 2016
2 389
3 949
2 000
3 300
0
500
1 000
1 500
2 000
2 500
3 000
3 500
4 000
4 500
19
65
19
67
19
69
19
71
19
73
19
75
19
77
19
79
19
81
19
83
19
85
19
87
19
89
19
91
19
93
19
95
19
97
19
99
20
01
20
03
20
05
20
07
20
09
20
11
20
13
20
15
'000 tons RSA Maize: Imports
1965 - 2016
* 2016 Projection

7
3. WHEAT
Wheat is by far the largest winter cereal crop planted in South Africa. The commercial wheat
producers planted 482 150 ha during 2015, which is 18,6% or 110 402 ha less than the 10-
year average of 592 552 ha planted.
A survey was done during April 2016 to determine producers’ intentions to plant wheat for
2016. Early indications are that producers intend to plant 481 850 ha, which is 0,1% or 300
ha less than 482 150 ha planted to wheat in 2015.
Figure 9: Wheat area planted 2006 - 2016
The wheat planted in the country has declined drastically from levels close to 2 million ha in
the late seventies to levels of less than 1 million ha shortly after the abolishment of the
marketing boards (Figure 10). Basic economic principles have been the key driver behind
this dramatic shift with the profitability of maize and lately soybeans outstripping that of
wheat, mainly due to the introduction of new genetically modified seed varieties boosting the
yields of maize and soybeans at a much faster rate. A further driver behind the shift in area
can also be attributed to the increased levels of risk aversion of farmers in the deregulated
marketing environment where wheat yields in these areas are more exposed to weather
risks such as late frost or rain that is not received in time.
764 8
00
632 0
00
748 0
00
642 5
00
558 1
00
604 7
00
511 2
00
505 5
00
476 5
70
482 1
50
481 8
50
100 000
200 000
300 000
400 000
500 000
600 000
700 000
800 000
900 000
2006
2007
2008
2009
2010
2011
2012
2013
2014
2015
2016
Ha RSA Wheat: Area planted 2006 - 2016
10 year ave: 592 552 ha

250 500 750
1 000 1 250 1 500 1 750 2 000 2 250
1931-3
5
1946-5
0
1952
1955
1958
1961
1964
1967
1970
1973
1976
1979
1982
1985
1988
1991
1994
1997
2000
2003
2006
2009
2012
2015
' 000 ha RSA Wheat: Area planted
1931 to 2016
8
Figure 10: Wheat area planted 1931 - 2016
Local wheat production is not sufficient for domestic requirements and South Africa has to
import different classes of wheat to meet domestic consumption.
Figure 11: Wheat production 2006 - 2015
2 1
05 0
00
1 9
05 0
00
2 1
30 0
00
1 9
58 0
00
1 4
30 0
00
2 0
05 0
00
1 8
70 0
00
1 8
70 0
00
1 7
50 0
00
1 4
40 0
00
500 000
1 000 000
1 500 000
2 000 000
2 500 000
2006
2007
2008
2009
2010
2011
2012
2013
2014
2015
Tons RSA Wheat: Production
2006 - 2015
10 year ave: 1 846 300 tons

9
Total wheat supply and demand is indicated in the following table:
Marketing season 2013/14 2014/15 2015/16
Opening stocks (1 Oct) 489 253 488 526 596 823
Crop deliveries to
commercial structures 1 855 287 1 714 697 1 416 100
Imports 1 668 412 1 832 441 1 850 000
Total supply 4 012 952 4 035 664 3 862 923
RSA consumption 3 255 975 3 147 013 3 141 600
Exports 268 451 291 828 80 000
Total demand 3 524 426 3 438 841 3 221 600
Ending stocks (30 Sep) 488 526 596 823 641 323
The current wheat crop estimate of 1,457 million tons (on-farm use included) is well below
the annual consumption of roughly 3,192 million tons. For 2015/16, South Africa faces
record imports of wheat, of which 1,521 million tons (82%) of the expected 1,850 million
tons, has already been imported.
4. OTHER GRAIN AND OILSEED COMMODITIES (Source: Food Security Bulletin,
June 2016)
4.1.1 SOYBEANS:
The production forecast for soybeans for 2016 is 728 650 tons, which is 31,90% or
341 350 tons less than the 1,070 million tons of the previous season. It is estimated that
502 800 ha have been planted to soybeans, which represents a decrease of 26,84% or
184 500 ha compared to the 687 300 ha planted last season. The expected yield of 1,45
t/ha.
This decline is due to the recent drought as it has affected many of the summer crops.
Since 2012, the production of soybeans has increased by 20% on average due to the
additional local capacity to process the soymeal, beans and oil.

10
4.1.2. SUNFLOWER SEED:
The production forecast for sunflower seed for 2016 is 742 750 tons, which is 12,03% or
79 750 tons more than the 663 000 tons of the previous season. The revised area
estimate for sunflower seed is 718 500 ha, which is about 24,74% or 142 500 ha more than
the 576 000 ha planted the previous season. The expected yield is 1,03 t/ha.
Sunflower normally benefits from late rains, so it is not moving in the same trend as other
crops that have been affected by the drought. Sunflower was therefore impacted by the
2015 drought as shown by the smaller tonnages for 2015. The producer deliveries and
demand for sunflower seed declined by 56% and 46%, respectively, in 2015.
4.1.3. GROUNDNUTS:
The expected groundnut crop for 2016 is 31 600 tons, which is 49,28% or 30 700 tons
less than the 62 300 tons of last season. For groundnuts, the area estimate is 22 600 ha,
which is 61,03% or 35 400 ha less than the 58 000 ha planted for the previous season.
The expected yield is 1,40 t/ha.
4.1.4. SORGHUM:
The production forecast for sorghum for 2016 is 88 500 tons, which is 26,56% or 32 000
tons less than the 120 500 tons of the previous season. The area estimate for sorghum
decreased by 31,21% or 22 000 ha, from 70 500 ha to 48 500 ha against the previous
season. The expected yield is 1,82 t/ha.
4.1.5. DRY BEANS:
In the case of dry beans, the production forecast for 2016 is 38 095 tons, which is 48,09%
or 35 295 tons less than the 73 390 tons of the previous season. The area estimate is
34 400 ha, which is 46,25% or 29 600 ha less than the 64 000 ha planted for the previous
season. The expected yield is 1,11 t/ha.
5. FOOD INFLATION ACCELERATES AS THE IMPACT OF THE DROUGHT SETS IN
(Released on 22 June 2016 by AgBiz)
Recent data from Statistics South Africa indicates that in May 2016, headline inflation eased
to 6,1% year-on-year (y/y) from 6,2% y/y in the previous month. This was well below the
market expectations of 6,4% y/y. This decrease was largely on the back of a fall in food and
non-alcoholic beverages inflation to 10,5% y/y, from 11,0% y/y in April 2016.

11
The food and non-alcoholic beverages basket consists of “bread and cereals”, “meat”, “fish”,
“milk, eggs and cheese”, “oils and fats”, “fruit”, “vegetables”, “sugar, sweets and deserts”,
“non-alcoholic beverages” and “other foods”. Each of these products is allocated a weight,
with the largest being “meat” and “bread and cereal”, which make up 30% and 23%,
respectively (Figure 12).
Figure 12: Weights of products in the food and non-alcoholic beverages basket
Source: Statistics South Africa and Agbiz Research
The largest year-on-year percentage decreases were recorded in “fruit”, “fish” and “other
food”, which eased at 12,8%, 6,3% and 7,1%, respectively (Figure 13). This decrease was
to some extent due to the statistical base effect. Agricultural commodity prices are still at
higher levels on the back of tight supplies caused by the El Nino induced drought.
Moreover, this year, South Africa is a net importer of both maize and wheat, therefore a
weaker Rand has added inflationary pressures on soft commodity prices, which in turn is
translating to higher food prices.

12
Figure 13: April and May 2016 y/y percentage growth
Source: Statistics South Africa and Agbiz Research
Some sectors within the fruit industry, such as citrus, are at the harvesting stages, which to
some extent might ease pressure on prices. On grain related foodstuffs, the pass-through of
high prices from the raw commodity side is already apparent on the retail food prices
(Figure 14 and 15).
Figure 14: South African white maize prices Figure 15: South African basic food prices
Source: Grain SA and Agbiz Research

13
Figure 16: Annual percentage change of CPI according to the regions (April 2015 to April
2016)
Source: Stats SA
Figure 16 represents rural consumers who are likely to be negatively affected by food
prices, with high food inflation of 27,6% visible on vegetable, followed by fats and oils
(26,4%) and bread and cereals (21,8%). Secondary urban areas are mostly affected in fruit
consumption, vegetables, and oils and fats (refer to Figure 16).
Rural communities are mostly impacted by inflation due to price transfers as a result of
costs incurred by business to transport finished goods from agro-processors to the retailers
situated in the rural areas. This contributes to the rural communities being the most affected
by inflation.
6. FOOD PRODUCER INFLATION (PPI) REMAINS UNCHANGED – (Released on 30
June 2016 by AgBiz)
The latest producer price index (PPI) data released by Statistics SA indicates that in May
2016, producer inflation for final manufactured goods slowed to 6,5% from 7% year-on-year
(y/y) in April 2016. However, producer inflation for food products remained flat at 10,9%.
The food products basket consists of four broad categories, which include “meat, fish, fruit,
vegetables, oils and fats”, “dairy products”, “grain mill products, starches and starch
products, and animal feeds” and “other food products”. Each of the above-mentioned
categories within the food products basket is allocated a weight, with the largest being
“meat, fish, fruit, vegetables, oils and fats” and “other food products”, which make up 37%
and 41%, respectively (Figure 17).
0%
5%
10%
15%
20%
25%
30%
CPI primary urban
CPI secondary urban
CPI rural

14
Figure 17: Weights of products in the food basket
Source: Statistics South Africa and Agbiz Research
Even though the PPI for food products remained flat from the previous month, there were
some movements in various food sub-sector categories indices. The “meat, fish, fruit,
vegetables, oils and fats” decreased by 1,3% from the previous month, largely underpinned
by a fall in meat and oil product prices.
However, this decrease was offset by a 4,3% increase in “dairy products”, which is in line
with seasonal increase in dairy product prices. It is foreseen that dairy price increases will
pick up pace in Q3 of 2016, and possibly easing in Q4 of 2016 as grazing improves during
the summer season, thus leading to an increase in milk production.
The “grain mill products, starches and starch products, and animal feeds” increased by
1,2% from the previous month, a trend that is reflective of the increases in raw commodity
prices (Figure 18).
Figure 18: Maize and wheat prices
Source: JSE, Agbiz Research

15
The “other food” category also increased by 0,5% from the previous month, with sugar
being the key driver of the increase. This again is reflective of the raw sugar prices, which
have mainly been underpinned by lower supplies on the back of the current drought.
Looking ahead in the short to medium term, it is expected that grain and oilseeds
commodities (critical inputs in food manufacturing) will remain at higher levels, at least until
mid-2017, assuming that there will be favourable weather conditions in the 2016/17
production season to replenish market supplies.
A number of weather forecasters already suggest that the El Nino event is at its final stages,
with possibilities of La Nina event by end of the year already increased to 75%, according to
the US Climate Prediction Centre. A La Nina weather event could lead to above-normal
rainfall in South Africa, which is essential to replenish soil moisture, and beneficial for crop
and livestock production.
Moreover, the wheat tariff is expected to increase by at least 30% from the current level of
R1 224,30 per ton to R1 591,40 per ton. All of this is expected put input costs of food
manufactures in the grain milling and bakery products sub-sectors under pressure. Worth
noting is a proposed review of the existing variable formulae for wheat, sugar and maize
import tariff from the Ministry of Finance, whose findings will have implications on food
manufacture’s input costs in the medium term.
7. SOUTH AFRICA’S FOOD SECURITY IMPROVES, DESPITE DROUGHT AND
HIGH FOOD PRICES – (Agbiz, 27 June 2016)
South Africa’s food security status has actually improved, according to the Global Food
Security Index released by the Economist Intelligence Unit (EIU) and commissioned by
DuPont. This year is the fifth edition of the Global Food Security Index, which is an annual
measure of the state of global food security in 113 countries
(http://foodsecurityindex.eiu.com/).
South Africa ranks 47th among a sample 113 countries with an index score of 62,9 points
out of a possible 100 points. This means that South Africa is the 47th most food secure
country in the world, and the highest ranked in Africa.
The 2016 index score improved by 0,6 points, despite high levels of food inflation (10,8%),
and high food prices – which were mainly caused by the drought. However, affordability is
only one dimension of the Food Index Score.

16
The other two measures in the score include availability, as well as quality and safety –
which South Africa seems to have excelled in. That said, with food prices expected to
remain at higher levels, the affordability sub-index could remain under pressure.
Noted in the report is the lack of access to farm finance, which is a binding constraint on
improving production efficiency and adopting better technologies across emerging markets.
In South Africa, the key concern relates to the impact of the drought on the farmers’ ability
to pay off debt.
South Africa’s farm debt at the end of December 2015 is estimated at R133 089 million, as
against R116 576 million in 2014, which is an increase of 14,23%. There is a growing
sentiment amongst agribusinesses that some farmers might not be able to meet their debt
obligations.
Apart from the financial pressures related to decreased production in current drought
conditions and the impact on farm income, South African farmers pay significantly more for
their inputs, in particular for fertilizer, which cost 78% more than in comparable countries.
The two main reasons for higher domestic input costs are:
Lower domestic yields when compared to countries such as Brazil, Argentina, the US
and Ukraine, which drives up the cost of producing a ton of maize. The reason for lower
yields is mainly the difference in suitability and availability of natural resources like soil
quality and climate.
More importantly, the costs for fertilizer and chemicals are higher because South Africa
is a net importer of these inputs or key components thereof. Thus, supply chain related
costs such as deep sea freight, landing costs, margins and inland transportation to key
producing regions are expensive. The weakening of the exchange rate is also a key
driver and contributor to the high input costs. (BFAP, February 2016)
8. PRICES
The impact of the drought and the weakening of the exchange rate are working their way
through the food value chain. However, the CPI figures for May 2016 showed a lower than
anticipated aggregated CPI (of 6,1 % y/y) and was the lowest since December 2015, as
food costs rose at a slower pace and petrol prices declined less. Compared to May 2015,
prices increased at a slower 10,5 % for food and non-alcoholic beverages (+11 % in April),
driven mainly by unprocessed food (up 13,2 % from 14,1 %).

17
During May 2015 and May 2016, the international wheat price decreased by 20,15%,
whereas the domestic price of wheat increased by 30,07%.
Figure 19: Domestic market price vs global market price of wheat
Source: FAO and SAFEX, 2016
Between May 2015 and May 2016, the domestic wheat price increased by 30,07%, brown
bread (700g) price increased by 9,98% and white bread (700g) price increased by 8,64%.
Figure 20: Domestic wheat price and bread price trends
Source: Stats SA and SAFEX, 2016
Regarding maize price trends, the international price of yellow maize increased by 1,61%
from May 2015 to May 2016, whereas the domestic price of yellow maize increased by
44,82%. For white maize, the South African price has more than doubled since the start of
2015 as the drought led to the least rainfall in the country since 1904.
-
100
200
300
400
5
1005
2005
3005
4005
5005
6005
Jan
-10
May
-10
Sep
-10
Jan
-11
May
-11
Sep
-11
Jan
-12
May
-12
Sep
-12
Jan
-13
May
-13
Sep
-13
Jan
-14
May
-14
Sep
-14
Jan
-15
May
-15
Sep
-15
Jan
-16
May
-16
Inte
rnat
ion
al p
rice
(U
S$/t
on
)
Do
mes
tic
Pri
ce (
R/t
on
)
Domestic price of wheatWheat (US No.2, Hard Red Winter ord. Prot, US Fob Gulf (Tuesday))
0
1000
2000
3000
4000
5000
6000
5
7
9
11
13
15
Jan
-10
May
-10
Sep
-10
Jan
-11
May
-11
Sep
-11
Jan
-12
May
-12
Sep
-12
Jan
-13
May
-13
Sep
-13
Jan
-14
May
-14
Sep
-14
Jan
-15
May
-15
Sep
-15
Jan
-16
May
-16
Wh
eat
pri
ce (
R/t
on
)
Bre
ad p
rice
(R
/lo
af)
Loaf of brown bread 700g Loaf of white bread 700g Domestic price of wheat
18
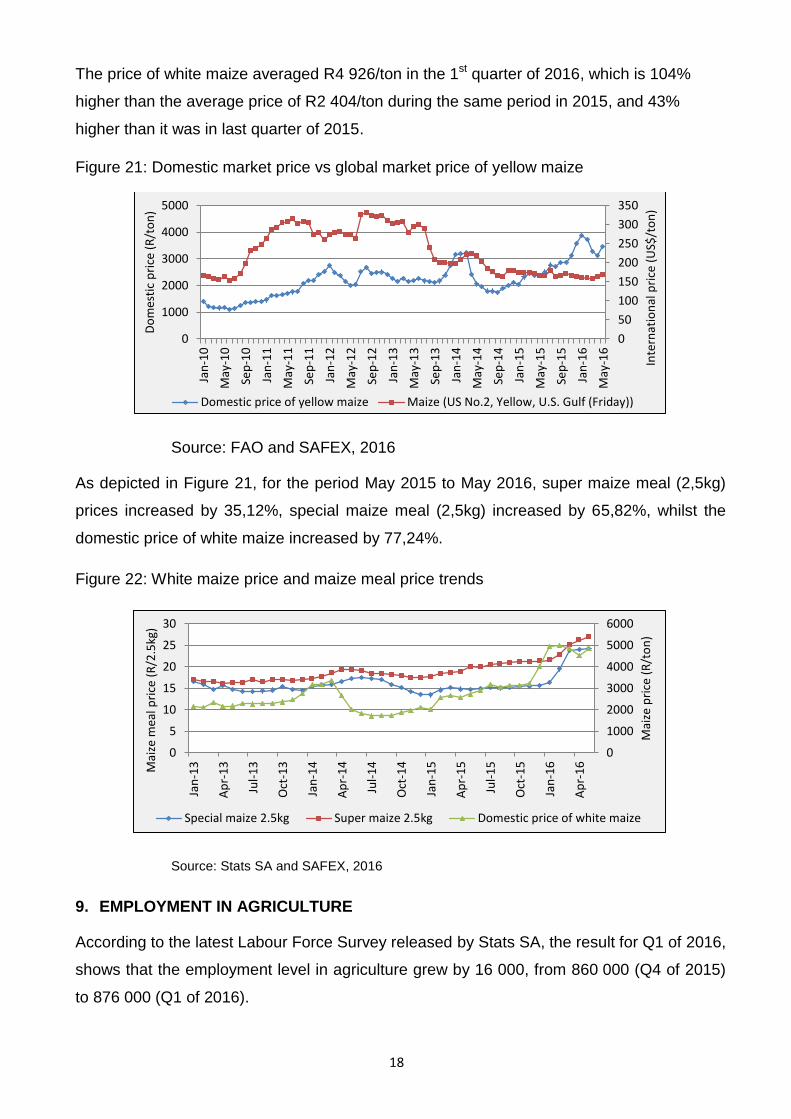
The price of white maize averaged R4 926/ton in the 1st quarter of 2016, which is 104%
higher than the average price of R2 404/ton during the same period in 2015, and 43%
higher than it was in last quarter of 2015.
Figure 21: Domestic market price vs global market price of yellow maize
Source: FAO and SAFEX, 2016
As depicted in Figure 21, for the period May 2015 to May 2016, super maize meal (2,5kg)
prices increased by 35,12%, special maize meal (2,5kg) increased by 65,82%, whilst the
domestic price of white maize increased by 77,24%.
Figure 22: White maize price and maize meal price trends
Source: Stats SA and SAFEX, 2016
9. EMPLOYMENT IN AGRICULTURE
According to the latest Labour Force Survey released by Stats SA, the result for Q1 of 2016,
shows that the employment level in agriculture grew by 16 000, from 860 000 (Q4 of 2015)
to 876 000 (Q1 of 2016).
0
50
100
150
200
250
300
350
0
1000
2000
3000
4000
5000Ja
n-1
0
May
-10
Sep
-10
Jan
-11
May
-11
Sep
-11
Jan
-12
May
-12
Sep
-12
Jan
-13
May
-13
Sep
-13
Jan
-14
May
-14
Sep
-14
Jan
-15
May
-15
Sep
-15
Jan
-16
May
-16
Inte
rnat
ion
al p
rice
(U
S$/t
on
)
Do
mes
tic
pri
ce (
R/t
on
)
Domestic price of yellow maize Maize (US No.2, Yellow, U.S. Gulf (Friday))
0
1000
2000
3000
4000
5000
6000
0
5
10
15
20
25
30
Jan
-13
Ap
r-1
3
Jul-
13
Oct
-13
Jan
-14
Ap
r-1
4
Jul-
14
Oct
-14
Jan
-15
Ap
r-1
5
Jul-
15
Oct
-15
Jan
-16
Ap
r-1
6
Mai
ze p
rice
(R
/to
n)
Mai
ze m
eal p
rice
(R
/2.5
kg)
Special maize 2.5kg Super maize 2.5kg Domestic price of white maize

Despite the quarterly increase, employment was lower by 15 000 jobs compared to a year
ago. The increase is mainly due to the seasonal employment in the deciduous fruits sub-
sector.
Figure 23: Employment in Agriculture
10. SADC SITUATION
FEWS NET estimates that a higher than normal number of people is currently facing acute
food insecurity and about 17 million people will require immediate assistance between
January and March 2017 in Zimbabwe, Malawi, Mozambique, Madagascar, Lesotho and
Swaziland.
Households in these countries are facing consumption gaps because they did not produce
much staple this season and labor incomes are well-below average, constraining food
access for households that are relying on market purchases for consumption much earlier
than usual. For households in many drought-affected areas in the region, this is the second
or third consecutive year of poor production.
A regional cereal deficit of 6 to 8 million tons is expected in Southern Africa. Imports from
Zambia, Tanzania and other international markets will only partially mitigate this shortfall.
Maize prices, which are already above last year and the five-year average, are expected to
rise further and remain significantly above these levels, especially in Malawi, Mozambique,
Madagascar, and Zimbabwe. Some of the main drivers of the high food prices are low
maize supplies and substantially higher demand for market purchases.

20
11. CONCLUSION
Reduced domestic production induces significant changes in trade volumes to meet
domestic demand, even when it implies substantial price increases. As the most basic food
staple that was hardest hit by the severe drought conditions, significant quantities of maize
will have to be imported in 2016.
There are ample supplies of yellow maize in the world market and the local shortfalls will
comfortably be met by imports. However, Mexico’s ability to provide the entire domestic
shortfall of white maize remains uncertain. South Africa may need to look elsewhere
towards the end of the season, with the US the most likely alternative. Current GM
regulations would, however, have to be altered for US imports to occur. Opening the US
market will reduce maize meal prices and provide a more certain source of white maize
imports to the South African market to ensure availability.
As South Africa is normally an exporter of maize the total import volumes expected in 2016
are unprecedented. To ensure that imports occur timeously and efficiently, infrastructural
capacity needs to be considered. The total loading capacity within the 4 ports currently used
for grain trade (Durban, Cape Town, Port Elizabeth and East London), is sufficient for the
additional import requirements, but continued cooperation between industry and
government is essential for imports to occur timeously.
Coming as it did after an already below-average production season in 2015, the
combination of the drought and the weaker exchange rate has already impacted severely on
agricultural commodity prices in South Africa. Furthermore, reduced production volumes will
impact on South Africa’s trade balance. Sectors such as maize and sugar, which would
normally contribute to the sector’s positive trade balance, will shift to a negative net trade
position in 2016.
From a farm business perspective the current drought will not only affect the current
production season, but might also have long term financial and debt implications for farm
businesses. Furthermore, poor rural households continue to be dependent on household
agricultural production. More than 1,2 million individuals will be affected by the current
drought, which will inevitably have a significant impact on maize yields and would give rise
to food insecurity. Hence, supporting the primary agricultural sector to overcome the short
term effects is critical to ensure that long-term agricultural production, growth and food
security is not compromised.

SOURCE:
Agbiz:.www.agbiz.co.za
CEC (Crop Estimates Committee): www.daff.gov.za / Statistics
FEWSNET:www.fews.net/global
FAO:www.fao.org.za
Grain SA:www.grainsa.co.za.
NAMC: Supply and Demand Estimates Committee: www.namc.co.za
SAGIS:www.sagis.org.za
Statistics SA:www.statssa.gov.za