impact of climate change on diffuse pollutant fluxes at the watershed scale
TRANSCRIPT

HYDROLOGICAL PROCESSESHydrol. Process. 28, 1962–1972 (2014)Published online 5 March 2013 in Wiley Online Library(wileyonlinelibrary.com) DOI: 10.1002/hyp.9723
Impact of climate change on diffuse pollutant fluxes at thewatershed scale
Mehdi Ahmadi, Rosemary Records and Mazdak Arabi*Department of Civil and Environmental Engineering, Colorado State University, Fort Collins, CO 80523, USA
*Cme805E-m
Co
Abstract:
This study aims to assess watershed-scale impacts of changing climate on sediment, phosphorus, nitrogen and pesticide (atrazine)fluxes over the 21st century at the watershed scale. In particular, changes in dissolved and particulate forms of water qualityconstituents in response to climate change are investigated. The hydrologic model Soil and Water Assessment Tool was calibratedand evaluated in a primarily agricultural watershed in the Midwestern United States to simulate hydrologic and water qualityprocesses on a daily basis over the 2015–2099 time horizon. The model was then driven with 112 distinct statistically downscaledclimate projections representing Intergovernmental Panel on Climate Change Special Report on Emissions Scenarios (IPCC SRES)low, moderate and high greenhouse gas emission scenarios. Projected hydrologic and water quality responses were categorizedaccording to the three IPCC SRES emission scenarios for summarizing and synthesizing results over early-century (2015–2034),mid-century (2045–2064) and late-century (2080–2099) assessment. Results revealed clear warming trends in the study area,whereas small increases in precipitation were predicted. Streamflow, sediment and total nutrient loads did not differ noticeablybetween assessment periods. However, the proportion of dissolved to total nutrients increased significantly from early-century tolate-century periods. With the exception of total atrazine in the mid-century period, predicted pollutant loads for a given assessmentperiod did not differ between emission pathways for a given assessment period. Changes in pollutant fluxes showed pronouncedmonthly variability. The projected increase in readily available forms of nutrients has important implications for the ecologicalhealth of water systems and management of drinking water supplies. Copyright © 2013 John Wiley & Sons, Ltd.
Supporting information may be found in the online version of this article.
KEY WORDS climate change; hydrology; water quality; modelling; nutrients; SWAT
Received 21 August 2012; Accepted 8 January 2013
INTRODUCTION
Non-point source pollution is the primary cause ofimpairment for water bodies in the United States andmany regions around the world. Elevated nutrient,sediment and pesticide loads to waterways may negativelyimpact human health and aquatic ecosystems, increasingcosts of pollutant mitigation andwater treatment (Novotny,2003). Watershed programmes, such as the US Environ-mental Protection Agency Total Maximum Daily Load(TMDL) (NRC, 2001) and the European Water Frame-work Directive (Kaika, 2003), aim to maintain or enhancethe water quality status of water bodies within theirjurisdictions. Achieving the objectives of these pro-grammes necessitates a comprehensive understanding ofpollutant loads into the water body of interest and of thewaste assimilative capacity of the water body. However,the fate and transport of pollutants from diffuse sources andthe ability of water bodies to assimilate pollutants arecontrolled by complex watershed interactions that arelikely to alter substantially with the variability of climaticforcings (Jennings et al., 2009; Novotny, 2003; Zhang,
orrespondence to: Mazdak Arabi, Department of Civil and Environ-ntal Engineering, Colorado State University, Fort Collins, CO23, USA.ail: [email protected]
pyright © 2013 John Wiley & Sons, Ltd.
2009). Characterization of changes in fluxes of water,sediments and chemicals at the watershed scale in responseto the changing climate is essential for the development ofeffective watershed management plans and mitigationstrategies (SWCS, 2003; Tedesco et al., 2005; Garbrechtet al., 2007; Zhang, 2009).Changes in global climate have already been observed
and are well documented (IPCC, 2007). Future climaticchanges are anticipated to alter mean stream discharge aswell as magnitude and intensity of extreme hydrologicevents (Praskievicz and Chang, 2009). Also, evidentshifts in the climatic and hydrologic conditions in awatershed system beget alteration of biogeochemicalprocesses that control the fate and transport of nutrientsand hazardous chemicals (Baron et al., 2009; Solheimet al., 2010). These water quality responses to climatechange are diverse and controlled by multiple factors.Warmer temperatures may intensify loads of somenutrient species to water bodies (e.g. nitrate) whilereducing loads of other constituents (e.g. organic nitrogenand phosphorus) by accelerating decomposition andmineralization and altering timing and magnitude of lowand high flows. Climate-induced changes in frequencyand intensity of precipitation may increase nutrient fluxesvia greater stream discharge and accelerated surfacerunoff and erosion of upland soils or, conversely, mayreduce loads under summer drought conditions andassociated low flows (Solheim et al., 2010).
1963WATERSHED SCALE IMPACTS OF CLIMATE CHANGE ON WATER QUALITY
Hydrologic models coupled with projected futureclimate scenarios are used to investigate hydrologic andwater quality responses to climate change (Praskieviczand Chang, 2009). The majority of modelling studiesassessing these responses to climate change have beenconducted at the level of large river basins or politicalboundaries (states or countries) (Abbaspour et al., 2009;Gassman et al., 2007; Jha, 2004; Krysanova et al., 2005;Marshall and Randhir, 2008; Stone, 2003). Modellinglarge geographical extents necessarily entails configur-ation of larger computational units and assimilation ofdata at coarser spatial resolutions. However, potentialimpacts of the changing climate on water resources mustbe characterized at the watershed scale at which diffusepollution processes function (Chaplot, 2007).Although a large body of hydrologic modelling research
has addressed climate-induced changes in water quantity(Lettenmaier et al., 1999; Wood et al., 2004; Hay et al.,2011), far fewer studies have addressed potentially severeconsequences for water quality (Murdoch et al., 2000;Jeppesen et al., 2009), and an even smaller number ofstudies has characterized potential changes in phosphorus(Baron et al., 2009; Solheim et al., 2010; SWCS, 2003).Also, climate-induced changes in partitioning of diffusepollutants, e.g. relative changes in nitrate versus totalnitrogen (TN) loads or the ratio of dissolved reactivephosphorus to total phosphorus (TP), have received littleattention.Similarly, the response of pesticide fluxes at the
watershed scale to the changing climate has beengenerally overlooked (Bloomfield et al., 2006; Solheimet al., 2010). Impacts of climate change on loads ofhazardous materials such as pesticides to water bodies arecomplex and likely to be highly variable with thecompound and watershed considered. Changes in hydro-climatic controls such as temperature, evapotranspirationand storm frequency may substantially impact pesticideresidence times and delivery ratios, causing climate-induced shifts in pesticide degradation, volatilization andtransport (Bloomfield et al., 2006; Harman et al., 2011).Previous assessments of climate change impacts on
water quality have utilized a relatively narrow range ofpotential future climate scenarios. Climate scenarioconditions are typically incorporated into hydrologicmodels as a combination of changes in temperature andprecipitation and, in some cases, atmospheric concentra-tions of CO2. An emerging body of research utilizesdownscaled climate projections derived from generalcirculation model (GCM) grids. GCMs project a range offuture climates and are typically based on greenhouse gas(GHG) emissions scenarios outlined by the Intergovern-mental Panel on Climate Change Special Report onEmissions Scenarios (IPCC SRES). Most previousresearch utilizing GCMs has selected scenarios from onlya few models (Hanratty and Stefan, 1998; Jha, 2004;Marshall and Randhir, 2008; Abbaspour et al., 2009; Parket al., 2011). However, studies indicate that the selectedclimate scenarios may be the greatest source ofuncertainty in predicting future hydrologic and water
Copyright © 2013 John Wiley & Sons, Ltd.
quality conditions (Gassman et al., 2007; Praskievicz andChang, 2009; Ficklin et al., 2010; Foy, 2010). Use ofemission path ensembles is recommended to removeindividual GCM biases and improve model predictivepower (Hay et al., 2009; Pierce et al., 2009). Ensemblesderived from an extensive set of climatic projectionsprovide critical insight into the range of future hydrologicand water quality responses that may not be adequatelycharacterized when scenarios from only a few GCMs areconsidered.The primary goal of this paper is to assess the potential
watershed-scale impacts of the changing climate onpollutant fluxes over the 21st century, specificallysediment, phosphorus, nitrogen and atrazine. Specificobjectives are (1) to understand climatic conditions undera comprehensive set of 112 climate projections consistentwith IPCC SRES emission pathways and models; (2) tofully enumerate and synthesize hydrologic and waterquality responses to projected climate scenarios and (3) toinvestigate changes in dissolved and particulate waterquality constituents. These objectives are investigated inthe Eagle Creek Watershed (ECW), a primarily agricul-tural watershed in the Midwestern United States. Thepotential impacts are investigated by holding manage-ment and land uses unchanged over the course of the 21stcentury. Stakeholders have identified reductions in nitrateand atrazine loading as critical to water quality improve-ments in the watershed, which is a major source ofdrinking water for the Indianapolis metropolitan area.
METHODS AND MATERIALS
The Soil andWater Assessment Tool (SWAT) was used inan exploratory mode to characterize potential water qualityimpacts of climate change in the ECW, Indiana. TheSWATmodel was calibrated for the period 1995–2000 andevaluated for the period 2001–2004 for daily streamflowand monthly nitrate and atrazine loads. A total of 112statistically downscaled climate projections, representingIPCC SRES emission pathways A2, A1B and B1 and 16GCMs, were used as climatic forcings to the SWATmodelfor 112 distinct simulations over the 2015–2099 period.Hydrologic and water quality responses were categorizedaccording to the three IPCC SRES emission scenarios forsummarizing and synthesizing the results. Temporal trendsin the magnitude of responses were evaluated bycomparing annual time series of responses correspondingto the early-century (2015–2034), mid-century (2045–2064) and late-century (2080–2099) assessment periods.
Study area and data availability
The ECW lies within the Upper White RiverWatershed of central Indiana and drains into Eagle CreekReservoir, which supplies drinking water to the City ofIndianapolis (Figure 1). The 248 km2 basin extends from40�0102400 to 40�0401600 north latitudes and 86�1504300 to86�1604500 west longitudes. Mean annual precipitation forECW is 1052mm and mean monthly temperatures
Hydrol. Process. 28, 1962–1972 (2014)
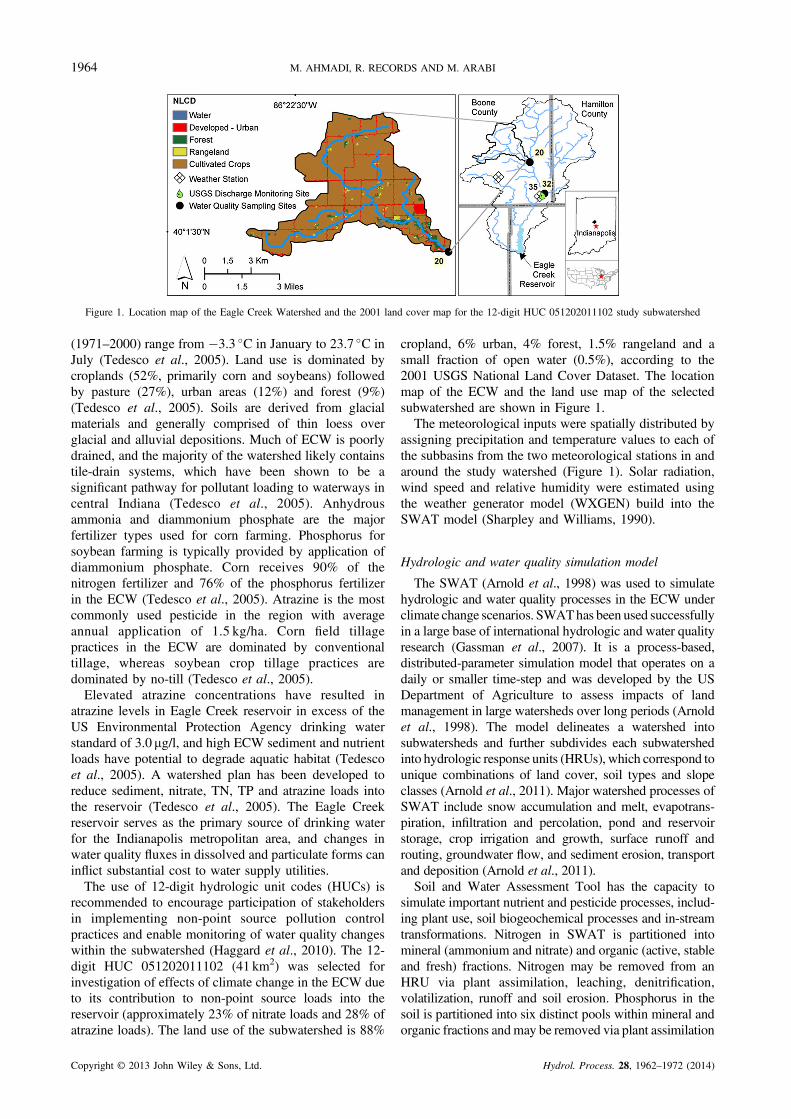
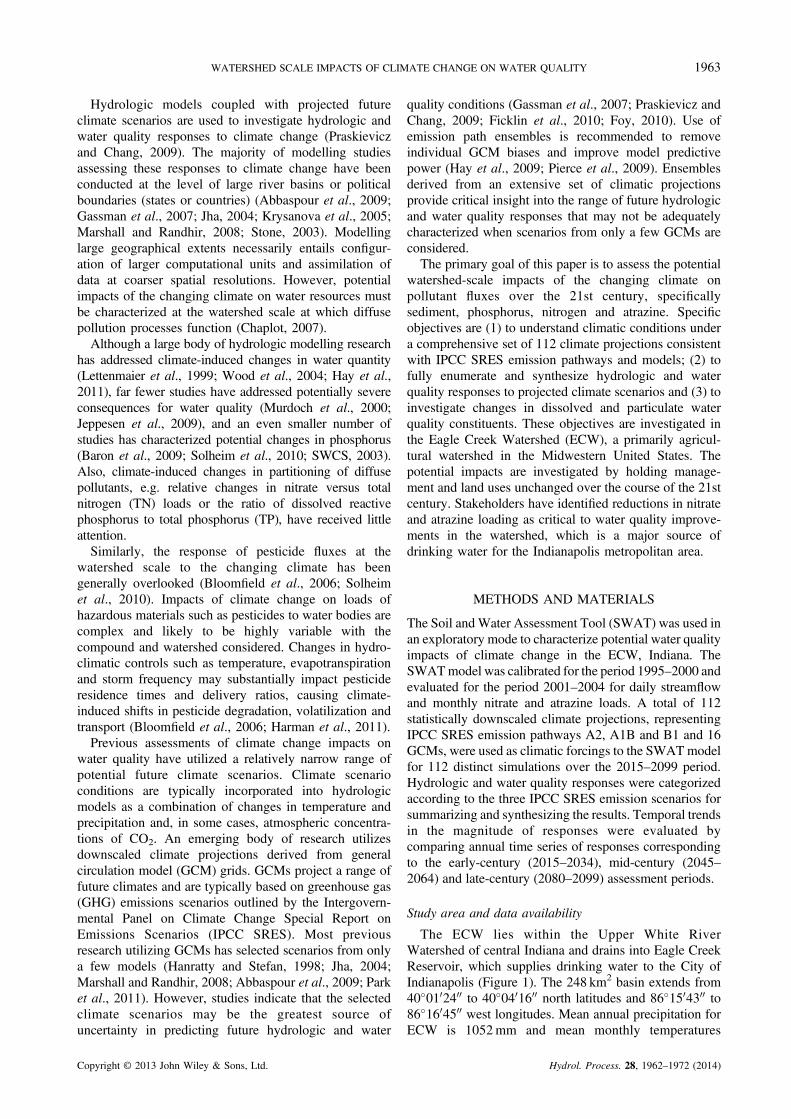
Figure 1. Location map of the Eagle Creek Watershed and the 2001 land cover map for the 12-digit HUC 051202011102 study subwatershed
1964 M. AHMADI, R. RECORDS AND M. ARABI
(1971–2000) range from �3.3 �C in January to 23.7 �C inJuly (Tedesco et al., 2005). Land use is dominated bycroplands (52%, primarily corn and soybeans) followedby pasture (27%), urban areas (12%) and forest (9%)(Tedesco et al., 2005). Soils are derived from glacialmaterials and generally comprised of thin loess overglacial and alluvial depositions. Much of ECW is poorlydrained, and the majority of the watershed likely containstile-drain systems, which have been shown to be asignificant pathway for pollutant loading to waterways incentral Indiana (Tedesco et al., 2005). Anhydrousammonia and diammonium phosphate are the majorfertilizer types used for corn farming. Phosphorus forsoybean farming is typically provided by application ofdiammonium phosphate. Corn receives 90% of thenitrogen fertilizer and 76% of the phosphorus fertilizerin the ECW (Tedesco et al., 2005). Atrazine is the mostcommonly used pesticide in the region with averageannual application of 1.5 kg/ha. Corn field tillagepractices in the ECW are dominated by conventionaltillage, whereas soybean crop tillage practices aredominated by no-till (Tedesco et al., 2005).Elevated atrazine concentrations have resulted in
atrazine levels in Eagle Creek reservoir in excess of theUS Environmental Protection Agency drinking waterstandard of 3.0 mg/l, and high ECW sediment and nutrientloads have potential to degrade aquatic habitat (Tedescoet al., 2005). A watershed plan has been developed toreduce sediment, nitrate, TN, TP and atrazine loads intothe reservoir (Tedesco et al., 2005). The Eagle Creekreservoir serves as the primary source of drinking waterfor the Indianapolis metropolitan area, and changes inwater quality fluxes in dissolved and particulate forms caninflict substantial cost to water supply utilities.The use of 12-digit hydrologic unit codes (HUCs) is
recommended to encourage participation of stakeholdersin implementing non-point source pollution controlpractices and enable monitoring of water quality changeswithin the subwatershed (Haggard et al., 2010). The 12-digit HUC 051202011102 (41 km2) was selected forinvestigation of effects of climate change in the ECW dueto its contribution to non-point source loads into thereservoir (approximately 23% of nitrate loads and 28% ofatrazine loads). The land use of the subwatershed is 88%
Copyright © 2013 John Wiley & Sons, Ltd.
cropland, 6% urban, 4% forest, 1.5% rangeland and asmall fraction of open water (0.5%), according to the2001 USGS National Land Cover Dataset. The locationmap of the ECW and the land use map of the selectedsubwatershed are shown in Figure 1.The meteorological inputs were spatially distributed by
assigning precipitation and temperature values to each ofthe subbasins from the two meteorological stations in andaround the study watershed (Figure 1). Solar radiation,wind speed and relative humidity were estimated usingthe weather generator model (WXGEN) build into theSWAT model (Sharpley and Williams, 1990).
Hydrologic and water quality simulation model
The SWAT (Arnold et al., 1998) was used to simulatehydrologic and water quality processes in the ECW underclimate change scenarios. SWAThas been used successfullyin a large base of international hydrologic and water qualityresearch (Gassman et al., 2007). It is a process-based,distributed-parameter simulation model that operates on adaily or smaller time-step and was developed by the USDepartment of Agriculture to assess impacts of landmanagement in large watersheds over long periods (Arnoldet al., 1998). The model delineates a watershed intosubwatersheds and further subdivides each subwatershedinto hydrologic response units (HRUs), which correspond tounique combinations of land cover, soil types and slopeclasses (Arnold et al., 2011). Major watershed processes ofSWAT include snow accumulation and melt, evapotrans-piration, infiltration and percolation, pond and reservoirstorage, crop irrigation and growth, surface runoff androuting, groundwater flow, and sediment erosion, transportand deposition (Arnold et al., 2011).Soil and Water Assessment Tool has the capacity to
simulate important nutrient and pesticide processes, includ-ing plant use, soil biogeochemical processes and in-streamtransformations. Nitrogen in SWAT is partitioned intomineral (ammonium and nitrate) and organic (active, stableand fresh) fractions. Nitrogen may be removed from anHRU via plant assimilation, leaching, denitrification,volatilization, runoff and soil erosion. Phosphorus in thesoil is partitioned into six distinct pools within mineral andorganic fractions andmay be removed via plant assimilation
Hydrol. Process. 28, 1962–1972 (2014)

1965WATERSHED SCALE IMPACTS OF CLIMATE CHANGE ON WATER QUALITY
or mass flow of water. Pesticides applied to an HRUundergo processes based in part on the GLEAMS model(Leonard et al., 1987). Pesticides may be transported to astream network through surface runoff in either sorbed ordissolved form or leached into the soil profile and aquifer insolution (Arnold et al., 2011). Once in-stream, nutrienttransformations are governed by procedures adopted fromthe QUAL2E water quality model (Brown and Barnwell,1987) while pesticide transformations follow first-orderdecay relationships (Arnold et al., 2011).The SWAT model for the study watershed was set up
using 35 subwatersheds and 446 HRUs using a 30-mresolution digital elevation model from the US GeologicalSurvey National Elevation Dataset (USGS NED, 2010),county-based soil data from the US Soil SurveyGeographic Database (USDA NRCS, 2010), and twogeospatial land cover products: the 1992 and 2001National Land Cover Dataset for non-cropland areas(USGS NLCD, 1992; 2001) and the 1995 and 2000–2004National Agricultural Statistics Service Cropland DataLayers for croplands (USDA NASS, 2003). Land use wasupdated on an annual basis using geospatial land coverproducts and SWAT land use update component.Daily streamflow data at the watershed outlet (US
Geological Survey gauge number 03353200; site 35,Figure 1) and instantaneous nitrate (NO�
3 ) and atrazinesampled on a bi-weekly and monthly basis by the IndianaDepartment of Environmental Management at two sites(sites 20 and 32, Figure 1) were utilized for modelcalibration and evaluation. Monthly loads of nitrate andatrazine were estimated from instantaneous concentrationvalues using the LOADEST model (Runkel et al., 2004).Calibration was performed for the 1995–2000 period,following an initial 2-year warm-up. The model was thenevaluated for daily streamflow and monthly nitrate andatrazine loads for the 2001–2004 period. The parametersof SWAT affecting the streamflow, nitrate and atrazinewere identified after an intensive local and globalsensitivity analysis. Phosphorus and erosion parametervalues were identified through a detailed literature review.Table A1 provides a list of the selected parameters andtheir calibrated values. The simulated and observedstreamflow hydrograph and the atrazine and nitrateloadings were shown in Figure A1.
Climate scenarios
General circulation models are commonly used toderive climate scenarios for hydrologic and water qualityimpacts analysis (Praskievicz and Chang, 2009). GCMclimate predictions typically use IPCC SRES scenariosA2, A1B and B1, corresponding to high, moderate andlow GHG emissions, respectively (IPCC, 2007). BecauseGCMs are typically at too coarse a resolution (spatiallyand temporally) for watershed-scale assessments, they aregenerally bias-corrected and then downscaled prior to useas hydrologic model forcings (Fowler et al., 2007).Climate projections for two meteorological stations
(shown in Figure 1) in the study area were generated
Copyright © 2013 John Wiley & Sons, Ltd.
using the following procedure: (1) GCMs and emissionpath scenarios were selected, (2) downscaled climateprojections at a 1/8� spatial grid scale were obtained fromthe World Climate Research Programme’s (WCRP’s)Coupled Model Intercomparison Project phase 3 (CMIP3)multi-model dataset, (3) projected scenarios at 1/8� gridswere further spatially downscaled to remove potentialbias between grid-based projections and meteorologicalstations within the study area and (4) projectedtemperature and precipitation values were temporallydownscaled from monthly to the daily time intervalsrequired by the SWAT model.The CMIP3 dataset (WCRP, 2012) incorporates 25
models and is the product of one of the largest and mostcomprehensive global coupled climate models and multi-model analyses efforts to date. An archive of bias-corrected and spatially downscaled climate projectionsderived from 16 CMIP3 GCMs and served at http://gdo-dcp.ucllnl.org/downscaled_cmip3_projections/, as de-scribed by Maurer et al. (2007) was utilized in this study.Information for each GCM is summarized in Appendix I(Table A2). Data were developed through a collaborativeeffort between the Lawrence Livermore National Labora-tory (LLNL), US Bureau of Reclamation (USBR), SantaClara University and Climate Central and will be referredto as the LLNL/USBR dataset hereafter. The LLNL/USBR dataset contains 112 climate projections andrepresents 16 GCMs developed by 14 modelling groupsfrom 10 countries. For each GCM, there are one or moreruns representing unique initial conditions for IPCCSRES A2, A1B and B1. Each climate projection wasbias-corrected and spatially downscaled using a two-stepprocedure applied to both monthly precipitation andsurface air temperature, and served at a 1/8� grid scale(Maurer et al., 2007).Further spatial and temporal downscaling was required to
implement the climate projections into the ECW SWATmodel. First, using a spatial downscaling technique, whichremoves the bias between LLNL/USBR climate projectionsat 1/8� grid and a meteorological station location within thegrid, it was ensured that projections of precipitation andtemperature were consistent with observations over the1950–2010 period, when data were available. Observationsof precipitation and temperature from meteorologicalstations in and around the study watersheds were comparedwith the LLNL/USBR data from the corresponding grid cellencompassing the station, and the bias between the two wasremoved through scaling (precipitation) and incrementing(temperature) on a monthly basis. The scaling factor (ci, j)for removing precipitation bias at climate station j wascomputed separately for the ith month of the year (i=1,2, . . ., 12) as follows: (1) compute observed monthlyprecipitation time-series values from historical dailyrecords, (2) select months corresponding to the ith month(e.g. there are 61 January months in the observed datasetover the 1950–2010 period) and (3) compute the scalingfactor as the ratio of the selected observed average monthlyprecipitation (P) over the corresponding projected values(P̂ ) for the LLNL/USBR grid:
Hydrol. Process. 28, 1962–1972 (2014)
1966 M. AHMADI, R. RECORDS AND M. ARABI
ci; j ¼XN
m¼1Pmi; j=
XN
m¼1P̂i; j
m (1)
where N is the number of observation years (here, N=61).This scaling factor was then applied to all future
months (k = 1, 2, . . ., 85) corresponding to the ith monthof the year over the 2015–2099 period from LLNL/USBRgrid:
P~k
i; j ¼ ci; j � P̂i; jk
(2)
where P~ represents the bias-corrected projected precipi-tation value for future month k.Similarly, a single increment (di, j) for temperature
corresponding to the ith month of the year at station j wasapplied to the projected future temperature values asfollows:
T~ki;j ¼ T^ i; j
k þ di; j;where di; j ¼XN
m¼1Tmi; j �
XN
m¼1T^ i; j
m(3)
where T~ denotes the bias-corrected future monthlytemperature for future month k (�C), T is the projectedvalues from LLNL/USBR dataset (�C) and T representsthe observed monthly temperature values over the Nobservation years.Following the bias-correction method, a dataset con-
sisting of average monthly values of precipitation (mm/day) and temperature (�C) at each meteorological stationover the 2015–2099 period was available. An existing re-sampling technique (Bureau of Reclamation, 2009;Maurer et al., 2007; Wood et al., 2002) was modifiedto temporally downscale bias-corrected monthly values ofprecipitation and temperature into daily values ofprecipitation, maximum temperature and minimumtemperature. This method creates daily values of climaticvariables that both preserve observed spatial and temporalcorrelations and aggregate to future monthly projections.The basic premise of this technique involves movingthrough a number of meteorological stations’ simulatedprojections (2015–2099) and associating a randomlyselected corresponding historical month with each monthsimulated in the future. The historical month’s daily seriesare then scaled (precipitation) and incremented(temperature) to create a future month’s daily series thatsatisfy the future monthly projection (Foy, 2010):
P̂j;k ¼P~kPl
� Pj;l (4)
where P^ j;k is the estimated future precipitation on day j offuture month k (mm), P~k is the bias-corrected averagedaily precipitation in future month k (mm/day) fromEquation (2), Pl is the observed average daily precipita-tion in resampled historical month l (mm/day) and Pj,l isthe observed precipitation on day j of resampled historicalmonth l (mm).A similar approach was taken for computing daily
temperature values from projected monthly temperaturevalues:
Copyright © 2013 John Wiley & Sons, Ltd.
T̂ j;k ¼ T~k �TlÞ þ Tj;l�
(5)
where T̂ j;k is the estimated future temperature on day j offuture month k (�C), T~k is the bias-corrected projectedaverage daily temperature in future month k (�C) fromEquation (3), Tl is the observed average daily temperaturein resampled historical month l (�C) and Tj,l is theobserved temperature on day j of resampled historicalmonth l (�C). Further information on the downscalingprocedure is detailed in Foy (2010).
Watershed modelling scenarios
The resulting bias-corrected, spatially and temporallydownscaled daily temperature and precipitation values foreach of the 112 climate projections were then used asforcings in the calibrated and tested ECW SWATmodel toassess impacts of climate change on annual climate,streamflow and water quality fluxes at the outlet of theHUC-12 051202011102 (outlet 20 in Figure 1). Changes inCO2 levels were not included in the modelling scenarios,mainly because SWAT uses a constant CO2 level for eachsubbasin for the entire simulation period. Each of the 112distinct SWAT simulations was run on a daily time-step toproduce average annual outputs for 85 years of simulation(2015–2099). For each of the 112 simulations, averageannual outputs were calculated for early-century, mid-century and late-century assessment periods (2015–2034,2045–2064 and 2080–2099). These 20-year averageannual values were then grouped by the three IPCC SRESGHG emission pathway scenarios (A2, A1B and B1), andemission pathway ensemble means, medians and quartilesof 20-year means were computed for the assessmentperiods. One-way analysis of variance (ANOVA) was usedto statistically test the significance of changes in hydrologicand diffuse pollutants fluxes amongst the assessmentperiods. Analysis of covariance was used to test thesignificance of differences between emission pathwayensembles in soluble nutrient responses to temperature.
RESULTS AND DISCUSSION
Results indicate clear warming trends over the course ofthe 21st century with less substantial increases inprecipitation for this Midwestern US study watershed.Streamflow, sediment and total nutrient loads did notdiffer between assessment periods. However, the propor-tion of dissolved to total nutrients increased, with nitrateand soluble phosphorus yields increasing significantlybetween early-century and late-century. With the excep-tion of total atrazine in the mid-century, yield of waterquality constituents was not significantly differentbetween emission pathway ensembles for a givenassessment period. Changes in diffuse pollutant fluxesshowed pronounced monthly variability, although differ-ent trends were evident for nutrients and pesticides.Increases in future loads of nitrogen and phosphorusoccurred primarily during winter and the growing season,whereas atrazine loads were predicted to increase insummer and fall but decrease in winter and spring.
Hydrol. Process. 28, 1962–1972 (2014)
Figure 2. Predicted precipitation and temperature in Eagle CreekWatershed for 112 distinct climate projections for B1, A1B and A2representing low, intermediate and high Intergovernmental Panel onClimate Change Special Report on Emissions Scenarios (IPCC SRES)greenhouse gas emission scenarios, respectively. The box and whiskerplots represent the minimum, maximum, upper and lower quartile, andmedian of period averaged annual values within each IPCC SRESemissions scenario. The dashed line represents the average annual
(baseline) value over the period 1986–2005
1967WATERSHED SCALE IMPACTS OF CLIMATE CHANGE ON WATER QUALITY
Model calibration and evaluation
Calibration of the SWAT model was performed fordaily streamflow at the ECW outlet (site 35, Figure 1) andmonthly nitrate and atrazine observations at two sites(sites 20 and 32, Figure 1) for the period 1995–2000,following an initial 2-year warm-up. The model was thenevaluated for daily streamflow and monthly nitrate andatrazine loads for the period 2001–2004. Error statisticsused for evaluating the performance validity of the modelincluded percent bias, coefficient of determination andNash–Sutcliffe efficiency coefficient. The Nash–Sutcliffeefficiency statistic is a normalized statistic that charac-terizes the fit of observed versus simulated data on a 1:1line. It ranges from �1 to 1.0, with 1.0 indicating aperfect fit. Table I summarizes the performance criteriafor streamflow, nitrate and atrazine loads over thecalibration and evaluation periods. In general, the modelyielded very good to satisfactory statistics for streamflowand nitrate in the calibration and evaluation periods, onthe basis of performance criteria outlined by Moriasi et al.(2007). It was also evident that the SWAT modeladequately represented atrazine fluxes in the watershed.The LOADEST regression model was used to estimatemonthly loads of nitrate and atrazine from instantaneousconcentration values. Although LOADEST was deemedsatisfactory in many studies, a few studies raised concernsabout the adequacy of model when residuals of regressionequations are heteroscedastic (Stenback et al., 2011).
Precipitation and temperature trends
Box plots in Figure 2 present the variability in projectedaverage annual precipitation and temperature values overthe three assessment periods summarized according to thecorresponding IPCC SRES ensemble. Substantial increasesin both minimum and maximum average annual tempera-tures under all emission pathway scenarios were evident.One-way ANOVA showed that mid-century and late-century temperature projections are significantly higherthan early-century projections (p< 0.001). Changes inprecipitation were generally less pronounced than thosefor temperature but indicated an overall modest increase inannual precipitation, consistent with predictions for otherwatersheds in the American Midwest (Jha, 2004; Van Liew
Table I. Calibration and evaluation performance criteria formonthly nitrate, monthly atrazine and daily streamflow
Gaugingstation Variable
Calibration period(1995–2000)
Evaluation period(2001–2004)
PBIAS(%) R2 NSE
PBIAS(%) R2 NSE
20 Nitrate 7.9 0.94 0.83 16.9 0.85 0.67Atrazine �6 0.81 0.34 �14 0.7 0.41
32 Nitrate �7.9 0.92 0.84 8.4 0.76 0.55Atrazine 42.3 0.75 0.52 33.1 0.51 0.14
35 Streamflow �12.2 0.78 0.61 4.3 0.78 0.56
PBIAS and NSE are percent bias between simulated and observed valuesand Nash–Sutcliffe Efficiency, respectively.
Copyright © 2013 John Wiley & Sons, Ltd.
et al., 2012; Woznicki and Nejadhashemi, 2012). Mediansof 20-year average precipitation for late-century emissionpathway ensembles increased above early-century projec-tions by 4%, 7% and 10% for B1, A1B and A2 scenarios,respectively. Larger ranges between lower and upperwhiskers in the late-century suggest the higher uncertaintyin prediction of climate conditions at the end of the century.One-way ANOVA of projected precipitation showed thatthe late-century predictions of precipitation are significantlyhigher than early-century predictions (p< 0.01). However,mid-century predictions did not show significant differencesfrom early-century and late-century predictions.
Stream discharge and sediment loads
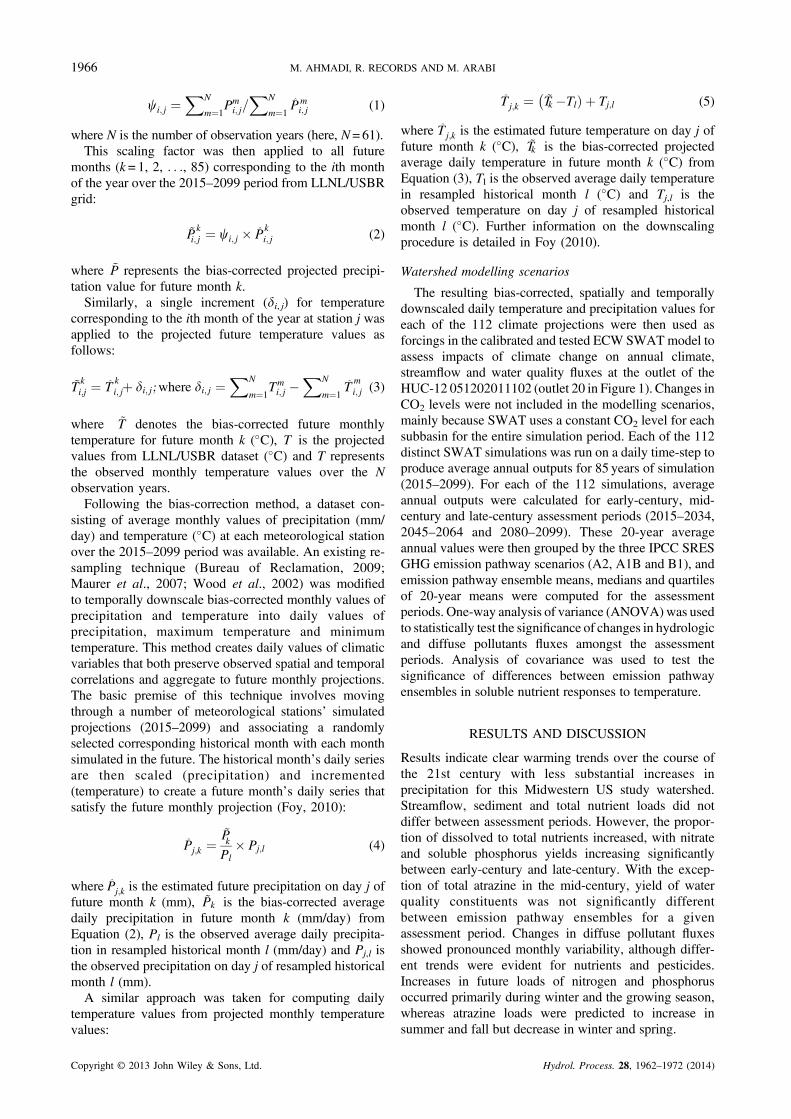
Although median annual streamflow and sedimentyields appeared to show small upward trends over time,changes over the next nine decades under any givenemission scenario were neither significant nor did theyvary significantly between emission pathway ensemblesfor a given assessment period (ANOVA, p> 0.05).Figure 3 shows predictions of stream discharge and
Figure 3. Predicted streamflow and sediment yield at hydrologic unit code051202011102 outlet in Eagle Creek Watershed for 112 distinct climateprojections for B1, A1B and A2 representing low, intermediate and highIntergovernmental Panel on Climate Change Special Report on EmissionsScenarios (IPCC SRES) greenhouse gas emission scenarios, respectively.The box and whisker plots represent the minimum, maximum, upper andlower quartile and median of period averaged annual values within eachIPCC SRES emissions scenario. The dashed line represents the average
annual (baseline) value over the period 1986–2005
Hydrol. Process. 28, 1962–1972 (2014)
1968 M. AHMADI, R. RECORDS AND M. ARABI
sediment yield at the HUC 051202011102 watershedoutlet. Increases in streamflow and/or sediment yieldsunder future climate have been predicted in severalMidwestern watersheds (Jha, 2004; Van Liew et al.,2012; Stone, 2003; Woznicki and Nejadhashemi, 2012),with the exception of a fewMidwestern basins where meanannual decreases in discharge are forecasted (Hay et al.,2011). However, significance of such changes hasgenerally not been evaluated, with some exceptions (Hayet al., 2011), limiting the applicability of comparison toresults of other regional assessments.
Nitrogen and phosphorus loads
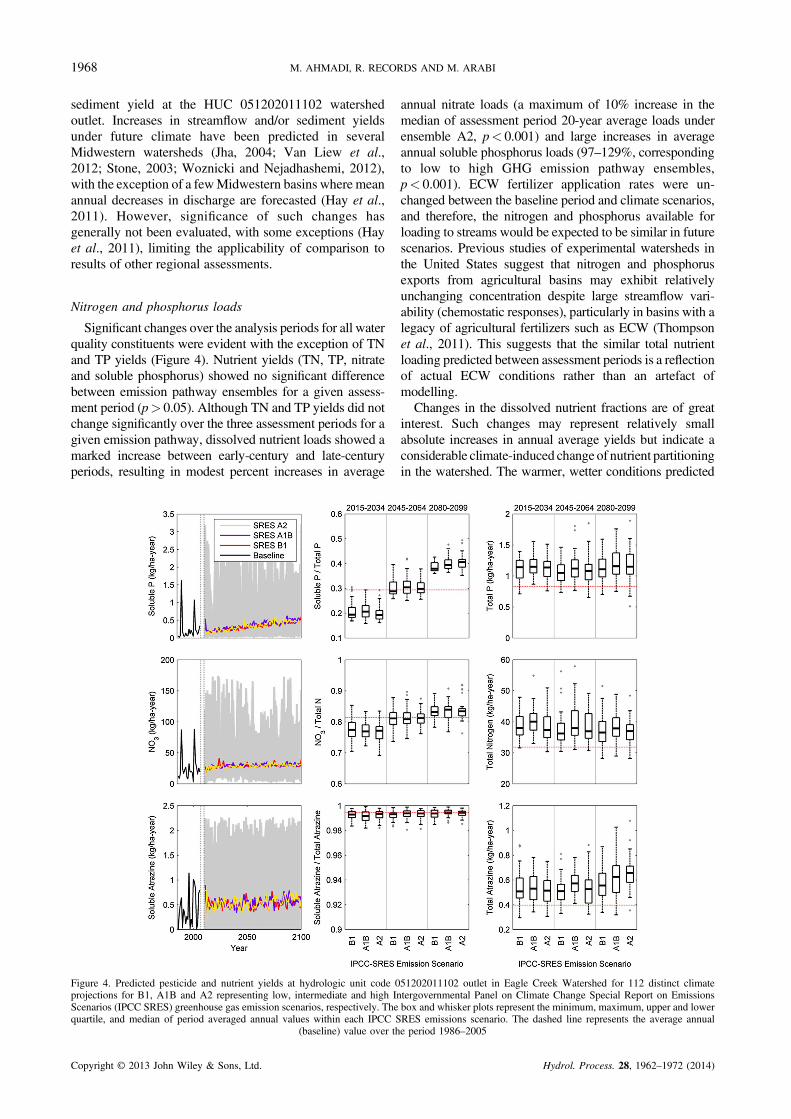
Significant changes over the analysis periods for all waterquality constituents were evident with the exception of TNand TP yields (Figure 4). Nutrient yields (TN, TP, nitrateand soluble phosphorus) showed no significant differencebetween emission pathway ensembles for a given assess-ment period (p> 0.05). Although TN and TP yields did notchange significantly over the three assessment periods for agiven emission pathway, dissolved nutrient loads showed amarked increase between early-century and late-centuryperiods, resulting in modest percent increases in average
Figure 4. Predicted pesticide and nutrient yields at hydrologic unit code 0projections for B1, A1B and A2 representing low, intermediate and high IScenarios (IPCC SRES) greenhouse gas emission scenarios, respectively. Thequartile, and median of period averaged annual values within each IPCC S
(baseline) value over th
Copyright © 2013 John Wiley & Sons, Ltd.
annual nitrate loads (a maximum of 10% increase in themedian of assessment period 20-year average loads underensemble A2, p< 0.001) and large increases in averageannual soluble phosphorus loads (97–129%, correspondingto low to high GHG emission pathway ensembles,p< 0.001). ECW fertilizer application rates were un-changed between the baseline period and climate scenarios,and therefore, the nitrogen and phosphorus available forloading to streams would be expected to be similar in futurescenarios. Previous studies of experimental watersheds inthe United States suggest that nitrogen and phosphorusexports from agricultural basins may exhibit relativelyunchanging concentration despite large streamflow vari-ability (chemostatic responses), particularly in basins with alegacy of agricultural fertilizers such as ECW (Thompsonet al., 2011). This suggests that the similar total nutrientloading predicted between assessment periods is a reflectionof actual ECW conditions rather than an artefact ofmodelling.Changes in the dissolved nutrient fractions are of great
interest. Such changes may represent relatively smallabsolute increases in annual average yields but indicate aconsiderable climate-induced change of nutrient partitioningin the watershed. The warmer, wetter conditions predicted
51202011102 outlet in Eagle Creek Watershed for 112 distinct climatentergovernmental Panel on Climate Change Special Report on Emissionsbox and whisker plots represent the minimum, maximum, upper and lowerRES emissions scenario. The dashed line represents the average annuale period 1986–2005
Hydrol. Process. 28, 1962–1972 (2014)
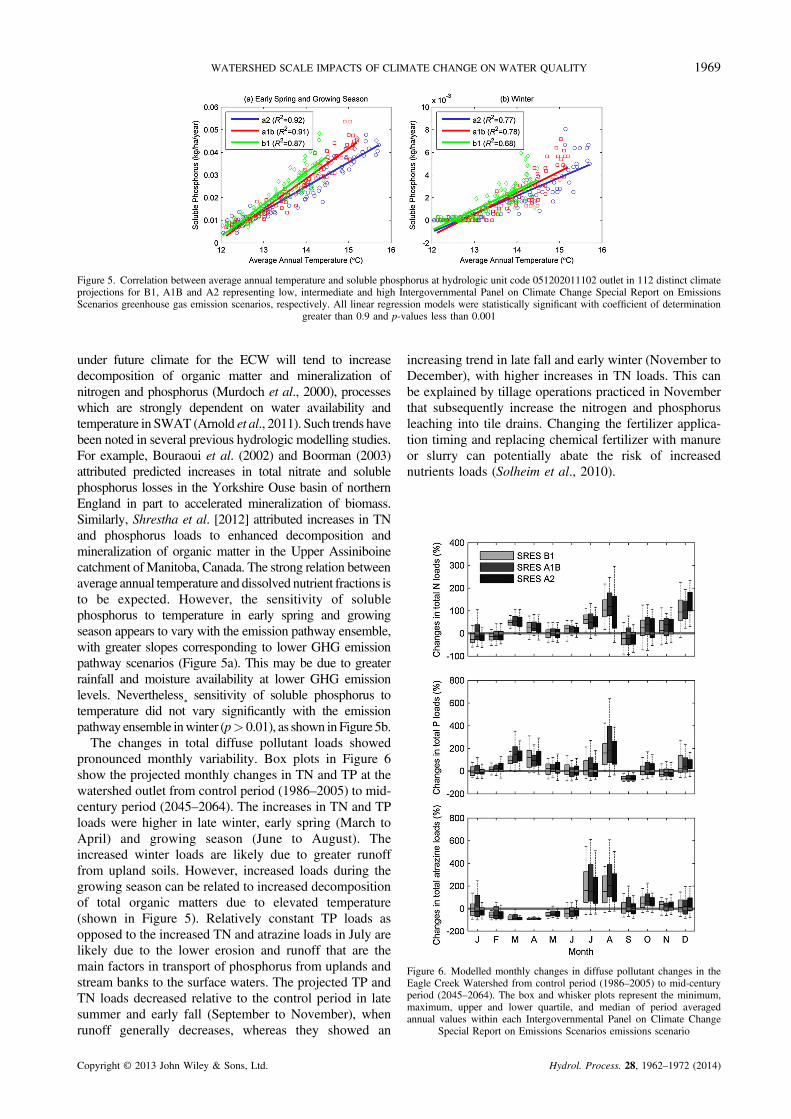
Figure 5. Correlation between average annual temperature and soluble phosphorus at hydrologic unit code 051202011102 outlet in 112 distinct climateprojections for B1, A1B and A2 representing low, intermediate and high Intergovernmental Panel on Climate Change Special Report on EmissionsScenarios greenhouse gas emission scenarios, respectively. All linear regression models were statistically significant with coefficient of determination
greater than 0.9 and p-values less than 0.001
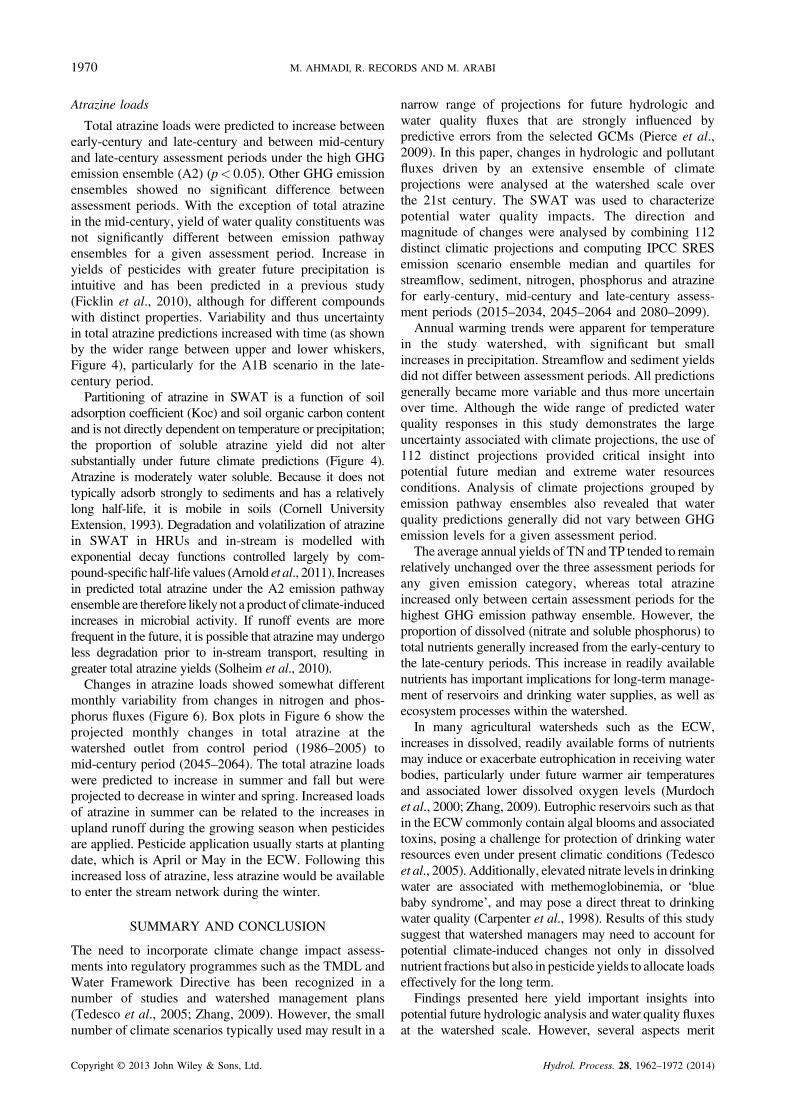
Figure 6. Modelled monthly changes in diffuse pollutant changes in theEagle Creek Watershed from control period (1986–2005) to mid-centuryperiod (2045–2064). The box and whisker plots represent the minimum,maximum, upper and lower quartile, and median of period averagedannual values within each Intergovernmental Panel on Climate Change
Special Report on Emissions Scenarios emissions scenario
1969WATERSHED SCALE IMPACTS OF CLIMATE CHANGE ON WATER QUALITY
under future climate for the ECW will tend to increasedecomposition of organic matter and mineralization ofnitrogen and phosphorus (Murdoch et al., 2000), processeswhich are strongly dependent on water availability andtemperature in SWAT (Arnold et al., 2011). Such trends havebeen noted in several previous hydrologic modelling studies.For example, Bouraoui et al. (2002) and Boorman (2003)attributed predicted increases in total nitrate and solublephosphorus losses in the Yorkshire Ouse basin of northernEngland in part to accelerated mineralization of biomass.Similarly, Shrestha et al. [2012] attributed increases in TNand phosphorus loads to enhanced decomposition andmineralization of organic matter in the Upper Assiniboinecatchment ofManitoba, Canada. The strong relation betweenaverage annual temperature and dissolved nutrient fractions isto be expected. However, the sensitivity of solublephosphorus to temperature in early spring and growingseason appears to vary with the emission pathway ensemble,with greater slopes corresponding to lower GHG emissionpathway scenarios (Figure 5a). This may be due to greaterrainfall and moisture availability at lower GHG emissionlevels. Nevertheless¸ sensitivity of soluble phosphorus totemperature did not vary significantly with the emissionpathway ensemble inwinter (p> 0.01), as shown inFigure 5b.The changes in total diffuse pollutant loads showed
pronounced monthly variability. Box plots in Figure 6show the projected monthly changes in TN and TP at thewatershed outlet from control period (1986–2005) to mid-century period (2045–2064). The increases in TN and TPloads were higher in late winter, early spring (March toApril) and growing season (June to August). Theincreased winter loads are likely due to greater runofffrom upland soils. However, increased loads during thegrowing season can be related to increased decompositionof total organic matters due to elevated temperature(shown in Figure 5). Relatively constant TP loads asopposed to the increased TN and atrazine loads in July arelikely due to the lower erosion and runoff that are themain factors in transport of phosphorus from uplands andstream banks to the surface waters. The projected TP andTN loads decreased relative to the control period in latesummer and early fall (September to November), whenrunoff generally decreases, whereas they showed an
Copyright © 2013 John Wiley & Sons, Ltd.
increasing trend in late fall and early winter (November toDecember), with higher increases in TN loads. This canbe explained by tillage operations practiced in Novemberthat subsequently increase the nitrogen and phosphorusleaching into tile drains. Changing the fertilizer applica-tion timing and replacing chemical fertilizer with manureor slurry can potentially abate the risk of increasednutrients loads (Solheim et al., 2010).
Hydrol. Process. 28, 1962–1972 (2014)
1970 M. AHMADI, R. RECORDS AND M. ARABI
Atrazine loads
Total atrazine loads were predicted to increase betweenearly-century and late-century and between mid-centuryand late-century assessment periods under the high GHGemission ensemble (A2) (p< 0.05). Other GHG emissionensembles showed no significant difference betweenassessment periods. With the exception of total atrazinein the mid-century, yield of water quality constituents wasnot significantly different between emission pathwayensembles for a given assessment period. Increase inyields of pesticides with greater future precipitation isintuitive and has been predicted in a previous study(Ficklin et al., 2010), although for different compoundswith distinct properties. Variability and thus uncertaintyin total atrazine predictions increased with time (as shownby the wider range between upper and lower whiskers,Figure 4), particularly for the A1B scenario in the late-century period.Partitioning of atrazine in SWAT is a function of soil
adsorption coefficient (Koc) and soil organic carbon contentand is not directly dependent on temperature or precipitation;the proportion of soluble atrazine yield did not altersubstantially under future climate predictions (Figure 4).Atrazine is moderately water soluble. Because it does nottypically adsorb strongly to sediments and has a relativelylong half-life, it is mobile in soils (Cornell UniversityExtension, 1993). Degradation and volatilization of atrazinein SWAT in HRUs and in-stream is modelled withexponential decay functions controlled largely by com-pound-specific half-life values (Arnold et al., 2011). Increasesin predicted total atrazine under the A2 emission pathwayensemble are therefore likely not a product of climate-inducedincreases in microbial activity. If runoff events are morefrequent in the future, it is possible that atrazine may undergoless degradation prior to in-stream transport, resulting ingreater total atrazine yields (Solheim et al., 2010).Changes in atrazine loads showed somewhat different
monthly variability from changes in nitrogen and phos-phorus fluxes (Figure 6). Box plots in Figure 6 show theprojected monthly changes in total atrazine at thewatershed outlet from control period (1986–2005) tomid-century period (2045–2064). The total atrazine loadswere predicted to increase in summer and fall but wereprojected to decrease in winter and spring. Increased loadsof atrazine in summer can be related to the increases inupland runoff during the growing season when pesticidesare applied. Pesticide application usually starts at plantingdate, which is April or May in the ECW. Following thisincreased loss of atrazine, less atrazine would be availableto enter the stream network during the winter.
SUMMARY AND CONCLUSION
The need to incorporate climate change impact assess-ments into regulatory programmes such as the TMDL andWater Framework Directive has been recognized in anumber of studies and watershed management plans(Tedesco et al., 2005; Zhang, 2009). However, the smallnumber of climate scenarios typically used may result in a
Copyright © 2013 John Wiley & Sons, Ltd.
narrow range of projections for future hydrologic andwater quality fluxes that are strongly influenced bypredictive errors from the selected GCMs (Pierce et al.,2009). In this paper, changes in hydrologic and pollutantfluxes driven by an extensive ensemble of climateprojections were analysed at the watershed scale overthe 21st century. The SWAT was used to characterizepotential water quality impacts. The direction andmagnitude of changes were analysed by combining 112distinct climatic projections and computing IPCC SRESemission scenario ensemble median and quartiles forstreamflow, sediment, nitrogen, phosphorus and atrazinefor early-century, mid-century and late-century assess-ment periods (2015–2034, 2045–2064 and 2080–2099).Annual warming trends were apparent for temperature
in the study watershed, with significant but smallincreases in precipitation. Streamflow and sediment yieldsdid not differ between assessment periods. All predictionsgenerally became more variable and thus more uncertainover time. Although the wide range of predicted waterquality responses in this study demonstrates the largeuncertainty associated with climate projections, the use of112 distinct projections provided critical insight intopotential future median and extreme water resourcesconditions. Analysis of climate projections grouped byemission pathway ensembles also revealed that waterquality predictions generally did not vary between GHGemission levels for a given assessment period.The average annual yields of TN and TP tended to remain
relatively unchanged over the three assessment periods forany given emission category, whereas total atrazineincreased only between certain assessment periods for thehighest GHG emission pathway ensemble. However, theproportion of dissolved (nitrate and soluble phosphorus) tototal nutrients generally increased from the early-century tothe late-century periods. This increase in readily availablenutrients has important implications for long-term manage-ment of reservoirs and drinking water supplies, as well asecosystem processes within the watershed.In many agricultural watersheds such as the ECW,
increases in dissolved, readily available forms of nutrientsmay induce or exacerbate eutrophication in receiving waterbodies, particularly under future warmer air temperaturesand associated lower dissolved oxygen levels (Murdochet al., 2000; Zhang, 2009). Eutrophic reservoirs such as thatin the ECW commonly contain algal blooms and associatedtoxins, posing a challenge for protection of drinking waterresources even under present climatic conditions (Tedescoet al., 2005). Additionally, elevated nitrate levels in drinkingwater are associated with methemoglobinemia, or ‘bluebaby syndrome’, and may pose a direct threat to drinkingwater quality (Carpenter et al., 1998). Results of this studysuggest that watershed managers may need to account forpotential climate-induced changes not only in dissolvednutrient fractions but also in pesticide yields to allocate loadseffectively for the long term.Findings presented here yield important insights into
potential future hydrologic analysis and water quality fluxesat the watershed scale. However, several aspects merit
Hydrol. Process. 28, 1962–1972 (2014)
1971WATERSHED SCALE IMPACTS OF CLIMATE CHANGE ON WATER QUALITY
further investigation. By holding management and land useconstant throughout climate scenario assessment, we haveinvestigated the potential mean annual hydroclimatic anddiffuse pollutant impacts andmonthly nutrient and pesticideeffects of climatic change under baseline conditions.However, earlier snowmelt, warmer air temperatures and alonger growing season predicted formuch of NorthAmericaand urbanization have the potential to substantially alter landuse and management from historical patterns. Such changesmay affect future diffuse pollutant fluxes, mitigating orexacerbating impacts of climate change on water quality(Praskievicz and Chang, 2009). Investigation of theinteractions of climate, land use and management may alsoyield insight into how effectiveness of soil and waterconservation practices targeted at water quality improve-ments may change or be optimized under future climate(Nicklow et al., 2010; Woznicki and Nejadhashemi, 2012).Additionally, GCM-based projections and hydrologicmodels utilizing GCM inputs represent a range ofuncertainty in future hydroclimatic conditions, but changesbeyond this range are possible (Brown and Wilby, 2012).Model performance criteria indicate that the hydrologicmodel adequately represents hydrologic and diffuse pollu-tant dynamics within the watershed (Table I). However, useof the SWAT model to climate impact assessments in thefuture may be strengthened by improvements to land unitconnectivity, stream channel erosion and sediment depos-ition processes, event-based flood and sediment routing, andsimulating deep aquifer contribution on baseflow. Finally,assessment of potential future hydroclimatic changes on amonthly basis would enhance understanding of seasonalchanges in snowfall, peak and low flows. Such assessmentsmay provide valuable insight into potential changes toseasonal water availability and alterations in low flow andcritical conditions used in programmes such as TMDL.
ACKNOWLEDGEMENTS
This studywas funded by theUSDepartment of Agriculture–National Institute of Food and Agriculture grants 2007-51130-03876 and 2009-51130-06038. We acknowledge themodelling groups, the Program for Climate Model Diagnosisand Intercomparison (PCMDI) and the WCRP’s WorkingGroup on Coupled Modelling (WGCM) for their roles inmaking available the WCRP CMIP3 multi-model dataset.Support of this dataset is provided by the Office of Science,US Department of Energy.
REFERENCES
Abbaspour KC, Faramarzi M, Ghasemi SS, Yang H. 2009. Assessing theimpact of climate change on water resources in Iran. Water ResourcesResearch 45(10): doi:10.1029/2008WR007615
Arnold JG, Srinivasan R, Muttiah RS, Williams JR. 1998. Large areahydrologic modeling and assessment part i: model development.Journal of the American Water Resources Association 34(1): 73–89.DOI:10.1111/j.1752-1688.1998.tb05961.x
Arnold GJ, Kiniry JR, Srinivasan R, Williams JR, Haney EB, Neitsch SL.2011. Soil and Water Assessment Tool Input/Output File Documenta-tion, Version 2009, Report No. 365, College Station, Texas.
Baron JS, Schmidt TM, Hartman MD. 2009. Climate-induced changes inhigh elevation stream nitrate dynamics. Global Change Biology 15(7):1777–1789. DOI:10.1111/j.1365-2486.2009.01847.x
Copyright © 2013 John Wiley & Sons, Ltd.
Bloomfield JP, Williams RJ, Gooddy DC, Cape JN, Guha P. 2006.Impacts of climate change on the fate and behaviour of pesticides insurface and groundwater--A UK perspective. The Science of the TotalEnvironment 369(1–3): 163–77. DOI:10.1016/j.scitotenv.2006.05.019
Boorman D. 2003. Climate, Hydrochemistry and Economics of Surface-water Systems (CHESS): adding a European dimension to thecatchment modelling experience developed under LOIS. The Scienceof the Total Environment 314–316: 411–437. DOI:10.1016/S0048-9697(03)00066-4
Bouraoui F, Galbiati L, Bidoglio G. 2002. Climate change impacts onnutrient loads in the Yorkshire Ouse catchment (UK). Hydrology andEarth System Sciences 6(2): 197–209. DOI:10.5194/hess-6-197-2002
Brown LC, Barnwell TO. 1987. The enhanced water quality modelsQUAL2E and QUAL2E-UNCAS documentation and user manual.Technical Report. EPA document EPA/600/3-87/007, Athens, Georgia.
Brown C, Wilby RL. 2012. An alternate approach to assessing climaterisks. Eos, Transactions American Geophysical Union 93(41): 401.DOI:10.1029/2012EO410001
Bureau of Reclamation. 2009. Long-Term Planning Hydrology based onVarious Blends of Instrumental Records, Paleoclimate, and ProjectedClimate Information.
Carpenter SR, Caraco NF, Correll DL, Howarth RW, Sharpley AN, SmithVH. 1998. Nonpoint pollution of surface waters with phosphorus andnitrogen. Ecological Applications 8(3): 559–568.
Chaplot V. 2007. Water and soil resources response to rising levels ofatmospheric CO2 concentration and to changes in precipitation and airtemperature. Journal of Hydrology 337(1–2): 159–171. DOI:10.1016/j.jhydrol.2007.01.026
Cornell University Extension. 1993. Toxicology Network PesticideInformation Profile: Atrazine, http://pmep.cce.cornell.edu/profiles/extoxnet/24d-captan/atrazine-ext.html
Ficklin DL, Luo Y , Luedeling E, Gatzke SE, Zhang M. 2010. Sensitivityof agricultural runoff loads to rising levels of CO2 and climate changein the San Joaquin Valley watershed of California. EnvironmentalPollution (Barking, Essex: 1987) 158(1): 223–34. DOI:10.1016/j.envpol.2009.07.016
Fowler HJ, Blenkinsop S, Tebaldi C. 2007. Linking climate changemodelling to impacts studies: recent advances in downscalingtechniques for hydrological modelling. International Journal ofClimatology 27(12): 1547–1578. DOI:10.1002/joc.1556
Foy CR. 2010. Impacts of Climate Change on the Hydrologic Response ofHeadwater Basins in Colorado, MSc Thesis, Colorado State University.
Garbrecht JD, Steiner JL, Cox CA. 2007. Climate Change Impacts on Soiland Water Conservation. Eos, Transactions American GeophysicalUnion 88(11): 136. DOI:10.1029/2007EO110016.
Gassman PW, Reyes MR, Green CH, Arnold JG. 2007. The Soil and WaterAssessment Tool: Historical development applications, and future researchdirections. Transactions of the American Society of Agricultural andBiological Engineers 50: 1211–1240. DOI:10.1.1.88.6554
Haggard BE, Sharpley AN, Massey LB, Hardiman N, Teague K. 2010.HUC 12 Watershed Prioritization Along a Water Quality and Land Usegradient: Upper Illinois River Watershed Management Plan, in 2010Land Grant and Sea Grant National Water Conference.
Hanratty MP, Stefan HG. 1998. Simulating Climate Change Effects in aMinnesota Agricultural Watershed. Journal of Environment Quality27(6): 1524. DOI:10.2134/jeq1998.00472425002700060032x
Harman CJ, Rao PSC, Basu NB, McGrath GS, Kumar P, M Sivapalan.2011. Climate, soil, and vegetation controls on the temporal variabilityof vadose zone transport. Water Resources Research 47(1). DOI:10.1029/2010WR010194
Hay LE, McCabe GJ, Clark MP, Risley JC. 2009. Reducing StreamflowForecast Uncertainty: Application and Qualitative Assessment of theUpper Klamath River Basin, Oregon. JAWRA Journal of the AmericanWater Resources Association 45(3): 580–596. DOI:10.1111/j.1752-1688.2009.00307.x
Hay LE, Markstrom SL, Ward-Garrison C. 2011. Watershed-ScaleResponse to Climate Change through the Twenty-First Century forSelected Basins across the United States. Earth Interactions 15(17):1–37. DOI:10.1175/2010EI370.1
IPCC. 2007. Climate Change 2007: Synthesis Report, Geneva, Switzerland.Jennings E, Allott N , Pierson DC, Schneiderman EM, Lenihan D,
Samuelsson P, Taylor D. 2009. Impacts of climate change onphosphorus loading from a grassland catchment: implications for futuremanagement Water Research 43(17): 4316–26. DOI:10.1016/j.watres.2009.06.032
Jeppesen E, et al. 2009. Climate change effects on runoff, catchment phosphorusloading and lake ecological state, and potential adaptations. Journal ofEnvironmental Quality 38(5): 1930–41. DOI:10.2134/jeq2008.0113
Hydrol. Process. 28, 1962–1972 (2014)
1972 M. AHMADI, R. RECORDS AND M. ARABI
Jha M. 2004. Impacts of climate change on streamflow in the UpperMississippi River Basin: A regional climate model perspective. Journalof Geophysical Research 109(D9): 1–12. DOI:10.1029/2003JD003686
Kaika M. 2003. The water framework directive: A new directive for achanging social, political and economic European framework.Geography 11(3): 299–316. DOI:10.1080/0965431032000070802
Krysanova V, Hattermann F, Wechsung F. 2005. Development of theecohydrological model SWIM for regional impact studies andvulnerability assessment. Hydrological Processes 19(3): 763–783.DOI:10.1002/hyp.5619
Leonard R, Knisel W, Still D. 1987. GLEAMS: Groundwater loadingeffects on agricultural management systems. Transactions of ASAE30(5): 1403–1418.
Lettenmaier DP, Wood AW, Palmer RN, Wood EF, Stakhiv EZ. 1999. Waterresources implications of global warming: A US regional perspective.Climatic Change 43(3): 537–579. DOI:10.1023/A:1005448007910
Marshall E, Randhir T. 2008. Effect of climate change on watershedsystem: a regional analysis. Climatic Change 89: 263–280.
Maurer EP, Brekke L, Pruitt T, Duffy PB. 2007. Fine-Resolution ClimateProjections Enhance Regional Climate Change Impact Studies. Eos,Transactions American Geophysical Union 88(47): 504. DOI:10.1029/2007EO470006
Moriasi DN, Arnold JG, Van Liew MW, Bingner RL, Harmel RD, Veith TL.2007. Model evaluation guidelines for systematic quantification of accuracyin watershed simulations. Transactions of the ASABE 50(3): 885–900.
Murdoch PS, Baron JS, Miller TL. 2000. Potential Effects of ClimateChange on Surface-Water Quality in North America. Journal of theAmerican Water Resources Association 36(2): 347–366. DOI:10.1111/j.1752-1688.2000.tb04273.x
Nicklow JW, et al. 2010. State of the art for genetic algorithms andbeyond in water resources planning and management. Journal of WaterResources Planning and Management 136(4): 412. DOI:10.1061/(ASCE)WR.1943-5452.0000053
Novotny V. 2003. Water quality: Diffuse pollution and watershedmanagement, 2nd edn, John Wiley: Hoboken, New Jersey.
NRC. 2001. Assessing the TMDL Approach to Water QualityManagement, The National Academies Press: Washington, DC.
Park JY, Park MJ, Ahn SR, Park GA, Yi JE, Kim GS, Srinivasan R, KimSJ. 2011. Assessment of future climate change impacts on waterquantity and quality for a mountainous dam watershed using SWAT.Transactions Of The ASABE 54(2004): 1725–1737
Pierce DW, Barnett TP, Santer BD, Gleckler PJ. 2009. Selecting globalclimate models for regional climate change studies. Proceedings of theNational Academy of Sciences of the United States of America 106(21):8441–6, doi:10.1073/pnas.0900094106
Praskievicz S, Chang H. 2009. A review of hydrological modelling ofbasin-scale climate change and urban development impacts. Progress inPhysical Geography 33(5): 650–671. DOI:10.1177/0309133309348098
Runkel BRL, Crawford CG, Cohn TA. 2004. Load Estimator ( LOADEST ):A FORTRAN program for estimating constituent loads in streams andrivers. Techniques and Methods Book 4 , Chapter A5., Reston, Virginia.
Sharpley AN, Williams JR. 1990. EPIC- Erosion Productivity ImpactCalculator: 1. Model Documentation, Agricultural Research Service.
Shrestha RR, Dibike YB, Prowse TD. 2012. Modeling climate changeimpacts on hydrology and nutrient loading in the upper assiniboine
Copyright © 2013 John Wiley & Sons, Ltd.
catchment1. Journal of the American Water Resources Association48(1): 74–89. DOI:10.1111/j.1752-1688.2011.00592.x
Solheim AL, Austnes K, Eriksen TE, Seifert I, Holen S. 2010. Climatechange impacts on water quality and biodiversity: Background Reportfor EEA European Environment State and Outlook Report 2010,Prague, Czech Republic.
Stenback GA, Crumpton WG, Schilling KE, Helmers MJ. 2011. Ratingcurve estimation of nutrient loads in Iowa rivers. Journal of Hydrology396(1–2): 158–169. DOI:10.1016/j.jhydrol.2010.11.006
Stone MC. 2003. Water yield responses to high and low spatial resolutionclimate change scenarios in theMissouri River Basin.Geophysical ResearchLetters 30(4): 1186. DOI:10.1029/2002GL016122.1/22/2013
SWCS. 2003. Conservation Implications of Climate Change: Soil Erosionand Runoff from Cropland, Ankeny, Iowa.
Tedesco LP, Shrake LK, Casey LR, Hall BE, Vidon PGF, Hernly FV,Barr RC, Ulmer J, Pascual DL. 2005. Eagle Creek Watershed AllianceAn Integrated Approach to Improved Water Quality. Eagle CreekWatershed Alliance, CEES Publication 2005–07, IUPUI: Indianapolis, IN.
Thompson SE, Basu NB, Lascurain J, Aubeneau A, Rao PSC. 2011.Relative dominance of hydrologic versus biogeochemical factors onsolute export across impact gradients. Water Resources Research 47.DOI:10.1029/2010WR009605
USDA NASS. 2003. USDA-National Agricultural Statistics Service,Cropland Data Layer, URL: http://nassgeodata.gmu.edu/CropScape.,Date Accessed: September 2010.
USDA NRCS. 2010, Soil Data Mart, URL: http://soildatamart.nrcs.usda.gov, Date Accessed: September 2010.
USGS NED. 2010, 1 arc Second Digital Elevation Model, URL: http://seamless.usgs.gov, Date Accessed: September 2010.
USGS NLCD. 1992, 1992 Land Cover Data, URL: http://seamless.usgs.gov, Date Accessed: September 2010.
USGS NLCD. 2001, 2001 Land Cover Data, URL: http://seamless.usgs.gov, Date Accessed: September 2010.
Van Liew MW, Feng S, Pathak TB. 2012. Climate change impacts onstreamflow, water quality, and best management practices for the Shelland Logan Creek Watersheds in Nebraska, USA. International Journalof Agricultural and Biological Engineering 5(1). DOI:10.3965/j.ijabe.20120501.003
WCRP. 2012. Bias Corrected and Downscaled WCRP CMIP3 ClimateProjections, Bureau of Reclamation, USA.
Wood AW, Maurer EP, Kumar A, Lettenmaier DP. 2002. Long-rangeexperimental hydrologic forecasting for the eastern United States. Journalof Geophysical Research 107(D20): 4429. DOI:10.1029/2001JD000659
Wood AW, Leung LR, Sridhar V, Lettenmaier DP. 2004. HydrologicImplications of Dynamical and Statistical Approaches to DownscalingClimate Model Outputs. Climatic Change 62(1–3), 189–216.DOI:10.1023/B:CLIM.0000013685.99609.9e
Woznicki SA, Nejadhashemi AP. 2012. Sensitivity Analysis of BestManagement Practices Under Climate Change Scenarios1. JAWRAJournal of the American Water Resources Association 48(1): 90–112.DOI:10.1111/j.1752-1688.2011.00598.x
Zhang HX. 2009. TMDL in the Context of Climate Change: Adapting CriticalCondition and Uncertainty Analysis in Support of TMDL Development andImplementation, inProceedings of theWater Environment Federation, TMDL2009, pp. 148–167, Water Environment Federation.
Hydrol. Process. 28, 1962–1972 (2014)