impact of chlorine and wastewater contact time, chlorine residual...
TRANSCRIPT

i
Impact of Chlorine and Wastewater Contact Time,
Chlorine Residual and Mixing on Microorganism
inactivation
AHUIWI EMMANUEL NETSHIDAULU
Degree of Master of Science in Civil Engineering (Water) By
Research Report and Coursework
Research report submitted to the Faculty of Engineering and Built Environment,
University of the Witwatersrand, Johannesburg, in fulfilment of the requirements
for the degree of Master of Science in Civil Engineering (Water)
Johannesburg, 2015
ii
DECLARATION
I declare that this research report is my own work. It is being submitted for the degree of Master
of Science in Engineering at the University of Witwatersrand, Johannesburg. It has not been
submitted before for any degree or examination at any other University.
----------------------------------------------
(Signature of candidate)
--------------------- day of -----------------------2015

iii
DEDICATION
For my daughter Nkateko and my Son Tshifhumulo
iv
ABSTRACT
This study investigates the effectiveness of chlorine as the disinfectant employed in the wastewater
treatment plants operated by Lepelle Northern Water and generally within most municipal wastewater
treatment works. The literature review reveals that much of the chlorine demand is ultimately wasted,
since reactions competing with the disinfection process results in the formation of chloramines and other
by-products not related to chlorine’s primary purpose of inactivating micro-organisms in the water. The
investigation focused on the following aspects:
The impact of chlorine and wastewater contact time and chlorine residual concentration on micro-
organism inactivation while reducing chlorine dose and aiming not to meet chlorine demand.
The impact of mixing on the effective disinfection of effluent at the point of chlorination.
Literature shows that although various alternatives to chlorine are available, chlorine remains user-
friendly and the cost-effective option for the disinfection of wastewater.
The formation of chlorine residual in sewage effluent for inactivation of bacteria and prevention of
regrowth is not as necessary as it is in drinking water systems where the chlorine residual has to be
maintained throughout the distribution system. It is therefore a wasteful exercise to satisfy the chlorine
demand in wastewater (sewage) effluent discharged into water courses. It is also worth noting that the
only purpose of chlorine in wastewater effluent disinfection is to inactivate microorganisms. There is no
need to prevent the recontamination of water since the effluent in most municipal sewage treatment
plants are immediately discharged into a water course and the chlorine residual in the effluent must not
be detected since it is toxic to aquatic life. This study therefore examines the potential disinfection
effectiveness of chlorine without meeting chlorine demand or reaching breakpoint chlorination and
mixing at the point of chlorination.
The results obtained from a full-scale wastewater treatment plant effluent quality monitoring programme
were used as baseline information and reference for this study.
By comparing the observed micro-organism (that is; E. coli) inactivation in the full-scale chlorine
systems with E. coli inactivation determined under laboratory conditions, it is conclusive in the literature
v
that chlorination in practice appears to be much less effective than could be expected under laboratory
conditions. In the literature, one study shows that suboptimal hydraulics of full-scale systems are known
to reduce the efficacy of inactivation in practice. However, this study indicates that when mixing is
applied at the point of chlorination, significant and comparable inactivation can be achieved at a full-
scale and at a laboratory scale. This was confirmed in another study which reported rapid initial E. coli
inactivation upon contact with free chlorine. Therefore, when a specific optimal mixing regime is
determined and applied at the point of chlorination, effective E. coli inactivation in the water is achieved
irrespective of the kinetics applicable either at a laboratory scale or in a full-scale system.
This study examines the potential disinfection effectiveness of chlorine without meeting chlorine
demand or reaching breakpoint chlorination and mixing at the point of chlorination. The results obtained
shows that E. coli inactivation occur at two rates, an initial rapid kill followed by a slower kill. For each
applied chlorine dose, the highest inactivation rate was obtained during the first one minute of contact
time, which could be due to the presence of free chlorine residual that had not yet reacted with chlorine
demanding substances (organics and chemicals). The subsequent slower kill can possibly be attributed
to the formation of less potent combined chlorine residual as a result of reactions between free chlorine
residual and chlorine demanding substances (mainly NH3).
This study revealed that rapid mixing of chlorine with wastewater may achieve the required degree of
disinfection by using less chlorine, and this will result in significant savings in chlorine dosing. This
proposition was confirmed in this study by tests conducted in a full-scale investigation, where the
chlorine dosage required to inactivate E. coli at the Burgersfort WWTW effluent was reduced by 50%
from the mode of 6.43 mg/l before mixing to the mode of 3.0 mg/l after mixing.
For effective chlorination, a disinfection system must be designed within wastewater treatment works
for the wastewater to flow turbulently throughout a chlorine contact chamber and/or dosing point in
order to achieve complete mixing within 1 minute of contact time. The mixing allows the maximum
dispersal of the free chlorine in the wastewater and contact between chlorine and the microorganisms in
the effluent. This ensures effective inactivation before the free chlorine reacts with other impurities
present in wastewater that demand chlorine.

vi
ACKNOWLEDGEMENTS
I would like to express my deep gratitude to my supervisor, Prof. A.A Ilemobade for his guidance,
supervision, commitment, encouragement and his input over the course of this research. Thank
you for the opportunities you gave me to progress in my academic studies.
My heartfelt thanks to Lepelle Northern Water for allowing me to conduct this study using the
company resources.
I am also grateful to my family, friends and colleagues for their encouragement, understanding
and support through this journey.
Most of all, I give glory to my Lord and Saviour Jesus Christ for abundant Grace.
vii
TABLE OF CONTENTS
DECLARATION........................................................................................................................................ II
DEDICATION.......................................................................................................................................... III
ABSTRACT ............................................................................................................................................... IV
ACKNOWLEDGEMENTS ..................................................................................................................... VI
TABLE OF CONTENTS ....................................................................................................................... VII
LIST OF FIGURES ................................................................................................................................... X
LIST OF TABLES .................................................................................................................................... XI
LIST OF EQUATIONS .......................................................................................................................... XII
LIST OF SYMBOLS AND ABBREVIATIONS ................................................................................. XIV
DEFINITION OF CONCEPTS ............................................................................................................. XV
CHAPTER 1 ................................................................................................................................................ 1
1 INTRODUCTION AND BACKGROUND OF THE STUDY ........................................................ 1
1.1 INTRODUCTION ............................................................................................................................ 1
1.2 SUMMARY OF THE PROBLEM ...................................................................................................... 6
1.3 RESEARCH AIM AND OBJECTIVES .............................................................................................. 6
1.4 SUMMARY OF RESEARCH METHODS AND MATERIALS ............................................................. 7
1.5 DELINEATION AND LIMITATIONS OF THE STUDY ...................................................................... 9
1.6 LAYOUT OF THE STUDY ............................................................................................................. 10
CHAPTER 2 .............................................................................................................................................. 12
2 LITERATURE REVIEW................................................................................................................. 12
2.1 INTRODUCTION .......................................................................................................................... 12
2.2 WASTEWATER EFFLUENT REGULATORY FRAMEWORK ........................................................ 14
2.3 OVERVIEW OF WASTE WATER TREATMENT OPERATION AND PERFORMANCE IN SOUTH
AFRICA ................................................................................................................................................... 17
2.3.1 Wastewater Management Overview ................................................................................... 17
2.3.2 Effluent Quality Compliance .............................................................................................. 19

viii
2.4 CHLORINE DISINFECTION ......................................................................................................... 21
2.4.1 Disinfection Methods (EPA Victoria, 2009) ....................................................................... 22
2.4.2 Disinfection methods comparison ....................................................................................... 26
2.5 FACTORS THAT INFLUENCE THE ACTION OF DISINFECTANTS ................................................ 28
2.6 THEORY OF DISINFECTION ....................................................................................................... 32
2.6.1 Disinfection with Chlorine (Free and Combined) ............................................................... 32
2.6.2 Kinetics of Chlorine reaction .............................................................................................. 35
2.6.3 Mechanism of Disinfection ................................................................................................. 39
2.7 TURBULENCE/MIXING FACTOR ................................................................................................. 40
2.8 COST ASSESSMENT OF DISINFECTION ...................................................................................... 42
CHAPTER 3 .............................................................................................................................................. 45
3 MATERIAL AND METHODOLOGY ........................................................................................... 45
3.1 INTRODUCTION .......................................................................................................................... 45
3.2 RESEARCH DESIGN..................................................................................................................... 45
3.3 FULL SCALE INVESTIGATIONS .................................................................................................. 46
3.3.1 Description of the sample ................................................................................................... 46
3.4 BENCH SCALE INVESTIGATIONS ............................................................................................... 49
3.4.1 Description of the sample ................................................................................................... 49
3.4.2 Chlorine solution preparation. ............................................................................................. 49
3.4.3 Chlorine Demand Tests ....................................................................................................... 50
3.4.4 Batch Chlorination Experiments ......................................................................................... 51
3.5 DATA ANALYSIS .................................................................................................................... 53
CHAPTER 4 .............................................................................................................................................. 54
4 RESULTS AND DISCUSSION ....................................................................................................... 54
4.1 INTRODUCTION .......................................................................................................................... 54

ix
4.2 FULL-SCALE RESULTS AT THE BURGERSFORT WASTEWATER TREATMENT PLANT .............. 54
4.2.1 Wastewater Treatment Works Performance ....................................................................... 54
4.2.2 Typical chlorine demand curve of Burgersfort WWTW secondary effluent. ..................... 58
4.2.3 Correlations between Chlorine Demand and Other Determinants. ..................................... 59
4.2.4 Study Correlations of Chlorine Dosed and E. coli inactivation .......................................... 62
4.3 LABORATORY INVESTIGATIONS: BURGERSFORT WASTEWATER TREATMENT PLANT ......... 63
4.3.1 Chlorine demand experiments ............................................................................................ 63
4.3.2 The effect of increased substance concentration and contact time on E. coli inactivation . 66
4.3.3 The effect of increased contact time and increased dosing concentration on E. coli
inactivation .......................................................................................................................................... 69
4.3.4 The effect of mixing on E. coli inactivation ....................................................................... 70
4.4 DISCUSSION ................................................................................................................................ 76
CHAPTER 5 .............................................................................................................................................. 79
5 CONCLUSIONS ............................................................................................................................... 79
5.1 CONCLUSIONS OF THIS STUDY .................................................................................................. 79
5.2 ACHIEVEMENT OF THE STUDY’S OBJECTIVES ........................................................................ 80
5.3 RECOMMENDATIONS FOR FUTURE RESEARCH ....................................................................... 82
REFERENCES .......................................................................................................................................... 84
x
LIST OF FIGURES
Figure 2-1: Percentage of WWTWs non-compliant for “bacteriological quality” (health related) (Manus &
Van der Merwe-Botha, 2010) ................................................................................................... 20
Figure 2-2: Theoretical breakpoint chlorination (Marhaba, 2009). ............................................................ 35
Figure 3-1: Layout of full-scale experimental setup = (continuous stirred tank reactor (CSTR)). A =
Chlorine gas cylinder, B = Settles effluent overflow, C = Chlorine dosing chamber, D =
Stirrer (mixer), E = Effluent open channel, F = Watercourse. ................................................. 49
Figure 4-1: Monthly monitored effluent quality trend of Burgersfort Wastewater Works. ........................ 58
Figure 4-2: Typical chlorine demand curve at the Burgersfort WWTW secondary effluent (chlorine
demand between 6-7 mg/l). ...................................................................................................... 59
Figure 4-3: Correlation for Burgersfort WWTW effluent quality with temperature as independent variable
and Chlorine demand as dependent variable. ........................................................................... 60
Figure 4-4: Correlation for Burgersfort WWTW effluent quality with COD as independent variable and
Chlorine demand as dependent variable. .................................................................................. 61
Figure 4-5: Correlation for Burgersfort WWTW effluent quality with ammonia nitrogen as independent
variable and chlorine demand as dependent variable. .............................................................. 61
Figure 4-6: Correlation for Burgersfort WWTW effluent quality with suspended solids as independent
variable and chlorine demand as dependent variable. .............................................................. 62
Figure 4-7: Correlation for Burgersfort WWTW effluent quality with chlorine dosed as independent
variable and E. coli as dependent variable. .............................................................................. 63
Figure 4-8: Test 1 chlorine demand curve at the Burgersfort WWTW secondary effluent (chlorine demand
of 6.5 mg/l). .............................................................................................................................. 64
Figure 4-9: Test 2 chlorine demand curve at the Burgersfort WWTW secondary effluent (chlorine demand
of 6.0 mg/l). .............................................................................................................................. 65
Figure 4-10: Test 3 chlorine demand curve of Burgersfort WWTW secondary effluent (chlorine demand
of 7.0 mg/l). .............................................................................................................................. 65
Figure 4-11: Effect of mixing after 1 minute of contact time .................................................................... 74
Figure 4-12: Effect of mixing after 2 minutes of contact time ................................................................... 75
Figure 4-13: Effect of mixing after 3 minutes of contact time ................................................................... 76

xi
LIST OF TABLES
Table 2-1: Comparison of disinfection methods (Source: modified from EPA Victoria, 2009) ................ 27
Table 2-2: Cost assessment of alternative disinfection dosage required to meet both the relaxed (<500
Count/100 ml) and general (0 Count/100 ml) DWS effluent discharge standards (Freese,
Bailey & Nozaic, 2003). ........................................................................................................... 42
Table 4-1: The average basic chemical water quality of Burgersfort WWTWs influent and settling tank
effluent for the studied period (July 2011 – November 2013). ................................................ 54
Table 4-2: E. coli Count and concentration of applied chlorine at Burgersfort wastewater works effluent
disinfection during the period July 2011 to March 2013. ......................................................... 55
Table 4-3: E. coli Count and concentration of applied chlorine at Burgersfort wastewater works during the
period April 2013 to November 2013 when mixing was applied. ............................................ 55
Table 4-4: Monthly monitored effluent quality data for the Burgersfort Wastewater Works. ................... 57
Table 4-5: Chlorine demand data at the Burgersfort WWTW secondary effluent ..................................... 64
Table 4-6: Mean inactivation of E. coli prior to spiking of the secondary effluent from humus tank. ....... 66
Table 4-7: The effect of increased substance/pollutant concentration on E. coli inactivation in samples
spiked with raw sewage (influent) at a 1:7 (Influent: humus tank effluent) ratio; chlorine dosed
at 3mg/l ..................................................................................................................................... 67
Table 4-8: The effect of increased substance/pollutant concentration on E. coli inactivation in samples
spiked with raw sewage (influent) at a 1:3 (Influent: humus tank effluent) ratio; chlorine dosed
at 3mg/l ..................................................................................................................................... 67
Table 4-9: Effect of increased chlorine dosing concentration and contact time (CT value) on E. coli
inactivation. .............................................................................................................................. 70
Table 4-10: Effect of mixing, contact time and chlorine concentration on E. coli Inactivation ................. 71
Table 4-11: Effect of mixing, contact time and chlorine concentration on Log10 E. coli inactivation. ..... 73

xii
LIST OF EQUATIONS
HOCl ↔ OCl- + H+ 2-1 ........................................................... 22
𝒅𝑵𝑻𝒅𝒕 = −𝒌𝑵𝒕 𝒐𝒓 𝑰𝒏𝑵𝒕𝑵𝟎 = −𝒌𝒕 2-2 .......................................................... 28
𝒌 = 𝒌′𝑪𝒏 2-3 ......................................................... 28
𝑰𝒏𝒕𝟏𝒕𝟐 = 𝑬(𝑻𝟐 − 𝑻𝟏)𝑹𝑻𝟏𝑻𝟐 2-4 ......................................................... 29
𝒌 = 𝑨𝒆 − 𝑬𝒂/𝑹𝑻 2-5 ......................................................... 29
𝑪𝒍𝟐 + 𝑯𝟐𝑶 ↔ 𝑯 + +𝑪𝒍 − + 𝑯𝑶𝑪𝒍 2-6 ......................................................... 32
𝑲𝑯 = [𝑯+]𝑪𝒍 − [𝑯𝑶𝑪𝒍]𝑪𝒍𝟐(𝒂𝒒) 2-7 ......................................................... 32
𝑪𝒍𝟐(𝒈) = 𝑪𝒍𝟐(𝒂𝒒)𝑯 = [𝑪𝒍𝟐𝒂𝒒]𝑷𝑪𝑳𝟐 2-8 ......................................................... 32
HOCL ↔ OCl- + H+ 2-9.......................................................... 33
𝑲𝒂 = [𝑶𝑪𝒍−][𝑯+][𝑯𝑶𝑪𝑳] 2-10 ....................................................... 33
NH4+ + HOCl ↔ NH2Cl + H2O + H+ 2-11 ....................................................... 33
NH3(aq) + HOCl ↔ NH2Cl + H2O (pH > 7) 2-12 ........................................................ 33
NH2Cl + HOCl ↔ NHCl2 + H2O (not favoured at a high pH) 2-13 ........................................................ 33
NHCl2 + HOCl ↔ NCl3 + H2O 2-14 ......................................................... 33
nA + mB → D 2-15 ......................................................... 36
𝒓𝑨 = −𝑲𝑪𝑨 . 𝑪𝑩𝒎 2-16 ......................................................... 36
Accumulation = In - Out - Loss + Production 2-17 ......................................................... 36
In - Out = Loss 2-18 ......................................................... 36
𝑵𝒕𝑵𝟎 = 𝒆 − Ʀ𝒆𝑪𝒕 2-19 ......................................................... 37
HOCl + B → products, 2-20 ......................................................... 38
NH3 + HOCl→NH2Cl + H2O; 2-21 ......................................................... 38
NH2Cl + HOCl→NHCl2 + H2O; 2-22 .......................................................... 38
NHCl2 + HOCl→NCl3 + H2O: 2-23 ......................................................... 38
NO2- + H2O + Cl2 → NO3- + 2HCl 4-1 ........................................................... 68
Y = -0.1355x + 3.3095 4-2 R² = 0.7552............................................................................................... 74
y = -0.6159x + 3.7156 4-3 R² = 0.9087 .............................................................................................. 75
y = -0.5946x + 3.0287 4-4 R² = 0.7304 .............................................................................................. 75
y = -0.1827x + 3.324 4-5 R² = 0.821 .................................................................................................. 75
y = -0.6679x + 3.7815 4-6 R² = 0.9019 .............................................................................................. 75
y = -0.5866x + 2.8178 4-7 R² = 0.6412 .............................................................................................. 75
y = -0.2729x + 3.5038 4-8 R² = 0.9438 .............................................................................................. 76

xiii
y = -0.6752x + 3.7501 4-9 R² = 0.8895 .............................................................................................. 76
y = -0.5952x + 2.8981 4-10 R² = 0.6883 ............................................................................................ 76

xiv
LIST OF SYMBOLS AND ABBREVIATIONS
COD Chemical Oxygen Demand
Cl2 Chlorine
DWS Department of Water and Sanitation
DBPs Disinfection by-products
E. coli Escherichia Coli
HTH Calcium Hypochlorite
HRT Hydraulic Retention Time
mg/l milligram per litre
NWA National Water Act
WSAt Water Services Act
pH Power of hydrogen
UV Ultraviolet absorbance
WWTWs Wastewater Treatment Works
WSA Water Services Authority
WSP Water Services Provider
SANAS South African National Accreditation Services
STD Standard
xv
DEFINITION OF CONCEPTS
Chlorination: The application of chlorine or chlorine compounds to water or wastewater,
usually for the purpose of pathogen reduction. In some circumstances,
chlorination may also provide chemical oxidation and odour control.
Disinfection: A process that destroys, inactivates or removes micro-organisms.
E. coli: Escherichia coli. A bacterium found in the gut of warm-blooded animals
that indicates faecal contamination.
Effluent: Final water of wastewater treatment works after treatment processes.
Influent: Raw water into wastewater treatment works before treatment processes.
Pathogens: Organisms capable of causing disease. In untreated wastewater, the key
potential pathogens include bacteria, viruses, protozoans and helminths.
Residual A chemical used or produced during the disinfection process that is present
at the completion of that process.
1
CHAPTER 1
1 INTRODUCTION AND BACKGROUND OF THE STUDY
1.1 INTRODUCTION
Most municipal wastewater treatment plants use physicochemical processes to treat domestic and
combined domestic and industrial wastewater. These processes include screening, grit removal,
addition of ferric chloride and/or alum, as well as a polyelectrolyte to improve solids coagulation,
flocculation and settling and effluent disinfection prior to discharge into the receiving streams or
rivers (Gehr et al., 2003).
Disinfection of water implies the inactivation, deactivation or killing of pathogenic
microorganisms and is used to achieve the standard for E. coli or faecal coliforms as stipulated by
the South African general and special limits for treated wastewater effluent (DWAF, 1996).
Chlorine has been the dominant disinfectant for wastewater and is still widely (Winward et al.,
2008; Amiri et al., 2010; Rauen et al., 2012; Li et al., 2013). It offers a reliable reduction of
pathogenic microorganisms at reasonable operating costs. There are, however, various methods
that can be used for disinfection. These include physical processes (e.g. ultraviolet radiation) and
chemical processes (e.g. Chlorine dioxide, Bromine, and Ozone) (Metcalf & Eddy, 1991; Lim et
al., 2010).
Despite the diversity of disinfectants that can be applied to water and wastewater disinfection,
chlorination is by far the most common method aslo used by South African municipal water
authorities for disinfecting wastewater effluent prior to its discharge into receiving water bodies
(Silva, Daniel & Brunin, 2010).
According to Momba (2006), the current wastewater disinfection practice and guideline in terms
of chlorine residuals were found not to be sufficient for the inactivation of the target pathogens

2
since high pathogen Count could still be detected in the final effluent tested. Wastewater-related
microorganisms demonstrate different sensitivities to chlorination and these sensitivities are
dependent on the species of chlorine present and the dose of chlorine applied (Li et al., 2013).
Various literature sources mention that the following factors have to be considered when applying
disinfection agents (Metcalf & Eddy, 1991; AWWA, 2002; White, 1999; Charrois & Hrudey,
2007): contact time, disinfectant concentration and type, number and age of organisms, type of
organism, constituents in the effluent, temperature, chlorine demand and mixing.
One of the most important variables in the disinfection process is the contact time between the
disinfectant and the effluent. In general, the longer the contact time for a given concentration, the
more efficient the disinfection (Ibanez et al., 2008). The product of dosing concentration and
contact time (Ct) is commonly used to determine the effect of a particular disinfectant against a
certain microorganism under specified conditions (Lenntech, 2012).
Depending on the disinfectant type, within limits, disinfection effectiveness is related to
concentration (Metcalf & Eddy, 1991). The time required to deactivate a particular microorganism
decreases when the applied disinfectant concentration (mg/L) is increased (Lenntech, 2012). To
disinfect bacteria, not more than 0.4 mg/L of chlorine may be typically required (Pasco et al., 1994;
Pretorius, 1999; Momba & Makala, 2004). The concentrations of chlorine added to the effluent at
wastewater treatment plants are usually higher because of the chlorine demand of the water.
In wastewater treatment systems, the concentration of organisms is seldom a major consideration.
However, the larger the organism concentration, the longer the time required for effective
disinfection. The disinfection effect of a particular disinfectant also depends on the age of the
microorganism. Young bacteria are easier to disinfect than older bacteria. When bacteria grow
older, they develop a polysaccharide shell over their cell wall, which makes them more resistant
to disinfection (Lennetech, 2012).
The effectiveness of various disinfectants is influenced by the nature and condition of the
microorganisms present in the effluent. For example, certain spores are extremely resistant to many

3
of the chemical disinfectants normally used for disinfection (Li et al., 2011). E.coli bacteria, for
example, are more resistant to disinfectants than other bacteria and are therefore used as indicator
organisms. Several viruses are even more resistant than E. coli. The absence of E. coli bacteria
does not mean that the water is safe. Protozoan parasites like Cryptosporidium and Giardia are
very resistant to chlorine (Lenntech, 2012).
The constituents in the effluent will impact on disinfection. For example, turbidity will reduce the
effectiveness of disinfectants by protecting entrapped bacteria. Chemical substances in the water,
e.g. iron, manganese, hydrogen sulphide and nitrates, often react with disinfectants, thereby
limiting disinfection potency (Lenntech, 2012).
The temperature of the effluent also influences the effect of disinfection. High temperatures (above
room temperature) usually increase the speed of certain chemical reactions in the effluent and thus
reduce disinfection (Lenntech, 2012). These high temperatures can also decrease disinfection due
to the volatility of the disinfectant.
Since chlorine is a very reactive chemical, it also reacts with other substances present in the water,
such as organic and inorganic materials that may include reduced metals, sulphides, bromine ions,
organic and inorganic nitrogenous compounds (Metcalf & Eddy, 1991). These compounds create
a chlorine demand and free chlorine is only available once the demand by these compounds has
been satisfied. Satisfying the chlorine demand by other substances apart from disinfecting
microorganisms is called breakpoint chlorination and is wasteful because more chlorine is
consumed than is required for disinfection alone (Pretorius, 1999). A consequence of this is that
the wastewater treatment process increases the cost of chlorine required for disinfection.
Unfortunately, the total chlorine demand currently determines chlorine dosage in most water
treatment processes. Consequently, to adequately disinfect wastewater, higher disinfectant
concentrations are employed to kill pathogenic microorganisms.
4
Longly (1978) evaluated turbulence factors in chlorine disinfection of wastewater in addition to
the above-mentioned factors. He found that the inactivation of microorganisms achieved during
disinfection may not always be adequately predicted by the above-mentioned factors (especially
chlorine residual and contact time) but could be predicted by the mixing of chlorine with the
incoming wastewater. To date, the impact of mixing on chlorine disinfection has not been directly
researched and/or applied. Longly (1978) indicates that before the chlorine is thoroughly mixed
with the mass of incoming wastewater, reactions competing with the disinfection process results
in the formation of chloramines, other by-products and the rapid depletion of free chlorine.
Several reports (DWA 2011; 2012) describe certain critical issues with potable water and
wastewater chlorination that deserve mention at this juncture. For example:
Poor disinfection has been observed at certain plants despite sufficient chlorine in the water.
The problem is likely due to the need for upstream changes to process technology and the
optimisation of other plant processes.
The South African Department of Water and Sanitation (DWS) general and special permits for
discharge wastewater effluent into water courses respectively call for a 0.1 mg/l and non-
detection of chlorine residual (DWAF, 1996).
The residual chlorine requirements are necessary due to residual chlorine’s toxicity to aquatic life
and the effluents’ carcinogenic and toxic compounds arising from chlorine disinfection (Acher et
al., 1993). Thus, due to the residual chlorine requirement and the high cost of chlorination based
on high chlorine demand (most of which is wasted), there is a growing interest in the application
of disinfectants other than chlorine (e.g. chlorine dioxide and ozone) for wastewater effluent
disinfection (Warriner et al., 1985). Warriner et al., (1985) found that among the chemical
disinfectants tested, chlorine was the dominant agent for either water or wastewater disinfection
and is usually the economic choice for disinfection of wastewater effluent, especially if de-
chlorination is not required. However, since the compliance requirement for free chlorine residual
in the effluent for discharging should be <0.1 mg/l (NWA, 1998 & DWAF 1996), there is a need
to look at optimising chlorine’s effectiveness and its economics.

5
This study is therefore motivated to address the following issues:
i. Since it is important to look at options to reduce chlorine demand and redirect the chlorine
dose to its primary aim of microorganism inactivation without the total chlorine demand being
met, this study evaluates the impact of contact time (Ct) and chlorine residual concentration
on wastewater treatment (which addresses the effectiveness of chlorine as a disinfectant for
wastewater effluent), as well as the correlation between chlorine demand and certain water
quality parameters (that is, temperature, COD, ammonia nitrogen and suspended
solids/turbidity). It is anticipated that this investigation would assist relevant authorities at
wastewater treatment plants to reduce the cost of chlorine dosage while enhancing disinfection
efficiency.
If the above is achieved and the free chlorine residual in the effluent is reduced to zero, this
will address the problem faced by most wastewater treatment plants producing above zero free
chlorine residual in the effluent discharged into water resource. Hence, this solution will be
ecologically beneficial for.
ii. The effectiveness of mixing at the point of chlorination. This study will aim to develop
turbulence factors in wastewater effluent disinfection in order to reduce the contact time
required between chlorine and the effluent, and the need to meet chlorine demand.
iii. The study investigates reducing the cost of chlorine disinfection based on the above bullet-
points. The motivation of this and the above bullet-point is to achieve optimum disinfection
with a lower chlorine dose compared to the current chlorine dose practice and consequently,
reduce the cost of chlorine disinfection. This will reduce the cost of wastewater treatment
operation and also minimise the need to de-chlorinate high chlorine residual in the effluent
before discharge.
6
1.2 SUMMARY OF THE PROBLEM
Chlorine dose demand during disinfection of wastewater effluent is unrealistically high because
the chlorine reacts with organic and inorganic materials that the chlorination is not primarily aimed
at. Part of what is needed is a better understanding or acknowledgement of chemical reactions that
occur simultaneously during chlorination (Amiri, et al., 2010). The current practice of disinfection
therefore warrants the need to satisfy the chlorine demand before disinfection can proceed. Gehr
et al., (2003) affirms that if there is little organic matter in the effluent, the disinfection reaction
will be faster than is currently the norm.
As mentioned earlier, chlorine dosages lower than 0.4 mg/l could be sufficient to disinfect and
achieve up to 99% microorganism inactivation (Pasco et al., 1994; Amiri et al., 2010; Metcalf &
Eddy, 1991) and the maximum hydraulic retention time (HRT) to achieve complete inactivation
of E. coli is 2.5 minutes, corresponding to the initial E. coli concentration of 108 Count/100 ml
(Nanayakkara et al., 2012). Therefore, this study asks the following questions:
Can optimum microorganism inactivation take place during wastewater disinfection without
the need to first meet the total chlorine demand?
Consequent to the above, can the wastewater effluent discharge standard for E. coli as the
definitive preferred indicator of faecal pollution microorganisms be achieved with chlorine
dosage concentrations lower than what is currently required to produce 0 mg/l of free
residual chlorine?
1.3 RESEARCH AIM AND OBJECTIVES
The aim of this research is to evaluate and optimize the effectiveness of chlorine as a disinfectant
for wastewater treatment effluent discharged into water bodies.

7
Specific Objectives
i. To empirically evaluate the impact of chlorine and wastewater contact time (Ct) and
chlorine residual concentration on microorganism inactivation, while reducing chlorine
dose and aiming not to meet chlorine demand.
ii. To empirically evaluate the impact of mixing on effective disinfection at the point of
chlorination.
1.4 SUMMARY OF RESEARCH METHODS AND MATERIALS
This research project is based on primary data collected at the Burgersfort wastewater treatment
works operated by Lepelle Northern Water.
Literature review is presented to understand mixing during disinfection dosing, and the effective
inactivation of microorganisms using disinfectants.
Full-scale investigations
The Burgersfort wastewater treatment plant operated by Lepelle Northern Water Board was
employed as the full-scale plant during the study period. The Laboratory facility of Lepelle
Northern Water was used to conduct the experiments and the analyses of samples. The bench scale
(discussed) chlorine demand test results were compared with chlorine demand results obtained at
the Burgersfort wastewater treatment plant. The same was undertaken for bacteriological quality
of the wastewater effluent discharged.
Bench scale investigations
The methodology applied for bench scale investigations is as follows:

8
Chlorine solution preparation and analysis
The chlorine solution used in the bench scale experiments was Calcium Hypochlorite (HTH)
and/or chlorine gas diluted with distilled water to obtain a stock solution of approximately 600-
800 mg/l free chlorine concentration, measured using a an HACH pocket colorimeter.
Chlorine demand tests
The following stapes were undertaken in order to determine chlorine demand:
• Starch, 0.025N sodium thiosulphate and HTH solutions were prepared for this test.
• Volumetric flasks were filled with 100ml of the primary effluent (i.e. un-chlorinated
wastewater).
• The determined volume (e.g. 0.5ml, 1.0ml, 1.5ml etc.) of standardised HTH solution were
added to each flask and the intervals between additions (e.g. 1 minute) were noted.
• Immediately after adding the HTH solutions to each flask, the cap was screwed on and the
flask shaken. Thereafter, the flask was kept in a dark place for 30 minutes.
• After 30 minutes, each flask was shaken again and a 10 ml sample was withdrawn and free
chlorine concentration measured using a HACH pocket colorimeter.
• The readings obtained were plotted and measured the breakpoint chlorination determined
from the graph.
Disinfection experiments using chlorine
Five litre dark non-transparent glass bottles were filled with primary effluent and chlorinated by
adding liquid chlorine. These samples were used to empirically evaluate the impact of chlorine
and wastewater contact time (Ct) and chlorine residual concentration on microorganism
inactivation, while reducing chlorine dose and aiming not to meet chlorine demand.

9
E. coli count was measured because E. coli is a well-known indicator organism, it is faecal specific
and can be analysed quickly, efficiently and cost effectively. Furthermore, E. coli is more resilient
to chlorination than other pathogens excreted in human faeces and occurs more abundantly.
To empirically evaluate the impact of mixing on effective disinfection at the point of chlorination,
chlorine concentrations were dosed into each of three 5-litre dark glass bottles. Variable mixing
rates were applied to each bottle to evaluate the impact of mixing.
1.5 DELINEATION AND LIMITATIONS OF THE STUDY
This study is confined to the use of chlorine as a disinfectant for wastewater treatment plant
effluent. Some major limitations include:
The study only evaluates the effectiveness of chlorine as a disinfectant for wastewater and not
other alternative disinfectants.
The study does not assess the impact of the efficiency of treatment units upstream of the
disinfection process unit, but do evaluates the inactivation of microorganisms irrespective of
the quality of wastewater in the disinfection unit.
The detailed kinetics of chlorine’s different reactions with inorganic and organic materials in
solution, chlorine’s interaction with microorganisms, and chlorine’s decomposition in the
effluent do not form part of this study. Hence, a disinfection kinetic model is not developed.
This study focuses on the indicator aerobic bacteria (i.e. E. coli) prescribed in the South African
General and Special standards (DWAF, 1996) which shows a relative low resistance to
chlorine. In other words, microorganisms that cannot be inactivated by chlorine due to their
greater resistant to chlorine disinfection are not assessed in this study.
The effects of suspended solids, chorine dose concentration and contact time are studied in
relation to mixing or turbulence at the point of disinfection.

10
The effects of temperature and pH on the inactivation kinetics of bacteria by chlorine, as well
as the diffusion rate of chlorine under different conditions are not studied as part of this
research.
Therefore, this work only assessed effect of the suspended solids, chorine dose concentrations and
contact time on the effect of applying mixing or turbulence at the point of disinfection. Neumann
et al., (2007) in their study indicated that bacteria inactivation is quantified as a function of
disinfectant exposure (i.e. Ct). Other factors that also have an impact on the effectiveness of
disinfection where not verified. No effort was made to distinguish between the two free chlorine
species present (hypochlorite and hypochlorous acid) or the formation of chloramines.
In this study, experiments were performed in a limited number of conditions, and thus the effects
of temperature and pH on the inactivation kinetics of bacteria with chlorine remain to be fully
characterised, as well as the diffusion rate of chlorine under different conditions.
1.6 LAYOUT OF THE STUDY
The paragraphs below and Figure 1.1 propose the layout of this research report.
CHAPTER 1: Introduction
This chapter presents the context of the study and formulates the problem statement, research
objectives, and summary of methods and materials.
CHAPTER 2: Literature Review
This chapter presents the literature review carried out during this study and provides a theoretical
background to wastewater disinfection and chlorination.
CHAPTER 3: Materials and Methodology
This chapter discusses in detail the materials and methods employed to address this study’s
objectives.
11
CHAPTER 4: Results and Discussion
This chapter highlights the findings of the study and relates these to the research objectives
outlined in Chapter 1.
CHAPTER 5: Conclusion
Highlights and conclusions derived from the research are discussed. This final chapter makes
recommendations for further improvement.
12
CHAPTER 2
2 LITERATURE REVIEW
2.1 INTRODUCTION
This literature review offers a comprehensive look at chlorine disinfection of water, wastewater
treatment works and its effectiveness.
Wastewater is the source of many human enteric pathogens and often associated with diseases
contracted through swimming in natural waters. Adequate wastewater treatment prior to effluent
discharge plays a critical role in minimizing public health risks (Srinivasan, 2011). Tyrrell (1995)
indicated that during the past decade, epidemiological data in the United States have shown a
dramatic increase in outbreaks of enteric viral diseases transmitted by recreational water and
shellfish. This increase is, at least partially, a result of the inadequacy of chlorination, as practiced
by most US wastewater treatment facilities to effectively inactivate many viral agents.
The impact of untreated/partially treated wastewater has raised several health and safety concerns.
As both industry and populations continue to increase, there is an increase in wastewater
generation in urban areas and a great decrease in freshwater availability. Every year, hundreds of
billions of litres of partially treated sewage flows into rivers and lakes for one reason or another
(DWA, 2009, Li & Zhang, 2013). Most wastewater treatment plants do not fully treat their
wastewater. Partially treated or untreated sewage contains a wide array of pathogens that pose a
health risk. Partially treated sewage discharged into the environment can percolate into ground
water, contaminating drinking water wells with pathogens. It can also damage the receiving
stream’s ability to support healthy, living communities of aquatic organisms. (Li & Zhang, 2013,
Adewumi et al., 2010).
13
Golder Associates Africa and Zitholele Consulting (2006a) points out that the regulatory
framework for wastewater treatment works in South Africa points out two critical factors that force
a need for high quality discharge from wastewater treatment works (WWTWs):
the Country is approaching maximum economic exploitation of available surface and
groundwater resources and high quality discharges are required to protect the limited water
resources; and
the Country continues to face deterioration in the quality of the surface water resources due
to the discharge of poorly treated wastewater.
As result, the quality of discharges from wastewater treatment plants has become a matter of
national importance and priority (Adewumi, Ilemobade & van Zyl, 2012). Both the establishment
and operation of a wastewater treatment plant and the discharge of treated wastewater are subject
to laws and regulations implemented by the Department of Water and Sanitation (DWS).
Community concerns about environmental pollution resulting from the quality of wastewater
disposed into sensitive environments has led to pressures on the water industry to treat wastewater
at a higher level before discharging into receiving rivers or streams (Adewumi, Ilemobade & van
Zyl, 2010).
Recently, the fate of antibiotics, their presence in wastewater and their potential toxic effects have
gained the attention of environmental researchers throughout the world (Li & Zhang, 2013; Xu et
al., 2011). In South Africa, the Government (Department of Water and Sanitation) has become
more and more concerned about potential pollution due to municipal wastewater treatment works
that are in a desperate state. The Green Drop incentive regulation initiative was introduce to ensure
that an environment is created within the water sector where wastewater is once again prioritised
by water service authorities. However, the efforts of water service authorities and water service
providers to ensure compliance with the effluent discharge standard for E. coli has led to an
increase in the cost of disinfection treatment and non-compliance to standards of residual chlorine
discharged into the water course. This research was subsequently initiated to find an effective
method of disinfection and to enhance the disinfection process via disinfection process

14
optimisation without compromising disinfection and creating by-products that result in non-
compliance when it comes to the discharged effluent.
2.2 WASTEWATER EFFLUENT REGULATORY FRAMEWORK
Water Services Legislation: Prior to the Water Act 54 of 1956, the Union Health Act of 1919
required land disposal of treated wastewater and prohibited local authorities from discharging
wastewater into water resources without special permits. In contrast to this, the Water Act 54 of
1956 made it obligatory to return treated wastewater to the source river or dam. The Water Act
(1956) also stipulated the required standards that must be met when treated wastewater is
discharged into the environment. The standards were published in order to manage water quality
problems such as salinisation and eutrophication. The promulgation of regulations that prescribed
General and Special Standards (1962) and the Special Standard for Phosphate (1980) in terms of
this Act was aimed at combating increasing water quality problems by stipulating stricter
requirements for discharge quality (Government Gazette, 1984).
The above regulation superseded by the National Water Act No. 36 of 1998 (NWA). The NWA
combines receiving water quality objectives and pollution prevention approaches to produce
discharge standards specific to local catchments. This approach is aimed at ensuring the long-term
sustainable use of limited water resources. This approach combines source-directed and resource-
directed measures to ensure that the receiving water environment is “fit-for-use” by all legitimate
water users.
The source-directed regulatory measures focus on water resource impacts from both point and
diffuse sources. These measures are aimed at managing and controlling the generation of waste at
source. The resource-directed measures focus on the receiving water body. The aim of these
measures is to set clear objectives for a water resource to attain a certain level of protection and to
satisfy the water quality requirements of legitimate water users. These measures require that water
resources should be grouped into different classes of protection, with associated water resource
quality targets.

15
Section 21 of the NWA allows for the discharge of water containing waste (wastewater) into a
water resource as a licensed water use. A person or institution may only discharge wastewater to
a water resource if that discharge is authorised (which could either be by a license, a general
authorisation or a continuation of a pre-existing lawful use). The wastewater must be treated so
that its quality reliably complies with the standards contained in the relevant authorisation. These
discharge standards are determined based on the local and regional water resource quality
objectives and reflect both the precautionary approach and local catchments approach.
Section 26(1) (h) of the NWA further states that the DWS Minister can regulate the waste standards
pertaining to the waste that may be discharged into a water resource. Draft regulations have been
published that cater for three different discharge standards, covering existing discharges, new
discharges and a future stage applicable to all discharges. At present, the discharge standards
specified in the General Authorisation, No. 339 of March 2004, are used as a guideline to set
wastewater discharge standards in the absence of resource-derived water quality objectives.
While the establishment and operation of a wastewater treatment plant and associated wastewater
discharges are regulated in terms of the National Water Act, the provision of sanitation services,
which includes sewage and wastewater services (e.g. Bulk sewer pipelines for collection,
monitoring influent and effluent, and treatment), is regulated by the Water Services Act No. 108
of 1997 (WSAt). The WSAt defines the roles and responsibilities of WSP’s and WSA's. The Act
requires the WSA’s to submit Water Services Development plans to the DWS every five years. It
should include a chapter on wastewater collection, monitoring and treatment. The Act also
stipulates in Chapter 2 that the Minister may promulgate regulations that prescribe national
standards relating to the acceptance of wastewater into a wastewater treatment plant and standards
for tariffs with respect to the water services provided (which includes the treatment of wastewater).
Regulations in this regard were published in August 2002, and took effect on 1 July 2003. In terms
of these regulations, a WSA or WSP can specify the quantity and quality of wastewater (that is;
municipal and/or industrial wastewater) accepted into the sewerage system to ensure that the
wastewater treatment plant is capable of treating the wastewater to an appropriate level. This must

16
be done to ensure that the treated wastewater discharge quality and quantity comply with the
applicable discharge standards prescribed under the NWA.
Standards and Specifications: The Water Act of 1956 regulated the discharge of treated
wastewater to ensure that the receiving water environment was protected, to safeguard public
health and to enable re-use of the water by other downstream users.
The three standards that were promulgated in terms of the Act were the:
General Standards applicable to all water resources;
Special Standards for identified sensitive water resources;
Special Standards for phosphate, applicable to only certain sensitive catchment areas.
The General Standards required the removal of carbonaceous material up to a certain specified
limit and included a requirement for nitrification of ammonium to nitrate to avoid ammonium
toxicity in the receiving aquatic environment. The General Standards also included limits on
microbiological quality by specifying no faecal coliform in the wastewater discharge. The Special
Standards sensitive water resources included the same range of water quality constituents and
properties as the General Standards. However, it posed stricter limits due to the sensitivities of
certain selected catchment areas. It also placed a limitation on the total nitrogen in the wastewater
discharge. The Special Standard for phosphate was promulgated in response to the increased
eutrophication in some water bodies in the 1960s and was a consequence of the perception that
Phosphorus was the limiting nutrient for aquatic plant growth.
Treatment Process Impact: The most common wastewater disinfection treatment process is the
conventional chlorination (Xu et al., 2011). Although this process proved quite adequate for
satisfying the General Standards, it is inadequate to meet the requirements of the Special Standards
with regard to chlorine residual levels in the final effluent. To satisfy both microbial and chlorine
residual requirements of this standard, interest has developed in chlorination process optimisation.
17
The implementation of regulations in terms of the NWA still focuses on the removal of organic
compounds, nitrogen, phosphate and potentially pathogenic organisms via the most appropriate
combinations of treatment technologies. Due to continued deterioration of South Africa’s water
resources quality, changing wastewater characteristics and increased industrial waste generation,
future discharge standards can be expected to be stricter. This is evident, for example, when
considering the limits placed on metals in treated wastewater discharges and the inclusion of limits
on organic compounds such as phenols. The DWS issues each wastewater discharge authorisation
on its own merit and justifiable motivation based on economic, socio-political or technology
grounds are considered, of which may allow a relaxation of the discharge standards to be
authorised. In many instances, a phased approach is adopted to ensure continual environmental
improvement.
2.3 OVERVIEW OF WASTE WATER TREATMENT OPERATION AND PERFORMANCE IN
SOUTH AFRICA
2.3.1 Wastewater Management Overview
South Africa has built a substantial wastewater management industry that comprises
approximately 970 treatment plants, extensive pipe networks and pump stations, transporting and
treating an mean of 7 589 000 kilolitres of wastewater on a daily basis. The Country runs a
prominent wastewater treatment business with a capital replacement value of >R 23 billion and an
operational expenditure of >R 3.5 billion per annum. Limpopo municipalities own and operate 31
small, medium, large and macro-sized wastewater treatment works (WWTWs), as well as 31 plants
that remain undetermined in capacity (DWA, 2009).
Recent investigations and audits reveal that the situation with regard to wastewater treatment and
compliance with the respective Water Acts must be addressed as a matter of urgency. In the
Minister’s speech to Parliament on 11 March 2008 and her opening address at the WISA
Conference in May 2008, she expressed her concern about the state of rivers and the status of
wastewater treatment in the Country. She announced a number of measures underway and
18
additional to the hands-on support already in place to municipalities. Some of these measures
included (DWA, 2009):
The initial audit was extended to all wastewater treatment plants;
Special attention had to be given to the regulation of the sector, which includes accountability,
performance monitoring and legal intervention;
Continuous one-on-one intervention.
The function of wastewater treatment lies primarily with Water Service Authorities (WSA) and
their Water Service Providers (WSP) to operate and maintain the physical infrastructure and the
chemical/biological processes. As Sector Leader, the DWS has an oversight and regulatory role.
The DWS is intensifying its efforts to determine and improve the status of WWTWs in South
Africa. An extensive assessment and intervention plan is geared towards assisting WSA’s/WSP’s
to improve their technical proficiency and legal compliance with effluent discharge specifications.
Mobilisation of all necessary resources, funds and political commitment is required to rectify cases
of non-compliance (DWA, 2009).
The need for competent Water Service Authorities (WSA) and Providers (WSP) was highlighted
by the Minister of the DWS in her opening address of the National Water Summit in March 2008,
themed “Water Service Sustaining Lives and Enabling Growth”. She expressed her concern about
the capacity constraints and skills gap, as well as the shortfall in funding in terms of developing
new and maintaining and operating existing municipal infrastructure. She confirmed that DWS is
supporting and building capacity in municipalities via various sector initiatives such as Siyenza
Manje, introduction of international expertise and programmes such as Masibambane. Currently,
support measures are being reformed in terms of the new Local Government Support model, which
places an emphasis on “regulatory driven support” in order to ensure legislative compliance
(DWA, 2009).

19
2.3.2 Effluent Quality Compliance
A national survey covering a selected sample of wastewater treatment plants (51) throughout South
Africa to include the range of sizes of plants and different treatment technologies was conducted
to obtain information on the status quo of wastewater treatment in South Africa. One of the key
findings was that the most problematic unit process is disinfection. More than two thirds of the
plants equipped with disinfection or attempting to disinfect the treated wastewater were
experiencing problems (Golder Associates Africa and Zitholele Consulting, 2006b). Highlights of
this study include:
Most of the plants do not regularly measure the effectiveness of the chlorination, which
relates to the lack of information resources available to plant operational staff.
Inadequate disinfection or failure to disinfect treated effluent discharged into a public
stream can have a severe impact on downstream water users, especially if the maturation
ponds are bypassed.
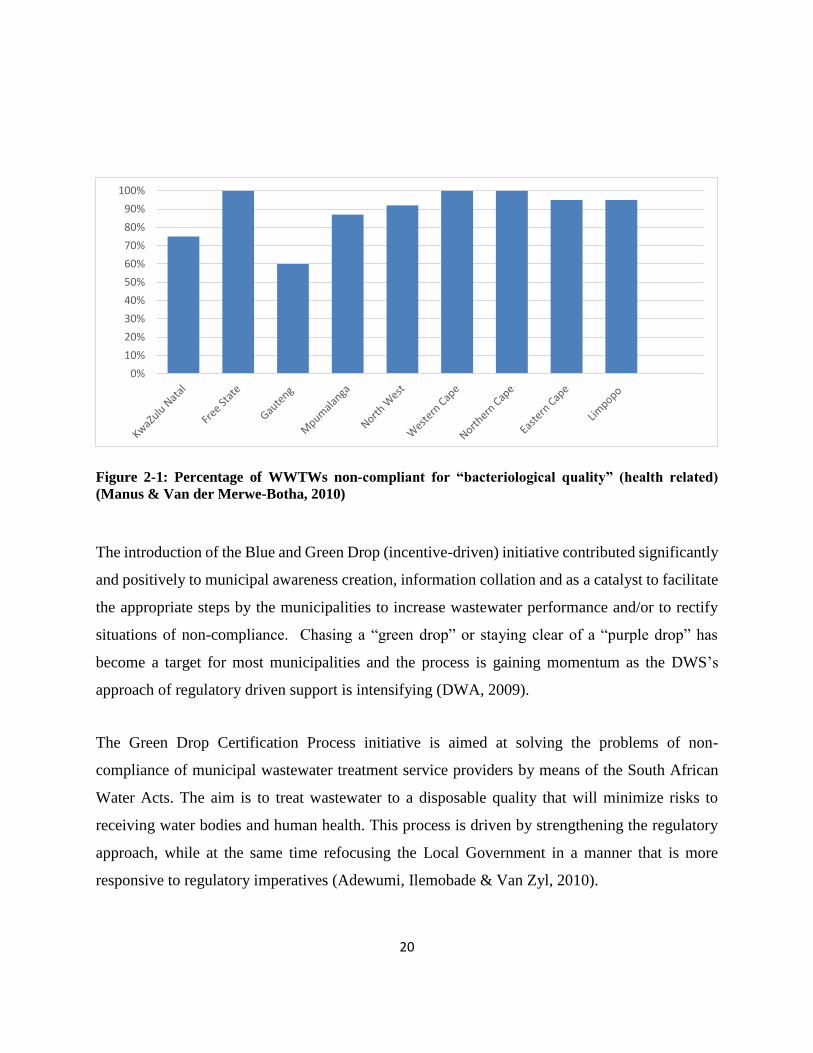
The graph below provides an indication of compliance trends for the various provinces based on
the percentage of WWTWs that are non-compliant for the “bacteriological quality” (health related)
parameter. This is based on the final effluent monitoring data received for the period 2008 to 2009.
E. coli was found to be a highest non-complying parameter amongst other non-complying
parameters (Manus & Van der Merwe-Botha, 2010).
20
Figure 2-1: Percentage of WWTWs non-compliant for “bacteriological quality” (health related)
(Manus & Van der Merwe-Botha, 2010)
The introduction of the Blue and Green Drop (incentive-driven) initiative contributed significantly
and positively to municipal awareness creation, information collation and as a catalyst to facilitate
the appropriate steps by the municipalities to increase wastewater performance and/or to rectify
situations of non-compliance. Chasing a “green drop” or staying clear of a “purple drop” has
become a target for most municipalities and the process is gaining momentum as the DWS’s
approach of regulatory driven support is intensifying (DWA, 2009).
The Green Drop Certification Process initiative is aimed at solving the problems of non-
compliance of municipal wastewater treatment service providers by means of the South African
Water Acts. The aim is to treat wastewater to a disposable quality that will minimize risks to
receiving water bodies and human health. This process is driven by strengthening the regulatory
approach, while at the same time refocusing the Local Government in a manner that is more
responsive to regulatory imperatives (Adewumi, Ilemobade & Van Zyl, 2010).
0%
10%
20%
30%
40%
50%
60%
70%
80%
90%
100%

21
2.4 CHLORINE DISINFECTION
At a water treatment works and wastewater treatment works, the disinfection is expected to satisfy
the following three requirements (Marhaba, 2009):
1. Inactivation of the pathogenic and other harmful microorganisms in water. This is primary
disinfection.
2. Disinfection residual maintenance in the distribution system. This is secondary disinfection
applicable to drinking water supply.
3. Keeping the amount of by-products to a minimum.
Different disinfectants offer different performances towards the achievement of these three
requirements. This is mainly because the characteristics of a disinfectant that makes it suitable for
each of the three requirements are not the same (Marhaba, 2009). Today the following five
disinfection agents are most commonly used for drinking water treatment:
1. Free chlorine is a strong oxidant that rapidly kills most of the microorganisms. It is also by far
the most commonly used disinfection agent (Li et al., 2013). To lower the cost and, more
importantly, to avoid the danger of the release of toxic chlorine gas, a relatively inexpensive
sodium hypochlorite solution, which releases free chlorine upon dissolution in water, is used
(Marhaba, 2009).
2. Combined chlorine (chloramines) is not a very strong oxidant, but it is used for its ability to
provide longer-lasting free chlorine residual after disinfection.
3. Ozone is the strongest oxidant in the list and it also provides control over taste- and odour-
producing compounds such as methyl isoborneol and geos-min. Use of ozone as a disinfection
agent is becoming increasingly common (Marhaba, 2009).
4. Chlorine dioxide is also a fast-acting disinfection agent (Hornstra, Smeets & Medema, 2011),
but it is not often used because of the possibility of the production of excessive amounts of chlorite,

22
which is regulated by USEPA under the stage-2 disinfectant/disinfection by-products (D/DBP)
rule.
5. UV light disinfection uses electromagnetic radiation. This method has two disadvantages: water
must have a low level of colour for it to work efficiently and it does not leave any residual
disinfectant (Marhaba, 2009).
2.4.1 Disinfection Methods (EPA Victoria, 2009)
The EPA Victoria guideline for environmental management outlines the following method for
disinfection of treated wastewater:
chemical (for example, chlorination, ozonation);
physical (for example, ultraviolet radiation, microfiltration); and
biological (for example, detention lagoons).
2.4.1.1 Chemical
Chlorination
Chlorine is used to disinfect wastewater in either gaseous form (Cl2), or as hypochlorite salts. All
forms of chlorine react with water to produce hypochlorous acid (HOCl), which rapidly dissociates
to form the hypochlorite ion according to the following reaction:
HOCl ↔ OCl- + H+ 2-1
In addition to HOCl and the hypochlorite ion (OCl-), chlorine may also be found in the form
monochloramine (NH2Cl) and dichloramine (NHCl2). The dominant form of chlorine depends on
the combination of parameters such as temperature, pH and ammonia concentrations. As pH
increases, so too does the proportion of hypochlorite ion relative to hypochlorous acid, while
higher ammonia concentrations tend to increase monochloramine.

23
Knowledge of the dominant form of chlorine in a particular disinfection process is important. With
the differing forms come varying oxidising strengths and thus biocidal efficiencies. The chlorine
disinfection process occurs primarily through oxidation of cell walls, leading to cell lysis
(bacterial) or inactivation of functional sites on the cell surface. Hypochlorous acid (HOCl) is the
most potent of the four main oxidising forms (Lim et al., 2010).
In addition to differences in oxidising strengths between forms of chlorine, the disinfection
effectiveness varies across the range of microorganisms. Protozoans, helminths and viruses are the
most resistant, followed by bacterial pathogens, with each species varying in resistance.
Chlorine is very effective against enteric bacteria, such as E. coli, but less effective against other
bacterial species (Queensland Department of Environment and Heritage, 1993). Therefore, with
the use of E. coli to estimate disinfection efficiency one also needs to consider the relative
sensitivities of the different pathogen groups. Effective chlorine disinfection depends on the
correct combination of pH, chlorine concentration and contact time, as well as the levels of
ammonia and suspended solids. The presence of reducing agents will act to decrease chlorination
efficiency.
One disadvantage with chlorine disinfection is that free and combined chlorine residues are toxic
to aquatic organisms. There is also potential for the formation of organo-chlorinated derivatives.
These derivates are of particular concern, as they tend to be relatively toxic, persistent and
bioaccumulative.
However, in spite of the apparent ability to form such compounds, the operational results from
major sewage treatment plants show that the actual levels of these compounds in the treated
wastewater are very low.
Dechlorination techniques will remove all or part of the total combined chlorine residual left from
chlorination. This is achieved by using either chemical or natural processes (such as detention
lagoons). However, dechlorination has no effect on the quantities of toxic chlorinated organic
compounds present in the final discharge.
24
Ozonation
Disinfection by ozonation is achieved by using the formation of free radicals as oxidising agents.
Ozonation is more effective against viruses and bacteria than chlorination, yet problems occur with
effective bactericidal action when conditions are not ideal.
The low solubility of ozone in water is the main factor that greatly reduces its disinfection capacity
and any ozone residual produced rapidly dissipates as a consequence of its reactive nature. The
absence of a lasting residual may also be seen as a disadvantage as this may allow possible
microbial re-growth and make it difficult to measure the efficiency of the disinfection process.
2.4.1.2 Physical
Ultraviolet radiation
The disinfection of treated wastewater via ultraviolet (UV) radiation is a physical process that
principally involves passing a film of wastewater within close proximity of a UV source (lamp).
The efficiency of UV disinfection depends on the physical and chemical water quality
characteristics of the wastewater prior to disinfection. With a better quality of wastewater comes
a more efficient UV disinfection process.
The advantage of the UV disinfection process is that it is rapid and does not add to the toxicity of
the wastewater. There have been no reports of by-products produced by UV disinfection that
adversely impact on the receiving environment.
UV disinfection does not result in a lasting residual in the wastewater. This is a disadvantage when
wastewater must be piped or stored over significant distances and time (particularly relevant to re-
use schemes) as re-growth of the microbial population is considered a risk.
Membrane filtration
Membrane technologies disinfect treated wastewater by physically filtering out microorganisms.
This disinfection process does not require the addition of reactive chemicals and as such, no toxic
disinfection by-products are produced.
25
Key membrane technologies include:
reverse osmosis;
ultrafiltration;
nanofiltration; and
microfiltration.
Microfiltration is the most commercially viable technology for the disinfection of treated
wastewater. The wastewater passes through membrane fibres, hollow cylinders permeated with
millions of microscopic pores. These pores allow wastewater to flow through the same fibres that
act as a physical barrier to particles and microorganisms.
Microfiltration efficiently reduces particulates, bacteria and a range of viruses, algae and
protozoans. Protozoa are generally larger than 0.2 micron and are removed effectively by
microfiltration, giving this method an advantage over other technologies. Viruses larger than 0.2
micron (which includes most enteric viruses) are also reduced effectively.
The main disadvantages associated with microfiltration include the potentially high capital costs,
the resultant concentrated backwash with significant microbial contamination, and the handling
and management of the contaminated chemicals produced by the periodic cleaning of the
membranes.
2.4.1.3 Biological
Lagoons
The storage of secondary treated wastewater in pondage systems (nominally 30 days) allows
natural disinfection to take place before discharging or re-using the treated wastewater. Natural
disinfection can occur via sunlight and/or natural microbial die-off. Natural disinfection processes
can be affected by a number of factors such as the:
turbidity of the wastewater, as it affects sunlight penetration;

26
amount of suspended matter in the water, as viruses and bacteria may be shielded from the
rays of the sun by being absorbed into surface pores; and
Temperature, pH, adsorption and sedimentation further influence the natural disinfection and
inactivation processes occurring in wastewater stored in lagoons. The ability of ponds to remove
or reduce the number of pathogens depends on such factors as the load of incoming solids and
microorganisms, temperature, sunlight and pond design related to detention time.
Re-infection of ponds by bird populations can also pose a problem for operators. Algal blooms in
the ponds over summer will also reduce the efficiency of the natural disinfection process. Systems
using only detention do not typically result in a Class A effluent and are unsuitable as the sole
means of pathogen reduction for high contact uses.
2.4.2 Disinfection methods comparison
The following Table 2-1 highlights the comparison of disinfection methods on effectiveness,
practicality, reliability and their adverse effects.

27
Table 2-1: Comparison of disinfection methods (Source: modified from EPA Victoria, 2009)

28
2.5 FACTORS THAT INFLUENCE THE ACTION OF DISINFECTANTS
As discussed above, different disinfectants have different characteristics that give them certain
advantages or disadvantages over one another. However, there are many other influencing factors
that govern the choice of the right disinfectant. The following are some of the important factors
that must be considered:
1. Contact time is perhaps the most important of all the factors that influence the disinfection
process. In any given concentration of disinfectant, the degree of disinfection achieved is
directly proportional to the contact time (Marhaba, 2009, Lenntech, 2012). That is, the
extent of inactivation is greatly affected by the duration of exposure of microorganisms to
disinfectants (Kim et al., 2013). The formula below represent the rate of change in
organism concentration with time dNt/dt:
𝒅𝑵𝑻
𝒅𝒕= −𝒌𝑵𝒕 𝒐𝒓 𝑰𝒏
𝑵𝒕
𝑵𝟎= −𝒌𝒕 2-2
Where:
t = time
k = inactivation rate constant (1/time units), which can be obtained by
plotting –ln(Nt/N0) against the contact time t
Nt = number of microorganisms at time t
N0 = number of microorganisms at time t = 0
2. Concentration of disinfectant governs the inactivation rate constant k. This relationship is
explained by the Watson equation (Marhaba, 2009; Rauen et al., 2012).
𝒌 = 𝒌′𝑪𝒏 2-3
Where:
𝑘′ = die-off constant
C = disinfectant concentration
n = dilution coefficient

29
In addition, the magnitude of the residual concentration of viable total coliform bacteria is
dependent on the initial concentration of chlorine, suggesting that complete inactivation of
particle-associated organisms is possible by establishing an appropriate aqueous
concentration and contact time in a disinfection system (Dietrich et al., 2007).
3. Temperature is another important factor that influences the degree of disinfection
achieved. Chlorine disinfection efficacy decreases with decreasing temperature (Page et
al., 2009). A form of the Van’t Hoff–Arrhenius equation can explain the effect of
temperature (Marhaba, 2009).
𝑰𝒏𝒕𝟏
𝒕𝟐=
𝑬(𝑻𝟐 − 𝑻𝟏)
𝑹𝑻𝟏𝑻𝟐 2-4
Where:
T1, T2 = temperatures (unit, K)
t1, t2 = time to achieve given percentage kill at T1 and T2, respectively
E = energy of activation (J/mole or cal/mole)
R = universal gas constant (8.3114 J/mole K or 1.99 cal/mole K)
Today, the influence of temperature on the rates of chemical reactions is usually interpreted
in terms of what is known as the Arrhenius equation. According to this equation, a rate
constant k is the product of pre-exponential factor A and an exponential factor:
𝒌 = 𝑨𝒆−𝑬𝒂/𝑹𝑻 2-5
The exponential factor involves the temperature T, the gas constant R and energy Ea, which
is known as the activation energy. The pre-exponential factor A is known formerly as the
“frequency factor,” but since its dimensions are the same as those of the rate constant, it is
a frequency only in the case of a first-order reaction (Laidler, 1987).
Although the Arrhenius equation is usually used to interpret kinetic data, the problem of
temperature dependence was one of much uncertainty and controversy in the past.
However, Arrhenius removed this uncertainty when he pointed out that the magnitudes of

30
the temperature effects on rates are usually much too large to be explicable on the basis of
how temperature affects the molecular translational energies or, in the case of a reaction in
solution, how the temperature affects the viscosity of the solvent. Equilibrium is
established between normal and active reactant molecules, and the Arrhenius equation was
accepted because it provides an insight into how reactions proceed (Laidler, 1987).
4. The Types of organisms present in water influences the action of disinfectant and also the
choice of the best disinfectant. The nature and condition of microorganisms also affect how
effectively the disinfectant will work (Li & Zhang, 2013; Li et al., 2011). For example,
older bacterial cells that have developed a slime coating are killed at a much slower rate
compared to the rate of killing growing, viable cells. Viruses and protozoa may have
considerably different killing rates with each disinfectant. Therefore, sometimes a
combination of chemical disinfectant and heat or UV radiation is used for better efficiency.
5. Constituents in the effluent will impact disinfection. For example, turbidity will reduce
the effectiveness of disinfectants by protecting entrapped bacteria. Chemical substances in
the water, e.g. iron, manganese, hydrogen sulphide and nitrates, often react with
disinfectants, thereby limiting disinfection potency. Existing knowledge regarding the
application of chlorine in associated fields has shown that suspended solids or particles and
organics in wastewater are able to provide protection to microorganisms (Winward et al.,
2008). Several reports have described problems in water and wastewater chlorination; for
example, when poor disinfection was observed while sufficient disinfectant was present
(Amiri et al., 2010). Dietrich et al. (2003) report, however, that chlorine is capable of
penetrating particles in wastewater by radial diffusion. They demonstrated that the degree
to which chlorine penetrates particles in wastewater is influenced by a variable initial
chlorine concentration (mg L-1) at a fixed dose (mgmin L-1). Chlorine penetration of
particles up to 145 mm is reported.
6. Chlorine demand: Since chlorine is a very reactive chemical, it also reacts with other
substances present in the water (Dai et al., 2013), such as organic and inorganic material,
31
which may include reduced metals, sulphides, bromine ions, organic and inorganic
nitrogenous compounds (Metcalf & Eddy, 1991). These compounds create a chlorine
demand and free chlorine will only be available once the demand by these compounds has
been satisfied. Satisfying the chlorine demand by other substances apart from disinfecting
microorganisms is called breakpoint chlorination and is wasteful because more chlorine is
consumed than is required for disinfection alone (Pretorius, 1999; Winward et al., 2008).
A consequence of this is that the wastewater treatment process increases the cost of
chlorine required for disinfection. Unfortunately, total chlorine demand currently
determines chlorine dosage in most water treatment processes and hence, to adequately
disinfect wastewater, higher disinfectant concentrations are employed to kill pathogenic
microorganisms.
Chlorine demand is defined as the difference between the initial chlorine concentration and
the chlorine residual after a specified contact time, t (or as C0–Ct, where C0 is the initial
free chlorine concentration and Ct is the free chlorine concentration at contact time (t)
(Helbling & Van Briesen, 2007; Winward et al., 2008).
7. Mixing: Longly (1978) evaluated turbulence factors in chlorine disinfection of wastewater
in addition to the above-mentioned factors. Longly (1978) found that the inactivation of
microorganisms achieved during disinfection may not always be adequately predicted by
the above-mentioned factors (especially chlorine residual and contact time), but can be
predicted by the mixing of chlorine with the incoming wastewater. To date, the impact of
mixing on chlorine disinfection has not been directly researched and/or applied. Longly
(1978) indicates that before the chlorine is mixed throughout the mass of incoming
wastewater, reactions competing with the disinfection process result in the formation of
chloramines, other by-products and rapid depletion of free chlorine.
The inactivation of microorganisms in water by disinfection processes is clearly influenced by a
variety of factors, including type and physiological condition of microorganisms, type of
disinfectants, physical and chemical water quality parameters, such as pH, temperature, inorganic

32
and organic constituents, particulates, and hydraulic conditions such as reactor design and mixing
conditions (Shin & Sobsey, 2008).
2.6 THEORY OF DISINFECTION
A chlorine compound is used for disinfection processes because it is strong oxidizing agent (Li et
al., 2013; Lim et al., 2010). However, oxidation is not the only process that governs disinfection,
more interactions occur simultaneously and contribute and/or influence the inactivation of
microorganisms in water.
2.6.1 Disinfection with Chlorine (Free and Combined)
Sodium hypochlorite and solid calcium hypochlorite solutions are widely used to avoid the risk or
release of toxic chlorine gas. The concentration of hypochlorite or any other oxidizing disinfectant
is often expressed as available chlorine, which refers to the relative amount of chlorine present in
chlorine (under pressure liquid form) or hypochlorite. Upon application, chlorine gas quickly
hydrolyses to form hypochlorous acid (HOCl) and hydrochloric acid (HCl) (Metcalf & Eddy,
1991; Debordea & Guntena, 2008; Nanayakkara et al., 2012; Rauen et al., 2012).
𝑪𝒍𝟐 + 𝑯𝟐𝑶 ↔ 𝑯+ + 𝑪𝒍− + 𝑯𝑶𝑪𝒍 2-6
For this reaction, the equilibrium constant is as follows:
𝑲𝑯 = [𝑯+][𝑪𝒍−][𝑯𝑶𝑪𝒍]
𝑪𝒍𝟐(𝒂𝒒) 2-7
Where:
KH = equilibrium constant (mole/L2): KH = 4.48 x 10⁴ at 25OC
Henry’s law describes the dissolution of gaseous chlorine to form dissolved molecular chlorine
(Marhaba, 2009).
𝑪𝒍𝟐(𝒈) = 𝑪𝒍𝟐(𝒂𝒒)
𝑯=
[𝑪𝒍𝟐(𝒂𝒒)]
𝑷𝑪𝑳𝟐 2-8

33
Where:
8[Cl2(aq)] = molar concentration of Cl2
PCl2 = partial pressure of chlorine in atmosphere
H = Hennry’s law constant (mole/L atm)
T = temperature (K)
HOCl is a weak acid and it dissociates further to produce hypochlorite ions (OCl-) and hydrogen
ions.
HOCL ↔ OCl- + H+ 2-9
For this reaction, the acid dissociation constant is as follows:
𝑲𝒂 = [𝑶𝑪𝒍−][𝑯+]
[𝑯𝑶𝑪𝑳] 2-10
Where:
Ka = acid dissociation constant (model/L)
In the presence of certain constituents in water, chlorine can react and transform to less effective
chemical forms, referred to as combined chlorine. In the presence of ammonium ions, free chlorine
undergoes the following step-wise reactions to form monochloramine (NH2Cl), dichloramine
(NHCl2) and trichloramine (NCl3). These formations are also pH-dependent (Metcalf & Eddy,
1991; Marhaba, 2009; Dai et al., 2013).
NH4+ + HOCl ↔ NH2Cl + H2O + H+ 2-11
or
NH3(aq) + HOCl ↔ NH2Cl + H2O (pH > 7) 2-12
NH2Cl + HOCl ↔ NHCl2 + H2O (not favoured at a high pH) 2-13
NHCl2 + HOCl ↔ NCl3 + H2O 2-14
- Free available chlorine is the sum of [HOCl] and [OCl-].
- Combined chlorine is the sum of the three chloramines formed in the reactions above.
- Total available chlorine is the sum of free chlorine and combined chlorine.
34
The dominant form of chlorine depends on the combination of parameters, such as temperature,
pH and ammonia concentrations. As the pH increases, so too does the proportion of hypochlorite
ion relative to hypochlorous acid, while higher ammonia concentrations tend to increase
monochloramine (EPA Victoria, 2009; Amiri, 2010).
Breakpoint chlorination is a phenomenon in which all the ammonium ions disappear and the
solution possesses free chlorine residue. It occurs when the molar ratio of chlorine to ammonia is
greater than 1.0. Under ideal conditions, at breakpoint chlorination, the reduction of chlorine and
oxidation of ammonia occurs at a 2:1 ratio. Further addition of chlorine results in more and more
free available chlorine. This phenomenon is very important in calculating the chlorine dosage to
maintain the chlorine residue in contact with microorganism for effective inactivation (Marhaba,
2009 & Fisher et al., 2011).
Figure 2 shows the curve for chlorine dosage vs. chlorine residue to explain the phenomenon of
breakpoint chlorination.
Stage 1: Chlorine is reduced to chlorides by metallic ions and compounds that are
oxidized easily (Fe2+, H2S, etc.).
Stage 1 and Stage 2: Chlorine reacts with ammonia to form chloramines, which are
weak disinfectants.
Stage 2: The nitrogen trichloride formation reaction is favoured and the
chloramines are consumed in the reaction with free chlorine. In this zone, nitrogen
gas is formed, which leaves the system and breakpoint chlorination is reached.
Stage 3: Free chlorine residue is observed in water and further addition of chlorine
only increases the residue concentration.

35
Figure 2-2: Theoretical breakpoint chlorination (Marhaba, 2009).
2.6.2 Kinetics of Chlorine reaction
Chemical reaction kinetics deals with the rates of chemical reaction and with how the rates depend
on factors like concentration, contact time and temperature. Kinetics looks at the time it takes for
the reactant to be consumed. A reaction in the solution can be thought of as involving three steps:
i. diffusion of the reactant;
ii. actual chemical transformation; and
iii. diffusion of the products away from each other (Laidler, 1987).

36
2.6.2.1 Diffusion reaction
For the process of disinfection with which this study is concerned, the diffusion of chlorine into
microorganism should be much faster than the chemical transformation (Laidler, 1987).
Nanayakkara et al., (2012) assume that the disinfection of E. coli is primarily due to electro-
chlorination. Therefore, the following reaction between chlorine and E. coli can be used:
nA + mB → D 2-15
where A = E. coli; B = Chlorine; m, n = Constants; D = Products.
As such, the reaction rate based on the disinfection of E. coli can be written as:
𝒓𝑨= −𝑲𝑪𝑨 . 𝑪𝑩𝒎 2-16
where CA = Concentration of E. coli, Count/100 mL; CB = Concentration of total chlorine, mg/L;
k = Reaction rate constant, [(1/min)_(L/mg)m].
The mass balance in the control volume for the E. coli can be written as follows:
Accumulation = In - Out - Loss + Production 2-17
Nanayakkara et al., (2012) further indicates that since no accumulation or production of E. coli is
expected, the above equation can be simplified to:
In - Out = Loss 2-18
When the E. coli concentration in the influent is high, the rate of disinfection is low and the chlorine
concentration has a greater effect on the disinfection efficiency (Nanayakkara et al., 2012). Jeong
et al. (2006) reported a reduction in the disinfection efficiency with an increase in the initial
population of E. coli in the electrochemical inactivation of E. coli in KH2PO4. Their study suggests

37
that the consumption of oxidants is higher if the initial concentration of bacteria was high. They
concluded that the chlorine produced is consumed by the microorganisms. Ammonia plays a
critical role during chlorination because of its competition with antibiotics for free chlorine to form
combined chlorine, which reacts slowly with these antibiotics (Li & Zhang, 2013).
The inactivation of E. coli in an ideal batch or plug flow reactor can be described by a first order
kinetic reaction (Smeets et al., 2006):
𝑵𝒕
𝑵𝟎= 𝒆−Ʀ𝒆𝑪𝒕 2-19
where N0 and Nt are the number concentrations of organisms at 0 and t min respectively and Ʀe
is the inactivation rate constant (based on natural logarithm) in l /(mgmin).
2.6.2.2 Chemical Transformation
Similar to other disinfection processes, chlorination presents certain disadvantages in spite of its
broad use and its benefits for the improvement of microbial water quality (Debordea & Guntena,
2008):
i. Due to its pH-dependent aqueous chemistry, various species of chlorine (HOCl, ClO, Cl2,
etc.) may be present in a solution. These forms of chlorine show significant differences in
their reactivity with microorganisms and micropollutants. Therefore, variability in
oxidation or disinfection efficiency can be observed depending on the pH of the water.
ii. Chlorine interacts with dissolved natural organic matter (DNOM). Numerous so-called
disinfection by-products (DBPs) can result from the reaction of chlorine with DNOM.
Among these DBPs, there are trihalomethanes (THMs) and haloacetic acids (HAAs),
which are most common. Accordingly, chlorinated effluent from wastewater treatment is
a high source of concern for DBPs (Wu et al., 2010).

38
iii. Because organic micropollutants are typically not mineralised, numerous transformation
products can be formed as a result of the oxidation of organic compounds during water
chlorination processes.
For most of the chlorination reactions, the elementary reaction can be formulated as:
HOCl + B → products, 2-20
where B is an organic or inorganic compound.
That is,
During aqueous chlorination, hypochlorous acid reacts with NH3 to generate NO3- and N2 for
[HOCl] > [NH3]. This oxidation results from successive reactions, which firstly induce chloramine
mono-, di- and tri-chloramines formation:
NH3 + HOCl→NH2Cl + H2O; 2-21
NH2Cl + HOCl→NHCl2 + H2O; 2-22
NHCl2 + HOCl→NCl3 + H2O: 2-23
As in the case of the inorganic compounds shown above, hypochlorous acid is also the dominant
reactive species for the reaction with the majority of organic compounds. The following three
kinds of reactions of hypochlorous acid with organic compounds can be described:
(i) oxidation reactions,
(ii) addition reactions to unsaturated bonds,
(iii) electrophilic substitution reactions at nucleophilic sites.
Hypochlorous acid thus presents high selectivity towards organic micro-pollutants and its
reactivity is usually restricted to limited sites (reducing, nucleophilic and unsaturated sites).
Hypochlorous acid generally induces small modifications in the parent compound’s structures,
leading to more oxidised or chlorinated molecules (Debordea & Guntena, 2008).

39
2.6.3 Mechanism of Disinfection
The precise mechanism of microorganism inactivation by chlorine has not been fully elucidated in
the literature. However, that the bacterial cell membrane undergoes changes in permeability in the
presence of chlorine and that the membrane is an important factor in determining bacterial
resistance to chlorine disinfection (Winward et al., 2008). The action of a disinfection agent can
be explained through the following five mechanisms (Marhaba, 2009):
1. Cell wall destruction that results in cell lysis and death. Chlorine hydrolyses the cell,
causing mechanical disruption.
2. Cell permeability alteration that can result in a loss of selective permeability of the
cytoplasmic membrane, allowing nitrogen, phosphorous, and other vital nutrients to flow
out. Chlorine alters the cell wall permeability, resulting in lethal damage to the cell.
3. Alteration of the colloidal nature of the protoplasm by heat, radiation and highly alkaline
or acidic agents that cause coagulation or denaturing of the cell protein, which in turn
produces permanent cell damage. Chlorine compounds can alter the colloidal nature of the
protoplasm.
4. Deoxyribonucleic acid (DNA) or ribonucleic acid (RNA) alteration that results in
disruption of the replication process (because DNA and RNA carry genetic information for
reproduction) and inactivation of the organism.
5. Inhibition of enzyme activity by strong oxidizing agents, altering the enzyme’s chemical
properties. Chlorine is capable of causing inactivation of enzymes.
The free chlorine agents, HOCL and OCl-, are capable of inactivating microorganisms. Due to the
complexity of the disinfection process, it is difficult to pinpoint the exact mechanism. The presence
of chlorine suggests that it would be the major disinfection mechanism (Nanayakkara et al., 2012).
Free chlorine is responsible for the reaction with antibiotics during the rapid stage (first 5 Second-
1 minute), whereas combined chlorine react with antibiotics in the subsequent slow stage (Le &
Zhang, 2013).
40
Therefore, knowledge of the dominant form of chlorine in a particular disinfection process is
important. With the differing forms come varying oxidising strengths and thus biocidal
efficiencies. Hypochlorous acid (HOCl) is the most potent of the four main oxidising forms. It is
well established that the free chlorine species can react with various amino acids in the virus capsid
proteins, as well as with the nucleic acid protected by the capsid. However, the actual limiting step
(that is, the molecular target and its level of damage) responsible for inactivation is not yet known
(Li et al., 2011).
In addition to differences in oxidising strengths between forms of chlorine, the disinfection
effectiveness varies across the range of microorganisms. Protozoans, helminths and viruses are the
most resistant, followed by bacterial pathogens, with each species varying in resistance. Chlorine
is very effective against enteric bacteria, such as E. coli, but less effective against other bacterial
species (EPA Victoria, 2009). Therefore, the use of E. coli to estimate disinfection efficiency needs
to consider the relative sensitivities of the different pathogen groups. Effective chlorine
disinfection depends on the correct combination of pH, chlorine concentration and contact time,
as well as the levels of ammonia and suspended solids.
2.7 TURBULENCE/MIXING FACTOR
The design and operation of a disinfection system have been and will continue to be an evolving
process. There has been a significant amount of research on disinfection during the 20th century
(Ducost, Carlson & Bellany, 2001). However, very few studies have been conducted on turbulence
and/or mixing factor effects on disinfection effectiveness. The engineering considerations
surrounding the subject of chlorine mixing have been generally overlooked in the past (White,
1999).
Smeets et al., (2006) in their study of inactivation of Escherichia coli by ozone under bench-scale
plug flow and full-scale hydraulic conditions found that the expected inactivation based on the
continuous stirred tank reactor (CSTR) method approached the observed inactivation at full-scale.
41
Therefore, the CSTR method should be preferred to calculate inactivation of ozone sensitive
organisms such as E. coli, viruses, Giardia and Campylobacter by full-scale ozonation.
Ducoste, Carlson and Bellamy (2001) integrated a disinfection design framework approach with
reactor hydraulics characterization. Their study results suggested that the predicted microbial
inactivation level is sensitive to the hydraulic characterisation method. Results also showed that
the disinfectant dose applied to the contactor could be reduced by 35% and still maintain the same
credit for the Giardia inactivation specified standard.
Longly (1978) evaluated turbulence factors in chlorine disinfection of wastewater. He found that
the inactivation of microorganisms achieved during disinfection may not always be adequately
predicted by the usual factors affecting disinfection efficiency (especially chlorine residual and
contact time), but could be predicted by the mixing of chlorine with the incoming wastewater. To
date, the impact of mixing on chlorine disinfection has not been directly researched and/or applied.
Longly (1978) indicated that before the chlorine is mixed throughout the mass of incoming
wastewater, reactions competing with the disinfection process results in the formation of
chloramines, other by-products and rapid depletion of free chlorine.
Dai et al., (2013) found that the monitoring results of their study showed that better instantaneous
mixing at the chlorine injection point reduced the effect of chlorination/dechlorination on 5-day
BOD levels.
The results of these studies show a wide range of inactivation kinetics, with the potential for the
contact time (Ct) and the disinfectant dose applied to the contactor to be reduced while not
compromising on disinfection efficiency. It is also shown that the physical mixing of the
disinfectant (chlorine) with the water to be treated was essential in ensuring adequate disinfection.
In-line initial mixing has been proposed for the rapid and complete dispersion of a coagulant to
happen within the first second, before the metal hydroxide precipitate can form (Kim & Lee, 2006).
The importance of mixing factors was put in proper perspective by the pilot-plant work of White,
(1999). This work revealed that the difference between a plug flow mix in a turbulent regime and

42
that of a back-mixed system (one with short circuiting) amounted to about 2 logs in the reduction
of coliform concentration.
2.8 COST ASSESSMENT OF DISINFECTION
Because of public health concerns, toxicity of chlorination and more restrictive discharge criteria,
alternative disinfecting agents (such as ozone, ultraviolet light, hydrogen peroxide and chlorine
dioxide) have been proposed for the final treatment of wastewater effluents (Tyrrell, 1995).
Freese, Bailey and Nozaic (2003) selected ozone, medium pressure UV irradiation, peracetic acid
and bromine as potential candidates instead of chlorine for the disinfection of wastewater treatment
and the cost assessment resulted as follows:
Table 2-2: Cost assessment of alternative disinfection dosage required to meet both the relaxed (<500
Count/100 ml) and general (0 Count/100 ml) DWS effluent discharge standards (Freese, Bailey &
Nozaic, 2003).
. Relaxed Standard General Standard
Disinfection Dose for<500
E. coli
c/kL Cost for
<500 E. coli
Dose for <10
E. coli
c/kL Cost for
<10 E. coli
Ozone 2 mg/l 3.45 8 mg/l 9.5
UV 40 mW.s/cm2 3.72 150 mW.s/cm2 11.2
Peracetic acid 5 mg/l 40.0 9.5 mg/l 76.0
Bromine 6 mg/l 50.0 9.5 mg/l 79.2
Chlorine 6 mg/l 3.00 9.5 mg/l 4.75
The higher costs of Ozone as compared to the cost of chlorine for disinfection are due to the fact
that the capital costs of Ozone are expensive. However, the high cost of Ozone is offset to some
degree by relatively low running costs. Nonetheless, Ozone requires skilled personnel to run and
maintain the Ozone generation.

43
Although it is clear that UV could be applied to the disinfection of wastewater, there are various
factors that have to be considered when choosing this as the disinfection process. Rudd and
Hopkinson (1989) indicate that although UV has been found to be an effective disinfectant, an
effluent of a reasonably good quality in terms of UV absorbance or transmissivity is required in
order for this method of disinfection to be feasible, both economically and technically.
Furthermore, despite the fact that there is no technical limitation to the size of a UV plant, the costs
of UV units tend to become prohibitive at larger facilities because of the high capital cost even
though running and maintenance costs are relatively low and in fact, compare very favourably with
chlorine costs in achieving the effluent discharge standard (Freese, Bailey & Nozaic, 2003).
Another advantage of using UV is that it is simple to maintain and operate.
The peracetic acid method of disinfection ends up not being viable due to its high price that results
in exorbitant running costs. Freese, Bailey and Nozaic (2003) in their study found that peracetic
acid could achieve 100% compliance with the effluent discharge standard when used at
concentrations of 5 mg/l or more. However, in meeting the Special Standard (discharge limits and
conditions set out in the National Water Act, Government Gazette No. 20526) of 0 Count/100ml
of faecal coliforms, it was necessary to almost double the dose of 5 mg/l.
Freese, Bailey and Nozaic (2003) found peracetic acid to be similar to chlorine for the disinfection
of wastewater. However, the cost relative to chlorine is very high. Major disadvantages associated
with peracetic acid disinfection is the increase of organic content in the effluent due to acetic acid
(AA) and thus in the potential microbial regrowth (Kitis, 2004).
Over and above the comparative low cost of the chlorine disinfection method, the disadvantage of
chlorine is that chlorine is highly toxic and thus requires more precaution during storage, handling,
and shipping. Since chlorine residual that is discharged without dechlorination can be toxic to
aquatic life and the discharge standard for special limits for effluent discharge into water course is
0 mg/l free chlorine, it is important to dechlorinate the final effluent that results from the current
application of chlorination. This method substantially increases operating costs. Moreover, the
dechlorination process involves the addition of other chemicals, such as bismuth sulphate to the

44
effluent, thus magnifying the existing problem of polluting estuaries with foreign chemicals
(Tyrrell, 1995).
Dechlorination techniques will remove all or part of the total combined chlorine residual left from
chlorination. This is achieved using either chemical or natural processes (such as detention
lagoons). However, dechlorination has no effect on the quantities of toxic chlorinated organic
compounds present in the final discharge (EPA Victoria, 2009).
Presently, the extensive use of chlorine-based disinfection has a range of advantages, including
ease of handling, measurement and control, low cost of installation and, most importantly, the
controlled concentration of chlorine residual after treatment (Rauen et al., 2012). Due to chlorine’s
efficiency and relatively low capital demand, many wastewater treatment plants have applied
chlorination for disinfection of treated wastewater before discharging it. However, determination
of optimal doses of chlorine for chlorination and sulphite for dechlorination, which removes
residual chlorine, should guarantee complete destruction of microorganisms in treated wastewater
and should protect aquatic life in a receiving stream from toxic effects of active residual chlorine
(Kim et al, 2006; MacCrehan, et al., 2005).
45
CHAPTER 3
3 MATERIAL AND METHODOLOGY
3.1 INTRODUCTION
This chapter provides an explanation of the research design, details regarding the samples
collected, instrumentation employed, means of data collection and data analysis. The research
objectives are:
1. To empirically evaluate the impact of chlorine and wastewater contact time (Ct) and
chlorine residual concentration on microorganism inactivation, while reducing chlorine
dose and aiming not to meet chlorine demand.
2. To empirically evaluate the impact of mixing on effective disinfection at the point of
chlorination.
3.2 RESEARCH DESIGN
Laboratory and field experiments were employed to explore the effect of mixing on the
effectiveness of chlorine disinfection of wastewater effluent to inactivate indicator bacteria without
first meeting the chlorine demand. The premise of this study is that the application of mixing at
the point of chlorine dosing has a positive effect on enhancing the inactivation of microorganism
(E. coli and/or Faecal Coliforms bacteria). Mixing can increase the exposure of microorganisms
to disinfectant, resulting in an optimal disinfection process at a much lower chlorine level before
or while chlorine is reacting with impurities that demand chlorine in wastewater effluent. Smeets
et al. (2006) indicate that when comparing the observed inactivation kinetics in full-scale systems
with inactivation kinetics determined under laboratory conditions, chlorination in the full-scale
system appears to be less effective than is experienced in the laboratory. This is attributed to the

46
suboptimal hydraulics of full-scale systems which is known to reduce the efficacy of inactivation.
In this study therefore, both laboratory and full-scale experiments will be conducted.
Laboratory experiments were conducted using effluent from Burgersfort and Pampirstat
Wastewater Treatment Works. Both treatment works operate secondary treatment systems that
consist of screening, grit removal, primary settling, biological treatment, secondary settling and
chlorination. Activated sludge serves as the biological treatment at both treatment works. The full-
scale experiment was carried out at the Burgersfort wastewater treatment works which is also a
secondary treatment system comprising screening, grit removal, primary settling, biological
treatment, secondary settling and gas chlorination.
The methodology applied in both experiments are described below:
3.3 FULL SCALE INVESTIGATIONS
The Burgersfort wastewater treatment works in Burgersfort town, Limpopo (S024 39 52 E029 20
11.9) was monitored during the study period. Chlorine demand results, as determined by the
laboratory test, were compared with the dosing concentrations applied by process controllers on
site and the bacteriological quality of the wastewater discharged.
3.3.1 Description of the sample
A sample is a part or piece taken from a larger entity and is presented as representative of the
whole. The objective of sampling is to collect a portion of the effluent of a sufficient volume to be
conveniently handled in the laboratory and that can still be representative of the quality of the
effluent being examined. Samples can either be grab or composite type, depending on the method
of sampling.
The effluent sample of the secondary sedimentation tank was collected during this study. The plant
which is conventional sewage treatment works treats on average 3 mega litter (Ml) of wastewater
47
per day. It is a conventional sewage treatment works. The quality results of wastewater samples
collected on monthly basis between June 2011 and October 2012 from the raw water, effluent from
secondary sedimentation tanks or humus tanks and final effluent discharged into the water course
were consulted during the experiment period. Samples for bacteriological analyses of the final
effluent from the treatment plant were collected in sterile bottles containing 4.2ml 1% sterile
sodium-thiosulphate (Na2S2O3) to quench any remaining chlorine immediately after sampling.
New and thoroughly rinsed non-sterile 2 litre plastic bottles were used to collect samples for
chemical analyses. The samples were placed in coolers containing ice packs and transported to the
Lepelle Northern Water laboratory at Ebenezer Water Treatment Plant for analyses within six
hours after samples were collected. Water quality analyses were conducted monthly for treatment
works compliance monitoring. In other words, operational monitoring is also done for plant
process control. The water quality results of these monthly compliance samples were interpreted
to obtain baseline information on treatment plant performance.
Samples for bench scale investigations were collected in thoroughly cleaned non-sterile 20L
polyethylene containers containing 0.2% Na2S2O3.
All effluents samples collected were stored at room temperature in the original sample container
for up to 12 hours during the course of each test. Tests were generally conducted within 6 hours
of sample collection. Compliance monitoring samples collected were analysed for ammonium,
nitrate and nitrite, COD, pH, turbidity, E. coli (indicator organisms) and chlorine residual.
3.3.1.1 Microbiological Analyses
Enumeration of Coliform (E. coli) was analysed by the IDEXX quanti-tray standard method,
according to the South African National Accreditation Services (SANAS) accredited method
equivalent to SABS method 221.
3.3.1.2 Chemical Analyses
i. pH and Turbidity
48
Measurements for pH and turbidity were done according to the procedures
described in the Standard Methods for the examination of water and wastewater
(1998), using a Metrohm 827 pH Lab, and a HACH 2100P Turbidity-meter
respectively.
ii. Ammonia
Ammonium was analysed using a DR/2500 spectrophotometer
iii. Chemical Oxygen Demand
COD was determined using the colorimetric determination method 8000
iv. Chlorine Residual
Chlorine residual was analysed using a HACH pocket colorimeter. The chlorine
concentration was determined by the DPD free and total chlorine methods.
v. Nitrate and Nitrite
Nitrate levels were determined by a colorimetric cadmium reduction method using
a HACH Nitrate Test Kit.
All physical and chemical parameters were determined within 12 hours of effluent collection.
3.3.1.3 Full-scale experimental setup
The full-scale installation (Fig. 3.1) had chlorine dosing contact chamber/sump with a total volume
of 505 litres. The average hydraulic residence time at a flow range of 62.5 m3/h - 125m3/h was
0.48min – 0.24min. Chlorine gas was dosed and distributed in water with diffuser plates. Sample
points were placed just after the dosing chamber and at the effluent discharge point into the river.
Continuous stirring was provided in the dosing chamber/sump by installed variable speed
mechanical mixer/stirrer.
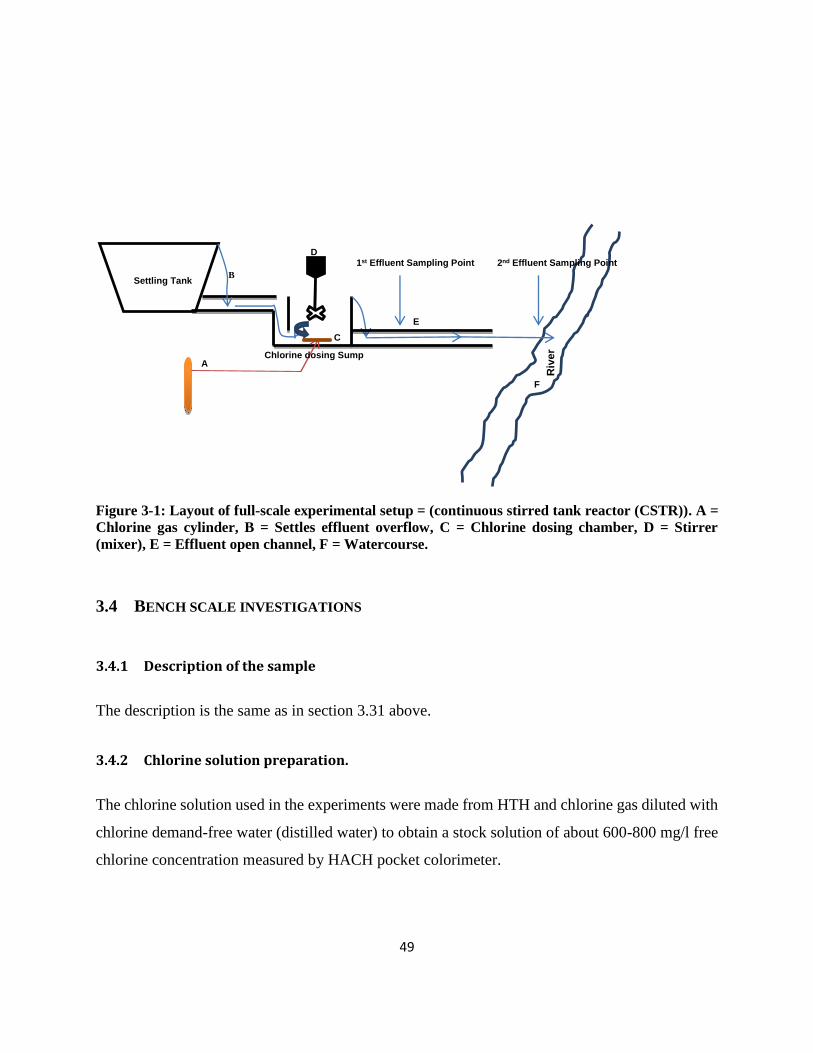
49
Figure 3-1: Layout of full-scale experimental setup = (continuous stirred tank reactor (CSTR)). A =
Chlorine gas cylinder, B = Settles effluent overflow, C = Chlorine dosing chamber, D = Stirrer
(mixer), E = Effluent open channel, F = Watercourse.
3.4 BENCH SCALE INVESTIGATIONS
3.4.1 Description of the sample
The description is the same as in section 3.31 above.
3.4.2 Chlorine solution preparation.
The chlorine solution used in the experiments were made from HTH and chlorine gas diluted with
chlorine demand-free water (distilled water) to obtain a stock solution of about 600-800 mg/l free
chlorine concentration measured by HACH pocket colorimeter.
Settling Tank B
Chlorine dosing Sump
D
F
E
Riv
er
A
C
1st Effluent Sampling Point 2nd Effluent Sampling Point

50
3.4.3 Chlorine Demand Tests
Two starch solution were prepared: (i) 0.025N sodium thiosulphate solution according to
the standard method for the examination of water and wastewater (1998) (section 2350B
(g)) and calcium hypochlorite (HTH = 65% m/v available chlorine) solutions.
The HTH solution was standardised according to the method in the Standard Methods for
the Examination of Water and Wastewater (1998) (section 2350B (g)) using 0.025N
sodium thiosulphate.
Volumetric flasks were filled with 100ml of primary effluent collected after settling tank
process unit (that is; unchlorinated sewage water).
Each flask was added with the determined volume of standardised HTH solution to give
chlorine dose concentration of 1, 2, 3, 4, 5, 6, 7, 8, 9, 10, 11, and 12 mg/l and the intervals
between additions was noted to be within 1 minute.
Immediately after adding the HTH solutions to each flask, the cap was screwed on and the
flask shaken. Thereafter, the flask was kept in a dark place for 30 minutes.
After 30 minutes, each flask was shaken again and a 10 ml sample was withdrawn and free
chlorine concentration measured using a HACH pocket colorimeter.
The chlorine demand was determined by plotting the chlorine residual (total chlorine
concentration) against the chlorine added and finding the point at which either the total
chlorine concentration approached zero, or the total chlorine residual started increasing pro
rata with the chlorine addition, indicating the breakpoint chlorination and chlorine demand
value.
These chlorine demand test was done each time before starting with each batch experiment.

51
3.4.4 Batch Chlorination Experiments
The experiment was conducted using primary effluent poured into 5 litre dark non-transparent
glass bottles and chlorinated by the addition of liquid chlorine depending on chlorine demand tests
done as indicated above in 3.4.3. These samples were then used to determine the effect of the
following on chlorine demand and E. coli disinfection efficiency:
Substances present in the water i.e. Chemical Oxygen Demand (COD) and ammonium;
Chlorine dosage concentration;
Suspended solids (turbidity); and
Contact time.
E. coli was used as an indicator organism because it is more faecal specific and can be analysed
quickly, efficiently and cost-effectively. Furthermore, E. coli is more resilient to chlorination than
other pathogens excreted in human faeces and is found more abundantly (Helbling & Van Briesen,
2007, Headley et al., 2013)
The effect of substances present in the water: the primary effluent from settling tank was spiked
with raw sewage to increase the concentration of the COD, Ammonia, Turbidity, Nitrate and
Nitrite in the effluent.
The effect of mixing: the same chlorine concentrations were dosed into three 5 litre dark glass
bottles filled up to 50% mark (that is; the bottle was half full). The mixing was provided by hands
shaken vessel/bottle to simulate turbulent flow as follows:
The first bottle was not mixed
The second bottle was mixed in a low intensive mix by gently shaking/swivelling it upside
down five times within 5 seconds.
52
The third bottle was mixed in a high intensive mix by vigorously shaking/swivelling it
upside down five times within 2.5 seconds.
All experiments were conducted in at least triplicate and the mean values are reported.
The above mixing methods are limited in simulating turbulent flow and do not involve the carrying
out of measurements to determine variation of the flow dynamics in a shaken geometry for
different operating conditions such as height, orbital shaking diameter, reactor inner diameter and
fluid viscosity.
The effect of increased substance concentration on E. coli inactivation.
Suspended solids (SS) influence the effectiveness of chlorination on the targeted bacteria.
Effluent samples from a secondary settling tank were spiked with sewage raw mixed liquor to
obtain a final SS concentration of 90 mg/l, which was the upper limit of the general discharge
effluent quality standard (Metcal & Eddy, 1991; 2004). The follow spike ratios were 1:3 and 1:7
of influent (raw) to secondary settling (humus) tank effluent. Blank sample investigations without
raw sewage spike were conducted as a background investigation.
Contact times established for the test of the effect of increased substance concentration on E. coli
inactivation was a minimum of 15 min. and maximum of 60 min. These contact times were
established for two reasons. First, 15 min. is the minimum contact time required by the U.S.
Environmental Protection Agency (EPA) for the chlorination process (Tyrrell, 1995). Secondly,
contact time of 60 min was chosen because the median contact time for chlorine disinfection in
most water treatment plants is 60 min (Li et al., 2011).

53
The effect of increased contact time and increased dosing concentration on E. coli inactivation.
The study investigated three representative initial chlorine dosages of 2, 4 and 6 mg/l, which satisfy
the microbial disinfection requirements as per prior chlorine demand test performed. For each
dosage concentration, investigations for 20 and 40 minutes contact times were analysed under
identical experimental conditions.
The effect of mixing on E. coli inactivation.
The effect of the mixing experiment was undertaken with a chlorine dosage range of 0 to 5 mg/l
and a sample was taken after 1, 2 and 3 minutes of contact time. The set of three experiments under
identical experimental conditions was conducted under the following mixing conditions:
No mixing
Mixing by gently shaking/swivelling it upside down twice within 5-7 seconds.
Mixing by vigorously shaking/swivelling it upside down five times within 2.5 seconds.
3.5 DATA ANALYSIS
All experiments were conducted in at least triplicate. Descriptive statistical analysis was
performed. Mean, range, mode and median values are reported.
Correlation for Burgersfort WWTW effluent quality with factors that affect disinfection as
independent variable and Chlorine demand as dependent variable was determined.

54
CHAPTER 4
4 RESULTS AND DISCUSSION
4.1 INTRODUCTION
This section contains the results of this study involving laboratory batch and full-scale
experiments. The results were used to validate the study hypothesis.
4.2 FULL-SCALE RESULTS AT THE BURGERSFORT WASTEWATER TREATMENT PLANT
4.2.1 Wastewater Treatment Works Performance
The following table 4-1 indicates the average basic chemical water quality of Burgersfort
wastewater treatment works influent (raw sewage) and settling tank effluent that were applicable
during the period of this study. The samples results were collected on monthly intervals from July
2011 to November 2013.
Table 4-1: The average basic chemical water quality of Burgersfort WWTWs influent and settling
tank effluent for the studied period (July 2011 – November 2013).
Sample Conductivity pH Nitrate COD Ammonia
General STD
(DWAF, 1999) ≤ 150 mS/m 5.5 -9.5 15mg/l 75mg/l 3mg/l
Influent 96.90 7.36 2.30 207.00 0.20
Settled effluent 87.70 7.21 3.40 144.00 0.17
Table 4-2 illustrates the E. coli Count at Burgersfort wastewater works following the onsite
application of chlorine at different dosage concentrations. Applied chlorine concentrations ranged
between 7.50 and 8.50 mg/l for the period July to August 2011, between 5.00 and 12.9 for the
period September 2011 to April 2012, between 3.80 and 6.90 mg/l for the period May to October

55
2012 and between 6.80 and 7.50 mg/l for the period November 2012 to March 2013. The mean
and mode values of applied chlorine before mixing that were applied at the chlorine dosing point
were 7.1 and 6.43 mg/l respectively. The data described above were collected before the
installation of mixing apparatus at the point of chlorination the experimental set-up of mixing at
the point of chlorination.
Table 4-2: E. coli Count and concentration of applied chlorine at Burgersfort wastewater works
effluent disinfection during the period July 2011 to March 2013.
Date
E. coli (Count/100ml) Applied Chlorine (mg/l)
STD Median Range Mean Range
July 2011 - Aug 2011 0 57.0 48 – 66 7.67 7.5 – 8.5
Sep 2011 - April 2012 0 2001 3 – 14450 7.70 5.00 - 12.9
May 2012 – Oct 2012 0 1500 10 - 67900 5.90 3.80 – 6.90
Nov 2012 – Mar 2013 0 272.5 64 - 2005 7.20 6.80 – 7.50
During the warm period between September 2011 and April 2012 chlorine dosages were higher
than during the cold season. The warm season typically influences a higher application of chlorine
at this specific plant since the dosing channel and contact tank are exposed to the outside
environment. Exposure to the environment results in decreased disinfection which then leads to a
need for increased chlorine dosage. However, the possibility of inadequate control and operation
of the chlorination system could have contributed as well.
Table 4-3 illustrates the E. coli Count and concentration of the applied chlorine at the Burgersfort
wastewater works after mixing was applied at the point of chlorination from April to November
2013. Applied chlorine concentration ranged from 3.0 to 7.5 mg/l, with a mean and mode value of
4.30 and 3.00 mg/l respectively. The chlorine dose requirement was significantly reduced by
almost 50% compared to the dosage required when mixing was not applied (Table 4-2). It must be
noted that, a zero (0) E. coli Count was achieved when mixing was applied on site (Table 4-3).
Table 4-3: E. coli Count and concentration of applied chlorine at Burgersfort wastewater works
during the period April 2013 to November 2013 when mixing was applied.
Date
E. coli (Count/100ml) Applied Chlorine (mg/l)
STD Median Range Mean Range
April 2013 – Nov. 2013 0 2.0 0.0 - 88 4.30 3.0 – 7.5
56
Table 4-4 shows the monthly effluent quality results obtained at the accredited laboratory for
compliance monitoring requirements. The table shows the temperature and chlorine dosage, as
well as E. coli Count and chlorine residual in the effluent at the Burgersfort WWTW for the period
July 2011 to November 2013. Mean concentration of chlorine residual discharged into the
environmet shows a reduction of over 80% (that is; 0.57 mg/l and 0.081 mg/l before and after
mixing respectively). The results also show that the chlorine dosage and E. coli inactivation were
significantly reduced and improved (40% and 95%) respectively when mixing was applied at the
chlorination sump on site. This was achieved irrespective of the impact of other common factors
that influence the action of disinfectants. The dosage of chlorine after mixing was implemented
even below the mean determined chlorine demand of 6.5 mg/l (Figure 4-6).

57
Table 4-4: Monthly monitored effluent quality data for the Burgersfort Wastewater Works.
DATE Temperature E. coli Cl2 residual Cl2 dosed Comment
2011/07/12 12 48 * 8.0
BE
FO
RE
MIX
ING
2011/08/10 19 66 1.2 8.0
2011/09/06 18 201 * 6.1
2011/10/11 24 2001 * 6.4
2011/10/25 25 2001 * 5.4
2011/11/08 21 14450 * 5.9
2011/11/22 22 4400 0.33 10.4
2011/12/13 21 62 0.56 12.9
2011/12/20 24 3 0.5 6.4
2012/01/11 22 201 * 10.3
2012/01/24 22 10900 * 5.0
2012/02/14 19 624 * 7.3
2012/03/13 21 4780 0.6 7.7
2012/03/27 20 2220 0.46 8.7
2012/04/10 18 530 0.55 7.4
2012/05/08 16 238 * 6.4
2012/05/30 18 4530 0.5 6.6
2012/06/12 14 1500 0.55 5.7
2012/07/11 16 100 0.65 6.1
2012/08/02 15 67900 * 3.8
2012/08/28 16 2380 * 6.6
2012/09/25 19 74 0.82 6.9
2012/10/09 22 20050 0.55 5.3
2012/10/30 21 10 0.47 5.7
2012/11/27 24 344 0.55 7.0
2012/12/11 21 64 * 7.4
2012/12/18 26 2005 0.75 6.8
2013/01/15 25 384 0.6 7.5
2013/01/29 24 201 * 7.2
2013/02/12 20 87 * 7.2
2013/03/09 26 88 0.02 7.4
2013/03/26 23 0 0.05 7.5
2013/04/16 21 34 0 5.1
AF
TE
R M
IXIN
G
2013/05/14 18 2 0.02 4.0
2013/06/11 19 0 0.11 3.5
2013/07/09 20 0 0.16 3.2
2013/08/13 22 5 0.1 3.0
2013/09/10 19 0 0.2 3.1
2013/10/08 23 13 0.03 3.0
2013/11/12 25 2 0.06 3.0
Median and Mean reading Before Mixing 1500 0.57 7.12
Median and Mean reading After Mixing 2.0 0.0081 4.30
* No reading taken
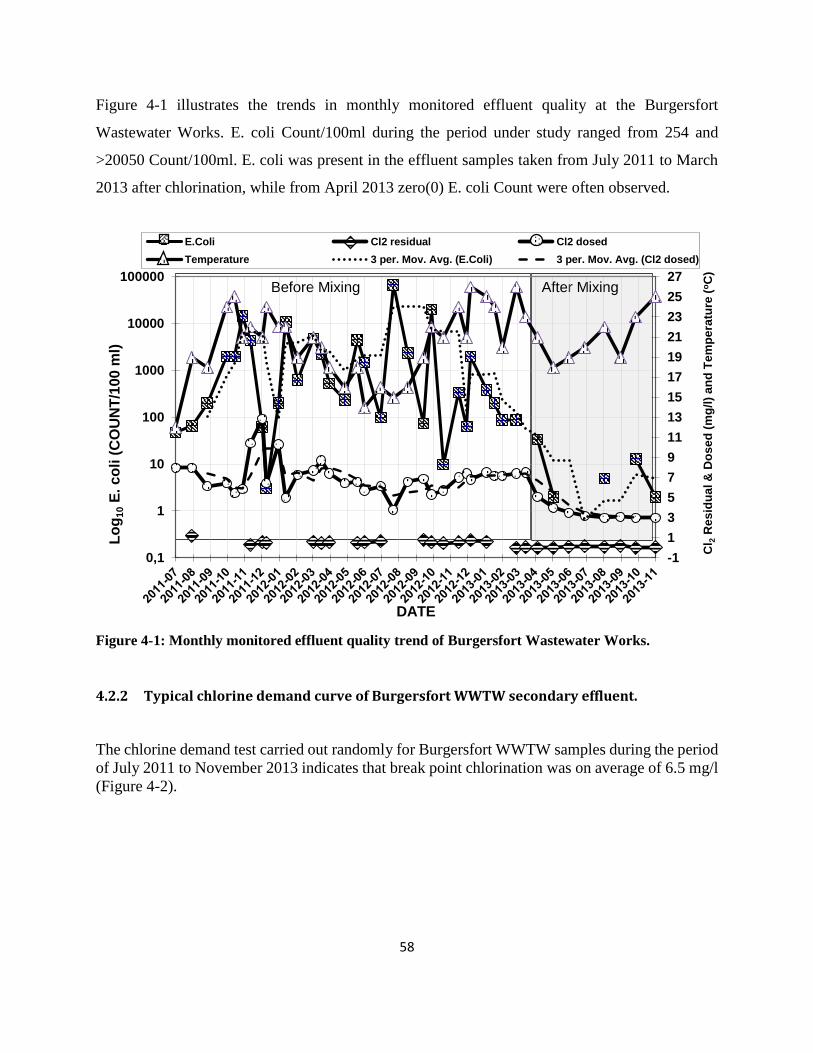
58
After Mixing Before Mixing
Figure 4-1 illustrates the trends in monthly monitored effluent quality at the Burgersfort
Wastewater Works. E. coli Count/100ml during the period under study ranged from 254 and
>20050 Count/100ml. E. coli was present in the effluent samples taken from July 2011 to March
2013 after chlorination, while from April 2013 zero(0) E. coli Count were often observed.
Figure 4-1: Monthly monitored effluent quality trend of Burgersfort Wastewater Works.
4.2.2 Typical chlorine demand curve of Burgersfort WWTW secondary effluent.
The chlorine demand test carried out randomly for Burgersfort WWTW samples during the period
of July 2011 to November 2013 indicates that break point chlorination was on average of 6.5 mg/l
(Figure 4-2).
-1
1
3
5
7
9
11
13
15
17
19
21
23
25
27
0,1
1
10
100
1000
10000
100000
Cl 2
Res
idu
al &
Do
se
d (
mg
/l)
an
d T
em
pe
ratu
re (
oC
)
Lo
g1
0E
. c
oli
(C
OU
NT
/100
ml)
DATE
E.Coli Cl2 residual Cl2 dosed
Temperature 3 per. Mov. Avg. (E.Coli) 3 per. Mov. Avg. (Cl2 dosed)

59
Figure 4-2: Typical chlorine demand curve at the Burgersfort WWTW secondary effluent (chlorine
demand between 6-7 mg/l).
4.2.3 Correlations between Chlorine Demand and Other Determinants.
A regression analysis was done with subscales of water quality parameters, such as temperature,
COD, ammonia nitrogen, and suspended solids/turbidity as independent variables and the subscale
of chlorine demand as dependent variable. Regression analysis provides estimates of the mean
amount by which a dependent variable changes when there is a change by one unit or the other of
an independent variable. A mathematical equation was generated that exhibit how the variation in
chlorine demand can be explained by the variation in each of the water quality parameters listed
above, that is; temperature, COD, ammonia nitrogen and suspended solids/turbidity.
An important output of regression analysis is the multiple correlation coefficient, R2, which
indicates how well data fit a statistical model. The accuracy of an estimate of this nature depends
on the extent to which the regression equation actually fit the data, and the accuracy of the
regression line depends on the degree of scatter in the data.
0
0,2
0,4
0,6
0,8
1
1,2
1,4
1,6
1,8
2
0 2 4 6 8 10 12 14
Res
idu
al C
hlo
rin
e (m
g/l)
Chlorine Dose (mg/l)
Chlorine Demand
Bre
akpoin
t C
hlo
rin
atio
n (
6.5
mg/l)

60
The following results were analysed to establish the relationship between chlorine demand and
temperature, COD, ammonia nitrogen and suspended solids/turbidity respectively. The analysis
was performed on onsite chlorine demand tests on effluent sampled at the Burgersfort Wastewater
Treatment Works over the period of July 2011 to February 2013:
Figure 4-3 shows a fair positive correlation between temperature and chlorine demand, that is; that
only a 30.8 percent (that is; R2 = 0.3079) variation in chlorine demand can be explained by
temperature.
Figure 4-3: Correlation for Burgersfort WWTW effluent quality with temperature as independent
variable and Chlorine demand as dependent variable.
In Figure 4-4, the results show a significant degree of scatter in the data and a weak positive
correlation between COD concentration in the effluent and chlorine demand that is only a 21
percent variation in chlorine demand can be explained by the COD concentration in the effluent.
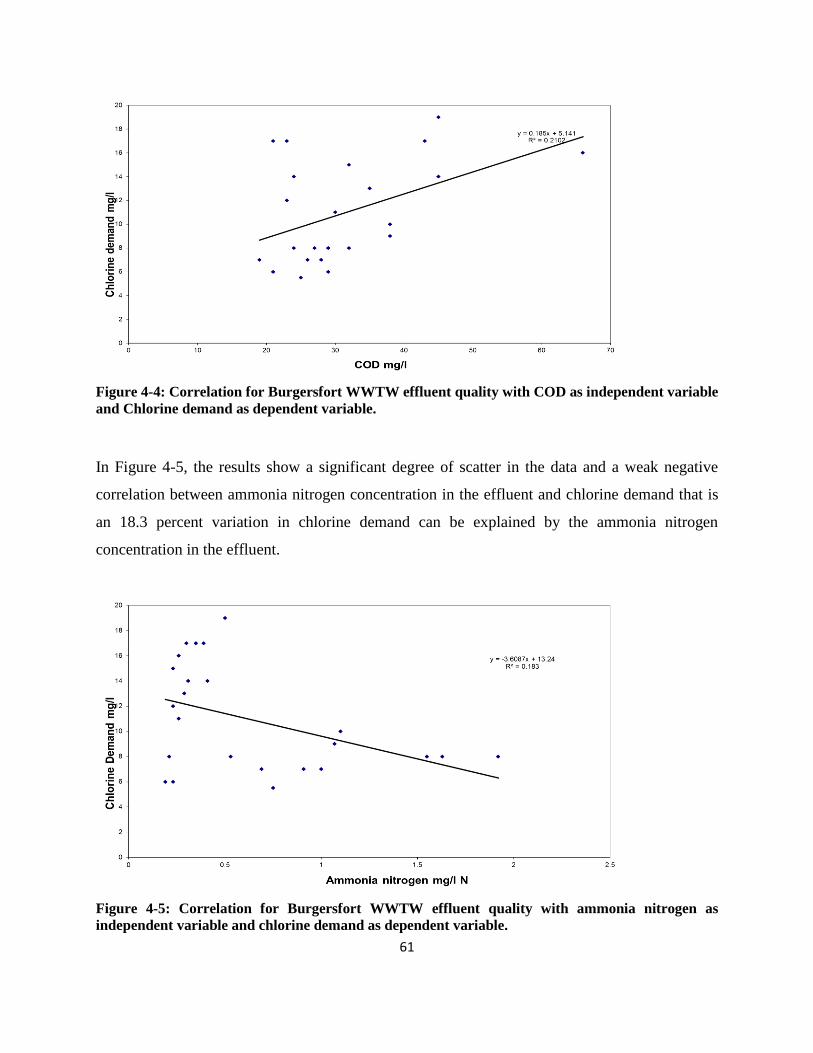
61
Figure 4-4: Correlation for Burgersfort WWTW effluent quality with COD as independent variable
and Chlorine demand as dependent variable.
In Figure 4-5, the results show a significant degree of scatter in the data and a weak negative
correlation between ammonia nitrogen concentration in the effluent and chlorine demand that is
an 18.3 percent variation in chlorine demand can be explained by the ammonia nitrogen
concentration in the effluent.
Figure 4-5: Correlation for Burgersfort WWTW effluent quality with ammonia nitrogen as
independent variable and chlorine demand as dependent variable.

62
Figure 4-6 shows a higher degree of scatter in the data as compared to the other determinants tested
(temperature, COD, ammonia nitrogen). The results also show a very weak positive correlation
between suspended solids and chlorine demand that is only a 2.8 percent variation in chlorine
demand can be explained by the concentration of suspended solids in the effluent.
Figure 4-6: Correlation for Burgersfort WWTW effluent quality with suspended solids as
independent variable and chlorine demand as dependent variable.
4.2.4 Study Correlations of Chlorine Dosed and E. coli inactivation
Figure 4-7 shows a goog correlation between chlorine dosed and E. coli in the effluent, that is 55.8
percent (that is; R2 = 0.558) variation in E. coli inactivation can be explained by Chlorine dosed.

63
Figure 4-7: Correlation for Burgersfort WWTW effluent quality with chlorine dosed as independent
variable and E. coli as dependent variable.
4.3 LABORATORY INVESTIGATIONS: BURGERSFORT WASTEWATER TREATMENT
PLANT
This laboratory batch scale experiment was aimed at determining ways of improving the
microorganism inactivation at a dosage concentration less than the chlorine demand and to
establish factors affecting the optimisation of chlorine disinfection.
4.3.1 Chlorine demand experiments
Table 4-5 and Figure 4-8, 4-9 and 4-10) show the chlorine demand experiments carried out in
triplicate for the same sample when performing these experiments indicates that break point
chlorination was in the range of 6-7 mg/l.
y = 1497,1x2 - 27801x + 121993R² = 0,558
0
2000
4000
6000
8000
10000
12000
14000
16000
18000
20000
0,0 2,0 4,0 6,0 8,0 10,0 12,0 14,0
Eff
lue
nt
E. c
oli
(C
OU
NT
/10
0m
l)
Chlorine dosed mg/l

64
Table 4-5: Chlorine demand data at the Burgersfort WWTW secondary effluent
Chlorine Dose (mg/l) Chlorine residual (mg/l)
Test 1 Test 2 Test 3
0 0 0 0
1 0,19 0,05 0,12
2 0,29 0,26 0,21
3 0,51 0,6 0,39
4 0,73 0,68 0,71
5 0,76 0,8 0,78
6 0,49 0,44 0,52
7 0,46 0,43 0,41
8 0,54 0,47 0,45
9 0,69 0,65 0,75
10 0,89 0,69 0,88
11 1,46 0,98 1,03
12 1,75 1,45 0,87
Figure 4-8: Test 1 chlorine demand curve at the Burgersfort WWTW secondary effluent (chlorine
demand of 6.5 mg/l).
0
0,2
0,4
0,6
0,8
1
1,2
1,4
1,6
1,8
2
0 2 4 6 8 10 12 14
Res
idu
al C
hlo
rin
e (
mg/
l)
Chlorine Dose (mg/l)
Chlorine Demand
Bre
akpoin
t C
hlo
rin
atio
n (
6.5
mg/l)

65
Figure 4-9: Test 2 chlorine demand curve at the Burgersfort WWTW secondary effluent (chlorine
demand of 6.0 mg/l).
Figure 4-10: Test 3 chlorine demand curve of Burgersfort WWTW secondary effluent (chlorine
demand of 7.0 mg/l).
0
0,2
0,4
0,6
0,8
1
1,2
1,4
1,6
0 2 4 6 8 10 12 14
Res
idu
al C
hlo
rin
e (m
g/l)
Chlorine Dose (mg/l)
Chlori…
0
0,2
0,4
0,6
0,8
1
1,2
0 2 4 6 8 10 12 14
Res
idu
al C
hlo
rin
e (m
g/l)
Chlorine Dose (mg/l)
Chlori…
Bre
akpoin
t C
hlo
rination
(6.0
mg
/l)
Bre
akpoin
t C
hlo
rin
atio
n (
7.0
mg
/l)
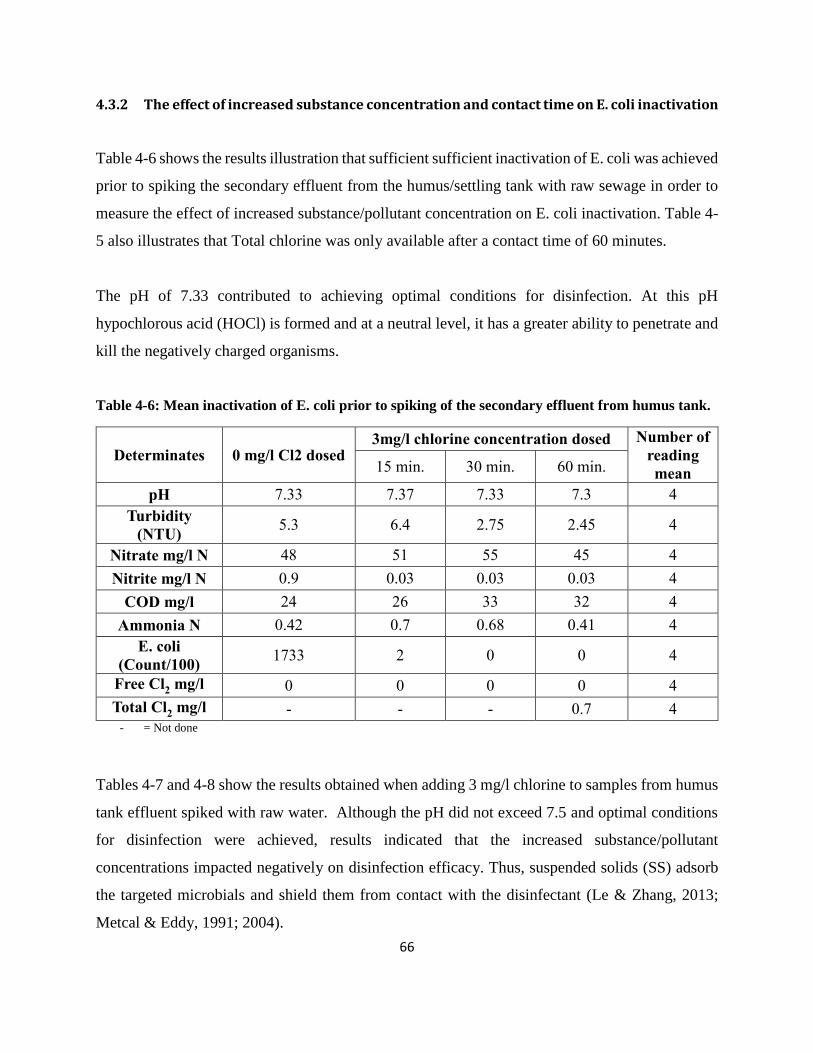
66
4.3.2 The effect of increased substance concentration and contact time on E. coli inactivation
Table 4-6 shows the results illustration that sufficient sufficient inactivation of E. coli was achieved
prior to spiking the secondary effluent from the humus/settling tank with raw sewage in order to
measure the effect of increased substance/pollutant concentration on E. coli inactivation. Table 4-
5 also illustrates that Total chlorine was only available after a contact time of 60 minutes.
The pH of 7.33 contributed to achieving optimal conditions for disinfection. At this pH
hypochlorous acid (HOCl) is formed and at a neutral level, it has a greater ability to penetrate and
kill the negatively charged organisms.
Table 4-6: Mean inactivation of E. coli prior to spiking of the secondary effluent from humus tank.
Determinates 0 mg/l Cl2 dosed 3mg/l chlorine concentration dosed Number of
reading
mean 15 min. 30 min. 60 min.
pH 7.33 7.37 7.33 7.3 4
Turbidity
(NTU) 5.3 6.4 2.75 2.45 4
Nitrate mg/l N 48 51 55 45 4
Nitrite mg/l N 0.9 0.03 0.03 0.03 4
COD mg/l 24 26 33 32 4
Ammonia N 0.42 0.7 0.68 0.41 4
E. coli
(Count/100) 1733 2 0 0 4
Free Cl2 mg/l 0 0 0 0 4
Total Cl2 mg/l - - - 0.7 4 - = Not done
Tables 4-7 and 4-8 show the results obtained when adding 3 mg/l chlorine to samples from humus
tank effluent spiked with raw water. Although the pH did not exceed 7.5 and optimal conditions
for disinfection were achieved, results indicated that the increased substance/pollutant
concentrations impacted negatively on disinfection efficacy. Thus, suspended solids (SS) adsorb
the targeted microbials and shield them from contact with the disinfectant (Le & Zhang, 2013;
Metcal & Eddy, 1991; 2004).

67
Table 4-7: The effect of increased substance/pollutant concentration on E. coli inactivation in samples
spiked with raw sewage (influent) at a 1:7 (Influent: humus tank effluent) ratio; chlorine dosed at
3mg/l
Determinates 0 mg/l Cl2 dosed 3 mg/l chlorine concentration dosed Number of
reading
mean 15 min. 30 min. 60 min.
pH 7.44 7.45 7.51 7.27 4
Turbidity
(NTU) 7.87 15.4 21.2 18.2 4
Nitrate mg/l N 34 38 40 40 4
Nitrite mg/l N 3 1 0.03 0.03 4
COD mg/l - 80 59 96 4
Ammonia N
mg/l 11 11.4 11.2 11.25 4
E. coli
(Count/100) >2420 4 0 6 4
Free Cl2 mg/l 0 0 0 0 4
Total Cl2 mg/l - - - 0.45 4
- = Not done
Table 4-8: The effect of increased substance/pollutant concentration on E. coli inactivation in samples
spiked with raw sewage (influent) at a 1:3 (Influent: humus tank effluent) ratio; chlorine dosed at
3mg/l
Determinates 0 mg/l Cl2 dosed 3 mg/l chlorine concentration dosed Number of
reading
mean 15 min. 30 min. 60 min.
pH 7.45 7.53 7.43 7.4 4
Turbidity
(NTU) 24.9 34.1 32.2 34.1 4
Nitrate mg/l N 16 22 22 30 4
Nitrite mg/l N 8.8 7.5 7.5 2.8 4
COD mg/l - 134 140 140 4
Ammonia N
mg/l 22.5 23.75 24.3 23.75 4
E. coli
(Count/100) >2420 8 2 5 4
Free Cl2 mg/l 0 0 0 0 4
Total Cl2 mg/l - - - 0.04 4
- = Not done
68
As shown when comparing Tables 4-6, 5-7 and 4-8, the concentration of various
substances/pollutants increased with the addition of raw water. It is expected that the chlorine
demand would also increase and that a higher chlorine dose would be required to achieve the same
results had this increase not occurred. The effect of increased contact time under these
circumstances was found to be negligible as total chlorine was evident after 60 minutes of chlorine
dosage irrespective of the degree of pollution. As can be seen in the E. coli count after 60 minutes
of disinfection in Table 4-7 and Table 4-8.the detection of E. coli after 30 minutes of disinfection
could be due to one or a combination of the following factors:
Increased suspended solids (turbidity) shielding bacteria (E. coli) and thus less effective
disinfection;
Increased nitrite concentration after spiking and thus an increased chlorine demand needed
to oxidize the nitrite into nitrate (see Equation 4-1). This is also indicated by the decrease
in nitrites and increase in nitrates after chlorination (Tables 4-7 and 4-8):
Nitrite was oxidised to nitrate by chlorine.
NO2- + H2O + Cl2 → NO3- + 2HCl 4-1
With the increased chlorine demand, there was likely less chlorine for disinfection.
The number of organisms present also increased with spiking. Although the concentration
of organisms is seldom a major consideration, longer contact times are required for larger
organism concentrations.
The inactivation rates of indicator organisms in sample prior to spiking of the secondary
effluents were markedly similar to those found in secondary effluent samples spiked with
raw sewage (Influent). Table 4-7 and 4-8 show that the optimum contact time for
inactivation is at 30 minutes contact time. The E. coli counts show increase at 60 minutes
contact time and this could be due to shielding effect on microorganism by suspended
69
solids in the water, in which microorganism started to move out of lasting shields and/or
microorganism clumps as contact time increases beyond 30 minutes.
i. Macauley et al. (2006) in their study of disinfection of swine wastewater using chlorine
found that bacteria inactivation was slightly more effective in the centrifuge sample than
in the raw sample. This indicates that the suspended solids did inhibit bacteria inactivation,
but the inhibition was not significant.
ii. Li and Zhang (2013) in their study found that inactivation behaviours of the target
antibiotics under ammonia nitrogen concentrations ranging from 2 to 15 mg/l were
characterised by a rapid initial inactivation rate on contact with free chlorine during the
first 5 seconds to 1 minute (depending on the specific antibiotic and ammonia nitrogen
concentration) and then a much slower inactivation rate. Free chlorine was responsible for
the reaction with antibiotics during the rapid stage (first 5 sec. to 1 min.), whereas combined
chlorine reacted with antibiotics in the subsequent slow stage.
4.3.3 The effect of increased contact time and increased dosing concentration on E. coli
inactivation
Table 4-9 shows the effect of increased dosage concentrations and increased contact time (CT
value) on E. coli inactivation efficiency. Depending on the concentration of residual chlorine,
microorganisms that were not in contact with (or exposed to) chlorine during dosing would be
deactivated by the available chlorine residual during increased contact time. The chlorine demand
carried out in triplicate for the same sample when performing these experiments was found to be
in the range of 6-7 mg/l.
The maximum HRT to achieve complete inactivation of E. coli is 2.5 min, corresponding with the
initial E. coli concentration of 108 Count/100 ml (Nanayakkara et al., 2012).

70
Table 4-9: Effect of increased chlorine dosing concentration and contact time (CT value) on E. coli
inactivation.
Determinates
Humus
Tank
2mg/l [Cl2]
dosed
4mg/l [Cl2]
dosed
6mg/l [Cl2]
dosed Number of
reading
mean 20
min.
40
min.
20
min.
40
min.
20
min.
40
min.
pH 7.16 7.14 7.13 7.11 6.98 7 6.93 5
Nitrite mg/l N 0.56 0.34 0.33 0.10 0.03 0.03 0.03 5
E. coli
(Count/100) >2420 411 16 4 0 0 0 5
Free Chlorine - 0 0 0 0 0.03 0.01 5
Total Chlorine - 0.22 0.20 0.38 0.56 0.74 0.71 5 - = Not done
Because hypochlorous acid is very active oxidizing agent, it reacts readily with ammonia in the
wastewater to form three types of chloramines in the successive reaction depending on the pH,
temperature, contact time and ratio of chlorine to ammonia. With higher concentrations of
ammonia present after spiking, chloramines are probably formed. If the ammonia-N concentration
in the effluent is greater than the nitrite-N concentration, which was the case in the samples
analysed, the residual will probably form monochloramine and be stable (Phoenix 1995). The
formation of chloramines, which are more effective over longer periods of time, could also have
contributed to the further inacativation rates obtained with increased contact times. Ammonia plays
a critical role during chlorination because of its competition with antibiotics for free chlorine to
form combined chlorine, which reacts slowly with these antibiotics (Li & Zhang, 2013).
For all sets of initial conditions, chlorine demand increases with increasing contact time and
approaches a constant value, the ultimate chlorine demand (Helbling & Van Briesen, 2007).
4.3.4 The effect of mixing on E. coli inactivation
Table 4-10 and 4-11 shows the effect of mixing on the inactivation of E. coli bacteria. The table
shows that contact time is important for E. coli inactivation where no mixing is applied. The results
show a relationship between the mixing (no mixing, gently mixing and vigorous mixed), dosing

71
concentration and contact time. It would thus be possible for operational staff at the treatment
works to determine a cost-effective application for specific circumstances. During mixing, chlorine
is consumed by nitrite and ammonia while simultaneously inactivating (killing) microorganisms
and lower chlorine concentrations are consequently required. This shows that mixing increases the
exposure of microorganisms to free chlorine before it reacts with disinfection competing organics
and chemicals in the effluent, which results in the inactivation of bacteria at relatively low chlorine
doses. This finding is contrary to the finding by Jeong et al. (2006) who reported a reduction in
the disinfection efficiency with an increase in the initial population of E. coli in the electrochemical
inactivation of E. coli in KH2PO4. Their study suggests that the consumption of oxidants is higher
if the initial concentration of bacteria was high. They concluded that the chlorine produced is
consumed by the microorganisms, while this study shows that inactivation of microorganisms
depends on the microorganism’s exposure and/or contact with chlorine and is independent of the
initial concentration of microorganism and chlorine. Le and Zhang (2013) also found a rapid initial
inactivation rate of antibiotics upon contact with free chlorine. The free chlorine was responsible
for the reaction with antibiotics during the rapid stage (first 5 sec - 1 min), whereas combined
chlorine reacted with antibiotics in the subsequent slow stage.
Table 4-10 shows the results of the effect of mixing, contact time and chlorine concentration on
actual detected E. coli concentration inactivated and residual E. coli concentration after
inactivation.
Table 4-10: Effect of mixing, contact time and chlorine concentration on E. coli Inactivation
Dosed Cl2
Concentrations
E. Coli Concentration (Count/100ml) Number of
reading
mean
(Observation)
No mixing Gently Mixed
(low intensity)
Vigorously Mixed
(high intensity)
1min 2min 3min 1min. 2min. 3min. 1min. 2min. 3min.
0 mg/l 2420 2420 2420 2420 2420 2420 2420 2420 2420 2
1 mg/l 812 600 641 493 496 493 25 16 16 4
2 mg/l 520 411 399 20 24 11 4 0 2 4
3 mg/l 603 364 320 8 4 4 0 0 0 4
4 mg/l 431 294 111 6 2 4 2 0 0 4
5 mg/l 387 200 89 2 2 0 0 0 0 4

72
Table 4-11 shows the results of the effect of mixing, contact time and chlorine concentration on
Log10 E. coli inactivation and free residual chlorine. Free residual chlorine was only detected in
the samples where no mixing of chlorine dosed with effluent was applied. In a no-mixing system,
free residual chlorine increased from 0 mg/l to 0.21 mg/l respectively as chlorine doses were
increased from 0 mg/l to 5 mg/l. However, as the contact time increased from one minute to 3
minutes the free residual chlorine also proportionately reduced.

Table 4-11: Effect of mixing, contact time and chlorine concentration on Log10 E. coli inactivation.
Do
se
[Cl 2
]
Mixing intensity and contact time
Nu
mb
er o
f rea
din
g m
ea
n
(Ob
serva
tio
n)
No mixing Gently mixed (low intensity) Vigorously mixed (high intensity)
1min 2min 3min 1min. 2min. 3min. 1min. 2min. 3min.
Lo
g10 E
. co
li
(Co
un
t/1
00
ml)
Fre
e C
l 2 (
mg
/l)
Lo
g10 E
. co
li
(Co
un
t/1
00
ml)
Fre
e C
l 2 (
mg
/l)
Lo
g10 E
. co
li
(Co
un
t/1
00
ml)
Fre
e C
l 2 (
mg
/l)
Lo
g10 E
. co
li
(Co
un
t/1
00
ml)
Fre
e C
l 2 (
mg
/l)
Lo
g10 E
. co
li
(Co
un
t/1
00
ml)
Fre
e C
l 2 (
mg
/l)
Lo
g10 E
. co
li
(Co
un
t/1
00
ml)
Fre
e C
l 2 (
mg
/l)
Lo
g10 E
. co
li
(Co
un
t/1
00
ml)
Fre
e C
l 2 (
mg
/l)
Lo
g10 E
. co
li
(Co
un
t/1
00
ml)
Fre
e C
l 2 (
mg
/l)
Lo
g10 E
. co
li
(Co
un
t/1
00
ml)
Fre
e C
l 2 (
mg
/l)
0 mg/l 3.38 0 3.38 0 3.38 0 3.38 0 3.38 0 3.38 0 3.38 0 3.38 0 3.38 0 2
1 mg/l 2.91 0 2.78 0 2.81 0 2.69 0 2.70 0 2.69 0 1.40 0 1.20 0 1.20 0 4
2 mg/l 2.72 0.1 2.61 0 2.60 0 1.30 0 1.38 0 1.04 0 0.60 0 # 0 2.00 0 4
3 mg/l 2.78 0.03 2.56 0.03 2.51 0.02 0.90 0 0.60 0 0.60 0 # 0 # 0 # 0 4
4 mg/l 2.63 0.13 2.47 0.09 2.05 0.08 0.78 0 0.30 0 0.60 0 0.30 0 # 0 # 0 4
5 mg/l 2.59 0.21 2.30 0.23 1.95 0.09 0.30 0 0.30 0 # 0 # 0 # 0 # 0 4
73
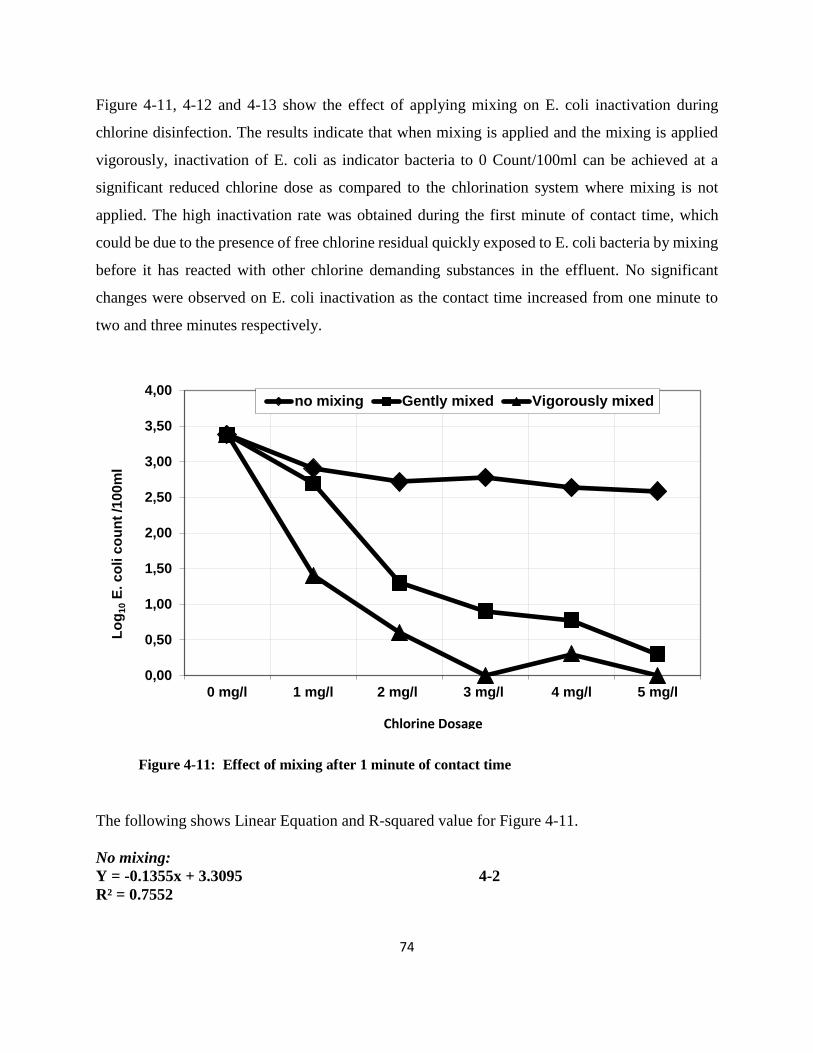
74
Figure 4-11, 4-12 and 4-13 show the effect of applying mixing on E. coli inactivation during
chlorine disinfection. The results indicate that when mixing is applied and the mixing is applied
vigorously, inactivation of E. coli as indicator bacteria to 0 Count/100ml can be achieved at a
significant reduced chlorine dose as compared to the chlorination system where mixing is not
applied. The high inactivation rate was obtained during the first minute of contact time, which
could be due to the presence of free chlorine residual quickly exposed to E. coli bacteria by mixing
before it has reacted with other chlorine demanding substances in the effluent. No significant
changes were observed on E. coli inactivation as the contact time increased from one minute to
two and three minutes respectively.
The following shows Linear Equation and R-squared value for Figure 4-11.
No mixing:
Y = -0.1355x + 3.3095 4-2
R² = 0.7552
0,00
0,50
1,00
1,50
2,00
2,50
3,00
3,50
4,00
0 mg/l 1 mg/l 2 mg/l 3 mg/l 4 mg/l 5 mg/l
Lo
g10
E. c
oli c
ou
nt
/10
0m
l
no mixing Gently mixed Vigorously mixed
Chlorine Dosage
Figure 4-11: Effect of mixing after 1 minute of contact time
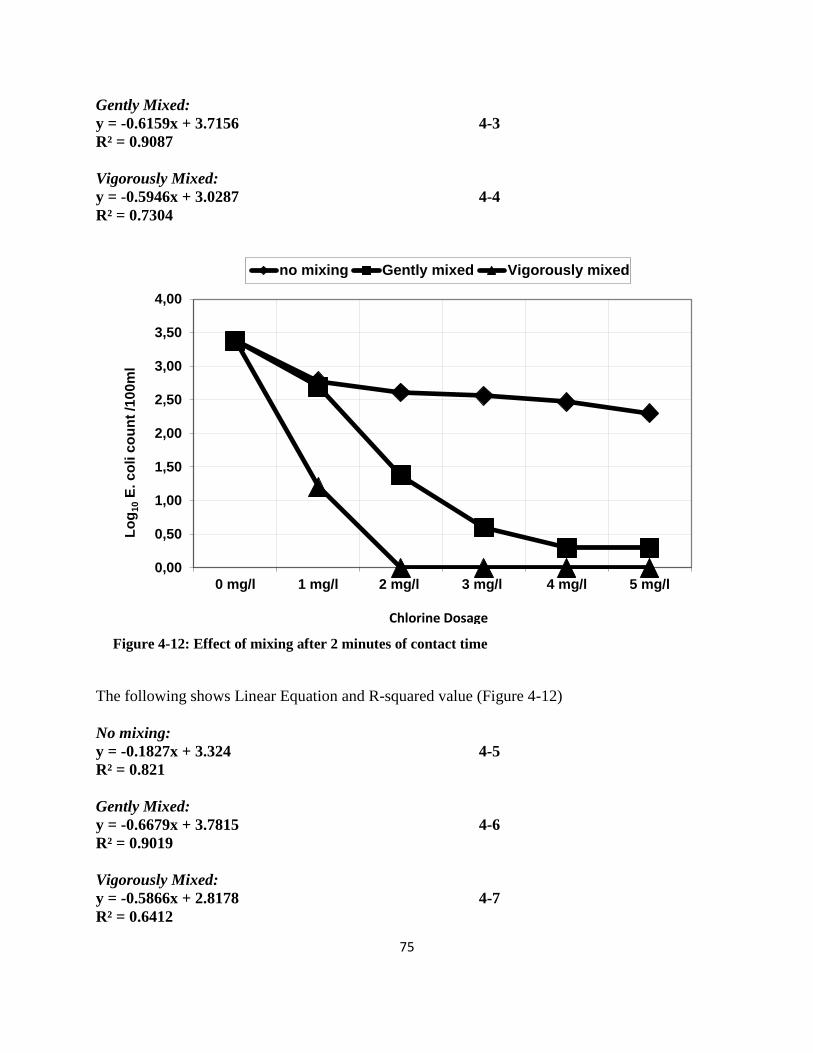
75
Gently Mixed:
y = -0.6159x + 3.7156 4-3
R² = 0.9087
Vigorously Mixed:
y = -0.5946x + 3.0287 4-4
R² = 0.7304
The following shows Linear Equation and R-squared value (Figure 4-12)
No mixing:
y = -0.1827x + 3.324 4-5
R² = 0.821
Gently Mixed:
y = -0.6679x + 3.7815 4-6
R² = 0.9019
Vigorously Mixed:
y = -0.5866x + 2.8178 4-7
R² = 0.6412
0,00
0,50
1,00
1,50
2,00
2,50
3,00
3,50
4,00
0 mg/l 1 mg/l 2 mg/l 3 mg/l 4 mg/l 5 mg/l
Lo
g10
E. c
oli c
ou
nt
/10
0m
l
no mixing Gently mixed Vigorously mixed
Figure 4-12: Effect of mixing after 2 minutes of contact time
Chlorine Dosage
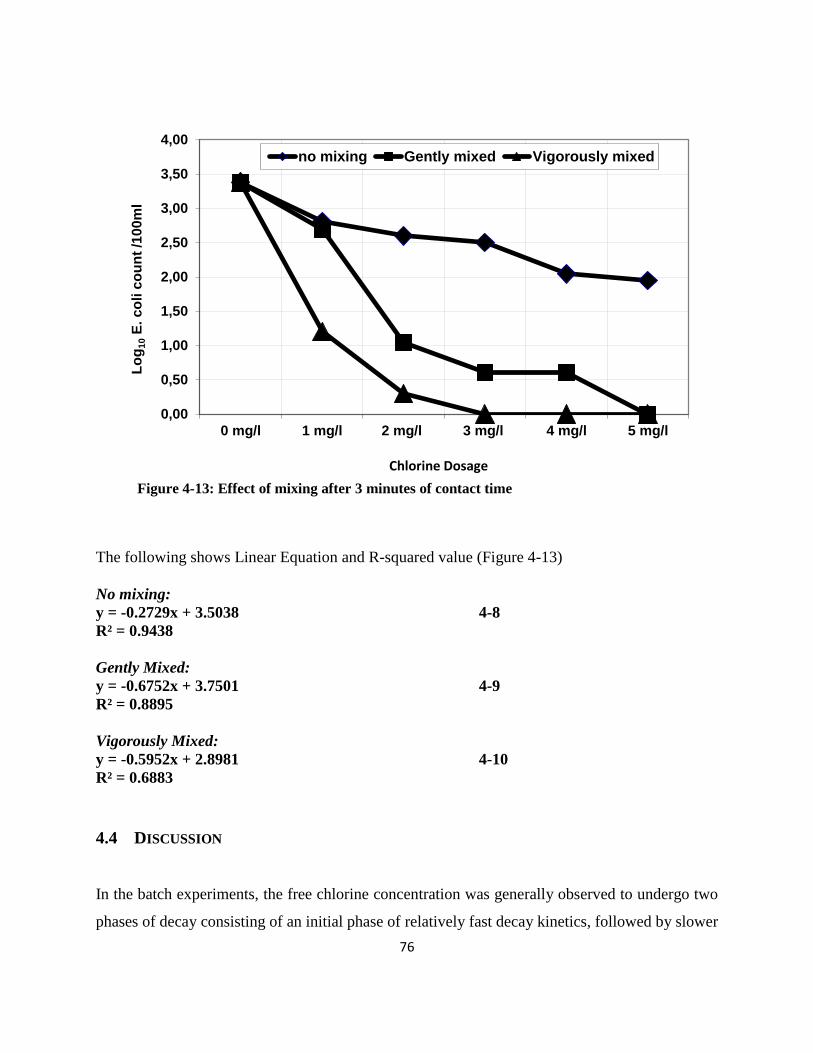
76
The following shows Linear Equation and R-squared value (Figure 4-13)
No mixing:
y = -0.2729x + 3.5038 4-8
R² = 0.9438
Gently Mixed:
y = -0.6752x + 3.7501 4-9
R² = 0.8895
Vigorously Mixed:
y = -0.5952x + 2.8981 4-10
R² = 0.6883
4.4 DISCUSSION
In the batch experiments, the free chlorine concentration was generally observed to undergo two
phases of decay consisting of an initial phase of relatively fast decay kinetics, followed by slower
0,00
0,50
1,00
1,50
2,00
2,50
3,00
3,50
4,00
0 mg/l 1 mg/l 2 mg/l 3 mg/l 4 mg/l 5 mg/l
Lo
g10
E. c
oli c
ou
nt
/10
0m
l
no mixing Gently mixed Vigorously mixed
Figure 4-13: Effect of mixing after 3 minutes of contact time
Chlorine Dosage

77
decomposition (Page et al, 2009). However, most wastewater treatment plants employing
chlorination add the chlorine as an aqueous solution through a diffuser at the head of a chlorine
contact basin with little or no effective mixing. Before the chlorine stream is thoroughly mixed
with the mass of incoming wastewater under these transport conditions, reactions competing with
the disinfection process result in the formation of chloramines, other by-products and a rapid
depletion of free chlorine (Longley, 1978).
Tables 4-10 and 4-11 showed that inactivation occur at two rates, an initial rapid kill followed by
a slower kill. For each applied chlorine dose, the highest inactivation rate was obtained during the
first one minute of contact time, which could be due to the presence of free chlorine residual that
had not yet reacted with chlorine demanding substances. The subsequent slower kill can possibly
be attributed to the formation of less potent combined chlorine residual as a result of reactions
between free chlorine residual and chlorine demanding substances (mainly NH3).
Mixing, in this study, has been proven to be another important factor for chlorine disinfection
among those that are well documented to date (including contact time, concentration and type of
chemical agent, intensity and nature of physical agent, pH, temperature, number of organisms,
type of organisms, age of the organisms, nature of suspending liquid and chlorine demand). The
importance of mixing was also put in proper perspective in the study by Longley (1978). This
study revealed that rapid mixing of chlorine with wastewater may achieve the required degree of
disinfection by using less chlorine, and this will result in significant savings in chlorine dosing.
This proposition was confirmed in this study by tests conducted in a full-scale investigation (Table
4-4), where the chlorine dosage required to inactivate E. coli at the Burgersfort WWTW effluent
was reduced by 50% (from mean of 7.12 mg/l before mixing to a mean of 4.30 mg/l after mixing).
There are mixing devices that should ideally be able to homogenise the chlorine solution and
wastewater in a fraction of a second. Mixing has the advantage of quickly dispersing the chlorine
solution, which provides optimum utilisation of the disinfectant in a turbulent regime (White,
1999).

78
Mixing in chlorine disinfection practice will also reduce the free and combined chlorine residual
discharged into water resources. One of the current disadvantages of using chlorine as a
disinfectant is chlorine residual that is discharged into water courses and which becomes toxic to
aquatic organisms. The available residual chlorine also has the potential to form organo-
chlorinated derivatives. These derivates are of particular concern, as they tend to be relatively
toxic, persistent and bio-accumulative.
79
CHAPTER 5
5 CONCLUSIONS
5.1 CONCLUSIONS OF THIS STUDY
The results of this study provide clear evidence that there is a significant opportunity to meet
standardised E. coli limits for discharging effluent into a water course when reduced chlorine
dosage is applied with mixing.
The rate at which E. coli is inactivated is affected by the application of mixing chlorine with the
wastewater effluent at the point of dosage during the chlorination process. The higher the intensity
of mixing, the less chlorine is required. However, the impact is significant at lower dosing
concentrations. In this study, dosing concentration were 1, 2, 3, 4 and 5 mg/l and the significant
effect was shown at dosage between 2-3 mg/l. Higher dosing concentrations may compensate for
lower turbulent/mixing at the dosing point. It could thus be concluded that the inactivation of E.
coli as an indicator bacterium is enhanced by increased mixing energy at the point of dosing. The
mixing provides initial disinfection by providing for the free residual chlorine to diffuse into the
microorganism clumps, causing a rapid kill during the initial contact period. Therefore, bacteria
inactivation is quantified as a function of disinfectant exposure (see Figure 4-11, 4-12 and 4-13).
The benefit of this finding is that it would be possible to achieve the wastewater standard for E.
coli at a dosing concentration less than what is required for breakpoint chlorination. Longley
(1978) reports on a survey of the chlorination facilities of several wastewater treatment plants
discharging into San Francisco Bay and found that plants introducing chlorine at a point of
turbulence demonstrated consistently higher coliforms inactivation.
Adequate wastewater treatment is important to protect the environment to which wastewater is
discharged into. In the design of chlorine contact tanks, the principle concern must be to achieve
maximum disinfection efficiency with a minimum chlorine residual. The current conventional
methods of chlorine addition do not take advantage of the short time that free chlorine is available

80
since there is no mixing at the point of dosage to optimise the chlorine exposure to microorganisms
at the same time as chlorine reacts with competing substrates in the effluent. Chlorine reacts very
rapidly at pH values of 6-9 and the process is essentially completed in a few seconds.
Based on the results of this study, in practice the current cost of disinfection by chlorine can be
reduced by at least 50% since inactivation can be reached at less than 50% of the chlorine dose
required to meet chlorine demand. In addition, this will create the possibility that the effluent
discharged into the water course can have 0 mg/l free chlorine. Therefore, mixing chlorine at a
point of dosage can constitute a new and good efficient method of disinfection.
5.2 Achievement of the Study’s Objectives
This section concludes with reference to the objectives of this study to validate the original
contribution of this report:
i. Since it is important to look at options to reduce chlorine demand and redirect chlorine
dose to its primary aim of microorganism inactivation without the total chlorine
demand being met, this study set out to empirically evaluate the impact of chlorine and
wastewater contact time (Ct) and chlorine residual concentration on microorganism
(specifically E. coli) inactivation. The literature survey presented in Chapter 2 and the
results obtained in Chapter 4 show that, depending on the concentration of residual
chlorine, available microorganisms that were not in contact (or exposed) to chlorine
during dosing would be deactivated by the available chlorine residual during increased
contact time. The required samples and test results for this investigation were generated
at the Burgersfort wastewater treatment works. As can be seen in Chapter 4, gently and
vigorous mixing of chlorine with wastewater achieved a reasonable degree of
disinfection while using less chlorine. This consequently will save on chlorine dosing.
This investigation can therefore assist relevant authorities at wastewater treatment
plants to reduce the cost of chlorine used for disinfection.
81
ii. If the objective in the above bullet-point is achieved and free chlorine residual in the
effluent is reduced to zero, this will address the problem faced by most wastewater
treatment plants of discharging above zero free chlorine residual in the effluent into
water bodies. This will be ecologically beneficial. Chapter 4 demonstrated the effect of
mixing on E. coli inactivation. The results show that with gently and vigorous mixing
at the at the chlorine dosage below breakpoint chlorination, free chlorine residual
decrease to 0 mg/l as contact time increases.
iii. This study investigated the effectiveness of mixing at the point of chlorination. Chapter
4 demonstrated that rapid (vigorous) mixing of chlorine with wastewater achieved a
higher degree of disinfection than partial (gently) mixing while employing the same
chlorine dosage and contact time. In similar fashion, partial mixing achieved a higher
degree of disinfection than no-mixing while employing the same chlorine dosage and
contact time. It must be noted again that the chlorine dosage applied in these
experiments are much less than that typically employed in most treatment works for
microorganism inactivation. This, if applied in a treatment works, will result in cost
savings on chlorine dosage to meet chlorine demand and produce expected chlorine
residual. The study therefore reveals that the typical process control variables of contact
time and chlorine concentration have a limited effect on the inactivation of particle-
associated organisms but mixing effect at the dosing point, which also confirm the
finding by Dietrich et al., (2007).
iv. The above points shows that this study examined ways to reduce chlorine disinfection
dosage for wastewater by reducing chlorine dose compared to the current chlorine dose
practice, the cost of wastewater treatment will decrease due to (i) the decrease in the
need to de-chlorinate high chlorine residual in the effluent before discharge and the
decrease in chlorine dosage for microorganism inactivation. This is set out in Chapter
4.

82
5.3 RECOMMENDATIONS FOR FUTURE RESEARCH
As the water industry moves into the 21st century, design approaches will evolve in response to
the need to provide more rigorous protection of public health from the risk of disinfection by-
products. This balance of disinfection benefit and risk will continue to spur the industry to evolve
towards more encompassing regulation, informed design and optimised operation. In particular,
the use of disinfectants in excess of those needed to achieve the desired level of disinfection will
result in an unnecessary increase in disinfection by-products and financial cost.
Given the limited scope of this study and the future context, it is imperative that future research
studies look at the following research areas:
The development of a detailed kinetic models representing chlorine’s different reactions with
inorganic and organic materials in solution, chlorine’s interaction with microorganisms and
chlorine’s decomposition in the effluent based on the effect of mixing.
The development of hydrodynamic model of the disinfection contactor, the chlorine dosage
and mixing basin sizing for optimal retention times, as well as optimum velocity gradient
within disinfection contact chambers.
An integrated approach to disinfection design and operation that incorporates the
characteristics of the chemical disinfectant, disinfection kinetic model by organism and the
contactor hydraulic condition.
The underlying physical, biological and/or chemical properties associated with the differences
observed in parameter values that affect chlorine reaction and diffusion in wastewater effluent.
The study may assist to identify upstream treatment processes that will remove particles that
inhibit quick microorganism exposure in order to enhance disinfectant penetration into
microorganisms.

83
In future waterworks should be designed to include mixing within the chlorine contact unit in order
to provide maximum contact between the disinfectant and the microorganisms to be inactivated.
The chlorine contact facility would then be considered an integral part of the overall wastewater
treatment process, which means it would become a unit process such as sedimentation, aeration,
and sludge digestion.

84
REFERENCES
Adewumi, J. R., Ilemobade, A. A and van Zyl, J. E 2010. ‘Decision support for the planning of
integrated wastewater reuse projects in South Africa’. Water Science and Technology – Water
Supply, Vol. 10, no. 2, pp 251-267.
Adewumi, J. R., Ilemobade, A.A and van Zyl, J.E 2012, ‘Minimizing risks in wastewater reuse:
proposed operational principles and guidelines for South Africa’, Journal of Water Reuse
and Desalination, Vol. 2, no. 4, pp 227-238.
Acher, A.J., Fischer, E and Manor, Y 1993, ‘Sunlight disinfection of domestic effluents for
agricultural use’. Water Res. Vol. 28, pp. 1153-1160.
Amiri, F., Mesquita, M.M.F and Andrews, S.A 2010, ‘Disinfection effectiveness of organic
chloramines, investigating the effect of pH’. Water Research. Vol. 44, pp. 845-853.
Amiri, F., Mesquita, M.M.F and Andrews, S.A 2010, ‘Disinfection effectiveness of organic
chloramines, investigating the effect of pH’, Water Research, Vol. 44, p. 845-853.
America Water Works Association 2002, Disinfection of water storage facilities, C652-2002,
AWWA.
Charrois, J.W.A and Hrudey, S.E 2007, ‘Breakpoint chlorination and free-chlorine contact time:
Implication for drinking water N-nitrosodimethylamine concentration’, Water Research, Vol
41, pp. 674-682.
Dai, J., Jiang, F., Shang, C, Chau, K., Tse, Y., Lee, C., Chen, G., Fang, J and Zhai, L 2013, ‘The
impact of chlorine disinfection on biochemical oxygen demand levels in chemically enhanced
primary treatment effluent’, Water Science & Technology, Vol 68, pp 380–386.

85
Debordea, M and von Guntena, U 2008, ‘Reactions of chlorine with inorganic and organic
compounds during water treatment—Kinetics and mechanisms: A critical review’, Water
Research, Vol. 42, pp. 13–51.
DWAF, Department of Water Affairs and Forestry 1996, South African water quality guidelines
(2nd edition), Vol. 2, Domestic Use. Pretoria, RSA (1996). Compilation of Water Quality
Guidelines and Standard.
Dietricha, J.P., Logea, F.J., Ginna, T.R and 𝐵𝑎𝑠𝑎�̌�𝑎𝑜�̌�𝑙𝑢𝑏, H 2007, ‘Inactivation of particle-
associated microorganisms in wastewater disinfection: Modeling of ozone and chlorine reactive
diffusive transport in polydispersed suspensions’ Water Research, Vol. 41, pp. 2189–2201.
Dietrich, J.P., Basagaoglu, H., Loge, F.J and Ginn, T.R. 2003, ‘Preliminary assessment of transport
processes influencing the penetration of chlorine into wastewater particles and the subsequent
inactivation of particle-associated organisms’, Water Res, Vol. 37, pp. 139–149.
Ducoste, J., Carlson, K., Bellamy, W 2001, The integrated disinfection design framework
approach to reactor hydraulics characterization’, J. Water Supply: Res. Technol.-Aqua, Vol. 50
no. 4, pp. 245–261.
DWA, Department of Water Affairs 2009, Municipal Wastewater Treatment: Base information
for targeted risk-based regulation: (Limpopo Province), 2009.
DWA, Department of Water Affairs 2011, Green drop report 2011: Wastewater service
regulation, Republic of South Africa.
DWA, Department of Water Affairs 2012, Green drop progress report 2012: Wastewater service
regulation, Republic of South Africa.

86
EPA Victoria, Environment Protection Authority Victoria 2002, Guidelines for environmental
managements: Disinfection of treated wastewater. EPA Victoria, Publication 730. ISBN 0 7306
7623 4. Available from: www.epa.vic.gov.au/~/media/Publications/730.pdf, Accessed on 19
November 2012.
Lenntech, 2012, ‘Factors that influence water disinfection’. Available from:
http://www.lenntech.com/processes/disinfection/factors/factors-disinfection-water.htm,
Accessed on September 2012.
Freese, S.D, Bailey, I and Nozaic, D 2003, The evaluation of alternative disinfection processes for
the removal of protozoan oocysts and cryts and other micro-organisms, in the treatment of final
wastewater, Water Research Commission Report no. 1030/1/03.
Gehr, R, Wagner, M, Veerasubramanian, P and Payment, P 2003. ‘Disinfection efficiency of
peracetic acid, UV and ozone after enhanced primary treatment of municipal wastewater’,
Water Research. Vol. 37, pp. 4573-4586.
Golder Associates Africa and Zitholele Consulting 2006a, ‘Wastewater Treatment in South Africa:
Field Evaluation of the Status and Performance of Wastewater Treatment Plants:
Final’.Submitted to: Water Research Commission (WRC) and Department of Water Affairs and
Forestry (DWAF).
Golder Associates Africa and Zitholele Consulting, August 2006b, Wastewater Treatment in South
Africa: “From Crisis to Compliance” Final Report No: 8011/8295/3/P, Submitted to: Water
Research Commission (WRC) and the Department of Water Affairs and Forestry (DWAF).
Government Gazette (No. 92250 1984 Regulation No. 991 18 May 1984: Requirements for the
Purification of Waste Water or Effluent: General and Special Standards.

87
Government Gazette (No. 20526) 1999, General and Special Authorisation - Discharge limits and
conditions set out in the National Water Act, (DWAF).
Headleya, T, Nivalaa, J, Kassaa, K, Olssonb, L, Wallacec, S, Brixb, H, van Afferdena, M and
Müller, R 2013, ‘Escherichia coli removal and internal dynamics in subsurface flow
ecotechnologies: Effects of design and plants. Ecological Engineering’, Available from:
http://dx.doi.org/10.1016/j.ecoleng.2013.07.062, Accessed on 20 August 2013.
Helbling, D.M and VanBriesen, J.M 2007, Free chlorine demand and cell survival of microbial
suspensions’, Water Research, Vol. 41. pp. 4424–4434.
Ibanez, J.G, Hernandez-Esparza, M, Doria-Serrano, C, Fregoso-Infante, A, Singh, M.M 2008,
‘Wastewater disinfection: Environmental Chemistry’. Springer, New York. pp 225-230.
Jeong, J., Kim, L.Y. and Yoon, J 2006, ‘The role of reactive oxygen species in the electrochemical
inactivation of microorganisms’, Environ. Sci. Technol, Vol. 40 no. 19, pp. 6117–6122.
Kim, D, Stoesser, T, and Kim, J 2013, ‘Modeling aspects of flow and solute transport simulations
in water disinfection tanks. Applied Mathematical Modelling’, Vol. 37, pp. 8039–8050.
Kim, H and Lee, S 2006, ‘Pump diffusion flash mixing (PDFM) for improving coagulation process
in drinking water treatment’, Separation and Purification Technology, Vol. 52, pp 117–125.
Kim, H, Kwon, S, Han, S, Yu, M, Gong, S and Colosimo, M.F 2006, ‘New process control strategy
for wastewater chlorination and dechlorination using ORP/pH’, Water Science & Technology,
Vol. 53, No 4, pp 431–438.
Kitis, M 2004, ‘Disinfection of wastewater with peracetic acid: a review’, Environment
International, Vol. 30, pp. 47–55.

88
Li, B and Zhang, T 2013, ‘Different removal behaviours of multiple trace antibiotics in municipal
wastewater chlorination’, Water Research, Vol. 47. pp. 2970–2982.
Li, D, Zeng, S, Gu, A, He, M and Shi, H 2013, ‘Inactivation, reactivation and regrowth of
indigenous bacteria in reclaimed water after chlorine disinfection of a municipal wastewater
plants’, Journal of Environmental Science, Vol. 7, pp 1319-1325.
Li, D, Gu, A.Z, Zeng1, S, Yang, W, He, M and Shi1, H 2011, ‘Evaluation of the infectivity, gene
and antigenicity persistence of rotaviruses by free chlorine disinfection’, Journal of
Environmental Sciences, Vol. 23, no.10, pp 1691–1698.
Lim, M.Y, Ju-Mi Kim, J and Ko, G 2010, ‘Disinfection kinetics of murine norovirus using chlorine
and chlorine dioxide’, Water Research, Vol. 4 4, pp 3243-3251.
Linvil, G.R 2002, Nitrites and their impact on effluent chlorination, Clemson University.
Longley, K.E 1978, ‘Turbulence factors in chlorine disinfection of wastewater’, Water Research,
Vol. 12, pp. 813-822.
Macauley, J.J, Qiangb, Z, Adamsb, C.D, Surampallie, R and Mormilea, M.R, 2006, ‘Disinfection
of swine wastewater using chlorine, ultraviolet light and ozone’, Water Research, Vol. 40. pp.
2017–2026.
MacCrehan, W.A, Bedner, M and Helz, G.R 2005, ‘Making chlorine greener: Performance of
alternative de-chlorination agents in wastewater’, Chemosphere, Vol. 60, pp. 381–388.
Manus, L and Van der Merwe-Botha, M 2010, ‘Raising wastewater treatment performance through
incentive and risk-based targeted regulation,, Proceedings of the 2010 Water Institute of South
Africa (WISA), Durban, South Africa 18-22 April.
89
Marhaba, T.F, 2009, ‘Monitoring Disinfectants’, Handbook of Water Purity and Quality, Elsevier
Inc, Chp. 12.
Metcalf and Eddy. 1991, Wastewater engineering: treatment, disposal, and reuse, McGraw-Hill,
Sydney.
Momba, M.N.B and Makala, N 2004, ‘Comparing the effect of various pipe materials on biofilm
formation in chlorinated and combined chlorine-chloraminated water systems’, Water
Research/Water SA, Vol. 7, pp 175-182.
Momba, M.N.B, Osode A.N and Sibewu, M 2006, ‘The impact of inadequate wastewater treatment
on the receiving water bodies case study: Boffalo city and Nkokonbe municipalities of the
Eastern Cape Province’, Proceedings of the 2006 Water Institute of South Africa (WISA),
Durban, South Africa.
NATIONAL WATER ACT, 1998. (Act No. 36).
Neumann, M.B, von Gunten, V and Gujer, 2007, ‘Uncertainty in prediction of disinfection
performance’, Water Research, Vol 41, pp. 2371-2378.
Page, M.A, Shisler, J.L, and Marina, B.J 2009, ‘Kinetics of adenovirus type 2 inactivation with
free chlorine’, Water Research, Vol. 43, pp. 2916-2926.
Pascho, R.J, Landolt, M.L and Ongerth, J.E 1995, ‘Inactivation of Renibacterium salmoninarum
by free chlorine’, Aquaculture, Vol. 131, pp. 165-175.
Pretorius, P.C and Pretorius, W.A 1999, ‘Disinfection of purified sewage effluent with
monochloramine’, Water Research/Water SA, Vol. 9, pp 463-471.

90
Rauen, W.B, Angeloudis, A and Falconer, R.A 2012, ‘Appraisal of chlorine contact tank
modelling practices’, Water Research, Vol. 46. pp. 5834–5847.
Rudd, T and Hopkinson, L.M 1989, ‘Comparisom of Disinfection Techniques for Sewage and
Sewage Effluents’, J. IWEM, Vol. 3, pp 612-618.
Shin, G and Sobseyb, M.D 2008, ‘Inactivation of norovirus by chlorine disinfection of water’,
Water Research, Vol. 4, no.2, pp. 4562–4568.
Hendricks, L.B 2008, Minister of Water Affairs and Forestry: Statement/Speech to Parliament on
‘water crisis’, Parliament, Cape Town, Available from: http://www.dwa.gov.za/minister/
Default_dates06.asp? year=2008, [11 March 2008].
Silva, G.H.R, Daniel, L.A, Bruning, H, Rulkens, W.H 2010, ‘Anaerobic effluent disinfection
using ozone: Byproducts formation’, Bioresource Technology, Vol. 18, pp. 6981 – 6986.
Srinivasan, S Aslan, A, Xagoraraki, I, Alocilja, E and Rose J.B 2011, ‘Escherichia coli,
enterococci, and Bacteroides thetaiotaomicron qPCR signals through wastewater and septage
treatment’, Water Research, Vol. 45, No. 8, pp. 2561–2572.
Tyrrell, S.A, Rippey, S.R and Watkins, W.D 1995, ‘Inactivation of bacterial and viral indicators
in secondary sewage effluents, using chlorine and ozone’, Water. Research. Vol. 29, No. 11,
pp. 2483-2490.
Warriner, R, Kostenbader, K.D, Cliver, D.O, and Ku, W 1985, ‘Disinfection of advanced
wastewater treatment effluent by chlorine, chlorine dioxide and ozone’, Water Research. Vol
19, pp. 1515-1526.
WATER SERVICES ACT, 1997. (Act No. 108).

91
White, G.C, 1999, ‘Disinfection of wastewater and water for reuse’, Van Nastrand Reinhold
Environmental Engineering Series, pp. 104.
Wua, Q, Hua, H, Zhao, X and Li, Y 2010, ‘Effects of chlorination on the properties of dissolved
organic matter and its genotoxicity in secondary sewage effluent under two different
ammonium concentrations’, Chemosphere, Vol. 80. pp. 941–946.
Winwarda, G.P, Avery, L.M, Stephensona, T and Jeffersona, B 2008, ‘Chlorine disinfection of
grey water for reuse: Effect of organics and particles’, Water Research, Vol. 42, pp.483–491.
Williams, M.L, Paimer, C.G and Gordon, A.K 2003, ‘Riverine macroinvertabrate responses to
chlorine and chlorinated sewage effluent – Acute chlorine tolerance of Baetis harrisoni
(Ephemeroptera) from two rivers in KwaZulu-Natal, South Africa’, Water Research/Water SA,
Vol. 5, pp 483-488.