impact of china-africa trade relations: the case of ... · income and improvement in technology,...
TRANSCRIPT

IMPACT OF CHINA-AFRICA TRADE RELATIONS:
THE CASE OF NIGERIA
Final Report
By
Adeolu O. ADEWUYI, Ph. D
Aminu ALARUDEEN, Ph. D
Olayinka I. KAREEM
Trade Policy Research and Training Programme
Department of Economics
University of Ibadan, Ibadan Nigeria
E-mail: [email protected]
SUBMITTED TO THE AFRICAN ECONOMIC RESEARCH CONSORTIUM
(AERC), NAROBI, KENYA
JANUARY, 2010

2
TABLE OF CONTENT
I. Introduction 1
II. Background: China’s and Nigeria’s Trade Performance 5
III. Review of the Literature 32
IV. Theoretical/Analytical Framework and Methodology 38
V. Empirical Analysis 49
VI. Summary of findings, Recommendation and Conclusion 73
Abstract This study examines the impact of China-Nigeria trade relations. Both macroeconomic and microeconomic analyses
were carried out. Some interesting findings obtained from the study are discussed as in what follows. The intensity of China’s
export to Nigeria has been high over time, while the intensity of Nigeria’s export to China has been somehow low and around
60.0 throughout the entire period, which implies that Nigeria has exported less than it should do to China. The results of the panel
regression show that economic size of the two countries plays a major role in promoting trade relations between them. Results
suggest that the level of tariffs in China promotes trade with Nigeria, while the level of tariffs in Nigeria hinders trade with China
Simulation experiments particularly results on the outcome of the formation of an FTA between China and Nigeria (100% tariff
cut) show that, although both countries will lose, Nigeria will lose more in terms of export of food and live animals; crude
materials (inedible); and mineral fuels, lubrications and related products, while China will lose more in terms of export of
chemical and manufactured products.
Survey results revealed that majority of the consumers surveyed in Nigeria used made-in-China product. The major
reasons advanced by respondents (consumers) for consuming Chinese products are relative lower prices, product availability,
quality, technology and packaging. We found that some commodities that are of China origin caused some discomforts to the
Nigerian consumers. On the impact of the global financial crisis on the consumers, the consumers indicated that their
consumption decreased as a result of the crisis.
The sampled importers revealed that they imported a number of commodities from foreign markets including China.
Majority of the respondents declared that prices of commodities from China, EU and India have decreased. Analysis of the
impact of competition from the various markets shows that majority of the respondents believed that competition from various
markets particularly from China and India as well as USA and EU is destructive. Further, issues raised with the importers
revealed that the competition from various markets particularly China had positive effect on their sales and profits.
Many of the producers reveal that Nigeria is a major market outlet for their products, while some of them also indicated
foreign market outlets including China. A large proportion of the producers pointed out that competition from various markets
(within and outside Nigeria) have been destructive to their activities. Based on the above findings, some recommendations were
made to the various stakeholders including the government, consumers and manufacturers/exporters.
Key words: Trade relations, China, Nigeria, macroeconomic analysis, microeconomic
analysis.
Word count: 27,860

3
I Introduction
I.1 Problem Statement
Traditionally, African countries have traded rigorously with the developed nations,
especially the European Union (EU), Canada and the US. These economic relationships are
governed by various bilateral and regional agreements that exist between these countries and
Nigeria. Although, the relationships have gone a long way, the developmental impact is
contestable.
However, due to the trade performance of some Asian countries that has enhance their
income and improvement in technology, especially China and India, many African countries
including Nigeria have began to diversify their markets to these countries. This emerging trade
partners have created some incentives to trade with the continent through their foreign direct
investment (FDI) and aid. China-Nigeria relationship dates back to some decades but recent
developments call for a careful and detailed analysis of the potential impact so as not to end up
like the previous ones. Besides, it is important to see whether the pattern of trade relations
between the two countries is compatible with Nigeria’s (industrial) development aspirations as
packaged in the Nigeria Economic Empowerment and Development Strategy (NEEDS).
The recent boost in Nigeria-China trade relations is as a result of a number of factors.
Among the most important factors is the recent phenomenon of increased income for both China
(more sustained) and Nigeria. Also, there are economic complementarities between these
countries. A dimension of this is the market opportunities which drive the relationship. Thus,
while Nigerians (Consumers) are looking from cheap products from China, Chinese growing
manufacturing firms are seeking market opportunities for their intermediate and final
manufactured products from Nigeria. Also, the input sourcing and export promotion drive of the
two nations is another dimension of the economic complementarities. As the growing Chinese
firms are seeking raw materials (oil and other minerals, agricultural products, etc for inputs and
generation of energy), Nigerian exporters are seeking market opportunities for their primary
products. China’s ability to provide the financial and technical assistance (at concessionary
interest rate or /and with aid) to Nigeria which is in need of such is another critical factor. The
recent repeated political visits by Nigerian government and the reciprocal visits by the Chinese

4
government which led to the signing of bilateral Trade Treaties and Memorandum of
Understanding between the two nations have also strengthened the relationship.
Although before now, Nigeria has established bilateral trade relationship with China, but
the magnitude of the trade was not as it is now. Available data from the World Bank (2007)
show that in 2000, four broad commodities were exported totalling US$307.3 million, with the main
export commodity being Mineral fuel and lubricants which represented US$273.7 million (90% of total
exports) and next important export in 2000 was crude materials excluding food and fuel which totalled
US$33.3 million. The remaining two broad commodities exported to China were quite insignificant with
values between US$0.1 million and US$0.2 million. Nigeria’s exports to China increased to US$526.9
million in 2005; the increase was more than 50%. The China’s share of Nigeria’s total exports fell from
only 1.5% in 2000 to 0.79 in 2007.
In terms of imports, Nigeria’s total imports increased from US$5.3 billion in 1996 through
US$5.8billion in 2000 to US$17.7billion in 2005. The dramatic increase of Nigeria’s total imports
between 2000 and 2005 was also reflected in the country’s imports from China which rose phenomenally
from as little as US$252million in 2000 to US$2.3billion in 2005. Nigeria imports almost all of the broad
categories of products from China. In 2005, imports of machinery and transport equipment ranked first
followed by manufactured goods, miscellaneous manufactures, chemicals and food and live animals.
China’s share of Nigeria’s imports rose from 3.5% in 1996 to 13.44% in 2007. Nigeria’s import from
China is more diversified than its exports and Nigeria is a small player compared to other countries
exporting to China.
Given the trade pattern, China had a trade surplus with Nigeria during the period 2003-07. The
trade surplus rose by almost 91% in 2005 and 24% in 2007 for agricultural, while it rose by about 41, 45
and 27% in 2005, 2006 and 2007, respectively for non-agricultural. The total trade surplus of China
against Nigeria was about $3.3 billion in 2007. On Product basis, China recorded trade deficits in a few
products.
Among the economic consequences of the recent growing trade relations between the two
countries are the fact that there is a rise in the price or terms of trade (TOT) of primary products of
interest to Nigeria and a decline in the price or TOT of manufacturing products produced by China, which
resulted into intense competition in the World market. The consequence of all these are the issues of
gains/losses and gainers/losers.
The emerging issues/challenges therefore include the determination of the potential gains/losses
from the trade relations; determination of the potential gainers/losers from the trade relations; how to
actualise, maximise and internalise the gains from the trade relations; how to minimise the loses from the

5
trade relations and compensate the losers; how to utilise and sustained the gains from the relations; and
how to promote industrialisation of Nigeria in the context of the trade relations. All these require a
thorough and comprehensive and analysis which will inform articulation of policy responses. This study
therefore seeks to address all these issues and challenges so as to come up with specific findings that will
inform policy articulation to maximise the opportunities and responses to minimise the costs/challenges
on the economy of Nigeria.
I.2 Objectives and Terms of Reference of the study
The objective of this study is to analyse the impact of trade relations between China and Nigeria
with a view to articulating policy to maximise the benefits and minimise the costs. Specifically,
this study examines the following specific terms of reference:
Analysis of the country’s economic structure and performance, paying particular
attention to the role of trade with China;
Analysis of the country’s export growth, by sector and export destination, paying specific
attention to the contribution of China in terms of export volume, export prices and export
earnings;
Analysis of the country’s relative gains and losses generated by exports to China, paying
particular attention to their sources (in terms of volume and price changes) and their
sectoral distribution;
Identification and analysis of the key export stakeholders, classified by key sectors,
relative gains and losses, gainers and losers, and sources of their gains and losses;
Analysis of the country’s import structure and performance, by key sectors and import
sources, with specific focus on the contribution of China in terms of import volume, and
import prices;
Analysis of the country’s relative gains and losses generated by imports from China,
paying particular attention to the sources (i.e. volume and price changes) and the sectoral
distribution of these losses and gains;
Identification and analysis of the key import stakeholders classified by key sectors,
relative gains and losses, gainers and losers, and sources of their gains and losses;
Analysis of the evolution of Chinese trade regime and trade policy, focusing on the key
sectors of Chinese imports from and exports to the country, and with particular reference
to the market access conditions of the country’s exports to China;
Analysis of the evolution of the country’s trade regime and trade policy focusing on the
key sectors of its imports from and exports to China, and with particular reference to the
market access conditions of Chinese imports into the country;
Analysis of any bilateral and/or regional trade agreements and/or special trade
arrangements between the country, and China, with particular focus on their implications
for the net gains/loses emanating from the trade relationships between China and the
country;
Identification and analysis of the opportunities which can be derived by the country from
its trading relationship with China;

6
Examine the implications of the global economic crises and regional integration on the
relations
Articulation and analysis of the policy responses which could enable the country
maximize the benefits derivable from its trading relationship with China;
Identification and analysis of the challenges facing the country from its trading
relationship with China including the following:
• The challenges of judicious utilization of the increased income especially the
foreign exchange earnings to relax supply side constraints and diversify the
economic base
• The challenges of responding strategically to the price competition promoted by
Chinese imports
• The challenges of dealing with the risks of the structure of the country’s exports
to China perpetuating specialization in primary commodity production
• The challenges of dealing with the risk of China’s cheap import leading to de-
industrialization, increased unemployment and discourage economic
diversification
• The challenges of handling the possibility that imports from China may be
hazardous on account of low quality?
Articulation and analysis of the policy responses which the country would need to
minimize the net losses arising from its trading relationship with China;
Articulation and analysis of the policy responses necessary to optimize trade relations
with China if and when China acquires the attributes of an advanced industrialized
economy and the associated changes in the features and pattern of its trade relations with
the country.
I.3 Organisation of the Report
This report is organised into six sections. After this introductory section is section II,
which is the background of the study. This section contains discussions on Nigeria-China trade
in terms of magnitude, growth, structure and trend. It also contains Chinese trade policy towards
Nigeria and Nigeria trade policy towards China. The institutional arrangements and content of
the policies are discussed. Section III presents review of literature which covers theoretical
literature on similar studies, methodological approaches and empirical analysis as well as
findings. Section IV covers theoretical framework and methodology, which involves the choice
of theoretical framework and methodology for macro and micro analyses and provision of
justification for them. Section V entails empirical analysis and drawing of policy implications of
findings. Section VI presents conclusions and policy recommendations. In this section, major
findings from both macro and micro analyses are summarised and policy recommendations are
discussed.

7
II Background: China’s and Nigeria’s Trade Performance
The trade relations between China and Nigeria have been driven by both internal and
external factors. It is therefore important to look at some internal factors driven the relations.
Among the internal factors are the performance in terms of growth of output and trade and
availability of finance. There is therefore the need to discuss these various factors.
2.1 Nigeria’s Economic Structure and Performance: The role of Trade with China
This aspect endeavours to discuss the role of trade with China in Nigeria’s economic
structure and performance. As a preamble, the growth performance of China and Nigeria in
terms of total real output and per capita output is shown in Table 1. It is shown in the table that
China’s economy grew at a rate higher than that of Nigeria except in 1990. While China
maintained positive growth in 1980 and 1985 as well as throughout the 1990-2005, its rate of
growth of real output has been relatively sustainable at between over 7.0 and 10.0 per cent. In
contrast, the rate of growth of real output in Nigeria has ranged between 1.0 and 5.5 per cent
except for 2003 to 2005. The growth of per capita income in China has also been higher than that
of Nigeria since the late 1980s and assumed impressive rates between 1995 and 2002 than those
of the latter. The increased total and per capita income achieved in China should raise the level
of trade, investment and aid relations between the two countries as part of its ‘go global’ policy.
Table 1: Growth Performance of China and Nigeria
Variable Real GDP growth
Per capita GDP (US
$)
Per capita GDP
growth
Year Nigeria China Nigeria China Nigeria China
1980 4.2 7.8 541.9 417.7 1.2 6.5
1985 9.7 13.5 522.9 837.4 6.7 12.0
1990 8.2 3.8 688.4 1326.2 5.1 2.3
1995 2.5 10.9 765.3 2514.4 -0.2 9.7
1996 4.3 10 792.7 2789.1 1.6 8.9
1997 2.7 9.3 807.0 3067.9 0.1 8.2
1998 1.9 7.8 811.0 3312.0 -0.6 6.8
1999 1.1 7.6 811.9 3581.2 -1.3 6.6
2000 5.4 8.4 853.9 3938.6 2.9 7.6
2001 3.1 8.3 880.9 4336.6 0.7 7.5
2002 1.5 9.1 889.8 4781.9 -0.7 8.4
2003 10.7 10 982.8 5333.8 8.3 9.3
2004 6 10.1 1045.9 5990.6 3.7 9.4
2005 6.9 10.2 1127.5 6757.3 4.7 9.5
Source: World Development Indicators, The World Bank, 2007 CD Rom
8
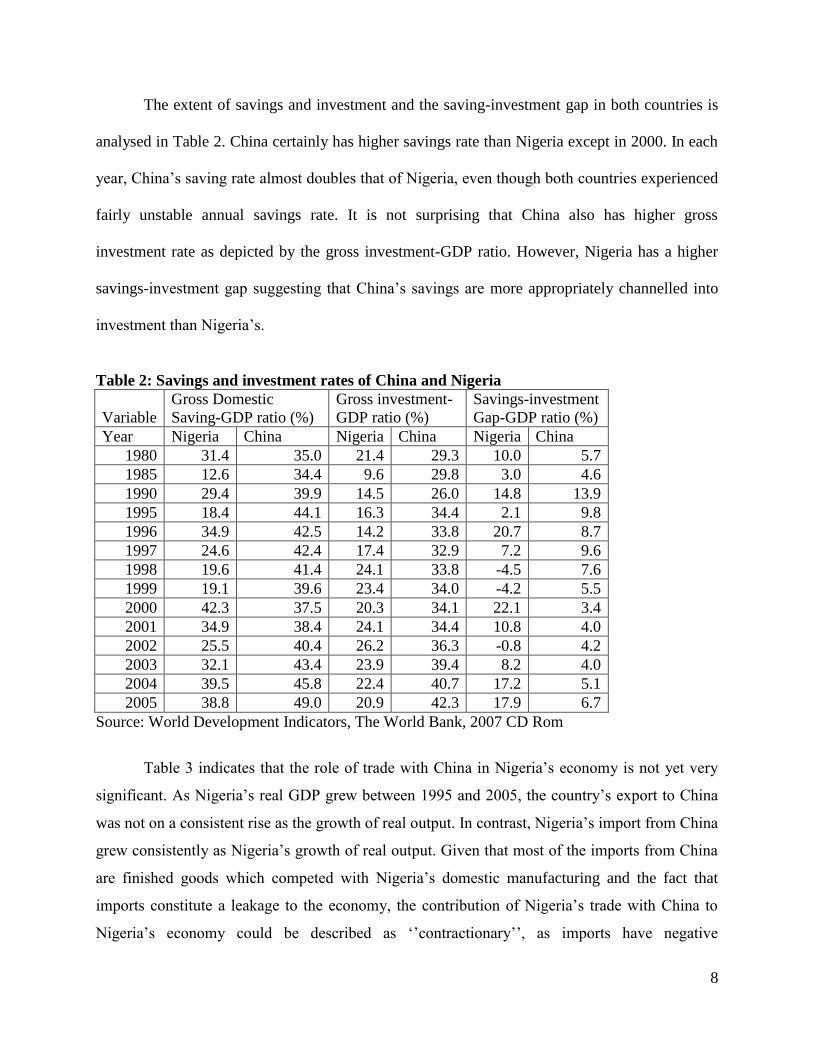
The extent of savings and investment and the saving-investment gap in both countries is
analysed in Table 2. China certainly has higher savings rate than Nigeria except in 2000. In each
year, China’s saving rate almost doubles that of Nigeria, even though both countries experienced
fairly unstable annual savings rate. It is not surprising that China also has higher gross
investment rate as depicted by the gross investment-GDP ratio. However, Nigeria has a higher
savings-investment gap suggesting that China’s savings are more appropriately channelled into
investment than Nigeria’s.
Table 2: Savings and investment rates of China and Nigeria
Variable
Gross Domestic
Saving-GDP ratio (%)
Gross investment-
GDP ratio (%)
Savings-investment
Gap-GDP ratio (%)
Year Nigeria China Nigeria China Nigeria China
1980 31.4 35.0 21.4 29.3 10.0 5.7
1985 12.6 34.4 9.6 29.8 3.0 4.6
1990 29.4 39.9 14.5 26.0 14.8 13.9
1995 18.4 44.1 16.3 34.4 2.1 9.8
1996 34.9 42.5 14.2 33.8 20.7 8.7
1997 24.6 42.4 17.4 32.9 7.2 9.6
1998 19.6 41.4 24.1 33.8 -4.5 7.6
1999 19.1 39.6 23.4 34.0 -4.2 5.5
2000 42.3 37.5 20.3 34.1 22.1 3.4
2001 34.9 38.4 24.1 34.4 10.8 4.0
2002 25.5 40.4 26.2 36.3 -0.8 4.2
2003 32.1 43.4 23.9 39.4 8.2 4.0
2004 39.5 45.8 22.4 40.7 17.2 5.1
2005 38.8 49.0 20.9 42.3 17.9 6.7
Source: World Development Indicators, The World Bank, 2007 CD Rom
Table 3 indicates that the role of trade with China in Nigeria’s economy is not yet very
significant. As Nigeria’s real GDP grew between 1995 and 2005, the country’s export to China
was not on a consistent rise as the growth of real output. In contrast, Nigeria’s import from China
grew consistently as Nigeria’s growth of real output. Given that most of the imports from China
are finished goods which competed with Nigeria’s domestic manufacturing and the fact that
imports constitute a leakage to the economy, the contribution of Nigeria’s trade with China to
Nigeria’s economy could be described as ‘’contractionary’’, as imports have negative

9
relationship with national income. Below, we analyse the trade deficits which Nigeria has
experienced in its trade with China. This reinforces the conclusion here.
Table 3: Contribution of China’s Trade to Nigeria’s Economy
Variable Real GDP growth
Per capita GDP
(US $)
Per capita GDP
growth
Nigeria
Export to
China
(US $
million)
Nigeria
Import from
China
(US $
million) Year Nigeria China Nigeria China Nigeria China
1995 2.5 10.9 765.3 2514.4 -0.2 9.7 0.2 3.5
2000 5.4 8.4 853.9 3938.6 2.9 7.6 1.5 4.3
2005 6.9 10.2 1127.5 6757.3 4.7 9.5 1.2 13
Source: World Development Indicators, The World Bank, 2007 CD ROM.
a. Nigeria’s Imports: Aggregate, Sectoral, Sources and China’s contribution
The global trade of China and Nigeria has dramatically grown since the 1980s. The trade
orientation and performance of China and Nigeria is presented in Table 4 which shows that
Nigeria is not only more trade-oriented than China in terms of imports as revealed by the import-
GDP ratio, this import orientation is almost double that of China. However, in terms of import
growth, China’s imports took a new turn by growing at a sustainable 2-digits and higher rate
particularly since 1999. In contrast, Nigeria’s import growth has rather been unstable even when
it also recorded double digit import growth most of the time since 1980, while it experienced
import contraction at least five times in the last decade compared to only twice in the case of
China.
While Table 4 shows Nigeria’s and China’s imports from all countries of the world,
Table 5 indicates the import trade between Nigeria and China. The increase in Nigeria’s total
imports from about US$5.3 billion in 1996 to US$17.7billion in 2005 is also reflected in
Nigeria’s imports from China which increased from as low as US$252 million in 2000 to US$2.3
billion in 2005.
Table 4: Global Import Performance: Nigeria and China
Year
Import-GDP (%) Import Growth (%)
Nigeria China Nigeria China
1980 19.2 11.1 18.8 0.9
1985 12.4 14.1 -7.1 48.1
1990 28.8 15.7 11.1 -16.1
1995 42.2 20.9 11.4 7.5
1996 27.4 18.0 4.8 1.1
1997 37.8 17.3 12.9 11.1

10
1998 38.1 16.0 -3.3 3.1
1999 41.1 17.6 14.9 22.6
2000 32.2 20.9 -0.8 24.5
2001 32.5 20.5 8.9 10.8
2002 41.6 22.6 20.6 27.5
2003 41.5 27.4 10.2 24.8
2004 37.4 31.4 2.0 22.5
2005 35.2 31.9 21.3 11.4
Source: World Bank (2007), World Development Indicators.
Although, the country imports all the broad categories of products from China, some
products are more significant in this import trade with China. For example, imports of machinery
and transport equipment ranked first in 2005, followed by manufactured goods, miscellaneous
manufactures, chemicals and food and live animals. The importance of products in the imports
has also altered since 1996. For instance, chemical products imports which ranked second only to
machinery and transport equipment in 1996 was replaced by manufactured products in 2000.
Nonetheless, machinery and transport equipment imports maintained its foremost important
position in the import relationship with China.
China has assumed quite an important source of Nigeria’s imports since about a decade.
China’s share of Nigeria’s total imports increased consistently from 3.5% in 1996 to 13% in
2005. Despite this general rise, some broad categories of goods imported from China did not
record this consistent improvement; mineral fuels/lubricants and animal/ vegetable oil/fat/wax
imports are a case in point. Furthermore, when the broad categories are considered, Nigeria
imported more of miscellaneous manufactures from China relative to the rest of the world. This
rose from 7.8% in 1996 to 30.6% in 2005. China’s share of Nigeria’s imports also rose
consecutively in food and live animals, as well as beverages and tobacco (both minimally); crude
materials excluding food and fuel, manufactured goods, machinery and transport equipment, and
miscellaneous manufactures (all four substantially).

11
In terms of the proportion of Nigeria’s imports supplied by China, this has increased over
time and has become more diversified. The trend can be traced partly to the competitiveness of
China’s imports compared to Nigeria’s traditional sources of imports; and partly by the
Structural Adjustment Programme which not only encouraged increased liberalization of imports
but also created an austerity environment that made importers focused more on cheaper sources
such as China. In addition to these explanations, China’s increased share of Nigeria’s imports has
been induced by increased sub-standard products from China encouraged by Nigerian
businessmen who order lower quality product specifications.
Table 5: China’s Share of Nigeria’s Imports (US$ million)
1996 2000 2005 1996 2000 2005
SITC
R. 3 Product Name World China World China World China
China's share of Nigeria's
imports
0 Food & live animals 885.9 3.5 1098.0 12.7 2140.6 29.8 0.4 1.2 1.4
1 Beverages and tobacco 10.8 0.0 34.2 0.3 69.4 0.7 0.0 0.9 1.0
2 Crude mater.ex food/fuel 121.9 1.8 94.0 1.8 120.4 8.9 1.5 1.9 7.4
3 Mineral fuel/lubricants 70.9 0.0 100.8 0.3 2396.7 1.0 0.0 0.3 0.04
4 Animal/veg oil/fat/wax 37.2 0.0 23.3 0.05 64.4 0.04 0.1 0.2 0.1
5 Chemicals/products n.e.s 981.3 59.6 1176.5 46.3 2085.5 174.6 6.1 3.9 8.4
6 Manufactured goods 1031.5 30.7 1095.5 53.8 3297.8 566.0 3.0 4.9 17.2
7 Machinery/transp equipmt 1876.7 66.2 1955.1 98.1 6600.0 1229.7 3.5 5.0 18.6
8 Miscellaneous manuf arts 296.1 23.2 238.4 39.4 948.7 290.1 7.8 16.5 30.6
9 Commodities nes 0.0 0.0 0.0 0.0 0.0 0.0 0.0 0.0 0.0
Total Imports 5312.1 185.1 5815.8 252.7 17723.5 2300.8 3.5 4.3 13.0
Source: World Integrated Trade Solution (WITS) database, 2007
This was confirmed by a trade delegation of Chinese companies that visited Nigeria that
Chinese firms do not generally produce sub-standard goods but do so at the instigation of
Nigerian importers. Only 12% of products met three of the import requirements established by
the Standards Organisation of Nigeria. A high proportion of the products met only one of the
import requirements (48%), while 36% of products complied with two import requirements.1
1 Ogunkola, E. O., A. Adewuyi, O. Oyeranti and A. Bankole, (2008), Nigeria-China Economic and Trade Relation,
Final Report submitted to the Economic Management Team, The Presidency, Abuja, Nigeria.

12
The factors underlying the increasing and more diversified imports of Nigeria from
China, relative to other countries as alluded to above, are mainly import price of the imported
goods and import liberalization, since exchange rate depreciation tended to make imports from
traditional sources more costly in addition to the high average tariffs that Nigeria maintained.
This trend of Nigeria’s imports from China is expected to increase in Nigeria’s currently more
liberalised regime brought about by the adoption of the Common External Tariffs in 2005.
However, some moderation in imports from China is also expected if import rules relating to
standards and quality are strengthened and enforced as well as if the trade diversion expected to
begin with the signing of the economic partnership agreement (EPA) with the EU through the
ECOWAS Commission materialises.
In order to get a grasp of the other features of Nigeria’s imports from China, a top-30 list
of imports was drawn up using the HS Chapter classification. First, it is discerned that the top 30
import commodities from China are all manufactured goods. Topping this list is knitted or
crocheted fabric (HS 60) followed closely by bird skin, feathers, artificial flowers, human hair
(HS 67) and vegetable textile fibre nes, paper yarn, woven fabric (HS 53) as well as articles of
leather, animal gut, harness, travel goods (HS 42). Interestingly, 50% of the top 10 imports are
textile materials of HS Chapter 50-63, while about 37 % of the top 30 imports from China belong
to HS Chapter 50-63. This finding confirms China’s dominance of the global textile trade and
partly explains the misfortune of Nigeria’s textile sector. Combining this finding with the fact
that China’s export to Nigeria has risen since 1995, the inability of Nigeria to curtail import
surges of textile products from China with effective safeguard mechanism could have
contributed to the demise of domestic production of textiles. Although, import prohibition has
always been imposed on textiles, its implementation could not be fully monitored due to porous

13
borders, corruption and inadequate enforcement capacities of the Nigerian Customs Service. The
lower part of the top 30 list features such products as toys, games, sport requisites (HS 95); tools,
implements, cutlery etc (HS 82); furniture (HS 94); soaps, lubricants waxes, candles, modelling
(HS 34); and electrical/electronic equipment (HS 85); these are labour-intensive, light
manufactures which Nigeria was producing under the import substitution industrialisation
strategy.
b. Nigeria’s gains and losses arising from Increased Imports from China
Ideally, Nigerian consumers and government should gain from imports from China while
Nigerian producers and workers should lose particularly if most of the imports are import-
competing final products since this implies the market share of Nigerian producers would shrink
and lead to excess capacity and shedding of workers. This is captured in aggregate by an analysis
of the gainers and losers of Nigeria-China trade relation via the trade balance between Nigeria
and China. Table 6 shows that Nigeria imports more agricultural (HS 01-24) and industrial
(HS25-99) goods from China during 2003-2007. In the specific case of agricultural goods,
Nigeria’s deficits rose from $16.6 million in 2003 to $59 million in 2007. In the case of
industrial products, Nigeria’s trade deficits rose from $1.7 billion in 2003 to $3.2 billion in 2007,
by almost 100%. After an initial reduction by only 8% in 2004, the trade surplus of China rose
by almost 91% in 2005 for agricultural products and 24% in 2007. For the non-agricultural goods
also, China’s trade surplus rose by 27% in 2007 falling from about 40% increase in 2005 and
2006. The total trade surplus of China was $3.3billion in 2007.

14
Table 6: Trade Balance between China and Nigeria (2003-2007)($million)
2003 2004 2005 2006 2007
Sub-total:HS 01-24
(US$’000)
16.6 15.3 29.1 47.8 59.1
Sub-total: HS 25-99
(US$’000)
1,697.7 1.240.1 1,747.1 2,526.6 3,199.6
Total Surplus/deficit
HS 01-99 1,714.3 1,255.3 1,776.3 2,574.4 3,258.8
Growth: 1-24 (%) - -8.12 90.6 63.9 23.6
Growth: 25-99 (%) - -26.9 40.9 44.6 26.6
Source: International Trade Centre COMTRADE Database, 2008.
c. Nigeria’s Exports: Aggregate, Sectoral, Destination and China’s share
(export volume, export prices and export earnings)
The export-GDP ratio and the growth of exports of China and Nigeria are indicated on
Table 7. Nigeria’s export-GDP ratio grew over the years, reinforcing the country’s trade-
orientation indicated by the import-GDP ratios. Again, the export-GDP ratio in many cases is
almost double that of China. However, China’s exports maintained a generally growing
sustainable 2-digits rate particularly since 1999. As with her import growth, Nigeria’s export
growth was unstable with many cases on negative growth rates in contrast to the situation in
China. The nature of Nigeria’s export growth cannot be decoupled from its sole reliance on the
export of crude oil, the international price of which has been quite unstable and the production of
which has been subject of Nigeria’s internal instability induced by resource control issues.
Table 7: Global Export Performance - Nigeria and China
Year Export-GDP (%) Export Growth (%)
Nigeria China Nigeria China
1980 29.4 10.7 -9.5 8
1985 16.1 10 13.3 2
1990 43.4 19.2 8.8 5.2
1995 44.3 23.1 16.8 6.4
1996 48.1 20.1 11.8 -0.7
1997 45 21.7 1.2 22.9
1998 33.5 20.4 5.4 7.2
1999 36.9 20.4 -12.4 15.2
2000 54.3 23.3 16.4 30.6

15
2001 43.3 22.6 -3.9 9.6
2002 40.9 25.1 -10.9 29.4
2003 49.7 29.5 31.6 26.8
2004 54.6 33.9 3.1 28.4
2005 53.1 37.4 -1.8 24.2
The composition of Nigeria’s exports to China is not as diverse as its imports from China, using
the Standard International Trade Classification Revision 3 (SITC Rev. 3) shown on Table 8. It is
observed that these products are spread over food, animals, crude materials, oils, chemical
products, and manufactured products. Analysing data recorded for 2000 and 2005, four broad
commodities totalling US$307.3 million were exported in 2000, this dominated by Mineral fuel
and lubricants representing US$273.7 million. This was followed at a distant second by crude
materials excluding food and fuel exports totalled US$33.3 million. The remaining two broad
commodities exported to China were quite insignificant with values between US$0.1 million and
US$0.2 million. Therefore, mineral fuel and lubricants ranked first on Nigeria’s export list to
China, followed by crude materials excluding food and fuel. Beverages and live animals exports
rank third while manufactured goods rank fourth. In terms of significance of Nigeria’s exports to
China relative to the world, Nigeria’s export to China remains negligible at 1.5% of the total
US20.3billion. Mineral Fuel and lubricants which constituted the main exports of Nigeria to
China in 2000 was a paltry 1.4% of Nigeria’s total world exports. However, Nigeria exported
more crude materials excluding food and fuel to China than any other country as this constituted
61.1%.
In 2005, Nigeria’s exports position was more impressive as the country’s exports more
than doubled the value in 2000 from US$20.3 billion to US$44.4billion. Nigeria’s exports to
China did not reflect the type of growth that its total exports exhibited even at US$526.9 million
in 2005. Indeed, the composition of exports to China in 2005 was not significantly different from

16
that of 2000 but some certain broad products were repositioned. As a result, though mineral fuel
and lubricants still ranked first followed by crude materials excluding food and fuel,
manufactured goods, which ranked lowest in 2000, displaced food and live animals while two
products; chemicals, and miscellaneous manufactures, featured in 2005. Also, the value of
exports of crude materials excluding food and fuel reduced between 2000 and 2005. Similarly,
the proportion of Nigeria’s exports destined for China reduced in 2005 even when the absolute
value showed an increase. Nigeria’s export to China in 2005 was 1.2% of its total exports which
represented a reduction compared to 2000. The export destinations appeared to have been more
fairly diversified in 2005, as product areas where exports to China was dominant, such as crude
materials excluding food and fuel, became insignificant while China gained positions in such
other areas as food and live animals, chemicals, manufactured goods and miscellaneous
manufactures. In other words, as Nigeria’s exports to China relative to the rest of the world
dwindled in 2005, it became more diversified.
Table 8: China’s Share of Nigeria’s Exports (US$ million) 1995 2000 2005 1995 2000 2005
Re
v.
3 World China World China World China
China’s Share of Nigeria’s
Exports
0 Food & live animals 293.9 0.0 205.4 0.2 592.6 1.8 0.0 0.1 0.3
1 Beverages and tobacco 1.7 0.0 1.3 0.0 3.9 0.0 0.0 0.0 0.0
2 Crude mater.ex food/fuel 262.4 0.0 54.5 33.3 304.0 12.6 0.0 61.1 4.1
3 Mineral fuel/lubricants
11189.
8 0.0
19950.
5 273.7 43054.7 503.9 0.0 1.4 1.2
4 Animal/veg oil/fat/wax 0.1 0.0 2.6 0.0 1.0 0.0 0.0 0.0 0.0
5 Chemicals/products n.e.s 38.6 0.0 8.6 0.0 15.6 0.2 0.0 0.0 1.5
6 Manufactured goods 347.3 0.0 10.0 0.1 255.4 8.2 0.0 0.6 3.2
7 Machinery/transp equipmt 185.9 0.0 70.3 0.0 114.7 0.0 0.0 0.0 0.0
8 Miscellaneous manuf arts 15.7 0.0 9.1 0.0 26.9 0.2 0.0 0.0 0.6
9 Commodities nes 4.4 0.0 0.0 0.0 0.8 0.0 0.0 0.0 0.0
Total Export
12339.
7 0.0
20312.
3 307.3 44369.6 526.9 0.0 1.5 1.2
Source: World Integrated Trade Solution (WITS) database, 2007

17
A more robust picture of Nigeria-China trade is discerned with HS nomenclature
organised to obtain the top 30 export products using 2003-07 average values was attempted.
Mineral fuels, oils and related products tops the list of first 30 exports of Nigeria to China
followed at a distant second by ores, slag and ash, as well as raw hides and skins (other than
furskins), and leather (HS 41). In effect, mineral products constitute the first two export products
of Nigeria to China. Cotton (HS 52) came at a distant fourth followed by oil seed, oleagic fruits
(HS 12) and copper and articles thereof (HS 74). The first 30 export products are a mixture of
primary and non agricultural commodities. The last 10 commodities in the top 30 list contain as
much agricultural and non-agricultural goods whose individual export values are less than
US$50,000. After the 16th export product, the share of other products in total imports of China
from Nigeria became quite negligible. However, this is an indication that Nigeria should
endeavour to increase exports to China.
d. Nigeria’s gains and losses from exports to China
Generally, producers and exporters of those broad categories of products whose exports
increased between 2000 and 2005 are better off as they earned additional incomes from
exporting to China, assuming export price of their products and the real exchange rate remained
constant. To that extent, the producers and exporters of food and live animals, mineral
fuel/lubricants, chemicals, manufactured goods, and miscellaneous manufactures are expected to
experience increased income. However, Nigerian producers and exporters of crude materials
excluding food and fuel lost export market share in China and thus were worse off in 2005.
Given that the main component of Nigeria’s exports to China is mineral and related products,
most of the gains of Nigeria’s exports to China go to the government and joint venture oil
companies. The benefit derived by ordinary Nigerians is therefore indirect, and emanates from

18
the benefits that are generated by government spending on social and economic services in the
country. There are, in addition, a few products in which China recorded trade deficits with
Nigeria which constitute a gain to the latter. These are the goods on Table 9, namely of HS 05,
12, 13, 18, 26, 27, 41, and 47. The deficit was expectedly largest for mineral fuels, oils,
distillation products etc (HS 27). The others are also basically primary commodities.
Table 9: China’s Trade deficit with Nigeria Products and values ($000)
HS
Chpt
Product Description 2003 2004 2005 2006 2007
'05 Products of animal origin, nes -14 0 31 40 -22
'12 Oil seed, oleagic fruits, grain,
seed, fruit, etc, nes
-184 -4005 -1134 -4021 -3713
'13 Lac, gums, resins, vegetable
saps and extracts nes
-83 -263 -388 -311 -81
'18 Cocoa and cocoa preparations -182 -331 -1610 0 -936
'26 Ores, slag and ash -6620 -5011 -7312 -10929 -18001
'27 Mineral fuels, oils, distillation
products, etc
-51397 -442364 -502851 -239571 -488030
'41 Raw hides and skins (other
than furskins) and leather
-568 -1050 -7454 -11264 -11301
'47 Pulp of wood, fibrous
cellulosic material, waste etc
-48 -131 -140 -182 -435
Source: International Trade Centre COMTRADE Database, 2008.
The benefits could also be explained in terms of increased price of oil generated by the increased
China’s demand of oil generally, which by virtue of the size has the tendency to increase the
world price of oil and hence the price obtainable by Nigeria for its oil.
2.2 Trade Policies in China and Nigeria
It should be stated from the onset that China and Nigeria do not have specific trade
agreement/arrangement. However, it is important to discuss trade policy environment in the two
countries so as to understand what operates in each nation.
China belongs to some bilateral/regional and multilateral trade organisations including
the WTO. China supports Asia-Pacific Economic Cooperation (APEC)'s open regionalism goals
and participates in the APEC Business Travel Card (ABTC) Scheme. China together with Japan,

19
and the Republic of Korea, relate with Association of Southeast Asian Nations (ASEAN) under
the ASEAN+3 framework of cooperation. Under the Framework Agreement on Comprehensive
Economic Cooperation between China and ASEAN, both parties agreed to negotiate the
establishment of an ASEAN–China Free Trade Area (ACFTA) within ten years. China is a party
to the Asia-Pacific Trade Agreement and under the agreement, in 2007, 1,652 tariff lines carry
rates that are lower than the MFN rates; as a result, the overall average tariff applied to parties to
the APTA is 9.1%, compared with an MFN rate of 9.7%.
Under the Closer Economic Partnership Arrangements (CEPAs) with the Special
Administrative Regions (SARs) of Hong Kong and Macao, tariffs on merchandise imports
originating in the SARs of Hong Kong and Macao have been totally removed. In July 2004,
China and the Gulf Cooperation Council (Bahrain, Kuwait, Oman, Qatar, Saudi Arabia, and
the UAE) announced that they had signed a Framework Agreement on Economic, Trade,
Investment and Technology Cooperation. In June 2004, China and Southern African Customs
Union (SACU) issued a joint declaration, in which SACU granted market economy status to
China. At the same time, FTA negotiations were launched. As of March 2008, unilateral
preferential tariffs on certain products were offered by China to 39 least developed countries
including those in Africa. However, since Nigeria is not part of LDCs, it does not benefit from
this preference.
Import Policies in China
China’s tariff rates on imports vary from bound MFN tariff rates, applied (standard or
interim) MFN tariff rates, tariff-quota rates, to "agreement" tariff rates. Whenever goods from
countries or customs territories appear in more than one of these categories, the applicable rate is
the more favourable rate. Besides, there is an inward article duties which applies to articles
exceeding a certain amount and enters the Customs Territory of China for personal use. All
bound tariff lines and 99.3% of the applied tariff lines are ad valorem. The "standard" applied
MFN tariffs must be adopted on an annual basis while the "interim" applied MFN tariffs may be
introduced or amended by the Tariff Commission whenever it considers it necessary. The
interim rates are lower than the standard rate and are mainly to encourage importation and reduce
China’s trade surplus. The structure of the China’s bound MFN tariff and applied MFN tariff are

20
shown in Table 10 and Table 11 respectively. The simple average bound rate is 9.9% with 14.6%
for agricultural products (HS), 9.1% for industrial products (HS), 15.3% for agricultural products
(WTO definition), 9.0% for non-agricultural products (WTO) and 11.5% for textile and clothing.
Table 10: Structure of the China’s Bound MFN Tariff as at 2007
Description %
Bound tariff lines (% of all tariff lines) 100.0
Simple average bound rate 9.9
Agricultural products (HS 01-24) 14.6
Industrial products (HS 25-97) 9.1
WTO agricultural products 15.3
WTO non-agricultural products 9.0
Textiles and clothing 11.5
China Trade Policy Review, 2008
The simple average of the applied MFN rate is 9.7% with 14.5% for agricultural products
(HS), 8.8% for industrial products (HS), 15.3% for agricultural products (WTO definition), 8.8%
for non-agricultural products (WTO definition) and 11.5% for textile and clothing. In the total
apply MFN tariff lines, 2.3% exceed three times the overall simple average applied rate
(domestic tariff peaks) while 15.4% exceed 15% of the overall simple average applied rate
(international tariff peaks).
Tariff-rate quotas (TRQs) currently apply to wheat (6 lines), maize (5 lines), rice (14
lines), sugar (6 lines), wool (6 lines), wool tops (3 lines), cotton (2 lines), and chemical fertilizers
(3 lines). China offers (lower) preferential/agreement tariff rates to regional and bilateral
agreement partners which include: members of the Asia-Pacific Trade Agreement (APTA);
members of ASEAN (Under the Framework Agreement on Comprehensive Economic
Cooperation between China and ASEAN); the Special Administrative Regions of Hong Kong
and Macao (Under the Closer Economic Partnership Agreements, CEPAs); Chile (Under the
China – Chile FTA); Pakistan (Under the China – Pakistan FTA) and 37 LDC African countries
(Under different Agreements).
Table 11: Structure of the Applied MFN Tariff as at 2007
Description %
1. Simple average applied rate 9.7
Agricultural products (HS 01-24) 14.5
Industrial products (HS 25-97) 8.8
WTO agricultural products 15.3

21
WTO non-agricultural products 8.8
Textiles and clothing 11.5
2. Domestic tariff "peaks" (% of all tariff lines) 2.3
3. International tariff "peaks" (% of all tariff lines) 15.4
China Trade Policy Review, 2008
Duty exemptions and reductions may apply to goods imported into or exported from
designated areas (for example, Special Economic Zones), by designated enterprises (for example,
Foreign Invested Enterprises), or for designated uses. Preferential treatment, including through
tariff preferences, is applied to some border trade activities under the Circular of the State
Council on Issues Concerning Border Trade, issued in 1996. Goods imported under "processing
trade", whereby the imported goods are processed into exports, can be imported in bond and
exempt from payment of import duties as long as they are processed and exported within a
certain period. To reduce energy consumption and protect the environment, the Government
may not grant preferential treatment under processing trade on certain goods. Such exclusion of
certain goods from preferential treatment is called "import prohibition under processing trade".
An inward article duty is levied on luggage and other personal items belonging to persons
entering the Customs Territory of China in excess of a "reasonable amount that suffices for
personal use", which is determined by the General Administration of Customs, based on an
"internationally exercised principle". Currently, four duty rates (50%, 30%, 20%, and 10%),
apply, depending on products.
The custom procedure requires registration with MOFCOM or its authorized bodies
before filing customs declarations in paper or electronic form. Declarations must be made to
Customs at the port of entry within 14 days of the goods' arrival and accompanied by relevant
documents. At the time of customs declaration, importers must meet the requirements of
Customs and the General Administration of Quality Supervision, Inspection and Quarantine
(AQSIQ). Under current reforms goods authorized by Customs can be transported within China
as bonded goods as against the previous practice in which enterprises had to declare goods and
undergo clearance at both the port of entry and inland customs.
The pre-shipment inspection was introduced to protect public health, improve the
phytosanitary situation, protect the environment, and prevent counterfeit goods from entering
China. This is required for imports of: certain commodities related to national security, with
high value or complicated technology; equipment exceeding certain height, length or volume;

22
solid waste used as raw materials; and certain used electronic products that are deemed to affect
public health and environment.
Customs value is determined on the basis of transaction value, (that is, the c.i.f. price).
Where it is not possible to determine the transaction value, the customs value is based on: the
transaction value, sales value or production cost of identical or similar goods imported into the
customs territory of China at or about the same time as the goods being valued.
China applies non-preferential rules of origin under which the place of origin is the
country or region where "substantial transformation" has been made and finalized. Preferential
rules of origin are applied under the Asia-Pacific Trade Agreement (APTA) and
preferential/free-trade agreements China has concluded with trading partners (including ASEAN
countries, Hong Kong, Macao, Chile and Pakistan).
China has adopted measures to increase the alignment of its national standards with
international norms through a number of sanitary and phytosanitary (SPS) measures and
technical barriers to trade (TBT). With a large number of laws governing SPS measures, the SPS
regime remains complex. Imports, like domestic products, are subject to value-added tax; the
current rates are 17%, in general, and 13% for most goods (audio and video products and other
forms of electronic publications). In addition to import tariffs and VAT, an excise tax
(consumption tax) is also levied at the border on certain items (cigarettes, alcoholic beverages,
gasoline, cosmetics, cars, golf balls and equipment, luxury watches, yachts, disposable wooden
chopsticks, and wooden floorboards).
Import prohibitions are maintained on grounds of public interest, environmental
protection, or in accordance with international commitments. Prohibitions include some
products of animal origin, opium, mineral products, rubber, chemicals, raw hides, waste of skins
and leather, used clothes, ash of precious metals, base metals, second-hand precision equipment,
games, and imports of used articles of HS sections 16 and 17 (machinery and transport
equipment). Quantitative restrictions have been eliminated and no fees, charges, deposits or
advance payments are required for the issuance of licences. Products that are not subject to
import restrictions but require import monitoring for statistical purposes are subject to automatic
import licences, which involves no restriction in terms of import quantity or value while products
like chemicals used for military purposes, and toxic materials are under non-automatic import
licences.

23
Export Policies in China
China's export regime has become more restrictive mainly to reduce exports of products
using large amounts of natural resources and energy, and to reduce China's large trade surplus in
an attempt to reduce trade friction. Measures used include export taxes, reduced rebates of VAT
on exports, export prohibitions, licensing, and quotas. Others include customs procedures,
preshipment inspection, tax concessions under processing trade, export promotion, marketing
and other export assistance.
Export declaration procedures are similar to those for imports. Exporters must register
with Customs before making customs declarations, and export declarations must be made after
the goods arrive at the customs surveillance zone, and 24 hours before loading, unless otherwise
approved by Customs. Exports of animals and plants and their products are subject to similar
SPS requirements as imports and to the requirements of the importing country. Goods that do
not meet the SPS requirements are not allowed to leave the country. The Catalogue of Entry-
Exit Commodities Subject to Inspection and Quarantine is issued annually by AQSIQ; exports of
certain products in the catalogue, such as food and goods affecting health, need to be registered
with relevant government agencies.
China does not require preshipment inspection (PSI) for exports; its PSI agencies engage
in preshipment export inspection for its trading partners that require PSI. Export taxes are levied
at statutory rates in relation to f.o.b. values and on an MFN basis. In addition, lower interim rates
may be applied, and also on an MFN basis. VAT and excise tax may be rebated on exports.
However, VAT rebate rates on exports are, by and large, lower than the VAT rates actually paid.
The difference between the two rates constitutes a levy on exports, which may, in turn, constitute
assistance to downstream processing of the products affected
China does not grant bonded status for all imports used as inputs for exports under
"processing trade". The authorities call the non-granting of bonded status "export prohibition
under processing trade". Exports of products "prohibited under processing trade" are allowed if
import duties are paid on imported inputs. In 2007, there were 617 such items at the HS 8-digit
level.
Prohibited items include mainly materials relating to State secrets, precious and rare
animals and plants (such as horn-cores, bezoars, musk, and wood charcoal).

24
China maintains both global export quotas and destination-specific quotas. Global quotas
are applied regardless of destination. Destination-specific quotas apply to live cattle, live swine,
and fowl to be exported to the Hong Kong and Macao SARs.
Global export quotas applied to 146 lines at the HS 8-digit level in 2007. Quotas on
certain exports can also be allocated through a bidding process. For exports subject to non-
automatic licensing, as for imports, applicants must obtain an export permit prior to applying for
a licence. China's non-automatic export licensing requirements are implemented mainly to fulfil
its obligations under international agreements, such as: Articles XX and XXI of GATT 1994; the
Montreal Protocol on Substances that Deplete the Ozone Layer; the Conventions on the
Prohibition of the Development, Production, Stockpiling and Use of Chemical Weapons and on
their Destruction; and the Convention against Illicit Traffic in Narcotic Drugs and Psychotropic
Substances.
China's schemes to promote exports comprise mainly tax concessions, export finance
operated by the Export-Import Bank of China (EXIM Bank), export credit insurance by the
China Export & Credit Insurance Corporation (SINOSURE), and export fairs. China does not
provide export subsidies.
In addition, MOFCOM provides online information to help enterprises export. The China
Foreign Trade Centre under MOFCOM holds export fairs, including the China Import and
Export Fair in Guangzhou twice a year. The International Market Exploration Fund for SMEs is
operated by MOFCOM and MOF, to facilitate SMEs' participation in overseas exhibitions, so as
to promote their presence in international markets and encourage them to explore new markets.
The China Council for the Promotion of International Trade (CCPIT) also helps to
promote international trade, by, inter alia, establishing contacts with foreign governments,
offering various consultation services, and helping enterprises to apply for patents and register
trademarks. As a non-profit agency, the CCPIT obtains some financial support from
government.
2.3 Trade Policies in Nigeria
Nigeria is a member of the African Economic Community (AEC) which was set up under
the Organisation of African Unity (OAU) which has been transformed into the African Union
(AU). The New Partnership for African Development is a major initiative under the AU. Trade

25
and trade-related measures articulated under NEPAD to foster African exports include:
promotion and improvement of regional trade agreements; inter-regional trade liberalization;
harmonization of tariffs, rules of origin, and product standards; reduction of export taxes and
costs of transactions and operations; promotion of African firms engaging in exporting and
importing business, and promotion of active participation of African countries in the multilateral
trading system.
Nigeria is also a founding member of the Economic Community of West African States
(ECOWAS). ECOWAS serves as a major avenue through which Nigeria's regional integration
efforts are carried out in the West African sub region. Among the programmes that are designed
to promote regional trade in the ECOWAS is a trade liberalization scheme (TLS) which has been
implemented since 1990. The objective of the TLS is to establish a free-trade area by removing
all barriers on all goods traded between member States. There are two major groups in the
ECOWAS: Those that belong to West Africa Economic and Monetary Union- WAEMU(the
Francophone countries); and those that are yet to formally launch the West African Monetary
Zone (WAMZ). For the purpose of negotiating an Economic Partnership Agreement with the
European Union, the ECOWAS common external tariffs (CET) was agreed upon by member
States in 2006 to consists of four bands (0%, 5%, 10%, and 20%) similar to those already being
applied by WAEMU member States. However, with the approval of Nigeria’s application, a fifth
band was introduced at 35%. Nigeria and six other ECOWAS member states (Benin, Burkina
Faso, Ghana, Mali, Niger, and Togo) are engaged in a free trade area programme, which seeks to
remove all physical and non-physical trade barriers (including remaining tariffs); eradicate rigid
border formalities; enforce the application of ECOWAS prescribed customs procedures; and
adopt a common ECOWAS passport.
Nigeria is eligible for non-reciprocal trade preferences under the GSP schemes of several
developed countries; the Cotonou Agreement with the European Communities (which is been
renegotiated on a reciprocal basis); and the United States' African Growth and Opportunity Act.
Nigeria is a member of the World Trade Organisation (WTO) and the Uruguay Round agreement has had
a great impact on Nigeria’s trade policy.
Import Policies in Nigeria
The importation of goods to Nigeria is governed by the Customs and Excise Management
Act; Customs and Excise Notices; and guidelines set out by the Federal Ministry of Finance.

26
Under these provisions, importers do not need to be registered, since registration with the
Corporate Affairs Commission under the Companies and Allied Decree of 1990 is sufficient to
import all but a few regulated goods.
Reforms to customs services are one of the core components of the Government's current
reform programme. The objective of the programme is to modernize and speed up customs
clearance; simplify and rationalize tariffs, duties, and waivers; improve revenue collection by
customs; and strengthen and professionalize customs service.
Nigeria's non-preferential rules of origin are contained in the Customs Duties Act. Goods
are considered originating in a country if they are wholly produced in that country or if the
value-added during production or a component incorporated in the goods is at least 75% of the
production costs. Nigeria also applies ECOWAS rules of origin, under which a finished product
has Community origin, if at least 60% of the raw materials used in its manufacture come from
ECOWAS members, or if the value-added is at least 35% of the ex-works cost price, excluding
taxes.
Nigeria uses the HS 1996 at the eight-digit level. Its 2003 applied MFN tariff had 5,146
lines; all duties are ad valorem. Nigeria bound some 19.2% of its total tariff lines at the HS
eight-digit level. All agricultural lines are bound in contrast with only 7% of non-agricultural
lines (WTO definitions). Tariffs range from 2.5% to 150%, with 19 different bands. The
structure of the MFN tariff as at 2003 is shown in Table 12.The simple average tariff rate is
28.6% with the average of 50.2% on agricultural products (WTO), 25.3% on non-agricultural
products (WTO), 41.4% on agriculture, hunting, forestry and fishing (ISIC), 17.9% on mining
and quarrying (ISIC), and 28.0% on manufacturing (ISIC). About 5% of the tariff lines have
domestic spikes while about 56.5% have international spike.
Table 12: Structure of the MFN tariffs as at 2003
S/N Category %
1. Bound tariff lines (% of all tariff lines) 19.2
2. Simple average tariff rate 28.6
Agricultural products (WTO definition) 50.2
Non-agricultural products (WTO definition) 25.3
Agriculture, hunting, forestry and fishing (ISIC, Div. 1) 41.4
Mining and quarrying (ISIC, Div. 2) 17.9
Manufacturing (ISIC, Div. 3) 28.0
3. Domestic tariff "spikes" (% of all tariff lines) 5.0
4. International tariff "spikes" (% of all tariff lines) 56.5
Source Nigeria Trade Policy Review, 2005

27
The summary of the MFN tariffs on agriculture as at 2003 is shown in Table 13. The
simple average tariff is highest for fruits and vegetables with the value of 98.2%. This is
followed by tobacco and beverages and spirits with the values of 89.4% and 75.3% respectively.
Cut flowers and plants have the least average tariffs of 20.3%.
Table 13: Summary analysis of the MFN tariff on Agriculture, 2003
No of
lines
No. of lines
used
Simple avg. Tariff
(%)
Tariff range
(%)
Total 5,146 5,124 28.6 2.5-150
By WTO definition
Agriculture 677 677 50.2 5-150
Live animals and products
thereof
81 81 34.5 5-100
Dairy products 20 20 48.1 5-100
Coffee and tea, cocoa, sugar,
etc.
128 128 44.5 5-100
Cut flowers and plants 34 34 20.3 5-65
Fruit and vegetables 150 150 98.2 45-100
Grains 16 16 49.4 5-100
Oil seeds, fats, oils and their
products
71 71 34.1 10-100
Beverages and spirits 31 31 75.3 5-150
Tobacco 9 9 89.4 15-150
Other agricultural products 137 137 20.4 5-100
Source Nigeria Trade Policy Review, 2005
The summary analysis of the MFN tariffs on non-agriculture but excluding petroleum is
shown in Table 14. The table shows that the mineral products, precious stones and precious
metals have the highest simple average tariff of 29.8% while chemicals and photographic
supplies have the lowest average tariff of 17.7%.
Table 14: Summary analysis of the MFN tariff on Non-Agriculture, 2003
Description No.
of lines
No. of
lines used
Simple avg.
tariff (%)
Tariff
range
(%)
Total 5,146 5,124 28.6 2.5-150
By WTO definition
Non-agriculture (excl. petroleum) 4,467 4,445 25.3 2.5-100
Fish and fishery products 108 108 28.4 5-100
Mineral products, precious stones and precious
metals
340 340 29.8 2.5-100
Metals 591 589 22.4 5-65

28
Chemicals and photographic supplies 844 842 17.7 2.5-100
Leather, rubber, footwear and travel goods 146 146 28.9 5-50
Source Nigeria Trade Policy Review, 2005
Within the context of accelerated integration amongst ECOWAS member states, Nigeria
is committed to adjusting its tariffs to the ECOWAS common external tariff, ranging from zero
to 20% with a four band tariff structure. In general, Nigeria has lagged behind in trade reforms
and hence has higher average and dispersed tariffs.
The general import guidelines provide for exemptions from import duties on a number of
goods, including: aircraft, their parts and ancillary equipment; life saving appliances; all goods
imported for the official and personal use of a Consular Officer, where the Government of the
country represented grants similar privileges; furniture and personal effect of diplomats; goods
obtained free as technical assistance materials from donor international organizations or
countries; personal and household effects in passengers' baggage; and military hardware and
uniforms. Various tariff concessions are also in place to attract investment.
As a member of ECOWAS, Nigeria provides tariff preferences to the other ECOWAS
member states. Furthermore, Nigeria grants tariff preferences to all Global System of Trade
Preferences participants. Tariff reductions of up to 80% of the MFN rate are applied on ten HS-
four digit groups including medicaments, cars and trucks.
Nigeria bound other duties and charges on all imports at 80%. Additional duties applying
only to imports include: a port development levy of 7% of the duties payable; an ECOWAS
community levy of 0.5%; a Comprehensive Import Supervision Scheme charge of 1% on the
f.o.b value of imports, a national automotive council levy of 2% on vehicles and parts; and a levy
of 10% on the importation of both sugar and rice.
VAT is calculated at 5% on the duty-inclusive c.i.f. value of imports and exports are
zero-rated. Excise duties were re-introduced in 1999 on spirits, cigarettes, alcoholic beverages,
and cosmetics, at rates ranging from 20% to 40%. Under Nigeria's customs legislation, import
prohibitions can be applied to protect domestic industries; to reduce balance-of-payments
deficits; as anti-dumping measures; and for moral, safety, and other purposes. The Government
modifies the import prohibition list, adding or subtracting items, through notices and decrees. As
at November 2004, agricultural and non-agricultural goods under some 218 HS four-digit codes
were subject to import prohibition, mainly for the purpose of protecting domestic industries.

29
Under the Customs Duties (Dumped and Subsidies Goods) Act 1958, goods are regarded
as having been dumped if the export price is lower than the "fair market price". In January 2002,
Nigeria notified the WTO Committee on Safeguards that import prohibitions on wheat flour,
sorghum, millet, and kaolin were in place for safeguard reasons. In accordance with Paragraph 9
of the Understanding on Balance-of-Payments Provisions of GATT 1994, and pursuant to the
consultations between Nigeria and the Committee on Balance-of-Payments Restrictions, Nigeria
submitted to the General Council a schedule for the elimination of restrictive trade measures
maintained for BOP reasons.
The Government considers countertrade arrangements and buy-back schemes as
strategies for conserving foreign exchange earnings. Therefore, it encourages companies and
individuals to undertake industrial projects by sourcing machinery and equipment from overseas
suppliers, through such arrangements, on a medium and long-term basis. However, countertrade
arrangements and buy-back schemes are not permitted for the importation of consumer goods.
The improvement in the use of public funds, at the Federal, State and local levels,
remains a priority of the Government. Nigeria is neither a member of nor an observer to the
WTO plurilateral Agreement on Government Procurement. Under its current public procurement
regime, the Government uses open tendering, selective tendering, and negotiated tendering to
purchase goods and services.
Nigeria has commenced the application of a modified CET from October 2006 and its
proposed fifth band of 35% was approved by the ECOWAS. The adoption by the CET has led to
substantial liberalisation of trade regime in Nigeria.
Export Policies in Nigeria
Export taxes were abolished in Nigeria in 1986 due to the liberalisation scheme of the
Structural Adjustment Programme (SAP). It also abolished Commodity Marketing Boards.
Exporters are required to be registered with the Nigerian Export Promotion Council (NEPC). All
export proceeds must be repatriated into the exporter's domiciliary account, maintained with the
processing bank, within 90 days of shipment. A currency retention scheme allows exporters to
retain 100% of their foreign exchange earnings in their domiciliary accounts.

30
The export amendment decree of 1992 prescribes that all raw material or unprocessed
commodities, whether mineral or agricultural, may be subject to the payment of an export levy as
may be prescribed, from time to time, by order of the NEPC
Under Nigeria's Export Prohibition Act certain exports are prohibited for purposes of
domestic food security, value-added considerations, and preservation of cultural heritage.
Currently, the ban covers raw hides and skins, timber (rough or sawn), scrap metals, unprocessed
rubber latex and rubber lumps, rice, yams, maize, beans, and artefacts and antiquities. Nigeria's
food safety regulations require export licences for unprocessed food products; in certain cases,
the Minister for Agriculture is empowered to prescribe grades and standards of quality for these
products.
The various incentive schemes available to exporters may somewhat reduce the anti-
export bias resulting from the protection of domestic markets by high tariffs and import
prohibitions. Export incentives in Nigeria include: company profits in respect of goods exported
are exempt from tax under certain conditions; profits of companies whose supplies are
exclusively input to the manufacturing of products for export are excluded from tax; export
processing zone companies are allowed full tax holidays for three consecutive years; investment
tax credits; retention of export proceeds in a foreign currency in a domiciliary account with a
Nigerian bank; export development fund to cover expenses on export promotion activities;
export adjustment fund to compensate exporters for high cost of local production, arising mainly
from infrastructural deficiencies; unrestricted remittance of profits and dividends; and zero-
rated VAT.
The Export Expansion Grant Fund scheme (EEGF) provides cash inducement (4% on
their total annual export turnover) to exporters who have exported a minimum of N500,000 of
processed products. The objective of the scheme is to stimulate exporters to expand the volume
of exports, and diversify their export product and market coverage. The main support to
exporters through banks is the Re-discounting and Re-financing Facility (RRF) scheme which
are designed to assist banks provide pre- and post-shipment finance in local currency for non-oil
exports.
A drawback scheme allows for duties (including other levies) charged on raw materials
used in the manufacture of products to be refunded upon the export of the final products. The
purpose of this scheme is to encourage manufacturing for exports. The scheme is to provide

31
automatic refunds of up to 60% upon initial screening by the Duty Drawback Committee; the
balance of the funds is granted upon final processing of the application. To be eligible, applicants
must be companies incorporated in Nigeria.
Under the manufacture-in-bond scheme, raw materials may be imported duty-free for the
production of export goods, on the basis of a bond issued by a recognized financial institution.
The bond is discharged upon production of proof of export and repatriation of foreign exchange.
The scheme faces: difficulties in the recovery of import duty in case of default; poor accounting
of input-output coefficients; lack of funds for the supervision of the scheme; and implementation
weaknesses. The scheme is under review.
The manufacture-in-Bond Scheme is designed to encourage manufacturers to import raw
material inputs and other intermediate products duty-free for the production of exportable goods,
backed by a bond issued by any recognized financial institution. The bond will be is charged
after evidenced of exportation and repatriation of foreign exchange has been produced.
The Export Development Fund (EDF) was set up by the Government to help finance
certain activities of private exporting companies. These include: participation in training
courses, symposia, seminars, and workshops; advertising and publicity campaigns in foreign
markets; product design and consultancy; participation in trade missions, buyer-oriented
activities, overseas trade fairs, exhibitions, and sales promotion; collection of trade information;
organization of export groups; and studies in respect of setting up export-oriented industries. The
maximum grant per company for each activity is 50% of the total direct costs approved, up to a
maximum of N200,000.
The law enabling EPZs was enacted in 1992 and supports the establishment of industries
and businesses within demarcated zones, principally for export purposes. EPZs are also being
used to address the infrastructural and regulatory deficiencies inhibiting export-oriented
companies in Nigeria. The Nigerian Export Processing Zone Authority (NEPZA) has
responsibility for overseeing the development and management of EPZs. Existing EPZs are
located in Calabar, Onne, Kano, and Lekki, but only the first two are operational. EPZs have
also been initiated by some state governments.

32
2.4 The Global Economic Crisis and Nigeria-China Trade Relations
The current global financial crisis was triggered by the sub-prime mortgage lending crisis in
2007 in the United State of America (USA). The global financial crisis is characterised by credit
squeeze and this has affected the world economy in no small measure since it became a full-
blown crisis towards the end of 2007. The crisis got to a peak in September 2008 when several
major financial institutions in the USA collapsed. Two of the famous investment banks, Lehman
Brothers and Merrill Lynch, were among the financial institutions that collapsed. While Merril
Lynch was acquired by Bank of America (at the cost of $33 billion), the USA government had to
acquire American International Group (an insurance conglomerate).
Other manifestations of the global financial crisis are disruption of credit/investment
flows and falling export commodities’ prices. There have also been fears of the global financial
crisis degenerating into global recession, widespread unemployment and inflation. The
underlying causes of the financial crisis include among others strong demand stimulated by easy
credit in the developed countries, high investment demand and growth in global external
imbalances, financial deregulation and innovations not sufficiently regulated, and expansionary
policies in the developed countries which encouraged speculation in financial assets and
commodities’ prices (Oyejide, 2009). The projected impact of the global financial crisis cum
economy recession on global economy is that world economy may shrink by at least 1% in 2009
while world trade growth may plummet to 2.1% in 2009 from 4.4% in 2008 and a peak of 8.5%
in 2006 (Oyejide, 2009).
The impact of the crisis on African countries has been manifested in reduction in the
demand for African exports, falling export commodities’ prices, unpredictable volatility in
commodities prices and costly trade finance/credits/insurance. In the literature, the
impact/channels of influence of the crisis have been analysed along four lines. And these are
along the lines of exports, export prices and terms of trade, current-account balances, and
international reserves (Oyejide, 2009). In the case of Nigeria, the channels of the financial
meltdown have been in the forms of the drastic fall in export commodities’ prices (oil and
agricultural commodities), bearish stock market activity and the restrictions/disruptions of
international credit/investment flows to needy sectors of the economy. While the price per barrel
of crude petroleum (the main export commodity of Nigeria) fell from a peak of $147 in July

33
2008 to $40 in January 2009,2 the nation’s stock market capitalisation fell from N12.047trillion
on April 1, 2008 to N6.382trillion on January 13, 2009 thereby resulted in a dramatic and
unprecedented fall of 47 percent within a period of nine months.3
The falling oil price in the international market alone has resulted in more than 50 percent
reduction in the nation’s oil revenue. The revenue has declined from $2.2billion to $1 billion on
a monthly basis.4. The dramatic decline in oil export revenue (accruing to government) has in
fact led to the drawing down of Nigeria’s excess crude oil savings from $20.44 billion (in
January 2009) to $11.20 billion (in June 2009). The nation’s foreign reserves have equally been
affected by reducing from $50.11 billion in January 2009 to $43.46 billion in June 2009.5 Even
Owing to the conscious of government on the adverse effect of the global crisis, a number
of fiscal, monetary and exchange rate policies have been packaged to address them. Among the
policies introduced are the 20 percent reductions in political appointees’ allowances/salaries,
unannounced freezing of public sector employees’ wages/salaries (at a time labour unions are
demanding for increased pay, which has stagnated at point since 2000 fiscal year), allowing the
naira to depreciate against the dollar (the anchor currency for the naira) as a sort of shock
absorber (and in the main assist in the conservation of foreign exchange), injection of liquidity
into the banking system, tightening of regulation and supervision, creation of special agricultural
fund (of N200 billion) and the pegging of lending rate at 22 percent (while the spread between
the deposit and lending rates is fixed at 7 percent).
Other measures taken by the Nigerian government (especially through the instrumentality
of her Central Bank) to address the financial meltdown are the reduction of the monetary policy
rate (MPR) from 10.25 to 9.75 percent (and later to 6 percent in July 2009), reduction of the cash
reserve requirement (CRR) from 4.0 percent to 2.0 percent, reduction of liquidity ratio from 40
2 However, in recent months (June and July, 2009), the international price of oil has been approaching $70 per
barrel (see The Nation, July 23, 24 and 27, 2009).
3 See Ibe (2009:70-71).
4 See The Nation, a daily newspaper, March 26, 2009, front page.
5 See The Guardian, a daily newspaper, July 27, 2009, pages 1 &2.

34
to 30 percent, directive to banks to restructure their margin loans until December 2009,6 and the
introduction of Retail Dutch Auction System (RDAS) to check speculative demand for foreign
exchange and the incorporation of a band of plus or minus three percent to ensure stability in the
foreign exchange market.7
With respect to the impact of the global economic crisis on the Nigeria-China trade
relations, the available data from the Central Bank of Nigeria8 on non-oil import by country of
origin and direction of Nigeria’s oil exports provide some information. Data on non-oil import
by country of origin reveals that Nigeria’s import to Asia rose from $6,957.98million in 2006 to
$7,813.16 million and $8,689.90 million in 2007 and 2008 respectively. Non-oil imports from
the people Republic of China to Nigeria increased from $2,473.94 million in 2006 to $2,866.60
million and $3,275.75 million in 2007 and 2008 respectively. This implies that the global
economic crisis has not affected bilateral import flows between Nigeria and China.
In the case of exports, Nigeria export of oil to Asia rose from $8,995.77 million in 2006
to $10,487.47 million and $13,973.39 million in 2007 and 2008 respectively. Similarly, Nigeria
export of oil to China increased from $914.82 million in 2006 to $4,055.92 and $4,412.65
million in 2007 and 2008. Therefore, it can be seen that the global economic crisis has not
hindered bilateral trade flows (import and export flows) between Nigeria and China.
III Review of Literature
3.1 Theoretical Literature
According to the standard trade theory, determinants or causes of Trade include comparative
advantage and pattern of trade, trade regimes and trade facilitation. Comparative advantage results
from differences in labour productivity between countries (David Ricardo: Comparative cost
advantage theory), differences in countries’ resource endowments and in the use of these
6 The banking sector must have been seriously affected by the meltdown that has afflicted the Nigerian stock
exchange as a whooping sum of N784billion was said to have been lent by banks for stock trading/purchase
perhaps during the bullish era of the stock market (see CBN, 2009).
7 See The Nation, a daily newspaper, April 8, 2009, page 19 under the caption How Nigeria has Managed the Global
Economic Crisis. The listing of government monetary policy measures was made public by the then Central Bank
Governor, Professor Chukwuma Soludo.
8 See appendix

35
endowments (Heckscher and Ohlin trade model), and exploitation of economies of scale or the
availability of increasing returns to scale in production (New Trade theory- see Markusen et al,
1995; Krugman and Obstfeld, 2006). Trade regime can be outward- or inward-oriented depending
on trade orientation and development strategy adopted by a country. The pattern of trade enables us
to see the type of trade occurring between two countries, whether inter-industry or intra-industry
which will enable us to know whether the trade relation is consistent with the developmental
aspiration of each country.
Generally, the impacts of trade have been of interest in the literature because of the
seeming contradiction between the claim of the gains from trade and persistence of trade
restrictions manifested by the slowness to embark on trade liberalisation by most countries of the
world. Trade leads to redistribution of income between the participants in the countries involved.
According to the economics literature, about 20% of rising wage inequality is caused by
increased trade (this may be higher for a developing country) while technological changes
account for most of the remaining 80%. The fact that trade often triggers technological changes
in developing countries implies that the income inequality effect of trade is larger for this
category of countries. Therefore, it is very pertinent to understand this distributional impact so as
to anticipate it and ensure the type of trade liberalisation that will increase incomes. In effect,
trade impacts on the adjustment costs required to compensate losers from trade.
Another effect of trade is that import-competing firms undergo some adjustments that are
detrimental to their profit interests because of the tendency for trade liberalisation to force them
to make structural changes that reduce their mark-ups of price over marginal cost. However,
there is a high tendency for these adjustments to enhance their efficiency and reduce their size,
which in turn is likely to lead to unemployment as in the case of textile industry in Nigeria.
Complementary-Competing Framework
A framework for the analysis of the complementary and competitive impacts of economic
relations between two or more countries is provided Kaplinsky (2008). This framework involves
analysis of the direct and indirect impact of the associated complementary and competitive
effects of economic relations. This framework examines different elements of the main channels
for their complementarity and/or competitiveness of Nigeria’s interest and development strategy
with that of the China. Put differently, in what ways is the relations between Nigeria and China
in consonance with Nigeria’s development goals and development aspiration? In situation where

36
the answer indicates that the relations, in most cases, promote and/or support Nigeria’s growth
and development strategies, then the relationship is considered to be complementary. It is also
possible to find some elements of the relationship that are rather competing with Nigeria’s
development goals and aspirations. It is expected that while some elements are complementary,
others are competing and hence policy makers should be aiming at net positive complementary
relationship. This, of course, requires coordination, analysis, and harmonisation of issues in the
relationship.
Table 15: A Framework for Assessing the Impact of China on Nigeria
Complementary Competitive
Direct Indirect Direct Indirect
Trade Btw China and Nigeria
(i) Trade gains: TOT
gains, gain in Market
share, BOT positions,
consumer and producer
surpluses,
compatibility with
industrialisation
aspiration
(ii) Trade induced
gins and loses:
factor mobility
(labour mobility and
FDI flows) Aid
flows, etc
(ii) Effect of
China’s or Nigeria’s
relations with other
nations
Btw China and
Nigeria
(i) Trade losses:
TOT loss, loss of
Market share, BOT
positions, consumer
and producer losses,
compatibility with
industrialisation
aspiration
(ii) Trade
induced gins
and loses: factor
mobility (labour
mobility and
FDI flows) Aid
flows, etc
(ii) Effect of
China’s or
Nigeria’s
relations with
other nations
Investment
Aid/Technical
Assistance
Global
governance
Migration
Environment
Source: Kaplinsky, 2008
The direct component of complementary and competitive impacts can be adduced from
bilateral relations. The indirect effects of both complementary and competitive impacts are not
easily discernible as they may manifest through Nigeria or China’s relationship with other
countries.

37
3.2 Review of Issues, Methodological approaches and findings of some previous studies
Increased China-Africa relation is a recent phenomenon, which needs intensive, rigorous
and periodic studies so as to inform policy fine-tuning. Most studies in the literature are on
Africa or SSA or developed nations and little or no study(s) have addressed the country specific
developmental impacts of the relations in a comprehensive manner.
Bhattacharya and Bhattacharyay (2007) examine the gains and losses of India-China
trade cooperation using trade intensity index and a gravity model to measure the impact.
Through analysis of the trade intensity indices the study reveals that India and China possess a
significant bilateral trade potential, which remains untapped before now. Both countries have
started negotiating for free trade arrangements based on their complementarities. The study
found that in the short run, India’s potential gain from the trade relations is relatively lower than
that of China due to the fact that, it imposes high tariffs. However, in the long run, India’s gains
are higher than China as soon as its tariff levels are brought at par with that of China. They
concluded that this trade relation is a win-win situation for both countries, which is in line with
their increasing dominance in global trade.
Another study was conducted by Breisinger and Thurlow (2008) that looked at the Asia-
driven resource booms in Africa that offers new opportunities for resource-rich African
countries. The authors opined that though contrary to the previous booms experienced, most
mining profits now go to the foreign firms, which leave less room for governments to use
revenue for pro-poor investments. The Study developed a simple computable general equilibrium
(CGE) model using Zambia as a case study. They discovered that despite the privatization, Dutch
disease remains a valid concern and may hamper economic diversification, worsen income
distribution, and undermine poverty reduction strategies. The study concluded that Mining
royalties must be increased and should be used to finance growth-inducing investments that
encourage pro-poor economic diversification else many African countries will remain caught in a
resource trap.
Stern and Steven (2000) gave a report that launch a debate on the proposed free trade
agreements (FTAs) between Brazil and India by providing some preliminary analysis. Two
different but complementary research methodologies were employed, and each of which
provides a different perspective on the possible impact of these agreements. Using the database
and general equilibrium model of the Global Trade Analysis Project (GTAP), the economy-wide

38
impact of a number of different tariff liberalisation scenarios have been evaluated. The results
suggest that SACU would achieve positive gains from bilateral trade liberalisation with South
Asia and Mercosur. Exports over a 2–3 year period would be 0.2 to 0.4 percentage points higher
than would otherwise be the case. But the gains would be greater from unilateral liberalisation,
an FTA with East Asia or even one with the rest of Africa. Almost all of the increased trade
resulting from bilateral liberalisation with Mercosur or South Asia arises from the artificial
diversion of demand away from favoured to less favoured suppliers (at the expense in the case of
SACU imports of South African consumers, including producers using imported inputs).
Cattaneo (2000) attempted to provide a critical assessment of the Regional Trade Model
for Southern Africa (RTMSA), the model underlying the only serious study to date, which
provides quantitative estimates at the sub-sectoral level of the impact of a SADC FTA on the
individual members of SADC. Evans’ (1997a) results suggest that the formation of a SADC FTA
will result primarily in trade creation, with little or no trade diversion. However, he illustrated
that, in consumer goods sectors, the excess capacity assumption and the assumption of equal
elasticity of substitution between imports from SADC and the rest of the world (ROW) and
between imports and domestic production in the RTMSA tends to exaggerate the likely trade
creation effects of a SADC FTA. Further, the absence of any reduction in imports from the ROW
at the country level in the 1997 simulation, except in the case of Mauritius, and the marginal
increase in ROW imports for some members appears to be anomalous results, given the
magnitude of the assumed elasticity in the RTMS.
3.3 Review of Scoping studies on China-Africa Trade Relations
Currently, China is Africa’s third largest commercial partner after the US and France. It
is the second largest exporter to Africa after France and is ahead of Britain in both categories
(Ajakaiye, 2006). The structure of the trade relation is such that exports from African countries
to China have been predominantly of extractive industries products – minerals, petroleum, metals
and timber – while China has been exporting finished goods ranging from machinery and
equipment to vehicles, textiles, and clothing and consumer electronics. One of the opportunities
provided by Chinese imports is their low prices and hence affordability, especially by the poor.
Ajakaye (2008) noted that Chinese imports may intensify the de-industrialization process
initiated by the liberalization policies embedded in the Structural Adjustment Programmes

39
(SAP). He made reference to Kaplinsky, et.al, (2006) for experiences of specific examples of
how these situations have arisen in specific African countries.
According to Corkin (2008), Angola is currently China’s largest trading partner in Africa,
accounting for roughly one fifth of China’s trade with the African continent. Angola’s export to
China rose from 243 million US dollars in 1996 to 10.9 billion US dollars in 2006 while China's
exports to Angola rose from 28.5 million US dollars in 1996 to 894 million US dollars in 2006.
He noted that China runs a considerable trade deficit with Angola (as one of the China’s main oil
producer) while Angola enjoys trade surplus with China.
In the case of South Africa, Burke et al (2008) indicate that South Africa is China's
second largest trading partner in Africa, after Angola. The trade volume between China and
South Africa accounted for 20 percent of the total trade volume between China and Africa. The
direct bilateral trade between the two countries started in the early 1990s and in 2004, South
Africa granted China market economy status. To correct this situation, South Africa and China
have committed to work together to create favourable conditions for growth in relations between
the two countries and to balance trade (Burke et al, 2008).
With respect to Nigeria, Ogunkola et al. (2008) noted that Nigeria’s exports to China
spread over many and varied products and increase from US$20.3 billion in 2000 to
US$44.4billion in 2005. They identify the top 10 export to China as at 2005 to include: Pulp of
wood/of other fibrous cellulosic mat; Tanning/dyeing extract, tannins & derives, pigm et; Prepr
feathers & down, arti flower; articles huma; Lac, gums, resins & other vegetable saps & extrac;
Oil seed, oleagi fruits, miscell grain, seed, fru ; Cotton; Cocoa and cocoa preparations; Copper
and articles thereof; Ores, slag and ash; and Mineral fuels, oils & product of their distillation.
Following the dramatic increase of Nigeria’s total imports between 2000 and 2005, the
country’s imports from China rose phenomenally from as little as US$252million in 2000 to
US$2.3billion in 2005 (Ogunkola et al, 2008).
There are many examples of African countries where trade with China is low. An
example is Kenya even though the volume and value of Kenya’s exports has been growing with
time (rose by 36.0% in 2006 to US$620 million) Onjala (2008). Quoting Broadman et al. (2006),
he noted further that the major exports to China are hides and skins, sisal, fibre, coffee, tea,
fishery products, horticultural products and scrap metals. He however recognized that there has
been a gradual growth in import value (total and from China) in the last three years (China’s

40
import from Kenya rose by 38.3% to US$20 million in 2006). In Ghana, export to China has
been very low compared to imports and the industrial sector in Ghana is being challenged with
the increased imports of manufactured goods from China Tsikata et al (2008). Also it appears
that the rapid growth of China since the turn of the new millennium has proved disastrous for
Mauritian exports (Ancharaz, 2008). Part of the evidence given is that since 2002 exports have
been on a downward path, declining by a cumulative 41 percent over the period 2002-2006 to
reach Rs. 166 m in 2006.
The foregoing have shown that the Scoping studies just provides the ground for further
detailed studies
IV Theoretical/Analytical Framework and Methodology
The analytical frame work of this study is multi-dimensional given the various issues to be
addressed.
4.1 Theoretical/Analytical Framework for Macroeconomic Analysis
In order to analyse trade potential between China and Nigeria and to be able to quantify gains
and losses and hence, identify gainer and loser between the two countries, we adopt the trade
intensity measures and gravity model.
The trade intensity index is a way of measuring trade performance between two
countries. The index will enable us to see the trajectory of trade over the years and the trade
orientation of a country with its trading partner. Besides, it helps to analyse how intensively the
countries are trading with each other.
This study also adopts gravity model to analyse bilateral trade relations between China and
Nigeria. Gravity models are commonly used as an analytical framework in empirical studies of
bilateral trade flows. The basic form of the gravity model explains the level of export from
country i to country j by GDP of exporting country, GDP of importing country, and distance
between them. Gravity equation can be used not only to analyze trade patterns and trade
potentials but also to address the impact of preferential trade arrangements (PTAs) and formation
of free trade area (FTA). Indeed, such an exercise can be done in order to simulate trade
potentials and trade benefits corresponding to any bilateral or regional integration scheme
between any groups of countries. In this respect, we estimate the determinants of trade flows
from Nigeria or China (exporting country) to China or Nigeria (importing country).

41
The Gravity Model has a number of advantages in analyzing the inter- or intra-regional
trade, particularly for the PTA and FTA. It provides a good measure of trade creation. Among its
limitations is that it does not take into account the possible impact of the terms of trade
associated with trade creation. Hence, the simulated results based on the Gravity Model are
generally upward biased. The estimates also give the results in a static framework, and the extent
of intraregional trade will possibly further increase if the estimation is carried out in a dynamic
framework, incorporating the effects of factors like terms of trade, scale economies, technology
spill-over, investment inflows, trade liberalization, and so on. These could reinforce the short
term trade creation, thus, underestimating the true long-run impact. Paucity of data limit the
possibility of estimating the parameters related to some of these factors. For instance, we can
only find proxy for some price elasticities but information on scale economies is not available.
Nevertheless, some existing studies have shown that the short-term impact is higher than the
dynamic impact. In addition, the results also do not take into consideration the concessions
offered in the form of non-tariff barriers, it only considers reduction of tariffs under different
scenarios, which is purely hypothetical. Further, the results of alternate scenarios have also not
measured the effect of PTAs/FTAs on different variables related to welfare.
If the simulations correctly gauge the impact on trade creation, this impact is not the only
factor to consider when evaluating FTAs. It is to be noted that the negative effect on bilateral
trade with countries not entering in the simulated arrangement is not assessed in the simulations.
Therefore, none of the indicators from the simulations could be viewed as a welfare measure,
which necessities caution in the applications of results in policy analysis. It should be mentioned
that the results of the simulations serve limited purpose of providing an estimate of the potential
effects of bilateral trade between Nigeria and China based on a particular year data. The study
therefore analyse the likely increase in Nigeria-China trade under some hypothetical situations.
In this analysis, the impact of PTAs in terms of the proportionate change in exports and imports
of Nigeria and China (in dollar terms) are measured. The higher the initial tariff level on trade
between partners, the greater the final effect of reduction and elimination of tariffs. The result of
reduction of tariffs would be reflected in increasing the estimated values of a4 and a5. However,
tariff is only among many other factors that determine the impact of PTAs and FTA on trade. In
evaluating the impact, the following are important. First, the tariff (1+ TRn,c ), that is, (1 +
percentage tariff of ‘n’) (where n = Nigeria and c = China), presents tariffs imposed by Nigeria

42
on its imports from China. Similarly, the tariff (1 + TR c, n ), that is, (1 + percentage tariff of
‘c’), which means tariffs imposed by China on its imports from Nigeria. Since TRn,c (i.e. tariffs
imposed by Nigeria on its imports from China) is higher than TRc,n (i.e. tariffs imposed by
China on its import from Nigeria), the higher the coefficient of tariffs (in absolute values), the
greater the impact of preferential arrangement. Second, since a4 and a5 are elasticities indicating
the proportionate response of bilateral trade to changes in tariffs of China and Nigeria, the initial
tariff levels as well as initial trade level are relevant for determining the absolute changes in trade
in both Nigeria and China following PTAs/FTA.
4.2 Theoretical/Analytical Framework for Microeconomic Analysis
The standard trade theories would guide the analysis of the causes and pattern of trade
between China and Nigeria as well as the income distribution effect. It would also guide analysis of
the consequences of trade for economic agents in each country. This will be supplemented with the
competitive and complementary framework developed by Kaplinsky (2008) to analyse the impact
of economic relations between countries. This study would identify the gainers and losers and
verify how and extent of the gains and losses accrue to different economic agents as well as the
sources of the gains and/losses. The economic agents include:
Nigerian producers and exporters
Nigerian consumers
Nigerian importers
Causes and consequences of trade between economic agents in the two countries
For exporters-resource endowment is the main cause of trade (oil as the major export-mainly
by government and foreign firms).
o Increased demand and price of oil export drive increased trade relations
o Welfare effect on the people depends on state of governance (absence of corruption)
For consumers of foreign goods (imports)-Chinese goods
o Availability of varieties of cheap (and quality) products drive increased trade
relations
o Benefits from infrastructure provided through export receipts by government
o Welfare effects can be positive or negative
For domestic producers
o Availability of Cheap and quality imported inputs drive increased trade relations
o Market opportunities abroad
o Benefits from infrastructure provided through export receipts by government
o Competition effect can be positive or negative
For importers of foreign goods (imports)-Chinese goods
o Increased demand for varieties of cheap (and quality) products by consumers in
domestic market (consumers’ preference) drives increased trade relations

43
o Increased demand for varieties of cheap (and quality) inputs by producers in the
economy (producers’ preference) drives increased trade relations
o Benefits from infrastructure provided through export receipts by government
o Market diversion to trading partner is with positive profit effect
4.3 Methodology of the Study
Going by the objectives of this study, it is obvious that a number of techniques have to be
adopted. Thus, we adopt trade intensity index and gravity model (that is often applied to the study
of bilateral economic arrangement or relations) to analyse trade potential between China and
Nigeria. The gravity model is to be estimated with panel data econometrics techniques. With the
aid of the gravity model results, we would simulate the likely impact of preferential trade
arrangements (PTAs) and formation of a free trade area (FTA) on the two countries. This would
enable us to analyse the potential gainers and losers from these scenarios.
This study is also based on a survey of opinions of the various stakeholders on the
impacts of China-Nigeria trade relations on their economic activities and welfare. The survey
covers issues in the terms of reference. The table 16 below presents the terms of reference against
the methodology.
(a) Trade Intensity between Nigeria and China
Trade intensity index is defined as the share of one country’s trade with another country,
divided by the other country’s share of world trade. The value of index ranges from 0 to 100. If
the value is 0, it implies no trade relationship between the partner countries. On the other hand, if
the value of trade intensity index is more (or less) than 100, it indicates that country i is trading
more (or less) from country j than might be expected from that country’s share in total world
trade. We have both the import intensity and export intensity indices.
The Import Intensity Index between China and Nigeria (MIIij) is shown as follows:
MIIij = [Mij / Mi ] / [ Xj / ( Xw – Xi ) ]
Where:
MIIij = Import intensity index of trade of country i with country j
Mij = Import of a country i to trading partner j
Mi = Total import of country i

44
Xj = Total export of country j
Xw = Total world export,
Xi = Total export of country i
i,j = China and Nigeria respectively
Export Intensity Index (XII) can also be measured as follows:
XIIij = [ X ij / X i ] / [ M j / ( M w - M i ) ]
Where:
XIIij = Export intensity index of trade of country i with country j
Xij = Export of country i to trading partner j
Xi = Total export of country i
Mj = Total import of country j
Mw = Total world imports
Mi = Total imports of country i
i, j = China and Nigeria respectively
These indices are computed for both China and Nigeria over 1995 to 2007
(b) A Gravity Model of Analysing Trade Relations Between China and Nigeria
Following the above framework, Srinivasan and Canonero (S-C) have estimated the
effects of PTAs on South Asian countries. We therefore follow this approach in this study and
the S-C model is adopted and specified as follows:
Log BTI c, n, t = a0 + a1 log (GNP c, t * GNP n, t ) + a2 log ( PCGNPc, t * PCGNPn, t ) + a3 Dc,
n + a4 log ( 1 + TR n, c ) + a5 log ( 1 + TR c, n ) + a6 log REXRTc, n, t + e c, n, t
…………………………………………………………………………………….……………(1)
Where,
BTI c, n, t = Bilateral trade of commodity ' i ' between country 'c' and country 'n' at time’t’ (i.e.
bilateral trade between China and Nigeria, which is the sum of exports and imports);
GNPc, t (or GNPn, t ) = Gross National Product of country 'c' ( or 'n' ) at time t
PCGNPc, t (or, PCGNPn, t) = Per capita Gross National Product of country 'c' or country 'n'.
Dc, n = Distance between relevant centres of 'c' on country 'n'.

45
TRc, n = Tariff rate imposed by country 'c' on products imported from country 'n'.
TRn, c = Tariff rate imposed by country 'n' on products imported from country 'c'.
REXRc, n, t = Real Effective Exchange Rate between countries 'c' and 'n', at time 't', measured in
US $.
u, v = country specific effect
w = temporal effect
η = random effects
c, n = China and Nigeria
e c, n, t = u c + v n + w t + η c, n, t
The theoretical expectation is that trade between two equal size countries will be greater than
between one large and one small economies. This observation is also in line with the objective
resistant factors, which states that trade intensity between two countries is likely to be high if the
combination of countries are between industrial good exporter and primary good exporter. On
the other hand, if the combination is between either industrial good exporter or primary good
exporter, the intensity will be low. Therefore, ‘a1’ of equation (1) will be positive. Both distance
and tariff barriers restrict trade flows between two countries. Therefore, coefficients a3, a4, and a5
will be negative. The effect of real exchange rate on total trade is ambiguous. Panel data are used
in this model, the utilization of which requires special treatment of the error terms shown in
equation (1). A more general expression of the error term ‘e c, n, t ‘can be written as follows:
e c, n, t = u c + v n + w t + η c, n, t …………(2)
Where,
u & v = country specific effects
w = temporal effects, and
η = random effects
In equation (2), one can avoid consistency problems arising from country-specific effects by
estimating equation (1) with its variables defined as deviations from their individual means. But
this is not the reasonable proposition simply because of the fact that the effects of PTAs and FTA
are being evaluated, and therefore, one should know the values of the tariff variables viz. (1+ TR

46
c, n) and (1+ TR n, c), which are eliminated from the estimated equation, once the variables are
expressed as deviation from their means (Srinivasan and Canonero 1993).
After estimating all parameters in equation (1), one can estimate the parameters of
variance component model of equation (2). The problem of using country dummies will be
solved if ‘u’ and ‘v’ are fixed effects. But if these effects are random, the more appropriate way
to estimate equation (1) would be by using Generalized Least Square (GLS), taking into
consideration of the variance of country-specific effects to the variance of e c, n, t .
We used data generated by seven product categories of export and import over 1990 to
2006 to estimate panel data models (panel least square, fixed effect and random effect models).
More discussions about the data and estimations shall be done in the empirical analysis.
(c) Simulation Exercise
A comparative static analysis of tariff reductions under different scenarios and its
resultant effects on increase in imports and exports of both Nigeria and China are also done. The
objective of this analysis is to examine the likely increase in intra-regional trade (measured in
terms of higher rates of growth of exports and imports) of both the countries due to different
PTAs and FTA. To conduct the simulation exercise, we used the estimated parametric value of
‘a4’ and ‘a5’ from the fitted regression equations, and changes in tariff rates under different
alternative scenarios. The percentage rise in import from n to c (i.e. from Nigeria to China) and
percentage increase in exports from c to n (i.e. China to Nigeria) are to be computed using the
methodology employed by Bhattacharya and Bhattacharyay (2007), which is expressed as
follows:
[ exp { â4 log ((1+TR n, c ) t1 / ( 1+ TR n, c ) t0 ) + ½ σ 2 } -1 ] * 100
an increase of import of n from c (i.e. imports from Nigeria to China)
[ exp { â5 log ((1+TR c, n ) t1 / (1+TR c, n ) t0 ) + ½ σ2 } – 1 ] * 100
an increase of exports from c to n ( i.e. from China to Nigeria)
where,
σ2 = σ^2 a4 log ( 1+TR n, c ) + a5 log ( 1 + TR c, n )
The elasticities used in these simulations are tariff elasticities but not the price elasticities.
They show the increase in demand due to reduction in preferential tariffs. Thus, 1+TR is the

47
most appropriate method to estimate the increase in trade due to reduction in tariff rather than
price. If elasticities (1+TR) are high it may be due to distance factor (Bhattacharya and
Bhattacharyay, 2007).
This study explores four hypothetical scenarios of PTAs and FTA between the two
countries as follows:
(i) 25 % across the board tariff cuts by China and Nigeria
(ii) 50 % across the board tariff cuts by these two countries
(iii) 75 % across the board tariff cuts by the same countries
(iv) 100 % tariff cuts i.e. free trade between them.
(d) Field Survey of Opinions of stakeholders on the gains and losses as well as other related
issues on the impact of China-Nigeria trade relations
Different questionnaires were designed and administered to different stakeholders
(consumers, manufacturers, exporters and importers) to elicit their opinions on the gains and
losses as well as other related issues on the impact of China-Nigeria trade relations. The survey
was conducted in Lagos because of the idea that most industrial and foreign trade activities occur
in this Nigeria’s city. Among the major markets in which questionnaires for consumers and
importers were administered are Chinese market at Ojota, Computer village at Ikeja, and Oshodi
and Aswani markets. About between 200 and 500 people patronise these markets on a daily
basis. These are markets where there are many importers and consumers of foreign goods. We
obtained links with manufacturers and exporters through their associations such as Nigerian
manufacturers association (MAN) and Nigerian Export promotion council (NEPC). The
breakdown of the number of questionnaires administered is given below.
Distribution of Questionnaires by Respondents
S/N Stakeholders Number of
Questionnaires
administered
Quantity
Retrieved
1 Consumers 300 300
2 Manufacturers/exporters (both small and
large scale producers)
100 53

48
3 Importers 100 100
Total 500 453
The questionnaires were allocated to cover the main products categories as follows:
(1) Agro-allied product category, which includes cocoa and cocoa products, coffee and other
agric export products
(2) Mineral products (oil and other mineral products):
(3) Manufactured product categories, including the following:
Food, beverages and tobacco:
Textiles, wearing Apparels, clothing, leather and leather products:
Wood, wood products and furniture:
pulp, paper and paper products:
printing and publishing:
Chemical and pharmaceutical products:
Domestic and industrial plastic and rubber:
Non-metallic mineral products:
Metal products (basic metal, iron and steel):
Electrical and electronics:
Motor vehicles and miscellaneous assembly.
Given that women patronise markets than man, we allocated 60.0 percent of the questionnaires to
them. Also, due to the nature of the questionnaires and time available for the survey, they were
administered to literate people (with at least secondary school qualification) that will be able to respond
appropriately and would not need interpretation.

49
Table 16: Summary of Methodology of the study
S/N Terms of Reference of the Study Methodology Data Source
1. Analysis of the country’s economic structure and performance,
paying particular attention to the role of trade with China. Trend and comparative analyses of indicators of
economic structure and performance (tables, graphs,
figures,).
WDI and IFS
2. Analysis of the country’s export growth, by sector and export
destination, paying specific attention to the contribution of China
in terms of export volume, export prices and export earnings.
(i) Trend Analysis of export growth indicators
using graphs, tables and charts. (ii) Regression analysis of bilateral export performance
WDI, IFS, World Bank
DOT, ITC, UNCTAD,
WTO and WITS.
3. Analysis of the country’s relative gains and losses generated by
exports to China, paying particular attention to their sources (in
terms of volume and price changes) and their sectoral
distribution.
A. Trend Analysis of : (i) Price/ Terms of trade changes by export
products/sectors (ii) Volume changes by export products/sectors (iii) Revenue changes by export products (graphs,
tables and charts). B. Gravity model: Simulations
WDI, ITC, UNCTAD and
WITS data base.
4. Identification and analysis of the key export stakeholders,
classified by key sectors, relative gains and losses, gainers and
losers, and sources of their gains and losses.
Survey and case study: In-depth Interview and
questionnaires administration to elicit info from various
Stakeholders (consumers, importers, producers, trade
associations and OPS, govt, etc).
Primary Data
5 Analysis of the country’s import structure and performance, by
key sectors and import sources, with specific focus on the
contribution of China in terms of import volume, and import
prices.
Trend Analysis of indicators of import structure and
performance using graphs, tables and charts, etc. WDI, World Bank DOT,
ITC, UNCTAD and WITS
data base
6 Analysis of the country’s relative gains and losses generated by
imports from China, paying particular attention to the sources (i.e.
volume and price changes) and the sectoral distribution of these
losses and gains.
A. Trend Analysis of : (i) Price/ Terms of trade changes by export
products/sectors (ii) Volume changes by export products/sectors (iii) Revenue changes by export products
(use of graphs, tables and charts).
B. Gravity model: Simulations
WDI, World Bank DOT,
ITC, UNCTAD and WITS
data base.

50
7 Identification and analysis of the key import stakeholders
classified by key sectors, relative gains and losses, gainers and
losers, and sources of their gains and losses.
Survey and case study: In-depth Interview and
questionnaires to elicit information from various
Stakeholders (consumers, importers, producers, trade
associations and OPS, govt officials, Chinese Markets
or Towns, etc).
Primary Data
8 Analysis of the evolution of Chinese trade regime and trade policy Review of trade policy documents and content analysis WTO Trade Policy
Review documents
9 Analysis of the evolution of the Nigeria’s trade regime and trade
policy……… Review of trade policy documents and content analysis WTO Trade Policy
Review documents
10 Analysis of any bilateral and/or regional trade agreements and/or
special trade arrangements between the country, and China, with
particular focus …….
Review of the agreements and content analysis Federal Ministry of
Commerce and Industry in
Nigeria and Chinese
Embassy.
11 Identification and analysis of the opportunities which can be
derived by the country and the challenges from its trading
relationship with China.
Identification and analysis of Domestic opportunities
(empt, tech. and constraints (threats, infrastructure)
12 Articulation and analysis of the policy responses which could
enable the country maximize the benefits derivable from its
trading relationship with China and minimise the losses, etc.
Information from all the
various analyses carried
out

51
V EMPIRICAL ANALYSIS
V.1 Macroeconomic Analysis of impact of China-Nigeria Trade Relations
Analysis of Trade Intensity between Nigeria and China
In order to know the trajectory of trade flows (export and import flows) between Nigeria
and China over about 13 years, we computed trade intensity index. This index enables us to
analyse how intensively Nigeria and China are trading with each other. This index ranges
between the value of zero (0) and 100. The value of zero (0) indicates that there is no trade
relationship between the two countries, while values higher than zero and up to 100 indicates
the significance of trade relationship and the value of 100 desired, maximum or expected level
of trade relationship. However, values exceeding 100 implies that a country is trading with its
trading partner more than expected from the country’s share in world trade.
Table 17 presents export and import intensity indices of Nigeria and China over a 13
year period (1995 to 2007). It can be seen from the table that the intensity of China’s export to
Nigeria (Xllij) has been high over time. During the 1995-99 period, export intensity index rose
from about 39.5 in 1995 to 103.0 in 1999. This indicates that during this period, China exported
more and more and even beyond what it was expected to export to Nigeria in 1999. This
development is traceable to economic growth recorded by Nigeria and the need to demand for
more manufactured products from China in order to facilitate industrial activities in Nigeria.
Apart from 2000, the trend continued through 2001 to 2003 as the index shows that there are
demand pressures from Nigeria that made China exported more than what it ought to.
However, by 2004 the index dropped to 84.1 and further to 77.2 in 2006. Nevertheless, the
index jumped to 116.5 in 2007, which is the beginning year of the global financial crisis, thus
suggesting the crisis is yet to have a significant impact on the Nigeria-China trade relations. On
the other hand, the intensity of Nigeria’s export to China (Xllji) has been somehow low and
around 60.0 throughout the entire period. During 1995 to 1998, it was very low and negligible
in 1996 (0.33). By 1999, it rose to about 45.0 and further to 62.23 in 2000 before taking a
declining trend in 2001 through 2003. Subsequently in 2004, it rose to 31.2 and thereafter
declined to 11.4 in 2006 and jumped to about 25.0 in 2007. This analysis shows that Nigeria
has exported less than it should do to China. The combined analysis of export and import may

52
suggest the trend of balance of payments position between the two countries. The expectation is
that since China tries to utilise its export potential or opportunities with Nigeria more than the
case of its import, China is likely to record surplus against Nigeria.
The foregoing analysis of export and intensity indices of China with Nigeria (columns 2
and 4 on the table) represents a mirror image of the analysis of import intensity indices of
China with Nigeria (columns 1 and 3 on the table). This is because the indices show that China
import less from Nigeria while Nigeria import more from China than expected. It should be
mentioned that Nigeria should strive to increase its level of export to China more than it
currently does, while China may want to maintain 2007 level (if not at 2002-2003 level) it
attained,. Therefore with appropriate policies, there is some scope for increasing bilateral trade
relations between Nigeria and China.
Table17: Trade Intensity Indices for Nigeria and China
Year Mllij Xllij Mllji Xllji
1995 24.99 39.49 40.79 26.00
1996 0.33 32.68 33.68 0.35
1997 3.27 58.90 61.15 3.41
1998 7.09 98.29 101.21 7.45
1999 44.94 103.02 106.05 47.42
2000 58.33 70.68 72.58 62.23
2001 30.57 107.89 110.60 32.89
2002 14.18 137.51 143.29 15.25
2003 6.13 135.27 141.76 6.65
2004 31.23 84.13 88.31 34.16
2005 27.31 81.51 86.48 29.89
2006 11.44 77.15 82.56 12.52
2007 24.65 116.51 124.20 26.98 Source: Computed, Underlying Data Obtained from the IMF data base, Direction of Trade Statisctics, 2008.
Note i and j represent China and Nigeria, respectively.
Impact of Trade Policy on Bilateral Trade Relations between China and Nigeria.
The panel regression results (based on the gravity model) on the impact of trade Policy on bilateral
trade between Nigeria and China are presented in table 18. The R-squared is generally high, while the
Durbin Watson statistics are within the acceptable bound. The Lagrange multiplier (L-M) values of
37.93 implies that panel estimation techniques (fixed and random effects models-2 and 3) are superior
to the classical pooled estimation (Least Square model 1). Also, the Haussmann specification test

53
statistic of 10.53 is far less than the corresponding value of 18.30 in the chi-square table with ten
degree of freedom. Hence, we conclude that, of the fixed and random effect models, the fixed effect
model is better. However, it can be seen from the table that results obtained from different estimation
techniques are similar.
Worthy of note in the results is the significant of the economic size and trade policy variables
(GDP and tariffs of both nations) in all the various specifications. As expected, the economic size of
the countries plays a major role in promoting trade relations between the two countries. While the
positive sign of the coefficient of China’s tariff implies that there is a positive (direct) relationship
between tariff and trade, the negative sign of the coefficient of Nigeria’s tariff implies an inverse
relationship between the two variables. It should be mentioned that while the sign of the coefficient of
China’s tariff is inconsistent with a priori expectation that of Nigeria is consistent (lower level of tariff
should promote trade, while higher level should hinder trade-inverse relationship). These results
suggest that higher level of tariffs in China promotes trade with Nigeria (and vice-versa), while higher
level of tariffs in Nigeria hinders trade with China (and vice-versa). The per capita income (which
reflects the purchasing power of the people in the countries) hinders trade relations between them. This
result may be reflecting the effect of the lower level of per capita income in Nigeria compared to
China. The distance variable carries the expected negative sign, (which indicates that the longer the
distance the lower the level of trade between two countries) but is not significant in most of the
equations. Similarly, the real exchange rate variable shows positive effect but such effect is not
significant in most equations.
Table 18: Regression results on the impact of trade Policy on Bilateral trade Between Nigeria and China
Variable Panel Least squares Fixed Effect Random effect
Constant 11.71841* 40.73362* 11.63879**
REER 0.487838* 0.073474 0.234389
Nigeria’s tariff -1.191341* -1.847790* -1.317214**
China’s tariff 0.923799* 0.993883* 0.835652*
NGDP*CGDP 0.187083** 0.352070* 0.163103*
NPCI*CCPI -0.361264*** -1.088015* -0.191609
Distance -0.694000 -8.170000* -6.410000
R-Squared 0.724 0.749 0.678
Adjusted R-Squared 0.690 0.735 0.659
D. Watson 2.208 2.07 1.77
F-statistics 21.4 (0.0000) 67.3 (0.000000) 5.067 (0.0012)
LM statistics 37.93 -
Haussmann statistics - 10.53 vs 18.30 -
Source: Computed *, ** and *** denotes statistically significant at 1%, 5% and 10% respectively.

54
Analysis of the Potential Gainers and Losers from PTAs and FTA: Simulation Results based on the
Gravity Model
This section presents a comparative – static analysis of the possible change in the bilateral trade between
Nigeria and China due to preferential trade agreements (PTAs) and free trade area (FTA) negotiations. This
simulation exercise is conducted to provide an indication of how and to what extent tariffs should be
cut by both Nigeria and China to provide beneficial effects in terms of increase in export and imports
based on 2006 data on trade and tariffs obtained from the World Integrated Trade Solutions (WITS)
database. The simulation exercise is meant to provide to provide information to the policy makers
about the implications if possible trade liberalisation arrangement between Nigeria and China.
We adopted four forms of hypothetical scenarios for the simulations exercise, which are tariff
cut of 25% 50%, 75% and 100%. Since the simulation experiment is based on the regression result
presented earlier (particularly on Nigeria’s tariff and China’s tariff), therefore they may reflect on the
simulation results. This is because while the sign of the coefficient of Nigeria’s tariff is negative,
indicating an inverse relationship between tariff and trade (which is consistent with the a priori
expectation) that of China is positive, implying a direct relationship between the two variables. These
alternative results may therefore show up in the simulation results. The simulation experiments have
been done to cover seven principal commodities traded between the two countries. These products are
food and live animals; crude materials (inedible); mineral fuels, lubricants and related products;
chemicals; machinery and transport equipment; manufactured products and miscellaneous
manufactured products. The expectation is that the country with lower initial tariff level will gain more
than its trading partner, and vice-versa. Since Nigeria’s simple average applied rate was 28.6 percent in
2006 compared to China’s rate of 9.8 percent, then increase in China’s export to Nigeria will be much
more than the latter’s export to the former. Nigeria’s export products to China are mainly crude
materials and mineral fuels, while China’s export products to Nigeria are principally Chemicals and
manufactured products.
The simulation results are presented in Tables 19 and 20. It can be seen from the Table 19 that a
25 percent tariff cut will lead to a reduction in Nigeria’s export to China by about 90.0 percent for all
categories of products. However, a 50.0 percent tariff cut will result in a rise of export of all products
particularly chemicals (19.3%), mineral fuels (16.6%) and some manufactured products. A 75.0 percent
cut in tariff will result in a significant percentage rise in export of all categories of product ranging
between 24.1 percent (for crude materials) and 40.9 percent (for chemicals). The result shows that

55
negotiation of an FTA between the two countries (100% tariff cut) will lead to a reduction in Nigeria‘s
export to China (all categories of product) by a range of 17.9 to 27.0 percent.
Table 19: Likely Change in Nigeria’s Exports to China (China’s import from Nigeria) under Different PTAs and
FTA, based on 2006 data
Principal
products
traded
Nigeria’
s
exports
to China
in 2006
($’Mill)
Averag
e
China’s
MFN
Tariff
in 2006
Equivalent monetary change in Nigeria’s
export to China (China’s imports from
Nigeria) Millions US $
% change in Nigeria’s export to China
(China’s imports from Nigeria) as a
result of tariff cuts
Scenari
o 25%
tariff
cut
Scenari
o
50%
tariff
cut
Scenari
o
75%
tariff
cut
Scenari
o
100%
tariff
cut
Scenari
o 25%
tariff
cut
Scenari
o 50%
tariff
cut
Scenari
o 75%
tariff
cut
Scenari
o 100%
tariff
cut
Food and live
animals
0.03 9.44 -0.024 0.002 0.008 -0.006 -90.01 9.23 29.07 -22.54
Crude
materials,
inedible,
except f
23.71 0.96 -21.46 1.19 5.71 -6.29 -90.53 5.02 24.09 -26.52
Mineral
fuels,
lubricants
and related
products
241.78 2.64 -218.02 40.13 91.32 -49.09 -90.17 16.60 37.77 -20.30
Chemicals 0.09 8.12 -0.078 0.017 0.036 -0.016 -89.81 19.25 40.90 -17.90
Manufacture
d goods
classified
chiefly b
11.61 9.01 -10.41 1.80 4.24 -2.42 -89.69 15.52 36.55 -20.86
Machinery
and transport
equipment
0.46 8.12 -0.41 0.061 0.15 -0.10 -89.81 13.39 33.99 -21.94
Miscellaneou
s
manufactured
articles
0.08 9.53 -0.076 0.011 0.028 -0.017 -89.91 12.99 33.51 -20.54
Source: Computed
With respect to simulation result for China, Table 20 reveals that with a 25 percent cut in tariff,
China’s export to Nigeria will rise except in the case of chemicals and miscellaneous manufactured
products. Further, a 50.0 percent cut in tariff will engender a rise in China’s export (of all categories)
to Nigeria by between 5.96 percent (for miscellaneous manufactured products) and 23.5 percent (for
crude materials). Similarly, a significant cut in tariff by 75.0 percent will lead to a substantial rise in
China’s export to Nigeria by between 25.2 percent (for miscellaneous manufactured products) and 45.9
percent (for crude materials). As in the case of Nigeria, negotiation of an FTA will result in a decline in
export of all kind of products by percentage ranging between 13.6 and 25.8.

56
Table 20: Likely Change in China’s Export to Nigeria (Nigeria’s Imports from China) under Different PTAs and
FTAs, based on 2006 data
Principal
products
traded
China’
s
exports
to
Nigeria
in 2006
($’Mill
)
Average
Nigeria’
s MFN
Tariff in
2006
Equivalent monetary change in China’s
export to Nigeria (Nigeria’s imports from
China) Million US$
% change in China’s export to Nigeria
(Nigeria’s imports from China) as a
result of tariff cuts
Scenari
o 1
Scenari
o 2
Scenari
o 3
Scenari
o 4
Scenari
o 25%
tariff
cut
Scenari
o 50%
tariff
cut
Scenari
o 75%
tariff
cut
Scenari
o 100%
tariff
cut
Food and live
animals
35.25 16.69 0.123 3.75 10.83 -7.59 0.35 10.64 30.73 -21.54
Crude
materials,
inedible,
except f
10.64 8.63 1.273 2.49 4.88 -1.45 11.96 23.45 45.86 -13.62
Mineral
fuels,
lubricants
and related
products
2.33 5.94 0.18 0.44 0.94 -0.44 7.81 18.86 40.45 -18.76
Chemicals 249.38 10.70 -5.66 19.33 68.13 -64.38 -2.27 7.75 27.32 -25.82
Manufacture
d goods
classified
chiefly b
745.49 10.45 32.62 112.40 268.21 -157.76 4.37 15.08 35.98 -21.16
Machinery
and transport
equipment
1536.3 10.70 49.88 212.53 530.13 -332.30 3.25 13.38 34.51 -21.63
Miscellaneou
s
manufactured
articles
271.43 15.28 -10.58 16.17 68.40 -69.17 -3.90 5.96 25.20 -25.48
Source: Computed
Potential gainers and losers from PTAs and FTA between Nigeria and China can be observed
from Table 21. With a 25 percent cut in tariff, china gains in terms of percentage increase in export of
most commodities (except chemicals and miscellaneous products) to Nigeria while Nigeria loses in
terms of percentage fall in export of all categories of products to China. Under both a 50 and a 75
percent cut in tariff, both countries gain in terms of percentage rise in their export to each other.
However, the magnitude of gains (in terms of percentage increase in export) differs. Thus, while China
gains more in terms of percentage rise in export of food and live animals; crude materials (inedible);

57
and mineral fuels, lubrications and related products, Nigeria gains more in terms of percentage increase
in export of chemical and manufactured products. They gain almost equally in the case of machinery
and transport equipment. With respect to outcome on formation of an FTA (100% tariff cut), although
both countries lose, Nigeria lose more in terms of export of food and live animals; crude materials
(inedible); and mineral fuels, lubrications and related products, while China lose more in terms of
chemical and manufactured products.
Table 21: Summary of the Likely Changes in China’s and Nigeria’s Exports under Different PTAs and FTAs, based
on 2006 data
Principal
products
traded
China’s
exports
to
Nigeria
in 2006
($’Mill)
Average
Nigeria’s
MFN
Tariff in
2006
Nigeria’s
exports
to
China in
2006
($’Mill)
Average
China’s
MFN
Tariff in
2006
% change in export as a result of tariff cuts
Scenario 25%
tariff cut
Scenario 50%
tariff cut
Scenario 75%
tariff cut
Scenario 100%
tariff cut
China Nigeria China Nigeria China Nigeria China Nigeria
Food and live
animals
35.25 16.69 0.03 9.44 0.35 -90.0 10.64 9.23 30.73 29.07 -21.5 -22.5
Crude
materials,
inedible,
except f
10.64 8.63 23.71 0.96 11.96 -90.5 23.45 5.02 45.86 24.09 -13.6 -26.5
Mineral fuels,
lubricants and
related
products
2.33 5.94 241.78 2.64 7.81 -90.2 18.86 16.60 40.45 37.77 -18.8 -20.3
Chemicals 249.38 10.70 0.09 8.12 -2.27 -89.8 7.75 19.25 27.32 40.90 -25.8 -17.9
Manufactured
goods
classified
chiefly b
745.49 10.45 11.61 9.01 4.37 -89.7 15.08 15.52 35.98 36.55 -21.2 -20.9
Machinery
and transport
equipment
1536.30 10.70 0.46 8.12 3.25 -89.8 13.38 13.39 34.51 33.99 -21.6 -21.9
Miscellaneous
manufactured
articles
271.43 15.28 0.08 9.53 -3.90 -89.9 5.96 12.99 25.20 33.51 -25.5 -20.5
Source: Extracted from Tables 19 and 20
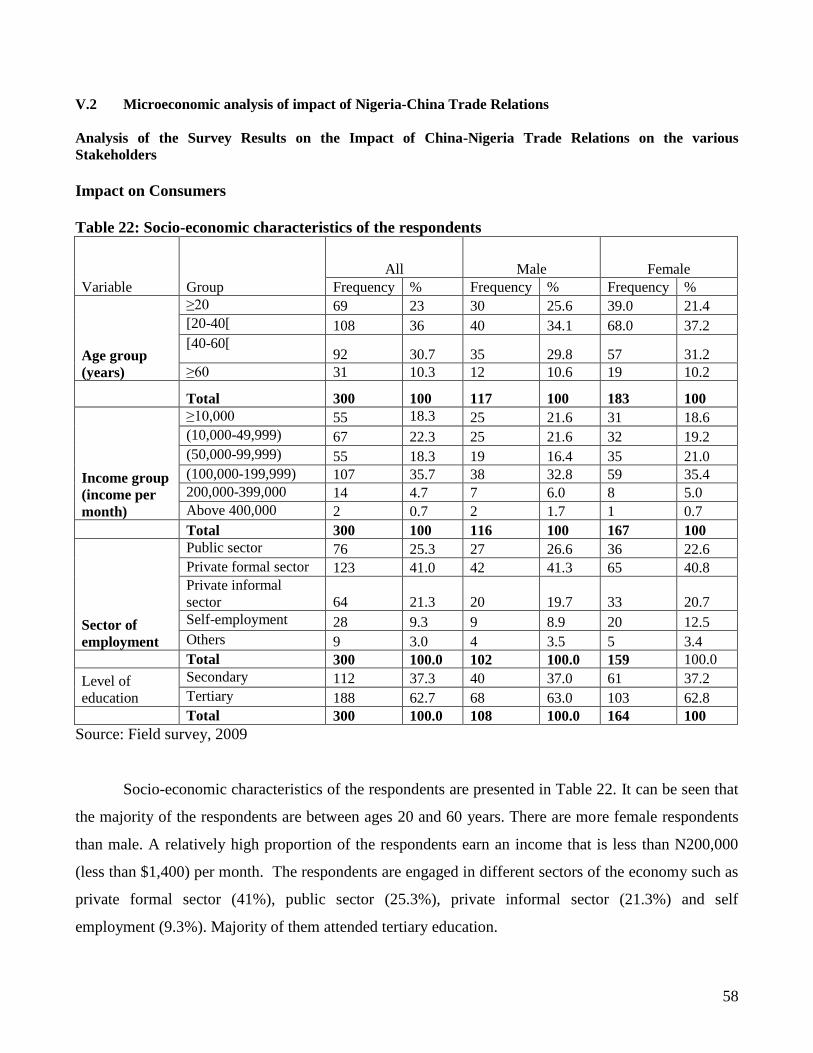
58
V.2 Microeconomic analysis of impact of Nigeria-China Trade Relations
Analysis of the Survey Results on the Impact of China-Nigeria Trade Relations on the various
Stakeholders
Impact on Consumers
Table 22: Socio-economic characteristics of the respondents
Variable Group
All Male Female
Frequency % Frequency % Frequency %
Age group
(years)
≥20 69 23 30 25.6 39.0 21.4
[20-40[ 108 36 40 34.1 68.0 37.2
[40-60[ 92 30.7 35 29.8 57 31.2
≥60 31 10.3 12 10.6 19 10.2
Total 300 100 117 100 183 100
Income group
(income per
month)
≥10,000 55 18.3 25 21.6 31 18.6
(10,000-49,999) 67 22.3 25 21.6 32 19.2
(50,000-99,999) 55 18.3 19 16.4 35 21.0
(100,000-199,999) 107 35.7 38 32.8 59 35.4
200,000-399,000 14 4.7 7 6.0 8 5.0
Above 400,000 2 0.7 2 1.7 1 0.7
Total 300 100 116 100 167 100
Sector of
employment
Public sector 76 25.3 27 26.6 36 22.6
Private formal sector 123 41.0 42 41.3 65 40.8
Private informal
sector 64 21.3 20 19.7 33 20.7
Self-employment 28 9.3 9 8.9 20 12.5
Others 9 3.0 4 3.5 5 3.4
Total 300 100.0 102 100.0 159 100.0
Level of
education
Secondary 112 37.3 40 37.0 61 37.2
Tertiary 188 62.7 68 63.0 103 62.8
Total 300 100.0 108 100.0 164 100
Source: Field survey, 2009
Socio-economic characteristics of the respondents are presented in Table 22. It can be seen that
the majority of the respondents are between ages 20 and 60 years. There are more female respondents
than male. A relatively high proportion of the respondents earn an income that is less than N200,000
(less than $1,400) per month. The respondents are engaged in different sectors of the economy such as
private formal sector (41%), public sector (25.3%), private informal sector (21.3%) and self
employment (9.3%). Majority of them attended tertiary education.
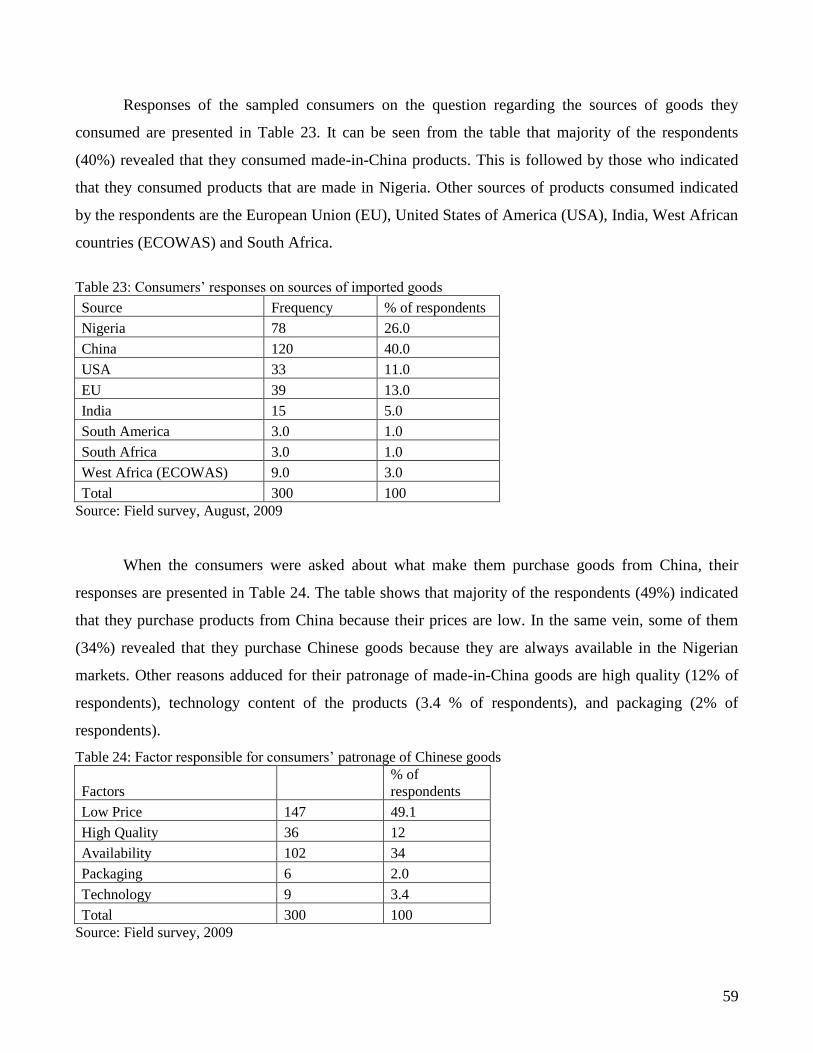
59
Responses of the sampled consumers on the question regarding the sources of goods they
consumed are presented in Table 23. It can be seen from the table that majority of the respondents
(40%) revealed that they consumed made-in-China products. This is followed by those who indicated
that they consumed products that are made in Nigeria. Other sources of products consumed indicated
by the respondents are the European Union (EU), United States of America (USA), India, West African
countries (ECOWAS) and South Africa.
Table 23: Consumers’ responses on sources of imported goods
Source Frequency % of respondents
Nigeria 78 26.0
China 120 40.0
USA 33 11.0
EU 39 13.0
India 15 5.0
South America 3.0 1.0
South Africa 3.0 1.0
West Africa (ECOWAS) 9.0 3.0
Total 300 100
Source: Field survey, August, 2009
When the consumers were asked about what make them purchase goods from China, their
responses are presented in Table 24. The table shows that majority of the respondents (49%) indicated
that they purchase products from China because their prices are low. In the same vein, some of them
(34%) revealed that they purchase Chinese goods because they are always available in the Nigerian
markets. Other reasons adduced for their patronage of made-in-China goods are high quality (12% of
respondents), technology content of the products (3.4 % of respondents), and packaging (2% of
respondents).
Table 24: Factor responsible for consumers’ patronage of Chinese goods
Factors
% of
respondents
Low Price 147 49.1
High Quality 36 12
Availability 102 34
Packaging 6 2.0
Technology 9 3.4
Total 300 100
Source: Field survey, 2009

60
Based on the survey, household commodities from China purchased by the respondents are
presented in Table 25. The list of commodities includes electronics; phones and accessories; computers
and accessories; electrical appliances (gas cooker, generator, heater, pressing iron, fan, etc); drugs and
food items; furniture, carpets and rugs; and freezer, refrigerators and air conditioner.
Table 25: Household commodities that the Respondents purchased that are from China
Goods Frequency % of respondents
Computers and Accessories 36 12.6
Electronics i.e T. V,Radio,C.D,DVD,Stereo
35.8 102
Drugs/Food 27 9.5
Clothes 12 4.2
Freezer,Refrigerator,Air
Condition,etc 12 4.2
Gascooker,Generator,
Heater,Pressing lron,Fan 36 12.6
Furnitures,Carpets,Rugs, etc
5.3 15
Phone and Accessories 45 15.8
Total 285 100
Source: Field survey, 2009
On the recent trend in consumers’ purchase of household commodities from various markets,
Table 26 provides some insights. It can be seen from the table that a relatively high proportion of the
respondents disclosed that their purchase of household commodities from China, USA and South
Africa has increased, while their purchase of commodities from Nigeria, India and Africa has
decreased. It should be mentioned that those who indicated that their purchase of commodities from
China have risen (58.7%) are relatively more than those who did so in respect of other markets. This
then shows the importance of Chinese products to Nigerian consumers.
Table 26: Recent trend in the respondents’ purchase of household commodities from markets
Country/trend Frequency % of respondents
China
Increased 48 17.4
Decreased 162 58.7
Remained constant 66 23.9
Total 276 100
Nigeria
Increased 72 25.8

61
Decreased 123 44.1
Remained constant 84 30.1
Total 279 100
USA
Increased 90 35.3
Decreased 87 34.1
Remained constant 78 30.6
Total 85 100
Europe
Increased 29 33.7
Decreased 29 33.7
Remained constant 28 32.6
Total 255 100
India
Increased 63 30.4
Decreased 81 39.1
Remained constant 63 30.4
Total 207 100
South America
Increased 69 34.3
Decreased 66 32.8
Remained constant 66 32.8
Total 201 100
South Africa
Increased 69 35.4
Decreased 63 32.3
Remained constant 63 32.3
Total 195 100
African countries
Increased 60 26.3
Decreased 129 56.6
Remained constant 39 17.1
Total 228 100
Source: Field survey, 2009
Factors responsible for the influx of commodities from China were asked from the responding
consumers, and a high proportion of them (66.2%) revealed that the main factor is that Chinese
products are cheaper compared to products from other markets (Table 27). Some of them (26.5%) also
said that products from China are of high quality. Other factor given by the respondents is good
packaging. This again confirms the earlier finding above that Chinese products are cheap. Further

62
issues relating to price and quality are raised with the consumers and Tables 28 and 29 present the
findings. It can be observed from Table 28 that overwhelming majority of the consumers (83.5 to 92%)
believed that Chinese products are cheaper than products made in either Nigeria or Europe or America.
In terms of quality, a high proportion of the responding consumers (55.1%) believed that Chinese
goods are better than made-in-Nigeria goods (Table 29). However, overwhelming percentage of them
(over 80%) unfolded the idea that goods that are made in either Europe or America are of better quality
than goods made in China.
Table 27: Factors responsible for the influx of commodities from China
Factors Frequency % of respondents
High quality 54 26.5
Cheaper price 135 66.2
Good packaging 12 5.9
other factors 3 1.5
Total 204 100
Source: Field survey, 2009
Table 28: Do you believe that Chinese goods are
cheaper than goods from other markets
Cheaper than made in Nigeria goods
No 48 16.5
Yes 243 83.5
Total 291 100.0
Cheaper than made in Europe goods
No 24 8.6
Yes 255 91.4
Total 279 100.0
Cheaper than made in America goods
No 24 8.3
Yes 264 91.7
Total 288 100.0 Source: Field survey, 2009-10-11

63
Table 29: Do you believe that Chinese goods
better in terms of quality than goods from
other markets
Better than made in Nigeria goods
No 132 44.9
Yes 162 55.1
Total 294 100.0
Better than made in Europe goods
No 231 82.8
Yes 48 17.2
Total 279 100.0
Better than made in America goods
No 225 79.8
Yes 57 20.2
Total 282 100.0 Source: Field survey, 2009
Owing to the idea that influx of products from various foreign markets to the Nigerian market
will lead to competition between local and foreign producers, the consumers were asked to suggest
various coping measures to local producers. Table 30 presents the various measures suggested by
consumers to local producers to enable them cope with the influx of commodities from China and other
markets. It can be seen from the table that majority of them (66.7%) suggested that local producers
should produce high quality goods. Other coping strategies suggested by the consumers are good
packaging, adoption of modern technology and reduction of market prices. Consumers were also asked
to suggest measures that government can take to enable local producers cope with the influx of
commodities from China and other markets and the findings are presented in Table 31. A relatively
high proportion of them (36.8%) advanced that government should provide loans for local producers at
subsidised interest rate. Some of them (19.7%) also indicated that government should support
consumption of locally made goods. Other reasons given by the consumers are that government should
raise import duties to discourage consumption of foreign goods. It should provide steady power supply
and assist producers in improving their technology.

64
Table 30: Respondents’ Advise to the local producers on measures to take to cope with
the influx of commodities from China and other foreign markets
Measures Frequency % of respondents
Produce quality goods 144 66.7
Adopt modern technology 21 9.7
Good packaging 33 15.3
Reduce their market price 18 8.3
Total 216 100 Source: Field survey, 2009
Table 31: Respondents’ advise to government on the steps to
take to enable local producers cope with influx of goods from
China and other markets
Measures Frequency
% of
respondents
Provide loans for local producers at subsidised
rate 84 36.8
Assist them in improving technology 27 11.8
Support consumption of locally made goods 45 19.7
Provide steady power supply 33 14.5
Increase import duties 39 17.1
Total 228 100.0 Source: Field survey, 2009.
A further examination of the impact of Chinese products on the consumers particularly on the
negative effect is conducted. Table 32 presents commodities that the responding consumers bought that
are of China origin that caused them some discomfort. According to majority of them, the commodities
include Electronics, clothes, and phone and accessories. Others are electrical appliances (gas cooker,
generator, heater, pressing iron, fan, etc); drugs and food items; freezer, refrigerators and air
conditioner; computers and accessories; and furniture, carpets and rugs. On the sources of discomforts
experienced by the consumers, majority of them (66.7%) revealed that Chinese products are
characterised by high frequency of breakdown (Table 33). Some of them (20.8%) said that Chinese
products are of low quality, while they also disclosed that the products from China are not easy and
cheap to repair. Bad electricity was also mentioned as a source of discomfort.

65
Table 32: Commodities bought from the China that caused you some discomforts
Commodities Frequency % of respondents
Computers and Accessories 6 2.4
Electronics i.e T.V,Radio,C.D,DVD,Stereo 75 30.5
Drugs/Food 12 4.9
Clothes 63 25.6
Freezer,Refrigerator,Air Condition,etc 12 4.9
Gascooker,Generator, Heater,Pressing lron,Fan 15 6.1
Furnitures,Carpets,Rugs, etc 6 2.4
Phone and Accessories 57 23.2
Total 246 100.0 Source: Field survey, 2009
Table 33: Sources or types of discomforts you experienced from commodities
bought from the China
Sources/type frequency % of respondents
Bad Electricity 3 1.4
High frequent breakdowns 144 66.7
It is not easy and costly to
repair 24 11.1
The products are of low
quality 45 20.8
Total 216 100.0
Source : Field survey, 2009
Majority of the consumers (65.9%) believed that due to availability of Chinese products in the
Nigerian markets, their presence of these goods has increased (Table 34). Hence, they revealed that
their preference for made-in-Nigeria goods and other foreign goods (including those made in Europe
and America) has reduced (Table 35). When consumers were asked if their incomes were doubled what
will happen to their demand for made-in-China goods, majority of them (67.5%) indicated that it will
decrease (Table 36).
Table 34: Do you believe that following the availability of Chinese goods in Nigeria
markets, your preference for these goods has
Increased Frequency % of respondents
Decreased 180 65.9
Remain unchanged 33 12.1
Yes 60 22.0
Total 273 100.0 Source: Field survey, 2009

66
Table 35: Has your consumption of made-in-China goods reduced your preference for
made-in-Nigeria and others goods
Country/region Frequency % of respondents
Nigeria
No 36 37.9
Yes 59 62.1
Total 95 100.0
Europe
No 35 38.9
Yes 55 61.1
Total 90 100.0
America
No 30 33.0
Yes 61 67.0
Total 91 100.0 Source: Field survey, 2009
Table 36: If your income was doubled, your demand for made-in-China goods will
Change frequency % of respondents
Increased 33 13.3
Decreased 168 67.5
Remained unchanged 48 19.3
Total 249 100.0 Source: Field survey, 2009
On the impact of the global financial crisis on the consumers, the responding consumers
indicated that their consumption decreased as a result of the crisis (Table 37). An overall assessment
question was asked about the consumer surplus (gains or losses) in terms of price and quality of goods
from China, majority of them (72.9%) revealed that they recorded some gains (Table 38)
Table 37: What is the impact of the global financial crisis on your consumption
Change frequency % of respondents
Increase 3 1.0
Decrease 222 77.1
Remained unchanged 63 21.9
Total 288 100.0 Source: Field survey, 2009

67
Table 38: How would you quantify your gains or losses in terms of price
and quality of goods from various markets
Gains/losses Frequency % of respondents
Negative 57 27.1
Positive 153 72.9
Total 210 100.0 Source: Field Survey, 2009
Impact on Importers
The sampled importers revealed that they imported a number of commodities from foreign
markets including China. Among the commodities that they imported from China are clothes and
shoes; electrical and electronics equipment and appliances; computers, phones and accessories;
furniture, rugs and carpets; musical instruments; printing materials and stationeries; and motorcycles,
bicycles and parts (Table 39). Overwhelming majority of the respondents (85%) indicated that China is
a major source of their imported commodities (Table 40). A significant proportion of them (48 and
39%) disclosed that USA and EU are major sources of their imported commodities. Some of them also
indicated West Africa and India as well as other sources. It is obvious that because of the preference of
consumers for Chinese goods, importers also patronise China for their imported goods.
Table 39: Commodities/Goods/Services lmported
Commodities Frequency Percent
Electrical Materials 16 16.0
Electronics i.e:T.V,Radio,C.D,DVD,Stereo etc. 23 23.0
Freezer,Refrigerator,Air 12 12.0
Generator,GasCooker, machine etc 12 12.0
Computer,Phones and accessories 12 12.0
Printing materials,stationeries etc 5 5.0
Musical lnstruments 6 6.0
Motorcycle,Bicycle and parts 4 4.0
Furnitures, Rugs,carpets,etc 9 9.0
Clothes,Shoes,etc 28 28.0
Source: Field survey, 2009
Table 40: Major sources of Import for your commodities
Frequency Percent
China 85 85.0
USA 48 48.0
EU 39 39.0
India 14 14.0
other Far East 6 6.0
South America 5 5.0

68
South Africa 2 2.0
ECOWAS 6 6.0
Source: Field survey, 2009
Importers were requested to indicate the trend in their purchase of final commodities from
various markets including China and the result is shown in Table 41. The table reveals that the
purchase of commodities by majority of the respondents from China increased, while some of them
said that their purchase of commodities from USA has remained unchanged and that from EU has
reduced. In terms of price trend, majority of the respondents declared that prices of commodities from
China, EU and India decreased (Table 42). This therefore implies that there will be competition among
various imported goods in the Nigerian markets. Analysis of the impact of competition from the
various markets shows that majority of the respondents believed that competition from various markets
particularly from China and India as well as USA and EU is destructive (Table 43). Further issues
raised with the importers revealed that the completion from various markets particularly China had
positive effect on their sales and profits (Table 44).
Table 41: Recent trend in your purchase of final commodities from various markets
Markets Trends Frequency Percent
China Reduced 11 11
Increased 41 41
Remained Stable 23 23
USA Reduced 1 1.0
Increased 5 5.0
Remained Stable 23 23
EU Reduced 24 24.0
Increased 17 17.0
Remained Stable 3 3.0
India Reduced 12 12.0
Increased 15 15.0
Remained Stable 3 3.0
Source: Field survey, 2009
Table 42: lndicate the trend of price of commodities from various markets
Frequency Percent
China Increase 17 21.0
Reduce 71 74.0
USA/NAFTA Increase 12 16.0
Reduce 39 48.0
EU Increase 23 26.0
Reduce 13 19.0

69
India Increase 35 38.0
Reduce 56 60.0
Source: Field survey, 2009
Table 43: How would you describe the competition among the various Markets?
Frequency Percent
China Destructive 51 51.0
Supportive 34 34.0
USA/NAFTA Destructive 45 45.0
Supportive 16 16.0
EU Destructive 42 42.0
Supportive 7 7.0
India Destructive 35 35.0
Supportive 7 7.0
Source: Field survey, 2009
Table 44: How would you measure your gains or losses with respect to sales and
profit and as a result of competition from China
Gains or losses Sales
frequency
Sales
Percent
Profit
frequency
Profit
Percent
Negative (loss) 5 6.6 10 12.7
Positive (gain) 71 93.4 69 87.3
Total 76 100 79 100.0
Source: Field survey, 2009
The respondents (importers) were asked to suggest measures that government could take to
enable all stakeholders including local manufacturers, importers and consumers cope with competition
from various markets. The suggested measures are presented in Table 45. These measures are;
Government should; ensure low exchange rate; reduce import tariffs; provide good road networks;
encourage local production; provide loan facilities; and ensure importation of quality products.
Similarly, importers were asked to advise the manufacturers on the measures they could adopt to enable
them cope with competition from various markets (especially China), the following are their
suggestions (Table 46). Manufacturers should; try and maintain uniform price with foreign goods or
even reduce the prices of their products; produce high quality goods; ensure easy and fast delivery of
goods; and boost production of their goods.

70
Table 45: Measures you would advise the Government to take to enable economic agents
cope with competition from various markets especially China
Measures Frequency Percent
Ensure the exchange rate is
low
20 20.0
Reduced import tariffs 16 16.0
Govt should provide good
roads
18 18.0
Govt should encourage
local productions
22 22.0
Ensure importation of
quality products
10 10.0
Provide loans facilities 14 14.0
Total 100 100.0
Source: Field survey, 2009
Table 46: Measures you would advise Manufacturers to adopt to enable them cope
with competition from various markets especially China
Measures frequency % of respondents
maintain uniform price 27 31.4
produce high quality
goods 23 26.7
Easy and fast delivery of
goods 15 17.4
Price reduction 14 16.3
Boost production 7 8.1
Total 86 100.0
Source: Field survey, 2009
The impact of the global economic crisis on the activities of the respondents was also
investigated and they unfolded the fact that their activities have reduced as a result of the crisis (Table
47)
Table 47: what is the impact of the global economic crisis on your activities?
Commodities Frequency Percent
Reduced 88 88.0
Increased 11 11.0
Remain Unchanged 1 1.0
Total 100 100.0
Source: Field survey, 2009

71
Impact on Manufacturers/Exporters
Products produced by different categories of firms interviewed are presented in Table 48. The
products ranged from processed agricultural goods (cashew/palm kernel, Chips, honey, charcoal,
ginger, sesam, etc); Chemical and Allied (cosmetics, toiletries, etc); ICT equipment and materials
(computer and accessories, Phones, printing equipment and materials, projectors, IP telephone, etc);
Enterprises Development and Professional services (finance, real estate, etc); Furniture items
(household and office furniture items, etc); and Transportation (Shipping, clearing and forwarding, etc).
Majority of the respondents (56%) indicated that China is a major source of their imported inputs
(Table 49). A relatively high proportion of them revealed that the volume of inputs imported from
China has increased (Table 50), while they also indicated that the volume of inputs imported from other
sources remained unchanged.
Table 48: Products produced by different categories of firms
Sector /industry Frequency Percent
Agric product processing (cashew/palm kernel, Chips,
honey, charcoal, ginger, sesam, etc) 14 26
Chemical and Allied (cosmetics, toiletries, etc) 7 13
Enterprises Development and Professional services (finance,
real estate, etc) 4 8
Furniture (household and office future items, etc) 11 21
ICT (computer and accessories, Phones, printing equipment
and materials, projectors, IP telephone, etc) 13 25
Transportation (Shipping, clearing and forwarding, etc) 4 8
Total 53 100
Source: Field survey, 2009 Table 49: Sources of imported inputs
Sources of inputs
Yes
%
No
%
Nigeria 43 57
West Africa including Nigeria 35 65
Nigeria, US, China, EU, India 55 45
Europe and America 27 73
China only 56 44
Other s 15 85
Source: Field survey, 2009

72
Table 50: Recent Trend in purchase of Raw materials from Various markets
Nigeria Frequency % of respondents
Reduced 13 31.7
Increase 16 39.0
Remained stable 12 29.3
China
Reduced 2 8.3
Increase 16 66.7
Remained stable 6 25.0
USA
Reduced 6 27.3
Increase 5 22.7
Remained stable 11 50.0
European Union
Reduced 4 40.0
Increase 0 0.0
Remained stable 6 60.0
India
Reduced 1 12.5
Increase 1 12.5
Remained stable 6 75.0
West Africa
Reduced 1 3.7
Increase 5 18.5
Remained stable 21 77.8
Source: Field survey, 2009
Majority of the respondents (70%) indicated that Nigeria is a major market outlet for their
products, while some of them also indicated foreign market outlets including China (Table 51). They
equally said that the volume of goods sold in the Nigerian markets has increased while they revealed
that goods sold to Chinese market has also risen (Table 52).
Source: Field survey, 2009
Table 51: Market outlets for products
Market outlets Frequency Percent
Nigeria 30 70
West Africa including Nigeria 5 12
Nigeria, US, China, EU, India 2 5
Nigeria and Europe 3 7
Nigeria and China 1 1
Other 2 5
Total 43 100

73
Table 52: Recent trend in commodities sold in different markets
Nigeria Frequency Percent
Reduced 9 22.0
Increase 17 41.5
Remained stable 15 36.6
China Frequency Percent
Reduced 1 20.0
Increase 3 60.0
Remained stable 1 20.0
America Frequency Percent
Reduced 11 50.0
Increase 5 22.7
Remained stable 6 27.3
Europe Frequency Percent
Reduced 3 30.0
Increase 2 20.0
Remained stable 5 50.0
India Frequency Percent
Reduced 1 12.5
Increase 1 12.5
Remained stable 5 62.5
West Africa Frequency Percent
Reduced 2 7.4
Increase 8 29.6
Remained stable 17 63.0
Source: Field survey, 2009
High proportions of respondents pointed out that competition from various markets (within and
outside Nigeria) have been destructive to their activities (Table 53). A number of reasons were adduced
by producers and exporters for the intense completion that they face. These include unfavourable
government policies (such as high and unfavourable interest and exchange rates), poor infrastructure,
and poor governance (which make local goods more costly), low import duties, low level of
information on foreign markets, many competitors, price reduction by competitors, quality standard
and emergence of many retail and wholesale shops (Table 54). The position of the producers is also
reinforced by their opinions on the degree of effects of the effects of price and non-price factors driving
competition presented in Table 55 below.

74
Source: Field survey, 2009
Table 54: Reasons adduced by producers for the state of competition
Reasons Frequency Percentage
high and unfavourable interest and exchange rates 5 12.5
Low import duties 3 7.5
low level of information 1 2.5
quality standard 2 5.0
many competitors 11 27.5
poor infrastructure, govt. policies and governance
which makes local goods more costly
8 20.0
price reduction by competitors 3 7.5
Emergence of many retail and wholesale shops 7 17.5
Total 40 100.0 Source: Field survey, 2009
Table 55: Variables that constitute the basis of competition from the various markets
Degree of effect Low moderate High
Competition variable Frequency Percentage Frequency Percentage Frequency Percentage
Price 4 10 15 37.5 17 42.5
Quality 12 35.3 15 44.1 7 20.6
tech innovation 5 17.2 15 51.7 9 31
distribution network 8 25 14 43.8 10 31.3
tariff rate 7 24.1 13 44.8 9 31 Source: Field survey, 2009
Table 53: Implications of competitions coming various market
Nigeria Frequency Percentage
Supportive 5 14.7
Destructive 29 85.3
China Frequency Percentage
Supportive 12 25
Destructive 36 75
USA Frequency Percentage
Supportive 8 40
Destructive 12 60
Europe Frequency Percentage
Supportive 4 16
Destructive 21 84
India
Supportive 5 33.3
Destructive 10 66.6
West Africa Frequency Percentage
Supportive 10 40
Destructive 15 60

75
Table 56 presents responses on the gains or losses in terms of sales and
profits arising from competition from foreign markets including China. It can be seen
from the table that majority of the respondents revealed that they were affected
negatively. The sampled producers were asked to indicate the various measures that
they have implemented to cope with competition. Table 57 presents the various
measures which include moderate prices, sales promotion, quality improvement, better
customer service, buying directly from manufactures, effective distribution, on line
trading and packaging.
Table 56: How would you measure your gains or losses with respect to sales and profit and
as a result of competition from foreign markets including China
Gains or losses Sales
frequency
Sales
Percent
Profit
frequency
Profit
Percent
Negative (loss) 25 62.5 30 75.0
Positive (gain) 15 37.5 10 25.0
Total 40 100 40 100.0
Source: Field survey, 2009
Table 57: Measures that have been implemented to cope with competition
Measures Frequency Percentage
Moderate prices 6 15
Sales promotion 8 20
Quality improvement 5 12.5
Better customer service 5 12.5
Buying directly from
manufactures 4 10
Effective distribution 3 7.5
on line trading 4 10
Packaging 5 12.5
Total 40 100 Source: Field survey, 2009
In terms of the measures that government can embark upon in order to help producers to cope with the
competition, table 58 indicates that majority of the respondents believed that government should
continue advocating for the consumption of locally produce goods. Also, the same number of
respondents (25%) agreed that government must delay the signing of bilateral agreements such as EPA,

76
which will affect domestic producers. Prevention of smuggling is another measure that government
could use to help domestic producers to cope with competition. However, about 8% of the respondents
believed that government should use the Standard Organisation of Nigeria (SON) to control the quality
of products coming into the country, while this measure was followed by others like the banning of
importation of some products, infrastructural improvement, input tariffs reduction.
Table 58: Measures that Government can embark upon to help producers to cope with
competition
Measures Frequency Percentage
Advocacy on consumption of
locally made goods 10 25.0
Control of quality via SON 3 7.5
Prevent smuggling 5 12.5
Ban importation of some
goods 2 5
Improvement in technology
and capacity building 4 10
Improvement in infrastructural 2 5
Reduction in tariff on inputs 2 5
Reduction of interest and
exchange rates 1 2.5
Delayed in signing bilateral
agree such as EPA 10 25.0
Streamline taxes and
eliminate corruption 1 2.5
Total 40 100
Source: Field survey, 2009.
VI Summary of findings, Recommendations and Conclusion
This study has examined the impact of China-Nigeria trade relations. Empirical analysis reveals
some important findings which are discussed in what follows.
6.1 Summary of findings from macroeconomic analysis
The intensity of China’s export to Nigeria has been high over time. China even exported more
and more beyond what it was expected to export to Nigeria in some years including 2007, which
suggests that the global economic crisis is yet to have a significant impact on the Nigeria-China trade
relations. This development is traceable to economic growth recorded by Nigeria and the need to
demand for more manufactured products from China in order to facilitate industrial activities in
Nigeria. On the other hand, the intensity of Nigeria’s export to China has been somehow low and

77
around 60.0 throughout the entire period, which implies that Nigeria has exported less than it should do
to China. Nigeria should strive to increase its level of export to China more than it currently does, while
China may want to maintain 2007 level (if not at 2002-2003 level) it attained,. Therefore with
appropriate policies, there is some scope for increasing bilateral trade relations between Nigeria and
China.
The results of the panel regression results (based on the gravity model) on the impact of trade
Policy on bilateral trade between Nigeria and China reveal that the economic size of the countries plays
a major role in promoting trade relations between the two countries. These results suggest that the level
of tariffs in China promotes trade with Nigeria (and vice-versa), while the level of tariffs in Nigeria
hinders trade with China (and vice-versa). The per capita income hinders trade relations between them.
Although its impact is not significant, the distance variable indicates that the longer the distance the
lower the level of trade between two countries. Similarly, the real exchange rate variable shows
positive effect but such effect is not significant.
Analysis of potential gainers and losers from PTAs and FTA between Nigeria and China shows
that, with a 25 percent cut in tariff, china gains in terms of percentage increase in export of most
commodities (except chemicals and miscellaneous products) to Nigeria while Nigeria loses in terms of
percentage fall in export of all categories of products to China. Under both a 50 and a 75 percent cut in
tariff, both countries gain in terms of percentage rise in their export to each other. However, the
magnitude of gains (in terms of percentage increase in export) differs. Thus, while China gains more in
terms of percentage rise in export of food and live animals; crude materials (inedible); and mineral
fuels, lubrications and related products, Nigeria gains more in terms of percentage increase in export of
chemical and manufactured products. They gain almost equally in the case of machinery and transport
equipment. With respect to outcome on formation of an FTA (100% tariff cut), although both countries
lose, Nigeria lose more in terms of export of food and live animals; crude materials (inedible); and
mineral fuels, lubrications and related products, while China lose more in terms of chemical and
manufactured products.
6.2 Summary of findings from microeconomic analysis (Field survey)
In order to get people’s perception about Chinese products, this study conducted field survey
that covered the relevant stakeholders in the trade between Nigeria and China. They include the
consumers, manufacturers, exporters and importers. It was discovered from the field survey that many
of the consumers used made-in-China products, followed by domestically products and goods from the

78
EU, USA, India, e.t.c. The major reasons for consuming Chinese products are the relative lower prices,
product availability, quality, technology and packaging. The categories of products that are imported
from China are electronics, phones and accessories, computers and accessories, electronic appliances,
drugs and food items.
In terms of consumers’ purchase of household commodities from various markets, we found
that a relatively high proportion of the respondents disclosed that their purchase of household
commodities from China, USA and South Africa has increased, while their purchase of commodities
from Nigeria, India and Africa has decreased. Owing to the fact that the influx of products from various
foreign markets to the Nigerian market will lead to competition between local and foreign producers,
the coping measures that the consumers suggested to domestic producers were that the local producers
should produce high quality goods. Apart from this, they should engage in good packaging, adoption of
modern technology and reduction of market prices. The Consumers also suggested measures that the
government can take to enable local producers cope with the influx of commodities from China and
other markets and they include the provision of loans for local producers at subsidised interest rate,
intensive support for the consumption of locally made goods. Also, the imposition of high tariffs to
discourage consumption of foreign goods and the provision of steady power supply as well as
assistance of producers in improving their technology.
We found that commodities such as electronics, clothes, phone and accessories, electrical
appliances (gas cooker, generator, heater, pressing iron, fan, etc); drugs and food items; freezer,
refrigerators and air conditioner; computers and accessories; and furniture, carpets and rugs that are of
China origin cause some discomfort to the Nigerian consumers On the sources of discomforts
experienced by the consumers, majority of them revealed that Chinese products are characterized by
high frequency of breakdown, low quality, and most of the products from China are not easy and cheap
to repair. Bad electricity was also mentioned as a source of discomfort. Majority of the consumers
believed that there have been increases in the presence of Chinese products in the Nigerian market,
which led to reduction in the preference for made-in-Nigeria goods and other foreign goods (including
those made in Europe and America). On the impact of the global financial crisis on the consumers, the
consumers indicated that their consumption decreased as a result of the crisis.
The sampled importers revealed that they imported a number of commodities from foreign
markets including China. Among the commodities that were imported from China are clothes and
shoes; electrical and electronics equipment and appliances; computers, phones and accessories;

79
furniture, rugs and carpets; musical instruments; printing materials and stationeries; and motorcycles,
bicycles and parts. Overwhelming majority of the importers indicated that China is a major source of
their imported commodities.
In terms of demand for imports from various markets including China, most of the importers
reveal that there have been increases in imports from China, while some of them said that their
purchase of commodities from USA has remained unchanged and that from EU has reduced. In terms
of price trend, majority of the respondents declared that prices of commodities from China, EU and
India have decreased. This therefore implies that there will be competition among various imported
goods in the Nigerian markets. Analysis of the impact of competition from the various markets shows
that majority of the respondents believed that competition from various markets particularly from
China and India as well as USA and EU is destructive. Further, issues raised with the importers
revealed that the competition from various markets particularly China had positive effect on their sales
and profits.
In terms of the measures that the government could take to enable all stakeholders such as
domestic manufacturers, importers and consumers cope with competition from various markets,
importers believe that the government should ensure low exchange rate; reduce import tariffs; provide
good road networks; encourage local production; provide loan facilities; and ensure importation of
quality products. The importers also believe that for the manufacturers to cope with the competition
they should try and maintain uniform price with foreign goods or even reduce the prices of their
products; produce high quality goods; ensure easy and fast delivery of goods; and boost production of
their goods.
Products produced by different categories of firms ranged from processed agricultural goods
(cashew/palm kernel, Chips, honey, charcoal, ginger, sesam, etc); Chemical and Allied (cosmetics,
toiletries, etc); ICT equipment and materials (computer and accessories, Phones, printing equipment
and materials, projectors, IP telephone, etc); Enterprises Development and Professional services
(finance, real estate, etc); Furniture items (household and office furniture items, etc); and
Transportation (Shipping, clearing and forwarding, etc). Majority of the manufacturers said that China
is a major source of their imported inputs. A relatively high proportion of them revealed that the
volume of inputs imported from China has increased, while they also indicated that the volume of
inputs imported from other sources remained unchanged.

80
Many of the producers reveal that Nigeria is a major market outlet for their products, while
some of them also indicated foreign market outlets including China. They equally said that the volume
of goods sold in the Nigerian markets has increased while they revealed that goods sold to Chinese
market have also risen. A large proportion of the producers pointed out that competition from various
markets (within and outside Nigeria) have been destructive to their activities. Some of the reasons for
these according to the producers and exporters are unfavourable government policies (such as high and
unfavourable interest and exchange rates), poor infrastructure, and poor governance (which make local
goods more costly), low import duties, low level of information on foreign markets, many competitors,
price reduction by competitors, quality standard and emergence of many retail and wholesale shops.
The producers reveal that competition from foreign products affects them negatively. However, they
said that there coping measures were to charge moderate prices, sales promotion, quality improvement,
better customer service, buying directly from manufactures, effective distribution, on line trading and
packaging.
The respondents revealed that, for the producers to cope with the competition from foreign
markets especially China, the government should continue to advocate for the consumption of locally
produced goods.
6.3 Policy Recommendations Recommendations to Government:
Since majority of the gains from exports do not go directly to the citizens, therefore in order to
ensure that the people (particularly the poor) derive maximum benefits from oil export receipt,
corruption should be eliminated. Thus, the Economic and financial crime commission (EFCC) and the
independent corrupt practices commission (ICPC) should be allowed to work impartially and court
actions on cases should be expedited. Government should use revenue from oil to improve the state of
infrastructure and social amenities. Government should investment export receipts in activities with
high employment potential such as agriculture and manufacturing. All these will enable the country
overcome the challenges of judicious utilization of the increased income especially the foreign
exchange earnings to relax supply side constraints and diversify the economic base.
Nigeria should increase export to China by encouraging manufacturers and exporters. Thus, the
existing export incentive schemes should be reviewed to make them more effective. The government
should encourage industrial development through adequate incentive and support. Nigeria should not
enter into a free trade agreement (FTA) with China. To increase domestic output of producers, the state
of infrastructural facilities in the country must be improved. Government must ensure adequate power
supply so as to reduce cost of production.

81
Government should use the standard and sanitary and phytosanitary measures to control import
of harmful products to the country. This should ensure that the country is not turned to dumping ground
for low quality, sub-standard and harmful products. The Standard Organisation Nigeria (SON) and
National Agency for Food and Drug Commission (NAFDAC) should put more effort at eliminating
substandard products from the country. All the recommendations made by consumers, importers and
manufacturers should be considered by the government. Prevention of smuggling is another measure
that government could use to help domestic producers to cope with competition. The activities of the
consumer protection commission (CPC) should be intensified such that consumers could be able to
report any harmful product in the markets to them for appropriate actions. The CPC should educate the
consumers on their right and how to seek counsel or redress in case of any undesirable effect of
consumption of any good on their welfare. All these will enable the government to handle the
possibility that imports from China may be hazardous on account of low quality.
Recommendation to Consumers/Sellers
In order to encourage local producers and support government in the promotion of consumption
of locally made goods, sellers and consumers should patronise these goods. The consumers should
report any harmful product in the markets to the consumer protection commission (CPC).
Recommendation to Manufacturers/Exporters: In order to be able to respond strategically to the
price competition promoted by Chinese imports, manufacturers and exporters should;
boost production and ensure that production is based on the needs of the consumers;
produce high quality goods;
embark on good packaging,
adopt modern technology;
try and maintain uniform price with foreign goods or even reduce the prices of their products;
ensure easy and fast delivery of goods;
advertise their goods on periodic basis;
support research, especially those that will lead to innovation and invention in production and
distribution of their products; and use locally produced inputs.
The recommendations offered to the government, consumers and manufacturers will enable
the country deal with the risks of perpetuating specialization in primary commodity production. They
will also enable the country to handle the risk involve in the massive influx of China’s cheap import
which can lead to de-industrialization, increased unemployment and discourage economic
diversification.

82
Bibliography
Ajaikaye, O., (2006) “China and Africa –Opportunities and Challenges”. A Presentation at the African
Union Task Force on Strategic Partnership Between Africa and the Emerging Countries of the
South Addis Ababa, Ethiopia, 11–13 September.
Ajakaiye, O. Mwega, F.M and NZue F.F (2008), Seizing Opportunities and Coping with China-Africa
Aid Relations: Insights from AERC Scoping Studies Studies, African Economic Research
Consortium (AERC) Policy Issues Paper, No. 1.
Ancharaz, V.D (2008) “David V. Goliath: Mauritius facing up to China”. A Draft Scoping Study
Prepared for the African Economic Research Consortium. AERC, Nairobi. January. Appleyard, D,R and A.J. Field (2004), International Economics, Fourth Edition, McGraw-Hill Higher
Education.
Akinkugbe, O. (2003), “Flow of Foreign Direct Investment to Hitherto Neglected Developing
Countries”. World Institute for Development Economic Research (WIDER), discussion paper
No. 2003/2
Asiedu, E. (2002), “On the Determinants of Foreign Direct Investment to Developing Countries: Is
Africa Different? World Development, 30 (1) pp. 107-119.
Bhattacharya, S.K. and B.N. Bhattacharyay (2007), “ Gains and Losses of India-China Trade
Cooperation: A Gravity Model Impact Analysis”. CESIFO WORKING PAPER NO. 1970,
April, Category 7: Trade Policy (http://www.SSRN.com/abstract=985274; from the RePEc website:
www.RePEc.org; from the CESifo website: Twww.CESifo-group.de
Billington, N. (1999), “ the Location of Foreign Direct Investment: An empirical Analysis”, Applied
Economics, vol. 62 pp. 188-197.
Burke, C., S. Naidu and A. Nepgen (2008) “Scoping Study on China’s Relations with South Africa”. A
Draft Scoping Study Prepared for the African Economic Research Consortium. AERC,
Nairobi. January.
Breisinger, C. and J. Thurlow (2008), “Asian-driven Resource Booms in Africa: Rethinking the
Impacts on Development”, Development Strategy and Governance Division, The International
Food Policy Research Institute (IFPRI) Discussion Paper 00747 January.
Corkin, L. (2008) “AERC Scoping Exercise on China-Africa Relations: The Case of Angola”. AERC
Scoping Studies on China-Africa Relations. AERC, Nairobi. February.
Campos, N. F. and Y. Kinoshita (2003), Why Does Foreign Direct Investment Go to Where it Goes?
New Evidence from the Transition Economies”, IMF Working Paper No.wp/03/228
Cattaneo. N. (2000), “A critical analysis of the Regional Trade Model for Southern Africa
(RTTMSSA): implications for future research “Paper prepared for the 1998 Trade and
Industrial Policy Secretariat Forum, February 2000
Cernet , L. (2001), “Assessing Regional Trade arrangements: are South-south RTAs more Trade
Diverting? Global Economy quarterly, 2(3) pp. 235-259
Chavin, S. and G. Gauther (2002), “Prospect for increasing trade among SADC countries, CEPII
Working Paper.
Dunning, J. (1993), Multinational Enterprises and the Global Economy, Harlow: Addison-Wesley.
Filippini, C. (2003), “The Determinants of East Asian Trade Flows: A Gravity Equation Approach”,
ISESAO, Bocconi university, Italy.
Goldberg, L. S. and C.D. Kolstad (1995), “Foreign Direct Investment, Exchange rate variability and
Demand uncertainty”, international Economic Review, vol 36, pp855-873
Harris, A. (1954) “Openness and Growth: A Time-series, Cross-country Analysis for developing

83
Countries”, Journal of development Economics, 48, pp419-77
Head, K. (2003) “Gravity for Beginners” www.economics/keith/gravity
Hong, K. J. (2006) “Impact of China on Economies in East Asian Region” A Framework Paper for
AERC Project on “The Impact of Asian Drivers on Sub-Saharan Africa”.
Kaplinsky, R. (2008) “The Impact of China and India on the Sub-Saharan Africa: A Methodological
Framework”. A Framework Paper for AERC Project: “The Impact of Asian Drivers on Sub-
Saharan Africa”, AERC, Nairobi, Kenya.
Kaplinsky, R (2008), China and the Terms of Trade: The Challenges to development strategy in SSA.
Paper prepared for the Conference on “Rise of China: Global Opportunities and Challenges”,
March, Mount Holyyoke.
Kaplinsky, R. and M. Morris (2008) “Do the Asian Drivers Undermine Export-oriented Industrialization
in SSA?” World Development, 36(2):254-273.
Kaplinsky, R., McCornick, D. and Morris, M (2006), The Impact of Chinaon Sub-Saharan Africa.
Beijing: DFID, China (mimeo).
Krugmam, P. and A., Venables (1995) “Globalization and the Inequality of Nationas”, Quarterly
Journal of Economics, 110;4, pp857-880
Krogman, P. and M. Obstfeld (200), International Economics, Theory and Practice, Low Price Edition,
Fifth Editon, Addison-Wesley, Longman.
Markheim, D. (1994), A note on predicting the trade effects of economic integration and other
Prefential trade agreements: An Assessment, Journal of common Market Studies, 32 (1)
Mertinez-Zarzoso (2003), “Augmented Gravity Model: An Empirical application to Mercosur-
European Union trade flows”, Journal of Applied Economics.
Ogunkola, E.O. (1998), “An Empirical Evaluation of Trade Potential in the Economic Community of
West African States, AERC Research Paper, 84.
Ogunkola, E. O, A.S. Bankole and A. Adewuyi (2008) “China-Nigeria Economic Relations”. AERC
Scoping Studies on China-Africa Relations. AERC, Nairobi. February.
Onjala, J. (2008) “A Scoping Study on China- Africa Economic Relations: The Case of Kenya”. AERC
Scoping Studies on China-Africa Relations. AERC, Nairobi. March. Oyejide, T. A (2009), Global Financial Crisis: Impact on Africa’s Trade and Policy Options, A seminal
paper presented at the Department of Economics, University of Ibadan, Ibadan, Nigeria, (April 16, 2009)
processed.
Oyejide, T.A., Bankole, A.S., and Adewuyi, A.O. (2009), “China-Africa Trade Relations: Insights from
AERC Studies”, European Journal of Development Research, 21 (4).
Schneider, F. and B.S. Frey (1985), “Economic and political Determinants of Foreign Direct
Investment”, World Development, 13, pp.161-175.
Singh, H. and K.W. Jun (1995), Some New Evidence on Determinants of Foreign Direct Investment,
in Developing Countries”, World Bank Policy Research Working Paper No. 1531.
Sodersten, B.O. and G. Rees (2004), International Economics: Fifth Edition, London.
Stern, M and C. Stevens (2000), “FTAs with India and Brazil: An Initial Analysis” Trade and Industrial
Policy Secretariat (TIPS) Working Paper 10.
Srinivasan, T N and G. Canonero, (1993): ‘Preferential Trade Arrangement: Estimating the Effects on
South Asia Countries’, Report, South-Asia Region, World Bank, September, pp. 1-58
Srinivasan, T.N., and G. Canonero (1995), Preferential Trading Arrangements in South Asia:Theory,
Empirics and Policy (unpublished), June 1995,
Tsikata, D., A.P. Fenny and E. Aryeteey (2008) “China-Africa Relations: Case Study of Ghana”.
AERC Scoping Studies on China-Africa Relations. AERC, Nairobi. January.
Wang, J. (2007) “What Drives China’s Growing Role in Africa?” IMF Working Paper No. WP/07/211

84
Weizhong, X. (2008) “Sino-African Relations: New Transformations and Challenges” in Gerrero and
Manji (eds) China’s New Role in Africa and the South. Cape Town and Bangkok: Fahamu and
Focus on the Global South
Winters, L. A. and S. Yusuf (2007) “Introduction” in Winters and Yusuf (eds) Dancing with Giants:
China, India, and the Global Economy. Washington, DC
Figure 1: Nigeria’s export and Import intensity with China
Figure 2: China Export and Import Intensity with Nigeria
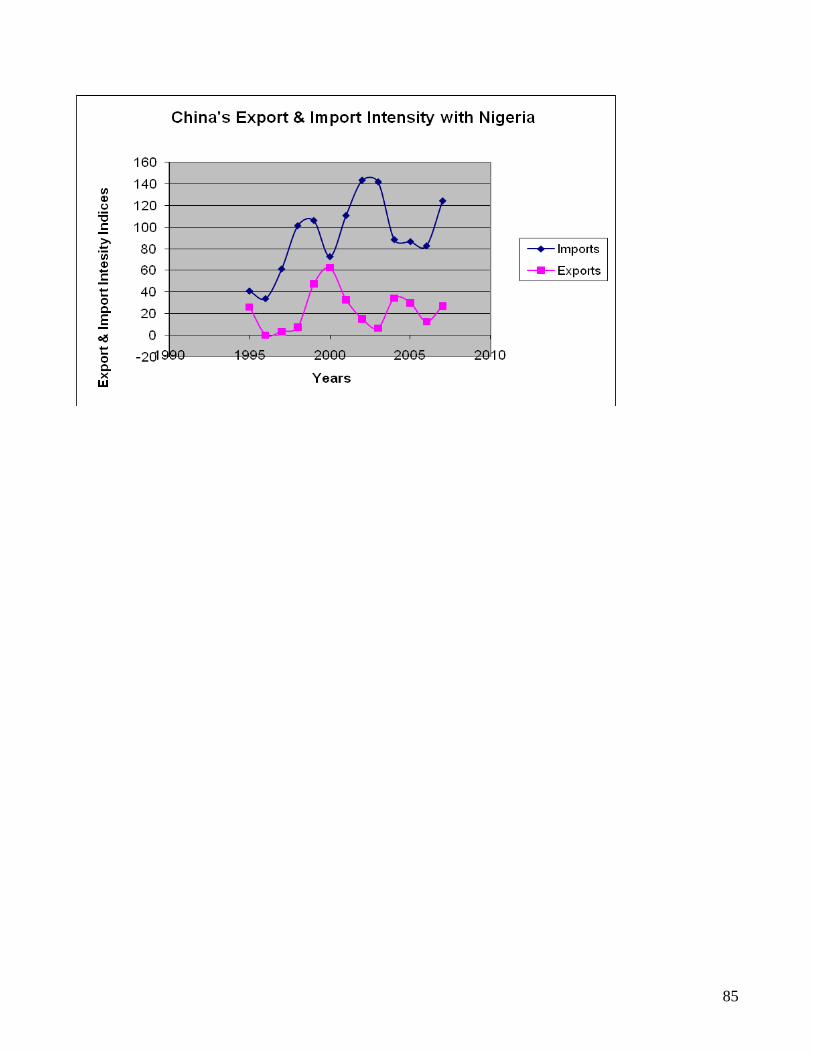
85