impact of blade mounting structures on cross-flow turbine
TRANSCRIPT

Impact of Blade Mounting Structures on Cross-Flow Turbine PerformanceBenjamin Strom,1, a) Noah Johnson,1 and Brian Polagye1
Dept. of Mechanical Engineering, University of Washington Box 352600, NE Stevens Way, Seattle, WA, 98195,USA
(Dated: 24 April 2018)
Cross-flow or vertical-axis turbines are flow energy conversion devices in which lift forces cause blades to ro-tate around an axis perpendicular to the flow. In marine currents, rivers, and some wind energy applications,cross-flow turbines are a promising alternative to more conventional axial-flow turbines. The performanceimplications of the choice of structure used to mount turbine blades to the central shaft is examined exper-imentally in a recirculating water flume. Turbine performance is found to be strongly dependent on choiceof mounting structure. Power loss due to rotational drag on these structures is estimated experimentallyby rotating the mounting structure without blades. Through a perturbation-theory approach, interactionsbetween turbine blades and mounting structures are examined. Analytical models for the power loss due tomounting structure drag are introduced and shown to be consistent with experiments. To provide guidancefor cross-flow turbine design, the models are re-formulated in terms of non-dimensional turbine design andoperational parameters. Mounting blades solely at their mid-span is shown to decrease performance throughmultiple fluid effects. Using foil cross-section struts located at the turbine blade tips is found to result in thehighest turbine performance.
Keywords: Cross-flow turbine, vertical-axis turbine, VAWT, end plates, blade mounting
I. INTRODUCTION
Cross-flow turbines convert fluid kinetic energy to ro-tational mechanical energy via blades rotating about anaxis perpendicular to free stream direction. These tur-bines may be further sub-divided into those that gener-ate torque from lift on foils (e.g., Darrieus rotors) andthose that generate torque from drag (e.g., Savonius ro-tors). Despite historical concerns of low performanceand structural failure due to fatigue, lift-based cross-flowturbines have experienced a resurgence of research andcommercial interest in recent years and hold promise forurban1 and offshore2 wind applications. Modern experi-mental and computational techniques have enabled sub-stantial increases in power performance3 and suggestionsthat optimized arrays may be able to extract more powerper area than arrays of axial-flow turbines4. Drag-basedcross-flow turbines are also an area of active research5,but are not the focus of this investigation and recent de-velopments (e.g., Plourde et al.6) are not discussed here.In addition to wind applications, cross-flow turbines haveseveral features that make them a promising alternativeto axial-flow (horizontal-axis) turbines when operated inmarine or river currents. First, their typically rectangu-lar form factor is well-suited for the geometry of shallowtidal and river channels, allowing for the construction ofhigher blockage ratio turbine arrays that could boost ar-ray performance7. Second, the maximum blade velocityof cross-flow turbines is generally lower than equivalentlysized axial-flow turbines, reducing the risk of blade cavi-tation and potential harm to aquatic fauna through col-lision or acoustic emissions8. Third, cross-flow turbine
operation is either bi- or omni-directional, depending onthe axis orientation eliminating the need for active yawcontrol in oscillating tidal currents.
In their simplest form, the rotor of a cross-flow turbineconsists of a set of fixed-pitch blades that rotate abouta central axis. Despite this single degree of freedom,the cyclically varying flow encountered by the blades, in-cluding interaction with their own wake, result in com-plex hydrodynamics. Studies have been conducted onthe performance implications of various blade geomet-ric parameters9–13, operating conditions14–17, and wakeinteractions18. However, little has been published con-cerning the implications of how the blades are affixed tothe central shaft of the turbine. While this concern mayseem secondary to the rotor blade geometry, the bladesupport structure has the potential to heavily influencerotor performance. First, since the support member(s)must rotate with the rotor, they will necessarily producesome drag opposing the direction of rotation. Second,the support members may influence lift generation of therotor blades. For example, on stationary foils, end-plateshave been shown to be functionally similar to an increasein blade span by reducing tip effects19. Blade supportstructures placed near the tips of the blades may act asend-plates, reducing lift losses due to flow from the pres-sure surface to the suction surface around the end of theblade. Third, on aircraft wings, winglets are employed toreduce induced drag (drag due to lift20). Blade supportstructures have the potential to provide this function.Finally, differing blade support geometries may restrictspan-wise flow in the turbine rotor to varying degrees,which may impact turbine performance by altering vor-tex formation during dynamic stall.
Previous studies have individually demonstrated sev-eral strategies for mounting the blades to the centralshaft. These include disks21,22, streamlined struts at the

2
blade ends23,24, and streamlined struts at the mid-span orother intermediate positions25,26. However, to date, fewstudies have made a systematic comparison of the im-plication of these choices. Goude, Lundin, and Leijon27
considered the influence of differing numbers of struts us-ing a double-multiple stream tube model based on tabu-lated values of the strut drag coefficient. Gosselin, Du-mas, and Boureau28 used an unsteady Reynolds-averagedNaiver-Stokes model to explore the effect of the addingend-plates to the blade tips of a cross-flow turbine. Smallend-plate resulted in turbine performance gains, since re-duction in tip-losses outweighed end-plate drag losses.Rawlings et al.29 experimentally found a slight increasein performance by applying disk and foil end-plates tothe ends of a three-bladed cross-flow turbine. Li andCalisal30 experimentally compared a turbine with NACA0012 struts positioned at the center-span and ends of theblades to a more blunt profile, positioned at 1/4 spanfrom the ends. The increase in performance of the NACA0012 struts was attributed to lower profile drag and areduction in tip losses and induced drag. Additionally,disk and foil end-plates were tested resulting in a smallincrease in performance. Bachant et al.16 experimentallycompared NACA 0021 and cylindrical struts mounted atthe mid-span of a three bladed cross-flow turbine. Thelarge drag on the cylindrical struts resulted in a negativeturbine efficiency at all operating conditions. Strut dragwas measured independently from turbine performanceby rotating the turbines without blades.
This study experimentally explores the impact of blademounting geometries on the performance of a lift-basedcross-flow turbine with two straight blades. By evaluat-ing changes in turbine performance and drag on mount-ing structures, as well as analytical models, we providea guide for selecting blade mounting geometry for cross-flow turbine designs. These considerations are specificto lift-based cross-flow turbines since drag-based cross-flow turbines, such as a Savonius rotor, are configured tomaximize drag.
II. METHODS
Cross-flow turbine performance is characterized by thetip-speed ratio (λ) and rotor mechanical efficiency (CP ),which are given by
λ =ωR
U∞(1)
and
CP =ωτ
12ρU
3∞2RH
(2)
where ω is the turbine rotation rate, R is the turbineradius, ρ is the operating fluid density, U∞ is the free-stream velocity, τ is the torque produced by the turbine,and H is the turbine height.
Experiments were performed in a recirculating waterflume with a test section 75 cm wide and 47 cm deep.The turbines were 17.2 cm in diameter and 23.4 cm high,resulting in a constant blockage ratio of 11.4%. Since onlyrelative changes in turbine performance are considered,performance is not corrected for blockage. All tests useda turbine rotor with two, straight, NACA 0015 bladeswith a chord length of 4.06 cm, resulting in a chord toradius ratio of 0.47 and a solidity,
σ =Nc
2πR, (3)
of 0.15, where N is the number of turbine blades. Theblades were mounted at a preset pitch angle of 6 degrees,leading edge rotated outwards about the quarter-chord.Free-stream velocity measurements were made using anacoustic Doppler velocimeter at a sample rate of 64 Hz.The turbulence intensity (standard deviation of turbu-lent fluctuations relative to the mean flow) was 1.5% atthe maximum flow velocity of 0.7 m/s. For a given tip-speed ratio, the turbine angular velocity was held con-stant by a servomotor. Electrical power generated bythe turbine, actualized as reverse current in the servo-motor, was dissipated in a dump resistor. Angular ve-locity control, rather than constant torque control, wasused to eliminate the confounding factor of changes in ro-tor mass moment of inertia for different blade mountingstructures. The torque generated by the turbine rotorwas measured using a six-axis load cell between the ser-vomotor and a fixed mounting surface (Fig. 1). Turbineposition was measured using a 218 counts per revolutionencoder. The lower end of the turbine shaft was mountedto the flume bottom via a bearing and a second six-axisload cell which measured parasitic bearing torque. Foreach test configuration, turbine forces, torque, and posi-tion were sampled at 1 kHz for 30 seconds.
The torque used to calculate the mechanical rotor ef-ficiency in Eq. (2) is the torque produced by the rotordue to fluid forcing only, τ = τfluid. When operated atconstant angular velocity, the equation of motion for theturbine rotor is
τfluid + τbearing + τcontrol = Jω = 0, (4)
where J is the mass moment of inertia of the turbinesystem and ω is the angular acceleration. τbearing is thetorque applied due to friction in the lower bearing, whileτcontrol is the torque applied to the turbine rotor by theservomotor and is the sum of electrical forces and bearinglosses within the servomotor. Figure 1 illustrates thesetorques and the reaction torques measured in these ex-periments. The upper load cell measures the reactiontorque of the servomotor, τm, top, equal and oppositeτcontrol. The lower load cell measures the reaction torqueon the the lower bearing, τm, bottom, equal and oppositeto τbearing. Rearranging Eq. (4),
τ = −τbearing − τcontrol = τm, top + τm, bottom (5)
3
Load Cell
Servomotor
τcontrol (motor on turbine)
τm, top (motor on load cell)
Load Cell
Bearing
τfluid (fluid on turbine)
τbearing (bearing on turbine)
τm, bottom (bearing on load cell)
TurbineRotor
U∞
FIG. 1. Free body diagram of the turbine experimentalsetup showing torques applied to the turbine (shown counter-clockwise) and the measured reaction torques (shown clock-wise).
we arrive at the net fluid torque on the turbine used tocompute CP . Positive τ (torque in the direction of rota-tion) is produced by lift on the blades while negative τ isproduced by drag on the blades and support structures.
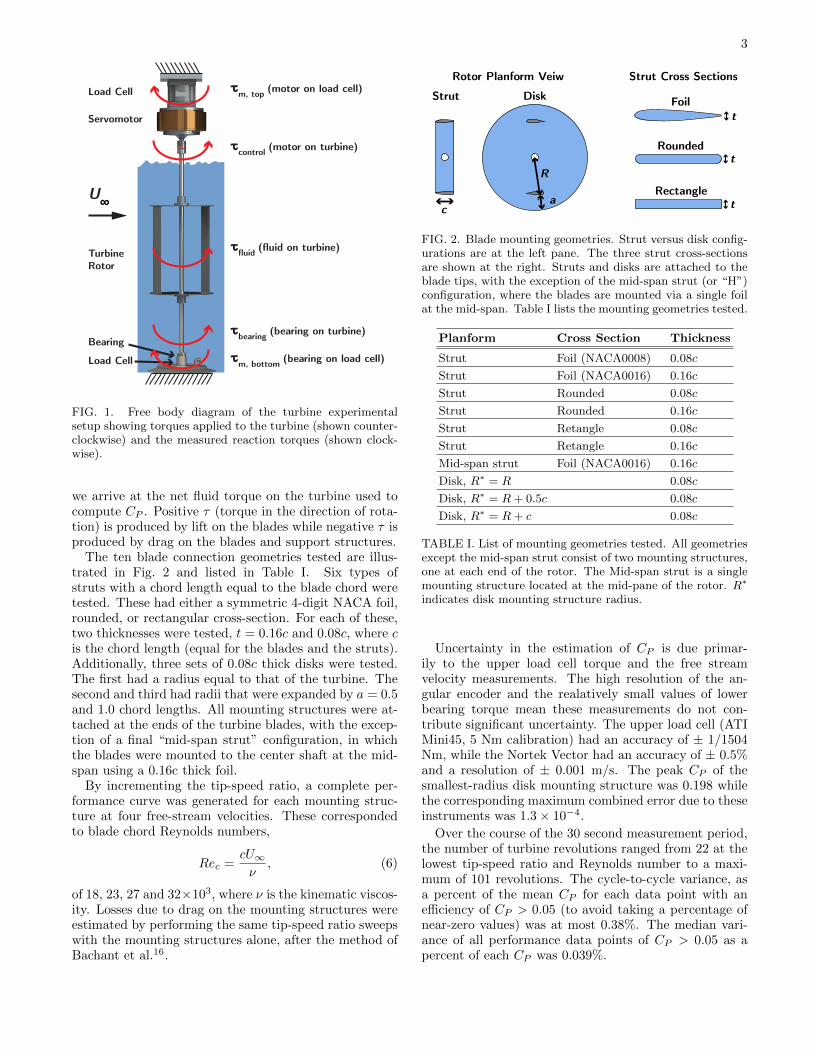
The ten blade connection geometries tested are illus-trated in Fig. 2 and listed in Table I. Six types ofstruts with a chord length equal to the blade chord weretested. These had either a symmetric 4-digit NACA foil,rounded, or rectangular cross-section. For each of these,two thicknesses were tested, t = 0.16c and 0.08c, where cis the chord length (equal for the blades and the struts).Additionally, three sets of 0.08c thick disks were tested.The first had a radius equal to that of the turbine. Thesecond and third had radii that were expanded by a = 0.5and 1.0 chord lengths. All mounting structures were at-tached at the ends of the turbine blades, with the excep-tion of a final “mid-span strut” configuration, in whichthe blades were mounted to the center shaft at the mid-span using a 0.16c thick foil.
By incrementing the tip-speed ratio, a complete per-formance curve was generated for each mounting struc-ture at four free-stream velocities. These correspondedto blade chord Reynolds numbers,
Rec =cU∞ν
, (6)
of 18, 23, 27 and 32×103, where ν is the kinematic viscos-ity. Losses due to drag on the mounting structures wereestimated by performing the same tip-speed ratio sweepswith the mounting structures alone, after the method ofBachant et al.16.
a
Rt
Strut DiskRotor Planform Veiw Strut Cross Sections
c
Foil
Rounded
Rectangle
t
t
FIG. 2. Blade mounting geometries. Strut versus disk config-urations are at the left pane. The three strut cross-sectionsare shown at the right. Struts and disks are attached to theblade tips, with the exception of the mid-span strut (or “H”)configuration, where the blades are mounted via a single foilat the mid-span. Table I lists the mounting geometries tested.
Planform Cross Section Thickness
Strut Foil (NACA0008) 0.08c
Strut Foil (NACA0016) 0.16c
Strut Rounded 0.08c
Strut Rounded 0.16c
Strut Retangle 0.08c
Strut Retangle 0.16c
Mid-span strut Foil (NACA0016) 0.16c
Disk, R∗ = R 0.08c
Disk, R∗ = R + 0.5c 0.08c
Disk, R∗ = R + c 0.08c
TABLE I. List of mounting geometries tested. All geometriesexcept the mid-span strut consist of two mounting structures,one at each end of the rotor. The Mid-span strut is a singlemounting structure located at the mid-pane of the rotor. R∗
indicates disk mounting structure radius.
Uncertainty in the estimation of CP is due primar-ily to the upper load cell torque and the free streamvelocity measurements. The high resolution of the an-gular encoder and the realatively small values of lowerbearing torque mean these measurements do not con-tribute significant uncertainty. The upper load cell (ATIMini45, 5 Nm calibration) had an accuracy of ± 1/1504Nm, while the Nortek Vector had an accuracy of ± 0.5%and a resolution of ± 0.001 m/s. The peak CP of thesmallest-radius disk mounting structure was 0.198 whilethe corresponding maximum combined error due to theseinstruments was 1.3 × 10⁻⁴.
Over the course of the 30 second measurement period,the number of turbine revolutions ranged from 22 at thelowest tip-speed ratio and Reynolds number to a maxi-mum of 101 revolutions. The cycle-to-cycle variance, asa percent of the mean CP for each data point with anefficiency of CP > 0.05 (to avoid taking a percentage ofnear-zero values) was at most 0.38%. The median vari-ance of all performance data points of CP > 0.05 as apercent of each CP was 0.039%.

4
1.2 1.4 1.6 1.8 20
0.05
0.1
0.15
0.2
0.25
0.3C
PFoil, 0.08c
Foil, 0.16cRounded, 0.08cRounded, 0.16cRectangle, 0.08cRectangle, 0.16cMid-span strut, 0.16cDisk, 0.08c, a = 0Disk, 0.08c, a = 0.5cDisk, 0.08c, a = c
Rec
32 x 103
27 x 103
23 x 103
18 x 103
λ
FIG. 3. Peak turbine efficiency as a function of correspondingtip-speed ratio. Color indicates Reynolds number, Eq. (6).Legend indicates strut shape and thickness.
III. RESULTS
Figure 3 summarizes the peak performance of eachblade mounting geometry as a function of Reynolds num-ber and tip-speed ratio. Without exception, increasingReynolds number increased turbine performance, as ex-pected for transitional Reynolds numbers16. As shown inFig. 4 (top), for poor-performing turbines, a secondaryperformance peak at λ = 1.3 dominates over the peaknear λ = 1.8-2. Previous work has demonstrated thatthis low tip-speed ratio peak is due to a strong vortex-foilinteraction31. Increasing turbine performance generallycorresponds to an increase in the tip-speed ratio at whichpeak efficiency occurs. At the highest Reynolds num-ber, strut geometries with the greatest peak efficiencieswere the 0.08c thick struts with foil and rounded crosssections (CP = 0.250 and 0.244, respectively) followedby the 0.16c thick strut with a foil cross section (CP =0.224). These geometries performed best at all Reynoldsnumbers. The smallest disk (a = 0), thin rectangularstrut, and thick rounded strut had the next best efficiencywith similar relative performance at each Reynolds num-ber. The expanded disks (a = 0.5c, c) and the mid-spanstrut configurations had the poorest performance at eachReynolds number.
IV. DISCUSSION
Taking a perturbation theory-like approach to theproblem similar to Li and Calisal30, the total efficiencyof the turbine may be expressed as follows
CP = CP, b +CP, m +CP, m→b +CP, b→m +CP, h.o.t. (7)
Here CP, b represents the ideal power that could be
1 1.2 1.4 1.6 1.8 2 2.2 2.4 2.60
0.05
0.1
0.15
0.2
0.25
0.3
CP,
b
0.05
0.1
0.15
0.2
0.25
0.3
CP
0
Foil, 0.08cFoil, 0.16cRounded, 0.08cRounded, 0.16c
Rectangle, 0.08cRectangle, 0.16c
Mid-span strut, 0.16c
Disk, 0.08c, a = 0Disk, 0.08c, a = 0.5cDisk, 0.08c, a = c
λ
FIG. 4. Top: Full turbine performance curves. Bottom:Performance curves with mounting structure rotational draglosses added back in as an estimate of blade-only performance.Both show performance for Rec = 32 × 103.
1 1.2 1.4 1.6 1.8 2 2.2 2.4 2.6-0.3
-0.25
-0.2
-0.15
-0.1
-0.05
0
CP, m Foil, 0.08c
Foil, 0.16cRounded, 0.08cRounded, 0.16c
Rectangle, 0.08cRectangle, 0.16c
Mid-span strut, 0.16c
Disk, 0.08c, a = 0Disk, 0.08c, a = 0.5cDisk, 0.08c, a = c
λ
FIG. 5. Efficiency loss due to mounting structure drag versustip-speed ratio at Rec = 32 × 103.

5
produced by the blades, regardless of the mounting struc-ture or blade end condition (e.g., in the absence of tiplosses). CP, m represents the efficiency losses due to ro-tational drag on the mounting structures in a flow undis-turbed by the turbine blades. The next two terms repre-sent secondary effects. CP, m→b represents the influenceof the mounting structures on blade performance. Thisincludes a reduction in tip-losses and induced drag andinfluence on span-wise flow. CP, b→m encapsulates the ef-fect of the blades on the drag experienced by the mount-ing structures, primarily due to changes in the local flowfield induced by the blades. Further, higher-order terms(CP, h.o.t.) likely exist, but are not considered in this anal-ysis.
If secondary and higher-order effects are small enoughto be neglected, we can write
CP, b = CP − CP, m −������:
0CP, secondary. (8)
As in Bachant et al.16, measurements of CP, m have beentaken directly by spinning the turbine in the flume with-out blades. Figure 5 shows this efficiency loss for thehighest Reynolds number tested. If the approximationthat CP, secondary ≈ 0 holds, CP, b should be the same forall turbine configurations. Figure 4 (bottom) shows theperformance curves resulting from this analysis. Withthe exception of the mid-span strut turbine, the bladeperformance curves are generally collapsed, though sec-ondary effects are still responsible for some performancevariation. Excluding the mid-span strut turbine, thereis a 13% difference in the lowest and highest performinggeometries at the peak of the curves, with discrepancy in-creasing with tip-speed ratio. The largest variation is be-tween turbines with identical plan-form geometries (Foil,0.16c versus Rounded 0.08c). These geometries likelyhave a similar end-plate and winglet effect on the blades,suggesting that CP, m→b should be similar. Therefore, itis hypothesized that the most influential secondary effectfor all geometries except the mid-span strut geometry isCP, b→m, that is, the changes in mounting structure dragdue to the flow induced by the blades. Extending thedisks beyond the radius of the turbine foils did not ap-pear to increase blade performance. This suggests thatshielding only the inside edge of the blade (suction side)is adequate to reduce tip losses.
A. Mid-Span Mounting Discussion
The mid-span strut turbine exhibits a much reducedtotal performance, remarkable considering mountingstructure losses (CP, m) are equal to the best perform-ing turbine (Foil, 0.08c, Fig. 5) and that this is a com-mon geometry for small vertical-axis wind turbines (i.e.“H-Darrieus”). When the mounting structure losses areaccounted for, the CP, b curve has a much broader peak,far below the other turbine geometries (Fig. 4, bottom).Since this turbine is the only geometry with free foil tips,
1 1.2 1.4 1.6 1.8 2 2.2 2.4 2.60
0.05
0.1
0.15
0.2
0.25
0.3
CP,
b
Combined, H* = H - 7(0.16c)
Foil, 0.08cMid-span strut, 0.16cCombinedCombined, H* = H - 3(0.16c)
λ
FIG. 6. Blade performance (Eq. (8)) curves for the 0.08cthick foil struts, 0.16c thick mid-span strut, and a turbine withboth. Black dashed lines show the performance of the turbinewith both mounting structure types using a reduced value ofthe turbine height in the efficiency equation to account for lossof operable blade span due to the presence of the mid-spanstrut. Failure of these curves to approach the 0.08c foil curveindicates additional sources of power loss due to the presenceof the mid-span strut.
it is likely that CP, m→b dominates. Tip-losses are ex-pected to be large as flow is no longer blocked betweenthe suction and pressure sides of the blades. In addi-tion, the free blade tips may introduce additional drag.To examine whether tip-effects are solely responsible forthe decrease in performance of the mid-span strut tur-bine, an additional turbine geometry was tested, wherethe mounting structure included both the 0.08c thick foilstruts at the ends of the blades and the 0.16c thick foilmid-span strut. A comparison of the foil 0.08c, mid-spanstrut, and the combined turbine are given in Fig. 6. Here,the efficiency loss due to rotational drag, CP m, has beensubtracted, leaving only the blade performance and sec-ondary effects. Shielding the foil tips by using both typesof mounting structures increases in blade performanceover using the mid-span strut alone. However, the fail-ure of the blade performance to match that achieved us-ing the 0.08c foil struts alone suggests tip losses are onlypartially responsible for losses due to the presence of themid-span mount. Since the mid-span strut attaches tothe blades on the suction side of the blades, a centralsegment of the blades is unavailable for lift production.To explore this possibility, the area used in the denomi-nator of the rotor efficiency equation (2) is reduced fromA = 2RH to A = 2RH∗, where H∗ = H − nt, wheret is the mid-span strut thickness, and n is the numberof strut thicknesses unavailable for lift production at themid-span of the blades. As apparent from Fig. 6, rescal-ing the the blade efficiency in this manner does not ac-count for all of the difference in blade performance be-

6
tween the 0.08c foil turbine and the combined turbine,even if three strut widths on either side of the mid-spanstrut are assumed to be unavailable for lift production(black, fine dashed line).
Given the preceding analysis, it seems that anothermechanism, besides losses related to the free blade tipsand an interruption of the lifting surface, must be par-tially responsible for the low performance of the mid-spanstrut turbine design. One hypothesis stems from the factthat the strut interrupts span-wise flow along the liftingsurface. To see how this might be detrimental, first con-sider that the nominal (local) angle of attack on the foilvaries as a function of azimuthal blade position, θ. Ne-glecting flow induced by the turbine rotor, the nominalangle of attack is
αn(θ) = −tan−1
(sin(θ)
λ+ cos(θ)
)+ αp (9)
where αp is the pitch angle of the blade. For λ = 2, thenominal angle of attack for the upstream portion of thecycle (where the majority of power is generated) variesfrom less than zero to over 24 degrees. This virtual pitch-up maneuver to an angle well above the static stall anglecan result in the roll up of a leading edge vortex (LEV), aphenomena known as dynamic stall32. The low pressureregion in the LEV results in a temporary increase in liftabove that possible with a foil at constant angle of attack.As reviewed in Wu, Vakili, and Wu33, span-wise flow inthe vortex core helps to stabilize the LEV, resulting ingreater lift for longer duration before the vortex is shed.This suggests the introduction of a strut into the mid-span of the turbine blades could interrupt span-wise flow,causing premature shedding of the LEV and a reductionin lift.
B. Modeling Mounting Structure Drag
Analytical models for the drag on various mountingstructure geometries may be a useful design tool for pro-viding informed design decisions with limited prototypeiteration. Here, models are compared to data collected byrotating the mounting structures without blades. Lossesdue to rotational drag of the central shaft are not in-cluded in the models. Losses due to the central shaft aremeasured separately by rotating the central shaft in theflow without blades or mounting structures at the appro-priate free stream velocity and rotation rate. These smalllosses are then removed from mounting structure losses.
First the rectangular-planform struts (non-disk mount-ing structures) are considered. The relative velocity per-pendicular to a strut section at a distance r from therotation axis may be written as
Urel(r, θ) = ωr + U∞ cos(θ) + Uinduced, (10)
where θ is the blade position and is zero when the blade istraveling directly upstream. Uinduced consists of any flow
r
drU∞
θ
U rel=
ωr +
U ∞cos
(θ)
cR
ω
FIG. 7. Strut drag model diagram. The free stream flow isfrom left to right. Red arrows indicate the components of thelocal flow velocity due to rotation and the free stream incidenton a strut section of width dr.
velocities induced by the blades and mounting structures.This term will be neglected for simplicity in subsequentanalysis, with the assumption that the flow induced bythe mounting structures is small. The resulting velocityvector incident on a strut is shown in Fig. 7. Taking ablade-element approach to calculating strut losses, thetorque due to drag on a strut element of radial width dris
τd(r, θ) =1
2ρUrel(r, θ)
2 sgn(Urel)CD(Urel)Lrdr. (11)
Here L is the characteristic length used in the pertinentdrag coefficient (CD) definition (e.g., the chord length fora foil). The sgn(Urel) term ensures the torque is appliedin the direction of the relative velocity in case reverseflow is encountered.
At a specific azimuthal angle, θ, the total torque dueto drag on one half strut is given by
τ(θ) =1
2ρL
R∫0
Urel(r, θ)2 sgn(Urel)CD(Urel)rdr (12)
The power loss is the mean of this value over all anglesmultiplied by the rotation rate, ω, and the number of halfstruts (twice the number of blades), or
Pstrut =ωNρL
2π
2π∫0
R∫0
Urel(r, θ)2 sgn(Urel)CD (Urel) rdrdθ.
(13)
7
1 1.2 1.4 1.6 1.8 2 2.2 2.4 2.6
-0.12
-0.1
-0.08
-0.06
-0.04
-0.02
0C
P, m
Rec
32 x 103
27 x 103
23 x 103
18 x 103
DataModel
Rect. 0.08c
Foil 0.08c
λ
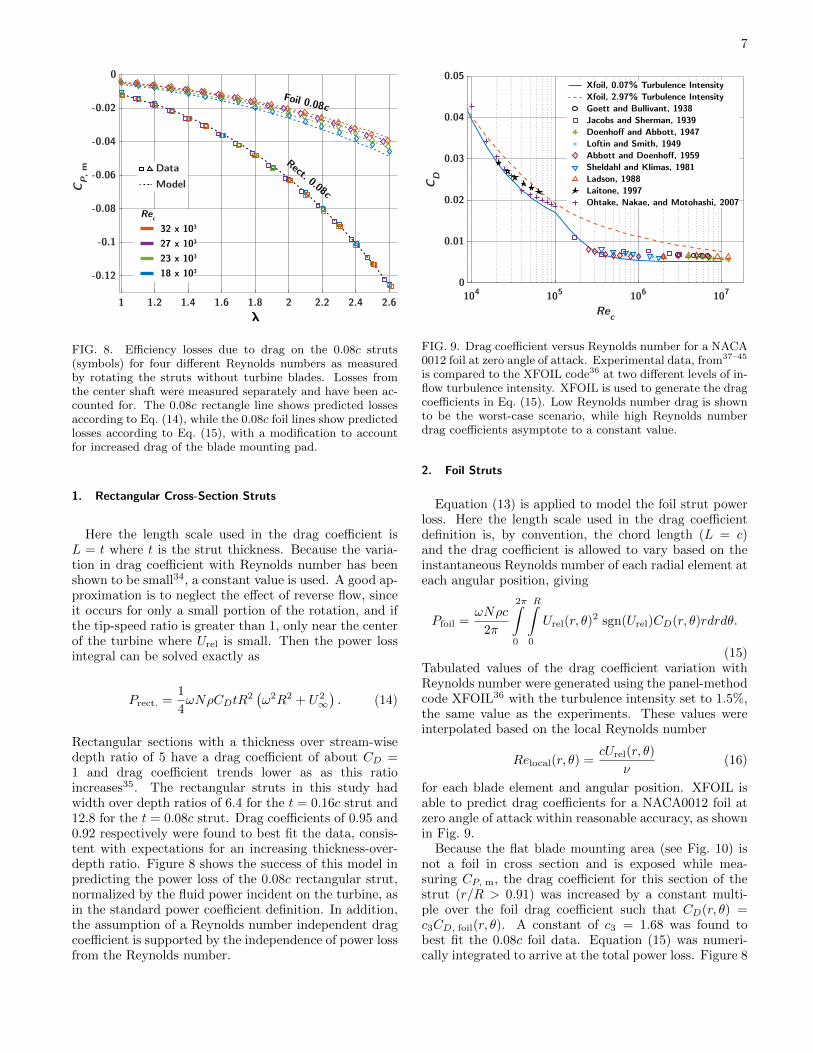
FIG. 8. Efficiency losses due to drag on the 0.08c struts(symbols) for four different Reynolds numbers as measuredby rotating the struts without turbine blades. Losses fromthe center shaft were measured separately and have been ac-counted for. The 0.08c rectangle line shows predicted lossesaccording to Eq. (14), while the 0.08c foil lines show predictedlosses according to Eq. (15), with a modification to accountfor increased drag of the blade mounting pad.
1. Rectangular Cross-Section Struts
Here the length scale used in the drag coefficient isL = t where t is the strut thickness. Because the varia-tion in drag coefficient with Reynolds number has beenshown to be small34, a constant value is used. A good ap-proximation is to neglect the effect of reverse flow, sinceit occurs for only a small portion of the rotation, and ifthe tip-speed ratio is greater than 1, only near the centerof the turbine where Urel is small. Then the power lossintegral can be solved exactly as
Prect. =1
4ωNρCDtR
2(ω2R2 + U2
∞). (14)
Rectangular sections with a thickness over stream-wisedepth ratio of 5 have a drag coefficient of about CD =1 and drag coefficient trends lower as as this ratioincreases35. The rectangular struts in this study hadwidth over depth ratios of 6.4 for the t = 0.16c strut and12.8 for the t = 0.08c strut. Drag coefficients of 0.95 and0.92 respectively were found to best fit the data, consis-tent with expectations for an increasing thickness-over-depth ratio. Figure 8 shows the success of this model inpredicting the power loss of the 0.08c rectangular strut,normalized by the fluid power incident on the turbine, asin the standard power coefficient definition. In addition,the assumption of a Reynolds number independent dragcoefficient is supported by the independence of power lossfrom the Reynolds number.
104 105 106 107
Rec
0
0.01
0.02
0.03
0.04
0.05
CD
Xfoil, 0.07% Turbulence IntensityXfoil, 2.97% Turbulence IntensityGoett and Bullivant, 1938Jacobs and Sherman, 1939Doenhoff and Abbott, 1947Loftin and Smith, 1949Abbott and Doenhoff, 1959Sheldahl and Klimas, 1981Ladson, 1988Laitone, 1997Ohtake, Nakae, and Motohashi, 2007
FIG. 9. Drag coefficient versus Reynolds number for a NACA0012 foil at zero angle of attack. Experimental data, from37–45
is compared to the XFOIL code36 at two different levels of in-flow turbulence intensity. XFOIL is used to generate the dragcoefficients in Eq. (15). Low Reynolds number drag is shownto be the worst-case scenario, while high Reynolds numberdrag coefficients asymptote to a constant value.
2. Foil Struts
Equation (13) is applied to model the foil strut powerloss. Here the length scale used in the drag coefficientdefinition is, by convention, the chord length (L = c)and the drag coefficient is allowed to vary based on theinstantaneous Reynolds number of each radial element ateach angular position, giving
Pfoil =ωNρc
2π
2π∫0
R∫0
Urel(r, θ)2 sgn(Urel)CD(r, θ)rdrdθ.
(15)Tabulated values of the drag coefficient variation withReynolds number were generated using the panel-methodcode XFOIL36 with the turbulence intensity set to 1.5%,the same value as the experiments. These values wereinterpolated based on the local Reynolds number
Relocal(r, θ) =cUrel(r, θ)
ν(16)
for each blade element and angular position. XFOIL isable to predict drag coefficients for a NACA0012 foil atzero angle of attack within reasonable accuracy, as shownin Fig. 9.
Because the flat blade mounting area (see Fig. 10) isnot a foil in cross section and is exposed while mea-suring CP, m, the drag coefficient for this section of thestrut (r/R > 0.91) was increased by a constant multi-ple over the foil drag coefficient such that CD(r, θ) =c3CD, foil(r, θ). A constant of c3 = 1.68 was found tobest fit the 0.08c foil data. Equation (15) was numeri-cally integrated to arrive at the total power loss. Figure 8

8
Foil Section
Blade Mount
FIG. 10. A close-up of the 0.08c foil strut. The flat blademount pad adds additional drag when the strut is rotatedwithout blades.
compares this model to data, where losses due to thecenter shaft have been removed. The Reynolds numberdependence of the foil losses are reflected in the analyti-cal model.
3. Disks
Von Karman solved the the Navier Stokes Equationsexactly for the flow over a rotating disk with a laminarboundary layer46, with refinements later made by Spar-row and Gregg47. A drag torque coefficient for a diskexposed to the fluid on both sides, defined as
Cτ =2τ
12ρω
2R∗5(17)
was found to be
Cτ = 3.87 Re− 1
2ω . (18)
Here, Reω is the disk rotation Reynolds number, givenby
Reω =R∗2ω
ν, (19)
where R∗ is the disk radius. For the extended diskmounting structures (a > 0), R∗ > R. Rott andLewellen48 extended the approach to include the transla-tion of the disk, equivalent to introducing a parallel freestream velocity, as in the case considered in these exper-iments. In the limit of a small advance ratio, definedas
J =U∞ωR∗
, (20)
the solution is identical to Von Karman’s, since the effectson the boundary layer of the free-stream flow cancel onadvancing and retreating sides of the disk. Von Karmanalso considered the case of a turbulent boundary layer ona rotating disk in still fluid, finding
Cτ = 0.146 Re− 1
5ω . (21)
Equations (18) and (21) have shown good agreement withdata for disks rotating in a fluid at rest49. To determineif the data collected in these experiments lies within thelow advance ratio limit, such that these solutions may
FIG. 11. Disk rotational drag torque coefficient, Eq. (17),data compared to exact solutions for a disk in still fluidwith laminar and turbulent boundary layers, Eq. (18) andEq. (21)46.
be used, disk drag torque coefficients measured in theseexperiments are compared to the exact laminar and tur-bulent solutions in Fig. 11.
The comparison demonstrates a clear dependence onthe free stream velocity, here indicated by the freestream-based Reynolds number,
ReU∞ =R∗U∞ν
, (22)
suggesting that these measurements are above the low ad-vance ratio limit, and cannot rely on the exact solutionsalone. Besides that of Rott and Lewellin, the authors arenot aware of any research or analysis on the rotationaldrag on a disk in parallel flow. Figure 11 shows thatthe drag torque coefficient still approximately follows the
Re− 1
2ω law, suggesting the boundary layer is likely in the
laminar regime. The slight upward bend in the data withthe highest Reω may indicate the onset of transition.
To account for the influence of the free stream velocityon the torque coefficient, a linear advance ratio term isadded to the laminar solution, such that
Cτ = 3.87 Re− 1
2ω + pJ, (23)
where the constant p was found to be 0.0075 throughbest fit to the data. This empirical correction term waschosen as it results in the analytical solution for the casethat the free stream velocity is zero (or as the advanceratio tends towards infinity). The model is compared todata in Fig. 12, where the predicted power loss has beennormalized by the fluid power incident on the turbinerotor. Further measurements would be required to un-derstand if this model is effective across a broader rangeof Reynolds numbers.

9
CP, m
Rec
32 x 103
27 x 103
23 x 103
18 x 103
DataModel
1 1.2 1.4 1.6 1.8 2 2.2 2.4 2.6-0.7
-0.6
-0.5
-0.4
-0.3
-0.2
-0.1
0
R* = R
R* = R + 0.5c
R * = R + c
FIG. 12. Efficiency losses due to drag on rotating disks (sym-bols) for four different Reynolds numbers as measured by ro-tating the disk without turbine blades. Losses due to therotation of the center shaft have been removed. The linesshow predicted losses according to the drag torque predictedby Eq. (23).
C. Dependence on Turbine Parameters
To explore dependence of mounting structure losses onturbine parameters (e.g., number of blades), the mod-els for strut losses are reformulated in terms of non-dimensional turbine operational parameters. To aid com-parison, some additional assumptions are made. The firstof these is that mounting structures are located only atthe ends of the blades. Power loss due to the mountingstructures is first normalized by the power in the freestream flow incident on the turbine rotor area as
CP, m =P m
12ρU
3∞2RH
. (24)
Turbine non-dimensional parameters are then substi-tuted. For the rectangular strut model, assuming thestrut width is equal the turbine blade chord, this gives
CP, rect. = −πt∗CDσ
4ARλ(λ2 + 1) (25)
Here σ is the turbine solidity (Eq. (3)),
AR =H
2R(26)
is the turbine aspect ratio, and
t∗ =t
c(27)
is the thickness ratio of the rectangular strut sections.For foil struts, if it is assumed that the local Reynolds
number is high enough that the drag coefficient is con-stant, the result is the same as the rectangular strut ef-ficiency loss equation without the thickness ratio due tothe difference in drag coefficient definitions:
CP, foil = −πCDσ4AR
λ(λ2 + 1). (28)
Reynolds number independent operation is likely forcommercial-scale turbines, so this simplification is appro-priate. For the disk efficiency loss, it is assumed that thedisk has the same radius as the turbine blades, R∗ = R,thus the disk advance ratio is equal to inverse of the tur-bine tip-speed ratio, J = 1
λ . The free stream velocityReynolds number is a more natural expression for thescale of a turbine, thus the identity
Reω = λReU∞ (29)
is applied to Eq. (23). The turbine efficiency lost to diskdrag torque then becomes
CP, disk = − π
4ARλ2
(3.87
√λ
ReU∞
+ 0.0075
)(30)
A comparison of Eq.s (25), (28), and (30) shows thatfor all geometries, increasing the aspect ratio will de-crease relative losses, since there is more rotor area perblade mounting structure. A practical upper limit mayexist if the blade requires intermediate support for struc-tural stability. For the rectangular and foil struts, lossesincrease with turbine solidity, while for the disks they donot. However, there is likely a limit to the validity of thisdependence on solidity, when the flow induced by a largenumber of struts has a significant impact on the individ-ual strut drag. The effect of tip-speed ratio is similaracross geometries, with the leading term of λ3 for the foiland rectangular struts and λ
52 for the disks. Therefore
the choice of mounting geometry (and associated losses)becomes increasingly important at higher tip-speed ra-tios.
D. Scaling and Reynolds Number Effects
A natural question whether the results of this studycan generalize to larger geometries and, thus, higherReynolds numbers, such as those of commercial-scale tur-bines. Though this topic warrants further exploration,some inferences may be made. First, for the foil and diskmounting geometries, the experimental data here rep-resents a worst-case-scenario for normalized losses. Asshown by Fig. 9, foil drag coefficients are expected todrop further as Reynolds number increases. Similarly,the disk losses show an inverse power law dependenceon Reynolds number. In contrast, the drag coefficientsof rectangular cross section struts show no change withReynolds number, so those results would likely translateto larger turbines directly. This is because profile drag,

10
1.8 2 2.2 2.4 2.6 2.8 30.9
1
1.1
1.2
1.3Foil, 0.08cDisk, 0.08c, a = 0
CP,m/C
P,m(3
.2x1
04)
3.2x10⁴
Rec
FIG. 13. Efficiency loss as a function of Reynolds number,normalized by the efficiency loss at Rec = 3.2× 10⁴, is shownfor the thin foil and smallest disk mounting geometries. Sincethe efficiency loss slope is less negative with increase in Reyn-olds number, these geometries may be approaching Reynoldsnumber independence.
relatively insensitive to Reynolds number for blunt ob-jects, is responsible for the majority of the drag for thismounting geometry.
There is some evidence that these experiments are be-ginning to approach a regime of Reynolds number insen-sitivity. Figure 13 shows normalized losses, as comparedto the highest Reynolds number measured, appear to beasymptotic to a constant value for the thin foil and small-est disk geometries.
E. Extraploation of Models
The presented models include terms fit to our specificexperimental data. This raises potential concerns overextensions to other turbines and flow conditions. Here,we discuss considerations for extrapolating each modelfor mounting structure power loss. The model for therectangular-cross section struts is most likely to remainpredictive when applied to different scenarios since thefit value of the drag coefficient is close to that reportedin previous work and is Reynolds number independent.The fit value in the foil strut model concerns the dragproduced by the sharp geometry of the blade mount-ing pads. In a fully-assembled turbine, this geometry ismerged with the blade, likely reducing the drag producedby the mounting pad. Good estimates of foil strut lossesin a full turbine are likely possible using only the XFOILestimated drag coefficients. Larger uncertainty remainsfor the accuracy of the disk model for higher free streamvelocity Reynolds numbers and future work should in-clude verification or modification of this model to ensureapplicability across a wide range of turbine sizes and flowconditions.
V. CONCLUSIONS
Ten two-bladed cross-flow turbine blade mounting ge-ometries have been tested in a recirculating water flumeat four Reynolds numbers. The best-performing mount-ing system consists of thin, foil-shaped struts attached atthe ends of the turbine blades. With the exception of themid-span strut geometry, blade performance is shown tocollapse at peak performance when losses due to strutdrag are accounted for. Tip-losses are shown to be onlypartially responsible for the poor performance of the mid-span strut turbine. It is hypothesized that interruption ofspan-wise flow may cause premature shedding of a bene-ficial leading edge vortex. Simple models for the drag onrectangular plan-form and disk mounting geometries areexplored, and are shown to agree well with experimentaldata.
We believe these results will be useful to designers ofcross-flow turbines. As such the main conclusions of thiswork are presented in terms of end-plate geometry de-sign decisions. First, supports situated at the blade endsappear to improve performance relative to a mid-spansupport. For blades supported at the mid-span, the ad-dition of winglets or end-plates to blade tips may reducetip losses, but will increase drag without adding struc-tural support. Additionally, it appears that mid-spansupports have detrimental effects in addition to blade tiplosses and rotational drag. For this reason, intermediatespan supports should be minimized on turbines with alarge axial dimension, H, as structural constraints allow,particularly when dynamic stall is an important contrib-utor to turbine power output. Second, for a small numberof blades, it appears that streamlined struts rather thandisks are optimal. This seems likely to be true for tur-bines with at least three blades, as multiplying t = 0.08cfoil strut drag losses by 1.5 results in less drag thanthe smallest disk mounting structures tested. If possi-ble, a foil cross-section is optimal, but using a simple-to-manufacture rounded rectangular strut performs nearlyas well, as long as the thickness is minimized. For tur-bines with greater numbers of blades, it is likely that thedisk mounting structures will be the optimal mountinggeometry, as drag is independent of the number of blades.Since disk drag increases with R∗4 and we observed noblade performance improvement by extending disks be-yond the blades, the disks should not extend beyond theblades. Extension of the rectangular plan-form mountingstructures (struts) beyond the blade radius is also likelyto be detrimental. Since the suction side of the turbineblade is already shielded, the additional drag will over-whelm any small increase in blade performance due tofurther shielding of the blade tip.
Additional mounting structure geometries such as foilstruts which incorporate small end-plates or winglets anda curved foil-strut interface are under consideration. Ifpossible, strut geometries should be compared at largerscales, in the Reynolds number independent regime. Dif-ferences in performance when the inflow is not perpen-

11
dicular to the axis of rotation should be considered, sincethe disk and strut geometries will likely respond differ-ently to axial flow. Flow measurements inside the tur-bine rotor could be used to verify the additional sourcesof mid-span strut losses identified in this study.
VI. ACKNOWLEDGMENTS
Funding: This work was supported by the US De-partment of Defense Naval Facilities Engineering Com-mand. Initial explorations of this topic that motivatedthe present work were carried out by Adam Niblick whilehe was a student at the University of Washington.
VII. REFERENCES
1F. Balduzzi, A. Bianchini, E. A. Carnevale, L. Ferrari, andS. Magnani, “Feasibility analysis of a Darrieus vertical-axis windturbine installation in the rooftop of a building,” Applied Energy97, 921–929 (2012).
2H. J. Sutherland, D. E. Berg, and T. D. Ashwill, “A retrospec-tive of VAWT technology,” Sandia Report No. SAND2012-0304(2012).
3B. Strom, S. L. Brunton, and B. L. Polagye, “Intracycle angularvelocity control of cross-flow turbines,” Nature Energy (accepted,forthcoming) (2017).
4J. O. Dabiri, “Potential order-of-magnitude enhancement of windfarm power density via counter-rotating vertical-axis wind tur-bine arrays,” Journal of Renewable and Sustainable Energy 3,043104 (2011).
5J. Abraham, B. Plourde, G. Mowry, W. Minkowycz, and E. Spar-row, “Summary of savonius wind turbine development and futureapplications for small-scale power generation,” Journal of Renew-able and Sustainable Energy 4, 042703 (2012).
6B. Plourde, J. Abraham, G. Mowry, and W. Minkowycz, “Anexperimental investigation of a large, vertical-axis wind turbine:Effects of venting and capping,” Wind Engineering 35, 213–222(2011).
7S. Salter, “Are nearly all tidal stream turbine designs wrong?”in 4th International Conference on Ocean Energy (2012).
8A. Copping, N. Sather, L. Hanna, J. Whiting, G. Zydlewski,G. Staines, A. Gill, I. Hutchison, A. OaHagan, T. Simas, et al.,“Annex iv 2016 state of the science report: Environmental ef-fects of marine renewable energy development around the world,”Ocean Energy Systems (2016).
9T. J. Carrigan, B. H. Dennis, Z. X. Han, and B. P. Wang, “Aero-dynamic shape optimization of a vertical-axis wind turbine usingdifferential evolution,” ISRN Renewable Energy 2012 (2012).
10M. R. Castelli and E. Benini, “Effect of blade inclination angleon a darrieus wind turbine,” Journal of turbomachinery 134,031016 (2012).
11C.-C. Chen and C.-H. Kuo, “Effects of pitch angle and blade cam-ber on flow characteristics and performance of small-size darrieusvawt,” Journal of Visualization 16, 65–74 (2013).
12C. Consul, R. Willden, E. Ferrer, and M. McCulloch, “Influenceof solidity on the performance of a cross-flow turbine,” in 8thEuropean Wave and Tidal Energy Conference. Uppsala, Sweden(2009).
13R. Gosselin, G. Dumas, and M. Boudreau, “Parametric study ofh-darrieus vertical-axis turbines using urans simulations,” 21stAnnual Conference of the CFD Society of Canada (2013).
14L. A. Danao, J. Edwards, O. Eboibi, and R. Howell, “A nu-merical investigation into the effects of fluctuating wind on the
performance of a small scale vertical axis wind turbine,” Engi-neering Letters 21, 149–157 (2013).
15D. Malcolm, “Dynamic response of a darrieus rotor wind turbinesubject to turbulent flow,” Engineering Structures 10, 125–134(1988).
16P. Bachant, M. Wosnik, B. Gunawan, and V. S. Neary, “Exper-imental study of a reference model vertical-axis cross-flow tur-bine,” PloS one 11, e0163799 (2016).
17L. Battisti, L. Zanne, S. DellaAnna, V. Dossena, G. Persico, andB. Paradiso, “Aerodynamic measurements on a vertical axis windturbine in a large scale wind tunnel,” Journal of energy resourcestechnology 133, 031201 (2011).
18M. Kinzel, Q. Mulligan, and J. O. Dabiri, “Energy exchange inan array of vertical-axis wind turbines,” Journal of Turbulence13, 1–13 (2012).
19E. Reid, “The effects of shielding the tips of airfoils”, naca rep.201,” Natl. Advis. Comm. Aeronaut., Hampton, VA (1924).
20I. Kroo, “Drag due to lift: concepts for prediction and reduction,”Annual Review of Fluid Mechanics 33, 587–617 (2001).
21A. Gorlov, “Development of the helical reaction hydraulic tur-bine. final technical report, july 1, 1996–june 30, 1998,” Tech.Rep. (Northeastern Univ., Boston, MA (United States), 1998).
22M. Khan, G. Bhuyan, M. Iqbal, and J. Quaicoe, “Hydrokineticenergy conversion systems and assessment of horizontal and ver-tical axis turbines for river and tidal applications: A technologystatus review,” Applied Energy 86, 1823–1835 (2009).
23M. Shiono, K. Suzuki, and S. Kiho, “An experimental study ofthe characteristics of a darrieus turbine for tidal power genera-tion,” Electrical Engineering in Japan 132, 38–47 (2000).
24P. Bachant and M. Wosnik, “Performance measurements ofcylindrical-and spherical-helical cross-flow marine hydrokineticturbines, with estimates of exergy efficiency,” Renewable Energy74, 318–325 (2015).
25P. Bachant and M. Wosnik, “Characterising the near-wake of across-flow turbine,” Journal of Turbulence 16, 392–410 (2015).
26C. Hill, V. S. Neary, B. Gunawan, M. Guala, and F. Sotiropou-los, “Us department of energy reference model program rm2: Ex-perimental results,” Sandia National Laboratories, Albuquerque,NM (2014).
27A. Goude, S. Lundin, and M. Leijon, “A parameter study of theinfluence of struts on the performance of a vertical-axis marinecurrent turbine,” in Proceedings of the 8th European wave andtidal energy conference, EWTEC09, Uppsala, Sweden (Citeseer,2009) pp. 477–483.
28R. Gosselin, G. Dumas, and M. Boudreau, “Parametric study ofh-darrieus vertical-axis turbines using cfd simulations,” Journalof Renewable and Sustainable Energy 8, 053301 (2016).
29G. Rawlings, M. Alidadi, V. Klaptocz, Y. Nabavi, Y. Li,J. Mikkelsen, S. Calisal, et al., “Application of end plates forvertical axis hydro turbine performance enhancement,” in TheEighteenth International Offshore and Polar Engineering Con-ference (International Society of Offshore and Polar Engineers,2008).
30Y. Li and S. M. Calisal, “Three-dimensional effects and arm ef-fects on modeling a vertical axis tidal current turbine,” Renew-able energy 35, 2325–2334 (2010).
31B. Strom, S. L. Brunton, and B. Polagye, “Consequences of pre-set pitch angle on cross-flow turbine hydrodynamics,” Proceedingof the European Wave and Tidal Energy Conference (2015).
32W. McCroskey, “The phenomenon of dynamic stall.” Tech. Rep.(National Aeronautics and Space Administration Moffett FieldCA, AMES Research Center, 1981).
33J. Wu, A. Vakili, and J. Wu, “Review of the physics of enhanc-ing vortex lift by unsteady excitation,” Progress in AerospaceSciences 28, 73–131 (1991).
34G. Schewe, “Reynolds-number-effects in flow around a rectan-gular cylinder with aspect ratio 1: 5,” Journal of Fluids andStructures 39, 15–26 (2013).
35A. Soda, C. Mannini, and M. Sjeric, “Investigation of unsteadyair flow around two-dimensional rectangular cylinders.” Transac-

12
tions of FAMENA 35 (2011).36M. Drela, “Xfoil: An analysis and design system for low reyn-
olds number airfoils,” in Low Reynolds number aerodynamics(Springer, 1989) pp. 1–12.
37H. J. Goett and W. K. Bullivant, “Tests of naca 0009, 0012, and0018 airfoils in the full-scale tunnel, report no.647,” Tech. Rep.(National Advisory Commitee for Aeronautics, 1939).
38E. N. Jacobs and A. Sherman, “Airfoil section characteristics asaffected by variations of the reynolds number, report no. 586,”Tech. Rep. (National Advisory Commitee for Aeronautics, 1937).
39A. E. Von Doenhoff and F. T. Abbott, “The langley two-dimensional low-turbulence pressure tunnel, technical note no.1283,” Tech. Rep. (National Advisory Commitee for Aeronau-tics, 1947).
40L. K. Loftin Jr and H. A. Smith, “Aerodynamic characteristicsof 15 naca airfoil sections at seven reynolds numbers from 0.7 ×10⁶ to 9.0 × 10⁶, technidal note no. 1945,” Tech. Rep. (NationalAdvisory Commitee for Aeronautic, 1949).
41I. H. Abbott and A. E. Von Doenhoff, Theory of wing sections,including a summary of airfoil data (Courier Corporation, 1959).
42R. E. Sheldahl and P. C. Klimas, “Aerodynamic characteristicsof seven symmetrical airfoil sections through 180-degree angleof attack for use in aerodynamic analysis of vertical axis windturbines,” Tech. Rep. (Sandia National Labs., Albuquerque, NM
(USA), 1981).43C. L. Ladson, “Effects of independent variation of mach and reyn-
olds numbers on the low-speed aerodynamic characteristics of thenaca 0012 airfoil section, nasa technical memorandum 4074,”Tech. Rep. (NAtional Aeronautics and Space Administration,1988).
44E. Laitone, “Wind tunnel tests of wings at reynolds numbersbelow 70 000,” Experiments in Fluids 23, 405–409 (1997).
45T. Ohtake, Y. Nakae, and T. Motohashi, “Nonlinearity of theaerodynamic characteristics of naca0012 aerofoil at low reynoldsnumbers,” Japan Society of Aeronautical Space Sciences 55, 439–445 (2007).
46T. Von Karman, “Uber laminare und turbulente reibung,”ZAMM - Journal of Applied Mathematics and Mechanics /Zeitschrift fur Angewandte Mathematik und Mechanik 1, 233–252 (1921).
47E. Sparrow and J. Gregg, “Mass transfer, flow, and heat transferabout a rotating disk,” Journal of Heat Transfer 82, 294–302(1960).
48N. Rott and W. S. Lewellen, “Boundary layers due to the com-bined effects of rotation and translation,” The Physics of Fluids10, 1867–1873 (1967).
49H. Schlichting, Boundary-layer theory, 7th ed. (McGraw-Hill,1979).