impact of bilingual education programs on limited … · impact of bilingual education programs on...
TRANSCRIPT
NBER WORKING PAPER SERIES
IMPACT OF BILINGUAL EDUCATION PROGRAMS ON LIMITED ENGLISH PROFICIENT STUDENTS AND THEIR PEERS: REGRESSION DISCONTINUITY EVIDENCE FROM TEXAS
Aimee ChinN. Meltem DaysalScott A. Imberman
Working Paper 18197http://www.nber.org/papers/w18197
NATIONAL BUREAU OF ECONOMIC RESEARCH1050 Massachusetts Avenue
Cambridge, MA 02138June 2012
We thank Chinhui Juhn, Danielle Li, and workshop participants at the 2010 and 2011 National Academyof Education Annual Meeting, 2011 ASSA Meetings, and 2012 SOLE Meetings for helpful commentsand discussion. Imberman gratefully acknowledges financial support from the National Academy ofEducation/Spencer Foundation Postdoctoral Fellowship. A University of Houston Small Grant wasused to purchase the data, for which we are grateful. The authors bear sole responsibility for the contentof this paper. The views expressed herein are those of the authors and do not necessarily reflect theviews of the National Bureau of Economic Research.
NBER working papers are circulated for discussion and comment purposes. They have not been peer-reviewed or been subject to the review by the NBER Board of Directors that accompanies officialNBER publications.
© 2012 by Aimee Chin, N. Meltem Daysal, and Scott A. Imberman. All rights reserved. Short sectionsof text, not to exceed two paragraphs, may be quoted without explicit permission provided that fullcredit, including © notice, is given to the source.

Impact of Bilingual Education Programs on Limited English Proficient Students and TheirPeers: Regression Discontinuity Evidence from TexasAimee Chin, N. Meltem Daysal, and Scott A. ImbermanNBER Working Paper No. 18197June 2012JEL No. I21,J24
ABSTRACT
Texas requires a school district to offer bilingual education when its enrollment of limited Englishproficient (LEP) students in a particular elementary grade and language is twenty or higher. Usingschool panel data, we find a significant increase in the probability that a district offers bilingual educationabove this 20-student cutoff. Using this discontinuity as an instrument for district bilingual educationprovision, we find that bilingual education programs do not significantly impact the standardized testscores of students with Spanish as their home language (comprised primarily of ever-LEP students).However, there are significant positive spillover effects to their non-LEP peers.
Aimee ChinUniversity of HoustonDepartment of Economics204 McElhinney HallHouston, TX 77204-5019and [email protected]
N. Meltem DaysalDepartment EORTilburg UniversityWarandelaan 2P.O. Box 901535000 LE TilburgThe [email protected]
Scott A. ImbermanMichigan State University486 W. Circle Drive110 Marshall-Adams HallEast Lansing, MI 48824-1038and [email protected]

1
I. Introduction
One of the major challenges facing educators and policymakers today is the
large and growing number of limited English proficient (LEP) children in U.S. public
schools. About 1 in 9 students enrolled in pre-kindergarten to grade 12 were classified
as LEP in 2008-09, a marked increase from the ratio of 1 in 13 recorded one decade
earlier (National Clearinghouse for English Language Acquisition 2011). These LEP
students are present not only in big cities and other traditional immigrant-receiving
areas, but across the country; even by 2001-02, when U.S. immigrants were less
geographically dispersed than they are today, about half of public schools in the U.S.
had at least one LEP student (Zehler et al. 2003). Lack of proficiency in English
presents a significant barrier to learning in U.S. schools, and given these recent trends
in LEP student population and geographic dispersion, how to educate LEP students is
likely to remain an important policy issue in the coming years.
School districts are required by federal law to provide special assistance to
LEP students.1 Bilingual education (BE) and English as a Second Language (ESL) are
the two most common educational programs offered by school districts to help LEP
students. While there is considerable variation in how these programs are implemented
in the classroom, a defining feature of BE is the use of the student’s native language
for at least some of the academic instruction; other programs such as ESL teach only
in English. Given this feature, LEP students participating in BE tend to be placed in a
self-contained classroom with classmates who share the same home language and a
dedicated bilingual education teacher who can teach in that language. In contrast, LEP
students participating in ESL tend to be placed in mainstream classrooms with pullout
time with an ESL teacher to improve their English skills.
In this paper, we identify the causal effect of BE on the academic achievement
of LEP students and their non-LEP peers using quasi-experimental variation in BE
exposure generated by a policy rule governing the provision of bilingual education
1 The relevant laws are Title VI of the 1964 Civil Rights Act and the Equal Educational Opportunity Act of 1974. Section II.A provides a legislative background on educational programs for LEP students.

2
programs in Texas. The policy rule requires a school district to offer BE when its
enrollment of LEP students in a particular elementary grade level and language is
twenty or higher. Below this 20-student cutoff, school districts are free to offer BE or
ESL, with most choosing to offer ESL.2 This suggests a regression discontinuity (RD)
design in which the effect of BE (relative to ESL) on student achievement can be
obtained by comparing student outcomes in districts just above the 20-student cutoff
(and therefore more likely to provide BE) and student outcomes in districts just below
the cutoff. We elaborate on this RD strategy in Section III.
This paper adds to a large literature evaluating educational programs for LEP
students, which we briefly summarize in Section II.B. It addresses two major gaps in
this literature. First, this literature has focused exclusively on the impacts on the
intended beneficiaries themselves (i.e., the LEP students) and ignored any effects that
these programs might have on non-LEP students. Yet, because these programs change
the student composition of mainstream classrooms and school resource allocations,
among other things, it is reasonable to believe that there might be spillover effects to
non-LEP students. To our knowledge, our study is the first to test for spillover effects
of educational programs for LEP students, and to the extent that they exist, to quantify
them. Quantifying these spillover effects is necessary for a complete cost-benefit
analysis of the various educational programs for LEP students; all else equal, policy
makers might prefer the program that benefits non-LEP students more (or, stated
differently, harms non-LEP students less).
Second, most of the studies in this literature do not address the potential
problem of endogeneity in student exposure to the educational programs for LEP
students. In general, student exposure to a program is not random, and instead is the
result of decisions made by students, parents, schools and districts. Thus, it is likely
correlated with unmeasured and unobserved characteristics of the students, parents,
schools and districts, some of which might in turn be correlated with student
2 There are cost advantages to only offering ESL, as we discuss in Section IV.A.

3
achievement. Estimates of program effects that do not take this into account tend to be
biased. Our research adds to the small handful of studies that provide estimates of the
impacts of educational programs for LEP students with a causal interpretation.3
We implement our RD strategy using panel data on elementary schools in
districts near the 20-Spanish-LEP-student cutoff defined by the policy rule. We
describe these data in Section IV. We restrict our attention to the policy rule vis-à-vis
Spanish LEP students for a practical reason: Spanish is the home language of 90
percent of Texas’ total LEP enrollment, and is the only language for which there is
enough variation across districts to implement our empirical strategy. Due to this
restriction, our results pertain to the effect of district provision of Spanish bilingual
education programs (relative to providing only ESL for Spanish LEP students).
However, considering that Spanish is the language of over three-quarters of total LEP
enrollment in the U.S. and accounts for an even higher share of bilingual education
programs operating in the U.S. (Zehler et al. 2003), it is especially policy-relevant to
understand the effects of Spanish BE programs.
To preview the results, we find evidence of a significant increase in the
probability that a district offers bilingual education above the 20-Spanish-LEP-student
cutoff. We do not find any significant jumps at the cutoff in covariates unrelated to BE
provision, nor do we observe “stacking” of districts below the cutoff (which would
have raised concerns about district manipulation to avoid providing BE), which
validates the interpretation of differences in student outcomes just above and just
below the cutoff as due to district BE provision.
We proceed by using the variation in district provision of BE induced by the
policy rule as an instrumental variable to identify the causal impact of district
provision of BE on student achievement. These instrumental variable estimates
provide the local average treatment effect of district provision of Spanish BE among
school districts whose decision to offer Spanish BE is constrained by the policy rule.
3 These studies include Slavin et al. (2010), Matsudaira (2005) and Angrist, Chin and Godoy (2008), which we summarize in Section II.B.

4
Our main findings are as follows. First, district provision of BE significantly raises the
standardized test scores of students who are non-LEP and whose home language is not
Spanish. These students would never have been candidates to participate in Spanish
BE programs, thus this finding is indicative of program spillover effects.
Second, district provision of BE has generally positive but smaller and
statistically insignificant effects on all students whose home language is Spanish taken
together. In our sample, 89 percent of Spanish home language students are classified
as LEP in first grade, indicating that this sample primarily consists of those who
would have been eligible to participate in educational programs for Spanish LEP
students. Hence, our results suggest that the impact of district bilingual education
provision on the intended beneficiaries is not different from zero.
Finally, we find that district BE provision significantly increases test scores on
all students taken together. The positive net impact indicates that on average, the test
score gains due to district BE provision exceed test score losses experienced by
students in a given cohort and school.
The foregoing estimation results, along with robustness checks and an
exploration of some potential mechanisms for the spillover effects, are reported in
Section V. Section VI concludes and discusses some policy implications.
II. Background and Related Literature
A. Legislative Background on Educational Programs for LEP Students
The Bilingual Education Act passed in 1968 was the first federal law expressly
addressing the educational needs of LEP students in American schools, and did so by
providing a financial reward—federal grants awarded on a competitive basis—for
providing help to LEP students.4 Later federal laws made it a legal responsibility of
school districts to provide such help. The two main pieces of legislation are the Title
VI of the 1964 Civil Rights Act, which prohibits discrimination on the basis of race,
4 This legislation was Title VII of the Elementary and Secondary Education Act. Crawford (1989) provides a good history of BE in the U.S., and Nieto (2009) provides a more recent summary.

5
color or national origin in federally-assisted programs, and the Equal Educational
Opportunity Act of 1974, which basically extends Title VI to school districts not
receiving federal funds. School districts faced termination of funding from the U.S.
Department of Education or private lawsuits if they failed to provide LEP children
with an equal educational opportunity.
The U.S. Supreme Court’s Lau v. Nichols decision in 1974 made clear that the
prevalent practice of “sink or swim” instruction, in which LEP students are placed in
the same classrooms as non-LEP students without additional services, was a violation
of LEP students’ civil rights. To receive an equal educational opportunity, LEP
students were entitled to special assistance. Guidelines on Title VI compliance issued
by the Department of Education to school districts in 1970 called for “affirmative
steps”5 to help LEP students without specifying what educational programs to use, and
new guidelines in 1975 specified bilingual education.
In an environment that demanded Title VI compliance, individual states passed
laws mandating bilingual education programs for LEP students. Massachusetts was the
first, with a 1971 law, followed by Alaska (1972), California (1972), Illinois (1973),
Texas (1973), New York (1974), and others. The programs mandated by these laws
tended to be transitional BE programs, which have the goal of mainstreaming the LEP
students as soon as they acquire sufficient English-language skills; native language
instruction is temporarily used so that the LEP students can keep up in academic
subjects.6 Additionally, these laws did not require every school district to provide
bilingual education to every LEP student. Instead they specified the circumstances
under which a school district would provide BE, and these circumstances generally
involved the number and concentration of LEP students of a particular grade and of a
particular language group in a school district. For example, in Texas, school districts
with at least twenty LEP students in a particular elementary grade and language must
5 35 Fed. Reg. 11,595 (1970) as cited in U.S. Commission on Civil Rights (1995), p. 71. 6 Dual language programs, whose goal is proficiency in both English and the student’s home language, are rare in the U.S. and not the subject of this study.
6
offer bilingual education. Below, we take advantage of this policy rule in Texas to
identify the effects of bilingual education.
Since the late 1990s, there has been a shift away from using bilingual
education toward using English-only programs to help LEP students. Revealingly, in
2002, the Bilingual Education Act was renamed the English Language Acquisition,
Language Enhancement, and Academic Achievement Act (Title III of the No Child
Left Behind Act). Also, several states eliminated bilingual education in public schools
through ballot initiatives: California (1998), Arizona (2000) and Massachusetts
(2002). Reflecting this shift, 40 percent of LEP students in U.S. public schools were in
a BE program in 2001-02, compared to 63 percent in 1991-92 (the remainder are in
English-only programs, with the largest being ESL) (Zehler et al. 2003).
To comply with U.S. civil rights laws, school districts must provide special
assistance to LEP students, but neither history nor existing evaluations (which we
discuss in the next subsection) provide clear guidance for which programs are more
effective. This study contributes to the debate on how to help LEP students by
providing new empirical evidence on the effects of bilingual education program
provision (compared to ESL program provision alone); it is at this very margin—BE
or ESL—that many school districts are making policy decisions today.
B. Related Literature
There is a substantial body of research evaluating the effect of educational
programs for LEP students on the LEP students themselves.7 Most of these papers do
not address the potential problem of endogeneity in program exposure. A few recent
studies use research designs that are more convincing for identifying causal
relationships. Slavin et al. (2010) conduct a randomized evaluation in which 387 LEP
kindergartners in ten schools were randomly assigned (within school) to either
bilingual education or structured English immersion (an English-only approach). They
7 See, for example, Baker and de Kanter (1981), Willig (1985), Rossell and Baker (1996) and Greene (1998) for reviews. Slavin et al. (2010) offer a more recent discussion of this literature.

7
find no significant differences in tests measuring English skills by fourth grade.
Matsudaira (2005) uses a regression-discontinuity design taking advantage of a district
policy rule governing which students are classified as LEP and therefore eligible to
participate in educational programs for LEP students (which in this district is BE or
ESL). He finds little difference in academic achievement between students who scored
just below the English skills assessment cutoff (and eligible for BE/ESL services) and
just above (ineligible, so placed in mainstream classrooms). Angrist, Chin, and Godoy
(2008) look at policy shifts in Puerto Rico that changed the medium of instruction
from English to Spanish and find no impact on English-speaking ability in adulthood.
These three studies suggest that, while not helping LEP students, pedagogical
approaches using native language instruction do not seem to hurt them either. Our
study contributes by exploiting a different source of exogenous variation in exposure
to educational programs for LEP students.
A notable gap in the literature evaluating LEP programs is that it ignores
potential impacts of these programs on non-LEP students. To our knowledge, our
study is the only one to examine potential effects of educational programs for LEP
students on non-LEP peers. Closely related, though, are Cho (2011) and Geay,
McNally and Telhaj (2011), which estimate the impact of LEP students on non-LEP
peers. These studies are pertinent to ours because as we discuss in Section IV.A, one
channel through which BE provision may impact non-LEP students is through
decreasing the exposure of non-LEP students to LEP students. Cho uses within-
school, and sometimes within-student, variation in having an LEP classmate in the
Early Childhood Longitudinal Study, Kindergarten Cohort dataset, and finds that
having at least one LEP classmate is associated with lower reading test score gains but
no significant differences in math test score gains. Geay et al. exploit variation in
share of classmates who are non-native English speakers arising from within-school
cohort-to-cohort fluctuations, as well as from European Union enlargement, and find
no significant effects of exposure to non-native English speakers on the achievement
of native English speakers in England.

8
Although few studies examine peer effects of LEP students on non-LEP
students specifically, there exists a large literature on peer effects in education. Two
strands within this literature are especially related to our study. One strand is on peer
effects in primary and secondary education, including on the effect of being exposed
to peers who have higher or lower achievement test scores (e.g., Angrist and Lang
2004; Hanushek, Kain, Markman and Rivkin 2003; Hoxby and Weingarth 2006; Lavy,
Paserman, and Schlosser 2012; Imberman, Kugler, and Sacerdote 2012) or who
exhibit disruptive behavior (e.g., Figlio 2005; Aizer 2008; Carrell and Hoekstra 2010).
A second strand is on the impact of immigrants on the educational outcomes of natives
(e.g., Betts 1998; Hoxby 1998; Liu 2000; Neymotin 2009). Since many immigrants
are LEP when they first enter school in the U.S., these studies are relevant. However,
it should be noted that only half of LEP students enrolled in U.S. public schools are
foreign-born, and many immigrant students are not LEP, thus the impact of LEP
students may well differ from the impact of immigrant students.
III. Empirical Strategy
A. Conceptual Framework
The direction of the impact of BE programs (compared to ESL programs) on
academic achievement is theoretically ambiguous for both LEP and non-LEP students.
LEP students are the students eligible to participate in BE and ESL. BE and ESL are
the two most common programs offered by schools to address the learning needs LEP
students, and each has advantages and disadvantages. For example, native language
instruction might delay English acquisition, but it might also enable LEP students to
better keep up in math and other academic subjects while they are learning English.
On the other hand, an English-only approach like ESL might improve learning in both
English and other subjects by reallocating time that would have been spent on teaching
LEP students the ability to read and write in their native language.
Non-LEP students do not participate in BE or ESL themselves, but they may
experience spillover effects from these programs. The nature of these spillover effects

9
likely differs by program. One reason is that the two programs result in dramatically
different distributions of LEP students across classes within a grade. Mainstream
classes have fewer LEP students when BE is offered because LEP students in BE tend
to be grouped together to form a separate class while LEP students in ESL are in the
same classes as non-LEP students (with ESL instruction provided on a pull-out basis,
or with an in-class ESL aide). Exposure to LEP students in class could impact non-
LEP students’ academic performance through a number of mechanisms. First, teachers
with LEP students in their classes may need to provide extra assistance to these
students, which would take time away from other students. Second, LEP students may
be more prone to disruption due to frustration from difficulties understanding the
material taught in English. Third, to the extent that achievement among LEP students
is lower than the non-LEP students, there could be an achievement peer effect which
could worsen non-LEP outcomes. For example, the content may be taught at a lower
level to reach the weaker students. Nonetheless, there are also reasons to think that
exposure to LEP students may be helpful. For example, LEP students may be more
advanced along some dimensions (e.g., certain subjects, or in terms of some non-
cognitive skills) that might generate positive peer effects.
Besides changes in class composition, another way BE programs could
generate differential spillover effects to non-LEP students is through the school
budget. Whether BE or ESL is more costly for the school district depends on a number
of factors, including the number of LEP students and their distribution across
languages and grades. When the school district has few LEP students in the same
language and grade, BE programs tend to be more expensive than ESL programs.
Since a BE teacher is typically attached to a specific class on a full-time basis (serving
LEP students of a common home language and grade), there is little possibility for
schools to spread the cost of a BE teacher over LEP students of different home
languages and grades as they could with an ESL teacher. Thus, to pay for BE, schools
may have to reallocate resources, and this may impact non-LEP students’ academic
performance. While a simple story of BE programs crowding out programs for non-
10
LEP students might suggest negative effects, in fact schools may offset the higher
costs with additional revenues, so these resource effects are ambiguous in direction.
B. Identification Strategy
Given the foregoing considerations, how bilingual education program
provision affects student academic achievement is ultimately an empirical question.
Thus we turn to our estimation strategy. We wish to estimate the effect of exposure to
bilingual education programs on achievement, which might be approximated as:
idcgidcgdcidcg XBEy επβα +++=
(1)
for student i in school district d who is a member of first grade cohort c and observed
at grade g. y is a student academic achievement measure, BE is an indicator for the
student’s school district providing a bilingual education program, X is a set of student,
school and district characteristics, and ε is the error term. The parameter of interest is
β, which is the effect of student exposure to bilingual education. Note that the measure
of exposure expressed in Equation 1 is not at the individual level, but at the district-
cohort level. This is natural when we use data on non-LEP students, who are never
participants in BE programs but nevertheless could experience spillover effects from
them if their school district offers it to their classmates. LEP students, on the other
hand, are eligible to participate in BE programs if their school district offers it to their
cohort but may choose not to take it up; thus, by using this district-cohort level
measure of BE availability, we are capturing an intention-to-treat effect for LEP
students rather than the effect of participation in BE. Focusing on potential exposure
to BE, rather than actual take-up of BE, circumvents issues concerning non-random
selection of individuals into BE programs. Moreover, the intention-to-treat effect is of
direct interest for policy making, as school districts can only control whether to offer
BE—students cannot be forced to participate in BE.
Nevertheless, even the more aggregate measure of BE exposure used in
Equation 1 might be endogenous. It is not random which school districts offer

11
bilingual education; for example, they may be the ones with more LEP students, more
growth in LEP students, more wealth, LEP students with especially low English
proficiency, etc. Thus, estimates of β using ordinary least squares (OLS) are unlikely
to provide the causal effect of student exposure to a bilingual program, and a priori we
cannot even sign the direction of the bias. To address this endogeneity problem, we
use a regression-discontinuity approach that exploits a policy rule the provision of BE
in Texas. The State of Texas mandates provision of bilingual education in a given
language and elementary grade by a school district when the district-wide population
of LEP students in that language and elementary grade is greater than or equal to 20.8
Essentially, our empirical strategy is to compare student outcomes in districts
that have slightly less than 20 LEP students in a language-grade to those with slightly
more. In practice, we focus only on the policy rule vis-à-vis Spanish LEP students,
who represent about 90 percent of Texas’ total LEP enrollment, because Spanish is the
only language group for which there is enough variation across districts to implement
our empirical strategy.9 It is unlikely that districts with 19 Spanish LEP students differ
that much from districts with 20 Spanish LEP students, but due to the policy rule, the
latter districts must offer bilingual education, and we can take the difference in
outcomes between the districts with 20 and districts with 19 to learn about the effect of
district BE provision. This example is meant to be illustrative only, as limiting our
analysis to only those districts with exactly 19 or 20 Spanish LEP students would lead
to very imprecise estimates. In implementing our empirical strategy therefore, we
expand the neighborhood around the cutoff. With the wider bandwidth, it becomes
possible that there exists a relationship between the number of Spanish LEP students
and the outcome that is not solely due to the policy rule, so it is necessary to control
8 This rule is part of Texas Administrative Code, Title 19, Part 2, Chapter 89, Subchapter BB, Rule §89.1205 (Commissioner’s Rules Concerning State Plan for Educating Limited English Proficient Students). 9 In contrast, LEP students with other home languages are both fewer and more concentrated, leaving too few observations of districts near the 20-student cutoff for a particular language and grade. The Spanish share of LEP students in 2001-02 is 77 percent in the U.S. (Zehler et al. 2003); given Texas’ proximity to Mexico and Central America, it is not surprising that its Spanish share is somewhat higher.

12
for the number of Spanish LEP students. We therefore estimate the following equation
to study the impact of the policy rule on district BE provision:
idcgidcgdcdcdc XCountLEPfAboveBE 11111 )_(20 επδα ++++= (2)
for student i in school district d who is a member of first grade cohort c and observed
at grade g. BE is an indicator for the student’s school district offering a bilingual
education program, LEP_Count is the district-wide Spanish LEP student count for
student i’s first grade cohort, Above20 is an indicator for LEP_Count being greater
than or equal to 20, f(LEP_Count) is a function of LEP count10, and X1 is a set of
student, school and district characteristics.
Below, we find that 1δ is positive and statistically significant, indicating that
the policy rule induced some districts that otherwise would not have provided BE to
provide BE. We proceed by instrumenting the potentially endogenous regressor in
Equation 1, BE, with Above20 (where X in Equation 1 is comprised of X1 and
f(LEP_Count)) in order to obtain an estimate of β with a causal interpretation. This
strategy is often referred to as a fuzzy regression discontinuity design (Imbens and
Lemieux 2008; Lee and Lemieux 2010). The first-stage equation associated with the
2SLS estimation of Equation 1 is given by Equation 2.
Below we also report the results of estimating the reduced-form equation,
.)_(20 1 idcgidcgdcdcidcg RFRFRFRF XCountLEPfAbovey επδα ++++= (3)
The reduced-form effect of being just above the 20-student cutoff, RFδ , indicates the
effect of increasing the likelihood of a school district offering BE on achievement. It is
desirable to rescale this reduced-form effect to obtain the interpretation of the effect of
school district provision of BE, which is what is given by the 2SLS estimate of β.
The fuzzy RD strategy identifies the local average treatment effect (LATE) for
school districts close to the 20-student cutoff. These school districts tend to be smaller,
be less urban and (of course) have fewer LEP students. Thus, the effect of district BE
provision on academic achievement estimated in this study may not reflect the average 10 Specifically, we use a linear function that allows for different slopes above and below the cutoff.
13
treatment effect or generalize to larger districts. However, since few studies exist that
convincingly identify the causal effects of educational programs for LEP students (and
none of these consider spillover effects to non-LEP students), our new evidence is of
interest even if it is estimating a LATE. Additionally, we believe this LATE is per se
interesting because a majority of school districts in the U.S. with any LEP students
have relatively small LEP enrollments. In 2001-02, about 43 percent of school districts
in the U.S. had at least one LEP student (Zehler et al. 2003). 2.6 percent of school
districts with LEP students enrolled 5000 or more LEP students, collectively
accounting for 54 percent of the total number of LEP students in the U.S., thus the vast
majority of school districts with LEPs are contending with some, but not many, LEP
students. As immigrants increasingly settle outside of traditional immigrant-receiving
places, the number of these low-LEP-enrollment school districts will continue to grow.
IV. Data
To implement our RD strategy, we use publicly-available data on the
standardized test scores and demographic characteristics of students enrolled in Texas
public elementary schools.11 To maintain data confidentiality, the Texas Education
Agency provided us with grouped student data rather than individual-level student
data. In particular, we obtained mean data at the school-grade-year level for three
mutually exclusive categories of students: (1) students who are not classified as LEP
and do not have Spanish as their home language (below, we refer to them as the “non-
LEP, non-Spanish home language” students, and we refer to the dataset containing
these students’ test scores as the “non-LEP, non-Spanish home language” sample); (2)
students who have Spanish as their home language (analogously, the “Spanish home
language” students and sample)12; and (3) remaining students. Below, we estimate
Equations 1-3 separately for the first two categories of students, as well as for all
11 We obtained the test score data through a public information request to the Texas Education Agency. 12 The “Spanish home language” designation is based on a home language survey that parents fill out when their child first enrolls in a district. This is not the same as Hispanic status, as there are many Hispanics who do not use Spanish at home.
14
students combined, where i in these equations now indexes school rather than the
individual student.13 Note that the policy variation we are exploiting is at the district-
grade-year level, thus our data are at a less aggregate level than the policy.14
The “non-LEP, non-Spanish home language” category is comprised of students
who would never have been in educational programs for Spanish LEP students, so
effects of district BE provision estimated using data on these students only reflect
spillover effects of the Spanish LEP programs. The “Spanish home language”
category is comprised of students who are currently LEP, formerly LEP (but since
mainstreamed) and never LEP, so in theory, effects estimated using these students
reflect both the effect of Spanish BE programs on the individuals who were eligible to
participate in Spanish LEP programs (i.e., the intended beneficiaries) as well as
spillover effects. In practice though, 89 percent of “Spanish home language” students
are classified as LEP in first grade in our analysis sample,15 so results using data on
these students reflect the effects of BE provision on the intended beneficiaries. Finally,
the results using data on all students reflect the net effect of the Spanish BE programs.
To assess whether the policy rule is binding, we must examine whether the
probability of a district providing BE increases at the 20-student cutoff. In our
empirical work below, we use the counts of Spanish LEP students from first grade as
the relevant counts for determining district BE provision. Two points are worth noting.
First, in our data, the Spanish LEP student count for a particular school-year-grade cell
is masked if the number is between 1 and 4. In our main analysis, we assigned the
average value of 2.5 to those school-grade-year cells with masked values.16 Second,
13 The average across all students for a given school-grade-year is the weighted average across the three categories (weighted by the number of students in each category). For the school districts near the 20-Spanish-LEP-student cutoff, the third category (LEP students with a language other than Spanish as the home language) is very small—accounting for less than five percent of school enrollment—thus we do not consider this student category separately. 14 Although we described the policy variation as occurring at the level of district-cohort in Section III.B, this statement is also accurate because year and grade data are used to construct cohort data. 15 In the full sample, without the restriction to small districts near the 20-Spanish-LEP-student cutoff, 78 percent of Spanish home language students are classified as LEP in first grade. 16 Our results are robust to alternative ways of treating the masked values, as we show in Section V.G.

15
LEP status is temporary, with LEP students exiting LEP status once they have learned
English.17 Consider a district with 20 Spanish LEP students in a first grade class and
hence offers bilingual education. By the time these students reach third grade, there
will likely be fewer than 20 Spanish LEP students in the cohort due to mainstreaming
of initially LEP students who become proficient in English (and therefore, exit LEP
status). Nonetheless, even though the LEP count falls, the district would most likely
still provide bilingual education.18 Given that in practice, if a given first grade cohort
qualifies for BE, the district commits to providing it for several years, it is appropriate
to use the district Spanish LEP count in the first grade class for a student’s cohort
rather than concurrent LEP counts.
Because the policy rule specifies a 20-student cutoff, we restrict the data to
districts near this cutoff. Our main analysis uses observations in districts with 8 to 39
Spanish LEP students in a given first-grade cohort.19 We further restrict the data to
smaller districts, which we define as districts with total first-grade enrollment fewer
than 200 in the 2004-05 school year, in order to form a sample of districts for which
the policy rule is likely to bind.20 We also do not weigh our regressions by enrollment,
as our variation is at the district-grade-year level. Figure 1 maps the districts satisfying
our sample criteria using the average Spanish LEP counts in the district during the
sample period, and indicates that the districts in our sample are located all over Texas,
and that districts above the cutoff are often located next to districts below the cutoff.
17 Due to mainstreaming, LEP status drops off considerably as students age. Using data on LEP counts by grade and district acquired from the Texas Education Agency, we observe that LEP share of enrollment in Texas fall from 11 percent in kindergarten and 1st grade to only 4 percent by 8th grade. 18 Texas supports a transitional BE program where LEP students are moved to mainstream classes once they acquire sufficient English skills. Typically students stay in BE several years before attaining the English skills to be mainstreamed, and so the district typically commits to providing BE to this cohort for this duration. 19 We show in Section V.G that our results are robust to using other bandwidth selections. 20 Larger school districts have more resources, and tend to offer bilingual education services even below the cutoff, thus they are less responsive to the policy. Regarding the use of 2004-05 enrollments to define district size, in fact we have used first grade enrollment totals from other years to define the set of districts to be included, and our empirical results are unchanged, as we show in Section V.G. We do not impose the 200 cap on every year for sample inclusion because changes in school enrollment can be endogenous to student achievement.
16
This provides some reassurance that on the basis of geographic location, the districts
just above and just below the cutoff are comparable. We provide more formal analysis
of the comparability of districts above and below the cutoff in Section V.B.
Our student outcome measures are standardized test performance for 2002-03
through 2009-10, aggregated to the school-grade-year-student category level. The
Texas Assessment of Knowledge and Skills (TAKS) math and reading tests were
introduced in 2002-03 (replacing the Texas Assessment of Academic Skills), and to
avoid combining student achievement measures based on different tests, we do not use
earlier test score data. Students are tested beginning third grade, and our policy rule
concerns BE provision in elementary schools, thus we have three grades with test
score outcomes: third, fourth and fifth. We link test takers to their first grade cohort’s
district-wide number of Spanish LEP students and district-wide provision of bilingual
education, so we are using demographic data for 1998-99 to 2007-08.21
We use three measures of test performance for each subject, with the intention
of capturing effects at different parts of the student academic achievement distribution.
The mean standardized scale score, which is the average test score normalized to
standard deviation units using the state-wide mean and standard deviation, captures
movements in test scores for all parts of the distribution. The passing rate, which is the
percent of students that met the minimum passing standard set by the State Board of
Education, captures movements in test scores for students at the margin of
passing/failing. The commended rate, which is the percent of students that met a much
higher passing standard (on average, only the top third of passers satisfy this), captures
movements in test scores for higher-achieving students. Table 1 provides the means
and standard deviations of the variables for the “non-LEP, non-Spanish home
language” sample overall and separately for those above and below the cutoff.22
21 Thus, for the third, fourth and fifth graders observed at year t, we assign the first grade district-wide Spanish LEP count from year t-2, t-3 and t-4, respectively. For example, for fifth grade test takers in 2002-03, first grade cohort characteristics are taken from 1998-99. 22 Summary statistics are about the same for variables other than the achievement variables for the other two datasets we use below, the “Spanish home language” sample and the “all students” sample. The

17
V. Results
A. Ordinary Least Square Estimates of the Effect of Bilingual Education
In Table 2, we present the results from estimating Equation 1 using OLS using
the same three samples that we use below to implement our RD strategy.23 The OLS
coefficients for district BE provision are not significantly different from zero using the
“non-LEP, non-Spanish home language” sample (Panel A), which if interpreted
causally would indicate no spillover effects for BE programs. In Panel B, the OLS
coefficients are negative, and sometimes significant at the 10 percent level, which if
interpreted causally would indicate harmful effects of BE for Spanish home language
students on net. The estimated effect for all students is shown in Panel C; because
about three quarters of all students are in the “non-LEP, non-Spanish home language”
category, Panel C estimates are close to those reported in Panel A.
These estimated coefficients for district provision of BE are unlikely to have a
causal interpretation, however, for reasons discussed above. We present the OLS
estimates to provide a counterpoint to the instrumental variables estimates of the effect
of district provision of BE discussed below, which we find to be more positive—
positive and significant for “non-LEP, non-Spanish home language” students and all
students, and not different from zero (but typically positive) for “Spanish home
language” students. Comparing the IV estimates to the OLS estimates reveals that the
OLS estimates in Table 2 tend to be downward biased. That is, districts that are
observed to provide BE are worse in unmeasured/unobserved dimensions that
positively correlate with student test performance.
B. Tests of the Validity of the Regression Discontinuity Design
Because BE programs tend to be more expensive than ESL programs, and
especially because a school district mandated by the Texas policy rule to provide BE
means of the achievement variables are lower for the “Spanish home language” students. These additional tables are available from the authors. 23 Results based on the full sample, without the restriction to small districts near the 20-Spanish-LEP-student cutoff, are similar to these results based on the analysis samples.

18
also tends to provide ESL (because some parents do not wish to enroll their children in
BE even when it is available), there is a financial incentive for school districts to
manipulate their enrollment or LEP classifications to avoid having to provide BE. If
school districts have a great deal of control over the number of students categorized as
LEP, then students on one side of the 20-student cutoff could be systematically
different from those on the other side, invalidating the RD design.
In order to test this, we first provide a visual check by plotting in Figure 2 the
distribution of district first grade Spanish LEP students. A discontinuity in the density
of school districts around the 20-student cutoff would suggest manipulation of our
running variable (McCrary 2008). As the figure shows, there are no irregular heaps in
the density of district first grade LEP counts.24 In particular, the number of districts
declines smoothly as the number of Spanish LEP students increases. Therefore it does
not appear that districts manipulate LEP student numbers to avoid providing BE.
Next, we check whether there are differences in observable characteristics
across the 20-student cutoff. Figure 3 graphs the mean covariate by number of Spanish
LEP students in the first grade cohort for all students in the same school-grade-year
cells as the students whose test scores we analyze below. These covariates include
gender, race, economic disadvantage (free or reduced lunch), enrollment in gifted and
special education programs, and total grade enrollment. For all covariates, the figures
show smooth distributions around the cutoff point. More formally, we estimate
Equation 3 using each of these observable characteristics as the dependent variable.
These results are reported in Panel A of Table 3, and confirm the visual evidence in
Figure 3—there are no changes in covariates at the cutoff that are statistically
significant at the 5 percent level and only one at the 10 percent level. In order to
combine these multiple tests into a single test statistic, we also estimate a Seemingly
Unrelated Regression and perform a Chi-squared test for the hypothesis that the
24 More formally, we test whether there is a significant change in the density of Spanish LEP students at the 20-student cutoff and do not find any. The coefficient on Above20 is -0.06 (s.e. 0.15).
19
coefficient of Above20 are jointly equal to zero across these regressions. The p-value
from this test, reported below the regression estimates, is 0.17.
Since we estimate effects on different categories of students below, we conduct
similar tests at the level of school-grade-year-student category, though it should be
noted that fewer variables are available. Panels B and C of Table 3 show the results for
“non-LEP, non-Spanish home language” students and “Spanish home language”
students, respectively. There is no evidence of discontinuities in share of these
students who are female, economically disadvantaged or in gifted programs.
Overall, these results indicate that there are no discontinuities in the underlying
characteristics of the students. This supports the interpretation that observed
discontinuities at the 20-student cutoff are only due to the policy rule governing BE
provision, and not to differential student composition above and below the cutoff.
C. The Discontinuity in District Provision of Bilingual Education
If the Texas policy rule governing BE provision is binding, then we should
observe a discontinuity in district BE provision at the 20-student cutoff, with districts
above the cutoff having higher rates of BE provision. In order to examine this, in
Figure 4, we plot the average share of schools that are in districts providing BE by the
number of Spanish LEP students in the first grade cohort. Visually, there is a jump up
at the 20-student cutoff. It is worth noting that there is not perfect adherence to the
policy rule (had this been the case, 100 percent of districts would provide BE above
the cutoff). One reason is that participation in BE requires parental consent, and many
parents choose ESL for their child even when BE is available. What is measured in the
data is whether the district actually does provide BE; we cannot observe when a
district offers BE but there is zero take-up. A second reason is that it is difficult to
recruit certified bilingual education teachers, and school districts are allowed to delay
providing BE if they are unable to find a qualified BE teacher.
Next, to more formally assess whether this difference in BE provision below
and above is statistically significant, we estimate Equation 2. These first-stage results

20
are reported in the first row of Panel B in Table 4 (for the “non-LEP, non-Spanish
home language” sample), Table 5 (for the Spanish home language” sample) and Table
6 (for the “all students” sample). The coefficient for being above the cutoff is always
positive and significant across the different samples. For the samples that pool third to
fifth graders, we find that districts with more than 20 Spanish LEP students in the first
grade cohort are about 28 percentage points more likely to offer bilingual education
than districts below the cutoff. This is a sizable effect—a three-fold increase relative
to the mean for district BE provision among the school-grade-year observations below
the cutoff (which is 9 percent). Clearly, the policy rule generates sizable variation in
district provision of bilingual education for a particular first grade cohort.
D. Effect of Bilingual Education on “Non-LEP, Non-Spanish Home Language”
Students
Figure 5 provides visual evidence on the reduced-form relationship between
district Spanish LEP count in the first grade cohort and “non-LEP, non-Spanish home
language” student achievement for students in grades 3-5. The top three graphs show
effects on math achievement, and the bottom three graphs show effects on reading
achievement. For all outcomes we observe higher achievement among students in
schools in districts above the cutoff, with especially pronounced increases for mean
standardized test scores and mean share of students with commended performance.
Table 4 presents results from a formal evaluation of the achievement outcomes
around the cutoff, as described in Section III.B. Each cell of Table 4 represents a
coefficient from a separate regression. In Columns 1 to 4, we provide results for math
test outcomes from the pooled sample (Column 1), as well as separately for each grade
(Columns 2 to 4). Columns 5 to 8 follow the same structure for reading test outcomes.
Standard errors are clustered by district here, as in all the other regressions reported.
In Panel A, we report results from estimating the reduced-form relationship
between student outcomes and the running variable, i.e. the coefficient estimates of
RFδ in Equation 3. The coefficient in the first row of Column 1 indicates that non-LEP

21
students in schools in districts with at least 20 Spanish LEP students in the first grade
cohort have a mean math standardized test score that is 0.059 standard deviations
higher than non-LEP students in schools in districts with less than 20 Spanish LEP
students in the first grade cohort. Similarly, the coefficient in the second (third) row of
column (1) indicates that the math passing (commended) rate of non-LEP students is
0.984 (2.215) percentage points higher in schools in districts located to the right of the
cutoff. The results based on separate regressions by grade also confirm positive effects
on math test performance for non-LEP students in districts to the right of the cutoff,
especially for standardized test score and commended rate. An examination of reading
outcomes, provided in columns 5 to 8 of Panel A, also points to improved educational
performance for non-LEP students in districts to the right of the cutoff, most notably
for mean standardized reading test score. These results are in line with the graphical
evidence presented above.
In Panel B of Table 3, we present results from the estimation of the first stage
equation (Equation 2), followed by the results from our structural model (Equation 1)
using Above20 to instrument for district provision of bilingual education. As discussed
in Section V.C, the results reported in the first row of panel B indicate that the first
stage relationship is strong and robust across all samples. The effect of bilingual
education on non-LEP math outcomes are presented in rows 2 to 4 and columns 1 to 4
of panel B. The estimated effects are positive and generally statistically significant for
mean math test score and mean math commended rate. For example, our estimates
suggest that district BE provision causes an increase of about 0.213 standard
deviations in the mean math achievement of non-LEP students (panel B, row 2,
column 1). Similarly, the point estimate provided in row 4 and column 1 of panel B
indicates that district BE provision increases the math commended rate by 7.987
percentage points—a 30 percent increase when compared to the mean commended
rate among schools in districts below the cutoff. The point estimate on math passing
rate from the pooled sample is also large, and points to a 5 percent increase relative to
the mean among schools in districts below the cutoff, but it is imprecisely estimated.

22
It is interesting that the impact on the commended rate is larger than the impact
on the passing rate. The positive point estimates for both suggest that both students at
the margin of failing/passing the exam, and at the margin of good/very good
performance, are contributing to the measured increase in average math test scores due
to district BE provision. Considering that the passing rate impacts are smaller in
magnitude and typically not significant, it appears that the positive impact on math test
score is largely driven by an improvement in the math test performance of higher-
achieving students. We return to this result in Section V.H when we consider potential
mechanisms for these spillover effects.
The impact of BE programs on non-LEP students’ reading outcomes are
reported in columns 5 to 8 of Panel B. We again find that the estimated effects are
mostly positive and economically large but they are generally smaller than the effects
on math and have less statistical significance. For example, our results suggest that
providing bilingual education causes an increase of about 0.17 standard deviations in
the mean standardized reading achievement (panel B, row 2, column 5), and 5
percentage points in reading passing (panel B, row 3, column 5) and commended rates
(panel B, row 4, column 5) of non-LEP non-Spanish home language students. It is
worth noting that even though these 2SLS estimates are somewhat imprecise, and we
cannot reject the null hypothesis that they are zero at conventional levels, we are able
to reject relatively small negative effects on non-LEP students. The 95 percent
confidence intervals for the for the pooled effect on standardized reading score is [-
0.01, 0.35], which means we can rule out district BE provision reducing standardized
reading score by more than a hundredth of a standard deviation at the 5 percent
significance level. For the reading passing rate, the 95 percent confidence interval for
the pooled effect [-1.57, 11.59], which means we can rule out negative effects over
1.57 percentage points at the 5 percent significance level; 1.57 is less than 2 percent of
the mean passing rate (of 83 percent) among the sample below the cutoff. Similarly,
the 95 percent confidence intervals for the reading commended rate is [-1.62, 10.95],

23
which means we can rule out district BE provision reducing reading commended rates
by more than 1.62 percentage points at the 5 percent significance level.
Overall, the results presented in this section point to spillover effects of
educational programs for LEP students on their non-LEP peers. Specifically, when we
examine non-LEP, non-Spanish home language students—a group that represents the
majority of students in the schools in our sample and that would not have participated
in the LEP programs themselves—we find significant positive effects on academic
performance. The positive effects of BE relative to ESL tend to be economically and
statistically significant for math test performance. For reading test performance, the
point estimates are positive though not significant at conventional levels, but we can
rule out small negative effects with 95 percent confidence.
E. Effect of Bilingual Education on “Spanish Home Language” Students
Figure 6 plots the achievement outcomes for students who have Spanish as
their home language in grades 3 to 5 as a function of the district-wide number of
Spanish LEP students in the first grade cohort. The graphs show weak achievement
gains to the right of the cutoff, though the magnitude seems much smaller compared to
that observed for non-LEP students, especially for the reading outcomes depicted in
the bottom panel.
Table 5 presents the estimation results. The table is structured in the same way
as Table 4. The reduced-form estimates, reported in Panel A, are generally small and
always statistically insignificant. This confirms the visual evidence from Figure 6 of
little change at the cutoff.
The results presented in rows 2 to 4 of Panel B provide causal effects of district
BE provision on the standardized test performance of Spanish home language
students. The 2SLS estimates on mean standardized achievement test scores from the
pooled sample suggest that providing bilingual education is associated with a
statistically insignificant increase of 0.107 standard deviations for math scores and
0.040 standard deviations for reading scores. However, we are able to reject modestly
24
sized negative effects on test scores. The 95 percent confidence intervals for the
standardized math and reading score among the pooled samples are [-0.20, 0.41] and
[-0.27, 0.35], respectively. Thus, we can reject at the 5 percent significance level that
district BE provision lowers mean math and reading scores by more than 0.2 and 0.3
standard deviations, respectively.
Our results also indicate statistically insignificant and economically small
effects of BE provision on test passing rates. For example, we find in the pooled
sample that BE programs increase (decrease) the math (reading) passing rate of
Spanish home language students by 1.652 (0.509) percentage points (row 3, columns 1
and 5, Panel B) or 2 percent (< 1 percent) of the mean passing rate among the sample
below the cutoff. While the results for the commended rate translate into economically
large effects, the confidence intervals are also very large and thus do not allow us to
rule out economically large negative effects.
As noted before, the Spanish home language students are comprised of
currently LEP, previously LEP and never LEP students. Hence, our results do not
directly provide estimates of the effect of district BE provision on Spanish home
language students ever classified as LEP (and therefore potential participants in BE
and ESL programs).25 Instead, they capture both the effect of district BE provision on
the intended beneficiaries as well as spillover effects. Nevertheless, these results are
informative because an overwhelming majority of students with Spanish as a home
language are classified as LEP: in our sample, 89 percent of Spanish home language
students are classified as LEP in first grade. Thus, these results roughly correspond to
the intention-to-treat effect of bilingual education programs on intended
beneficiaries.26 It is worth noting that these are not estimates of the effect of actually
25 We are unable to directly estimate this because we do not have separate test score data on students who are currently non-LEP but had previously been classified as LEP. While we do have data on Spanish home language students by current LEP status, we have chosen to combine them in order to avoid difficulties in interpreting results due to endogenous mainstreaming of students. 26 Of course literally it is not, as it is a weighted average of the effect on ever-LEPs (the intended beneficiaries, who receive 89% weight) and the never-LEPs (who receive 11% weight). We can compute the effect on ever-LEPs under varying assumptions about the size of the effect for never-LEPs,

25
participating in BE; as we discussed above, whether a student takes up on BE,
conditional on being offered BE, is endogenous, and we have no way to address this
sort of selection into program participation so we cannot uncover the effect of BE on
the BE participants themselves.27 However, as we also discussed above, the intention-
to-treat effect is directly relevant for policy making.
Overall, these results indicate that while district BE provision does not
significantly benefit Spanish home language students, it does not harm them either, at
least in terms of test score achievements. Since the Spanish home language student
sample is primarily composed of ever-LEP students, our results also indicate that the
impact of bilingual education provision on the intended beneficiaries is generally
positive though insignificant. This finding is consistent with the Slavin et al. (2010),
Matsudaira (2005) and Angrist, Chin and Godoy (2008) studies discussed in Section
II.B—LEP students’ educational outcomes are not significantly different in bilingual
programs compared to English-intensive programs.
F. The Net Effect of Bilingual Education on Students
Table 6 provides the results of estimating Equations 1-3 using the average test
performance of all students combined. Arguably these net effects of district BE
provision are the most relevant ones for policy making, as they weigh the test score
gains and losses across all students equally. Even if in practice policy makers do not
assign equal weights to each student—for example, to comply with U.S. civil rights
laws, they might care more about the LEP students’ educational progress—these
estimates provide a benchmark to gauge the implicit efficiency gains or losses
associated with a particular LEP program.
The reduced-form effects are shown in Panel A, and the first-stage and 2SLS
with the result that the effect for ever-LEPs will be positive except when the effect on never-LEPs is positive and incredibly large (e.g., one whole standard deviation for math test scores). 27 If there were no spillover effects of BE, then it might be possible to obtain the effect of treatment on the treated by scaling the intention-to-treat effect by the program take-up rate. This assumption seems difficult to justify, however, given that we do find evidence of spillover effects for the “non-LEP, non-Spanish home language” students.

26
estimates are shown in Panel B. Considering that over three quarters of the students in
our analysis samples are in the “non-LEP, non-Spanish home language” category, not
surprisingly, the results in Table 6 consistently point to positive effects of district BE
provision on student achievement, though the 2SLS estimates are significant only for
mean standardized math achievement score and mean math commended rate. This
positive net impact indicates that on average, the test score gains due to district BE
provision exceed the test score losses experienced by students in a given cohort and
school. That is, for the districts hovering around the 20-Spanish-LEP-student cutoff
used in our analysis, provision of bilingual education actually led to net gains in
student achievement without hurting either “Spanish home language” students as a
group, or “non-LEP, non-Spanish home language” students as a group.
G. Sensitivity Analysis
In Table 7, we examine the robustness of our reduced form results to several
potential concerns. Since our most novel contribution is investigating spillover effects
of educational programs for LEP students, we present results using the “non-LEP non-
Spanish home language” sample.28 Each cell shows the 2SLS estimate of the effect of
district BE provision from a separate regression based on the pooled sample of
students in 3rd to 5th grades. Columns 1 to 3 provide results for math, and Columns 4-6
provide the results for reading. The first row reproduces the baseline 2SLS estimates
for reference (see Panel B, Columns 1 and 5 of Table 4).
In rows 2 and 3 of Table 7, we check the sensitivity of the estimates to the way
we have treated masked values in the data. As mentioned before, in our data, Spanish
LEP student counts for a school-grade-year are masked if the number is between 1 and
4. This impacts our ability to measure the running variable, number of Spanish LEP
students in the first grade cohort in the district, precisely. Our main analysis assigned
28 We also perform the same robustness checks for the “Spanish home language” sample and the “all students” sample, and find that the results reported in Sections V.E and V.F stand. These additional tables are available from the authors.

27
the average value of 2.5 students to those school-grade-year cells with masked value.
In Row 2, we assign the minimum value of 1 student, and in Row 3, we assign the
maximum value of 4 students, and observe that the 2SLS estimates of the effect of
district BE provision are unchanged versus the baseline model.
Our baseline model assumes that the underlying relationship between student
achievement and district-wide Spanish LEP student count in the first grade cohort is
piecewise linear (we control for a linear function of district-wide Spanish LEP student
count that allows for different slopes above and below the cutoff). To the extent that
this functional form is misspecified, the RD design leads to a biased estimate of the
treatment effect. Our choice of a piecewise linear function was guided by the graphs of
academic achievement by Spanish LEP count (Figure 5 for “non-LEP, non-Spanish
home language” students), which did not indicate nonlinearities in the underlying
relationship. In rows 4 and 5 of Table 7, we test the sensitivity of our results to the
assumed functional form of the running variable by choosing polynomials of different
degrees. In row 4, when we use a quadratic smoother (i.e., we control for a quadratic
function of Spanish LEP count that allows for different slopes above and below the
cutoff), the point estimates still suggest a positive impact on student achievement.
However, none of the coefficients are statistically significant because the standard
errors are on average 1.6 times of those from the baseline model. The coefficient in
row 4, column 1 indicates that district BE provision raises non-LEP, non-Spanish
home language students’ mean math achievement by 0.118 standard deviations; this
coefficient is not significantly different from zero, though it can also be noted that its
95 percent confidence interval includes the 2SLS estimated effect of 0.213 found in
the baseline model. When a cubic smoother is used (row 5), again none of the
estimated effects are significant, though the point estimate indicates an effect of 0.117
standard deviations on mean math achievement.
In rows 6 and 7, we check the sensitivity of our estimates to the chosen
bandwidth. Our main analysis was restricted to school-grade-year observations in
districts with between 8 and 39 Spanish LEP students in the first grade cohort. In row
28
5, we restrict to observations in districts within a tighter range of the 20-Spanish-LEP-
student cutoff: 10 to 29. The sample size is reduced, resulting in larger standard errors,
however the results are qualitatively similar to the baseline model. In row 6, we
expand the bandwidth to schools in districts with 8 to 49 Spanish LEP students in the
first grade cohort and the results are again similar to the baseline model.
Next, we check the sensitivity of our estimates to the choice of school year for
defining small school district. Our baseline estimates rely on observations from school
districts with fewer than 200 students in 2004-05. We show that the results are robust
when we change the “baseline” year and restrict the sample to school districts with
fewer than 200 students in 2000-2001 (row 8) or in 2008-2009 (row 9).
In the last row of Table 7, we report estimates of the effects when we restrict
the baseline sample to observations in school districts that had a single elementary
school from 1998-99 to 2009-10. These schools are of interest to analyze for two
reasons. First, they might be especially responsive to the policy rule because not only
are they small in terms of student enrollment (by construction of our analysis samples,
they have fewer than 200 students in the first grade cohort), also they have less ability
to shift resources. Besides within school shifts, only shifts across school levels are
possible (e.g., between elementary and secondary schools), but such shifts are likely
less feasible than shifts across schools within the same level. Second, it is clearer what
is happening in these single elementary school districts: district provision of BE
means school provision of BE in that grade, and since there is no scope for students
changing schools within the same district then unambiguously non-LEP students’
exposure to LEP classmates above the cutoff decreases.29 61 percent of the
observations in the full analysis sample are from single elementary school districts.
Using this subsample, we find that the 2SLS effects are larger in magnitude and more
29 For multiple elementary school districts, a non-LEP student’s exposure to LEP classmates can increase or decrease above the cutoff depending on which school offers the BE program, and the extent to which students change schools on the basis of BE program location.
29
statistically significant relative to the baseline results.30 Strikingly, significant positive
impacts of district BE provision are found for both math and reading; in the baseline
results, though the 2SLS estimates of impact on reading performance were positive,
typically they were not significant.
H. Potential Mechanisms
A priori, one may expect changes in school resource allocation to be an
important mechanism for the effects of district bilingual education provision because
BE programs cost more and state funding does not cover the incremental costs of BE
in Texas. In this section, we estimate the effects of district BE provision on school
resource allocations to see if there is empirical support for this mechanism. To
perform this analysis, we start with the “non-LEP, non-Spanish home language”
sample and merge in school resources data. Two caveats are in order. First, the
resource variables are measured at the level of the school while the policy variation is
at the level school-grade-year.31 Therefore, the resources analysis is rather crude, and
misses within school, cross-grade shifts in resources. Second, the resources data are
available only beginning in 2004-05. Thus we must restrict our analysis to the school-
grade-year observations from 2006-07 and later.32
The results of estimating Equation 3 using the resource variables as the
dependent variables are displayed in Table 8. Panel A presents results using all
observations in the “non-LEP, non-Spanish home language” with non-missing
30The larger 2SLS estimates of district BE provision on academic achievement arise not from a lower effect on compliance rate (we find that the first-stage coefficients using the subsample of single-school districts are very similar in magnitude to those reported in Table 4), but from higher reduced-form effects. 31 It would have been ideal to have these data at the school-grade-year level also, but such data are not available. We obtain the school-grade-year level dataset for analyzing the impact of district BE provision on school resources by merging in the resource data by school and first grade cohort. For example, an observation for third grade at given school in year t is assigned the resource data for that school from year t-2 (when these third graders were in first grade). Hence observations with the same school and first grade cohort have the same resource variables, though their covariates differ. 32 The third graders in 2006-07 were first graders in 2004-05, the first year for which we have resource data. On the other hand, the last year for which test score data is 2009-10, so the last year of resource data we use is 2007-08.

30
resources data. Panel B uses the subsample of observations from single elementary
school districts.
Our earlier results indicated that district provision of BE significantly increases
above the cutoff. Because BE programs tend to be more expensive than ESL
programs, and especially because a school district mandated by the Texas policy rule
to provide BE also tends to provide ESL, we expect an increase in spending on
educational programs for LEP students above the cutoff. This is exactly what we
find—in column 3, school per-pupil spending on bilingual programs (which is
inclusive of expenditures for assessing LEP status as well as instructing LEP students)
significantly increases. The Panel A, column 3 point estimate suggests that spending
on BE programs increases by $76, which is 65 percent of mean per pupil bilingual
program expenditures and 1.6 percent of mean school per pupil expenditures. Thus, in
schools where the first grade cohort has 20 or more Spanish LEP students, more
money is allocated to resources designated for LEP students.
There is no significant jump in total program expenditures (column 1),
indicating that net new revenues are not arriving to cover the incremental cost of
providing BE. None of the components of total program spending, displayed in
columns 2-6, show significant changes above the cutoff besides bilingual program
spending, though the point estimates are suggestive of compositional changes. For
example, above the cutoff, we observe modestly sized decreases in spending on
compensatory education and special education, large increases in spending on gifted
and talented programs.33 Furthermore, results in column 7 indicate no significant
change in average class size in first grade above the cutoff. Based on these foregoing
results, we conclude that a change in resource allocations does not appear to be an
33 With regard to state funds for compensatory education programs, these funds are designated for provision of instruction or services to students at risk of dropping out of school (poor students and LEP students are among the at-risk groups), and the rule is that they are not to be used to fund regular programs or programs mandated by state law. Below the 20-student cutoff, schools might receive state funds for compensatory education to provide supplemental educational services, and above the cutoff—when BE is mandated by state law—these funds decrease because BE encapsulates some of those services. To the extent that non-LEP at-risk students benefited from those compensatory programs typically used by LEP students, then BE provision could have negative effects for them.

31
important mechanism driving our finding of positive spillover effects. Additionally,
the fact that we obtain larger estimated effects of district BE provision for single
elementary school districts relative to the full “non-LEP, non-Spanish home language”
sample (compare rows 1 and 10 of Table 7) but the same reduced-form effects on
school resources (compare the Panels A and B of Table 8), suggests that changes in
school resource allocations do not account for the larger spillover effects in single
elementary school districts.
Another mechanism that could explain our findings is changes in classroom
composition. District BE provision reduces the number of LEP students in mainstream
classes as LEP students in BE form their own separate classes. There could be peer
effects of LEP classmates on LEP students. The finding of stronger effects for single
elementary school districts is consistent with a peer effects story because in these
districts, non-LEP students’ exposure to LEP students unambiguously decreases above
the cutoff (whereas the effect on exposure to LEP students can be less pronounced in
districts with more elementary schools due to sorting of students across schools within
the district in response to which school has the BE program). Corroborating the peer
effects story is the finding of larger positive spillover effects for the math commended
rate than the math passing rate. The larger effects on the commended rate relative to
the passing rate suggest that higher achieving children gain more when BE is
provided. This is consistent with direct peer effects (Imberman, Kugler and Sacerdote
2012, among others, have documented positive effects of having more high-achieving
peers), as well as changes in classroom instruction (e.g., mainstream classes with
fewer LEP students might cover more advanced academic content).
To summarize, we find that resources for non-LEP students do not increase—
in fact, there is evidence of crowd-out of resources for non-LEP students since BE
program spending increases while overall program spending is unchanged—yet we
observe positive effects on their academic achievement. The finding that non-LEP
achievement can be raised without additional spending and without harming the
achievement of the intended beneficiaries has important policy implications even if we

32
cannot empirically pinpoint which specific peer effects story, or whether some other
story, accounts for the observed positive spillover effects.
V. Conclusion
In this paper, we examine the effects of bilingual education programs (versus
ESL programs alone) on the achievement of intended beneficiaries (LEP students) and
their classmates (non-LEP students). In order to address potential bias due to the
endogeneity of exposure to BE, we exploit the plausibly exogenous variation in
student exposure to BE generated by a policy rule in Texas. The policy rule requires
that school districts provide BE when they have 20 or more LEP students in a
particular elementary school grade and language. This motivates our identification
strategy, which is a regression discontinuity (RD) design in which we compare student
outcomes in districts that have slightly less than 20 LEP students in a language-grade
to those with slightly more.
Using panel data from Texas public elementary schools, we find that district
BE provision has significant positive effects on the standardized test scores of “non-
LEP, non-Spanish home language” students, indicating the presence of spillover
effects for educational programs for LEP students on non-LEP peers. We do not find
significant effects on the academic performance of “Spanish home language” students,
a group that is 89 percent ever-LEP students. On net for all students, the effects are
positive and significant. An analysis of school spending data indicates that district BE
provision does not significantly change school total per-pupil expenditures, but does
significantly raise spending on programs exclusively for LEP students, thus changes in
school spending cannot account for our finding of positive spillover effects. This
finding is consistent with peer effects of LEP classmates on LEP students.
Given the high rates of low-skilled immigration in recent decades and the
dispersion in settlement patterns of immigrants away from traditional immigrant-
receiving areas, the issue of how to help LEP students is likely to keep its place at the
center stage of education policy debates. Our results contribute to this debate by

33
providing a convincing research design to evaluate the relative merits of BE programs
compared to ESL programs alone—a question relevant to many school districts. While
our findings are obtained in the context of smaller, less urban school districts in Texas,
which may limit their external validity, nonetheless they have broad implications. In
particular, any cost-benefit analysis on the value of LEP programs should take
spillovers into account. In our context, BE programs provide more benefits than what
the estimated effects on intended beneficiaries alone indicate, because these estimates
ignore the benefits accruing to LEP students’ peers. Although BE programs are
adopted with the intention of helping LEP students, in our context it appears that the
non-LEP students gain more from them, at least in terms of standardized test scores.
REFERENCES
Aizer, Anna. “Peer Effects and Human Capital Accumulation: The Externalities of ADD.” NBER Working Paper No. 14354. Cambridge, MA: National Bureau of Economic Research, 2008.
Angrist, Joshua, Aimee Chin and Ricardo Godoy. “Is Spanish-only Schooling Responsible for the Puerto Rican Language Gap?” Journal of Development
Economics 85(1-2) 2008: 105-128.
Angrist, Joshua and Kevin Lang. “Does Schooling Integration Generate Peer Effects? Evidence from Boston’s Metco Program.” American Economic Review, 94(5) 2004: 1613-1634.
Baker, K.A. and A.A. de Kanter. Effectiveness of Bilingual Educational: A Review of
the Literature. Washington, D.C.: Office of Planning, Budget and Evaluation, U.S. Department of Education, 1981.
Betts, Julian R. “Educational Crowding Out: Do Immigrants Affect the Educational Attainment of American Minorities?” in Daniel S. Hamermesh and Frank D. Bean (eds.), Help or Hindrance? The Economic Implications of Immigration for
African-Americans. New York: Russell Sage Foundation, 1998.
Carrell, Scott, and Mark Hoekstra. “Externalities in the Classroom: How Children Exposed to Domestic Violence Affect Everyone’s Kids,” American Economic
Journal: Applied Economics, 2(1) 2010: 211-228.

34
Cho, Rosa. “Are there Peer Effects Associated with Having English Language Learner (ELL) Classmates?: Evidence from the Early Childhood Longitudinal Study Kindergarten Cohort (ECLS-K).” Brown University, mimeo, 2011.
Crawford, James. Bilingual Education: History, Politics, Theory and Practice. Trenton, NJ: Crane Publishing Company, Inc., 1989.
Figlio, David. “Boys Named Sue: Disruptive Children and Their Peers.” NBER Working Paper No. 11277. Cambridge, MA: National Bureau of Economic Research, 2005.
Geay, Charlotte, Sandra McNally and Shqiponja Telhaj. “Non-native Speakers of English in the Classroom: What are the Effects on Pupil Performance?” London School of Economics Centre for Economic Performance, mimeo, 2011.
Greene, Jay P. “A Meta-Analysis of the Effectiveness of Bilingual Education.” Tomas Rivera Policy Institute, 1998.
Hanushek, Eric, John Kain, Jacob Markman, and Steven Rivkin. “Does Peer Ability Affect Student Achievement?” Journal of Applied Econometrics, 18(5) 2003: 527-544.
Hoxby, Caroline M. “Do Immigrants Crowd Disadvantaged American Natives out of Higher Education?” in Daniel S. Hammermesh and Frank D. Bean (eds.), Help or
Hindrance? The Economic Implications of Immigration for African-Americans. New York: Russell Sage Foundation, 1998.
Hoxby, Caroline and Gretchen Weingarth. “Taking Race Out of the Equation: School Reassignment and the Structure of Peer Effects.” Presented at the 2006 American Economics Association Annual Meetings, 2006.
Imbens, Guido and Thomas Lemieux. “Regression Discontinuity Designs: A Guide to Practice.” Journal of Econometrics, 142(2) 2008: 615 - 635.
Imberman, Scott, Adriana Kugler, and Bruce Sacerdote. “Katrina’s Children: Evidence on the Structure of Peer Effects from Hurricane Evacuees.” American
Economic Review, 102(5) 2012.
Lavy, Victor, Daniele Paserman and Analia Schlosser. “Inside the Black Box of Ability Peer Effects: Evidence from Variation in High and Low Achievers in the Classroom.” Economic Journal, 122(559) 2012: 208-237.
Lee, David S. and Thomas Lemieux. “Regression Discontinuity Designs in
35
Economics.” Journal of Economic Literature, 48(2) 2010: 281-355.
Liu, Samuel T. Essays on the Effects of Immigration on Education and Crime. Ph.D. thesis, MIT, 2000.
Matsudaira, Jordan D. “Sinking or Swimming? Evaluating the Impact of English Immersion versus Bilingual Education on Student Achievement.” University of California, Berkeley, mimeo, 2005.
McCrary, Justin. “Manipulation of the Running Variable in the Regression Discontinuity Design: A Density Test.” Journal of Econometrics, 142(2) 2008: 698-714.
National Clearinghouse for English Language Acquisition (NCELA). “The Growing Numbers of English Learner Students 1998/99-2008/09.” Washington DC: U.S. Department of Education Office of English Acquisition mini-poster, February 2011.
Neymotin, Florence. “Immigration and its Effect on the College-Going Outcomes of Natives.” Economics of Education Review 28, 2009: 538-550.
Nieto, Diego. “A Brief History of Bilingual Education in the United States.” Perspectives on Urban Education Spring 2009: 61-72.
Rossell, Christine H. and Keith Baker. “The Educational Effectiveness of Bilingual Education.” Research in the Teaching of English 30 (February 1996a), 7-74.
Slavin, Robert E., Nancy Madden, Margarita Calderón, Anne Chamberlain and Megan Hennessy. “Reading and Language Outcomes of a Five-Year Randomized Evaluation of Transitional Bilingual Education.” Educational Evaluation and
Policy Analysis 33(1) 2011: 47-58.
U.S. Commission on Civil Rights, A Better Chance to Learn: Bilingual Bicultural
Education, U.S. Commission on Civil Rights Clearinghouse Publication No. 51, 1975.
Willig, Ann C. “Meta-Analysis of Selected Studies on the Effectiveness of Bilingual Education.” Review of Educational Research 55 (Fall 1985), 269-317.
Zehler, Annette M., Howard L. Fleischman, Paul J. Hopstock, Todd G. Stephenson, Michelle L. Pendzick and Saloni Sapru. Descriptive Study of Services to LEP
Students and LEP Students with Disabilities, Volume IA Research Report – Text. Washington, DC: Department of Education, 2003.

Figure 1: Texas School Districts with 8 - 39 Spanish LEP Students in the First Grade Cohort
8-14 Spanish LEP Students
15-19 Spanish LEP Students
20-24 Spanish LEP Students
25-39 Spanish LEP Students
The shaded area corresponds to school districts with fewer than 200 students in the first gradecohort in 2004-05, and with between 8 and 39 Spanish LEP students in the first grade cohort onaverage between 2002-03 and 2009-10; this shaded area corresponds to the 261 districts present inthe ”non-LEP, non-Spanish language” sample described in Table 1.
1
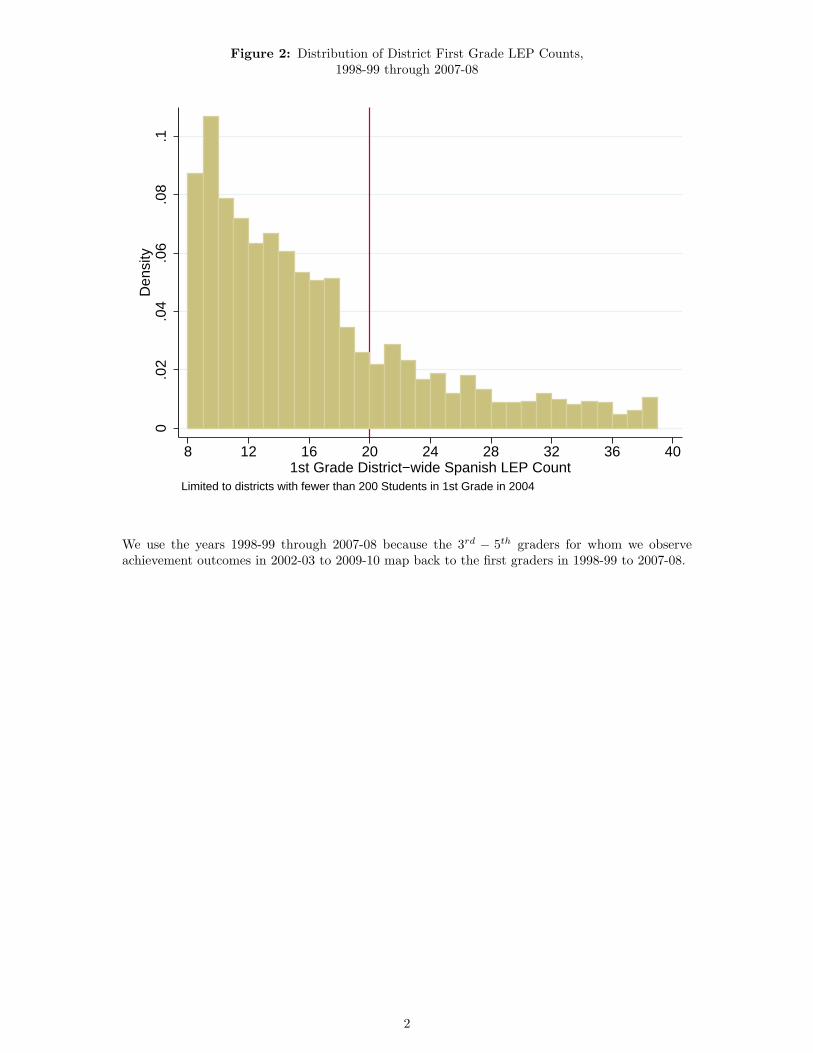
Figure 2: Distribution of District First Grade LEP Counts,1998-99 through 2007-08
0.0
2.0
4.0
6.0
8.1
Den
sity
8 12 16 20 24 28 32 36 401st Grade District−wide Spanish LEP Count
Limited to districts with fewer than 200 Students in 1st Grade in 2004
We use the years 1998-99 through 2007-08 because the 3rd − 5th graders for whom we observeachievement outcomes in 2002-03 to 2009-10 map back to the first graders in 1998-99 to 2007-08.
2
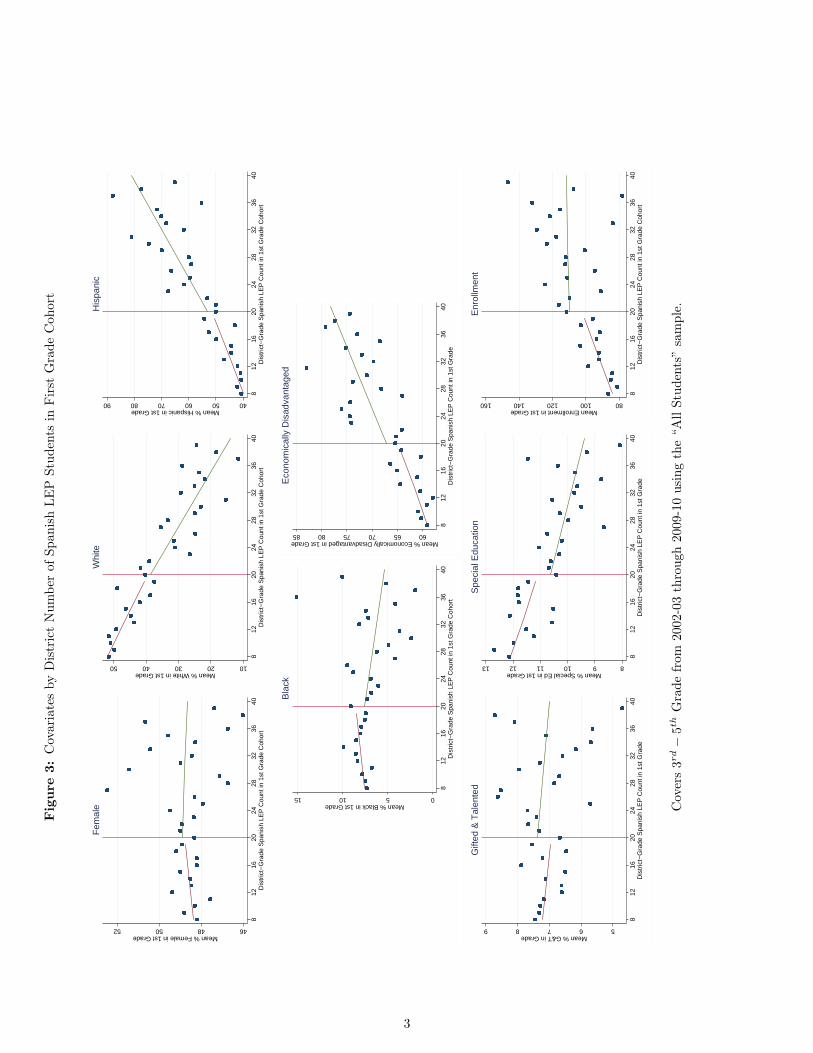
Fig
ure
3:C
ovar
iate
sby
Dis
tric
tN
umbe
rof
Span
ish
LE
PSt
uden
tsin
Fir
stG
rade
Coh
ort
46485052Mean % Female in 1st Grade
812
1620
2428
3236
40D
istr
ict−
Gra
de S
pani
sh L
EP
Cou
nt in
1st
Gra
de C
ohor
t
Fem
ale
1020304050Mean % White in 1st Grade
812
1620
2428
3236
40D
istr
ict−
Gra
de S
pani
sh L
EP
Cou
nt in
1st
Gra
de C
ohor
t
Whi
te
405060708090Mean % Hispanic in 1st Grade
812
1620
2428
3236
40D
istr
ict−
Gra
de S
pani
sh L
EP
Cou
nt in
1st
Gra
de C
ohor
t
His
pani
c
051015Mean % Black in 1st Grade
812
1620
2428
3236
40D
istr
ict−
Gra
de S
pani
sh L
EP
Cou
nt in
1st
Gra
de C
ohor
t
Bla
ck
606570758085Mean % Economically Disadvantaged in 1st Grade
812
1620
2428
3236
40D
istr
ict−
Gra
de S
pani
sh L
EP
Cou
nt in
1st
Gra
de
Eco
nom
ical
ly D
isad
vant
aged
56789Mean % G&T in Grade
812
1620
2428
3236
40D
istr
ict−
Gra
de S
pani
sh L
EP
Cou
nt in
1st
Gra
de
Gift
ed &
Tal
ente
d
8910111213Mean % Special Ed in 1st Grade
812
1620
2428
3236
40D
istr
ict−
Gra
de S
pani
sh L
EP
Cou
nt in
1st
Gra
de
Spe
cial
Edu
catio
n
80100120140160Mean Enrollment in 1st Grade
812
1620
2428
3236
40D
istr
ict−
Gra
de S
pani
sh L
EP
Cou
nt in
1st
Gra
de C
ohor
t
Enr
ollm
ent
Co v
ers
3rd−
5th
Gra
defr
om20
02-0
3th
roug
h20
09-1
0us
ing
the
“All
Stud
ents
”sa
mpl
e.
3
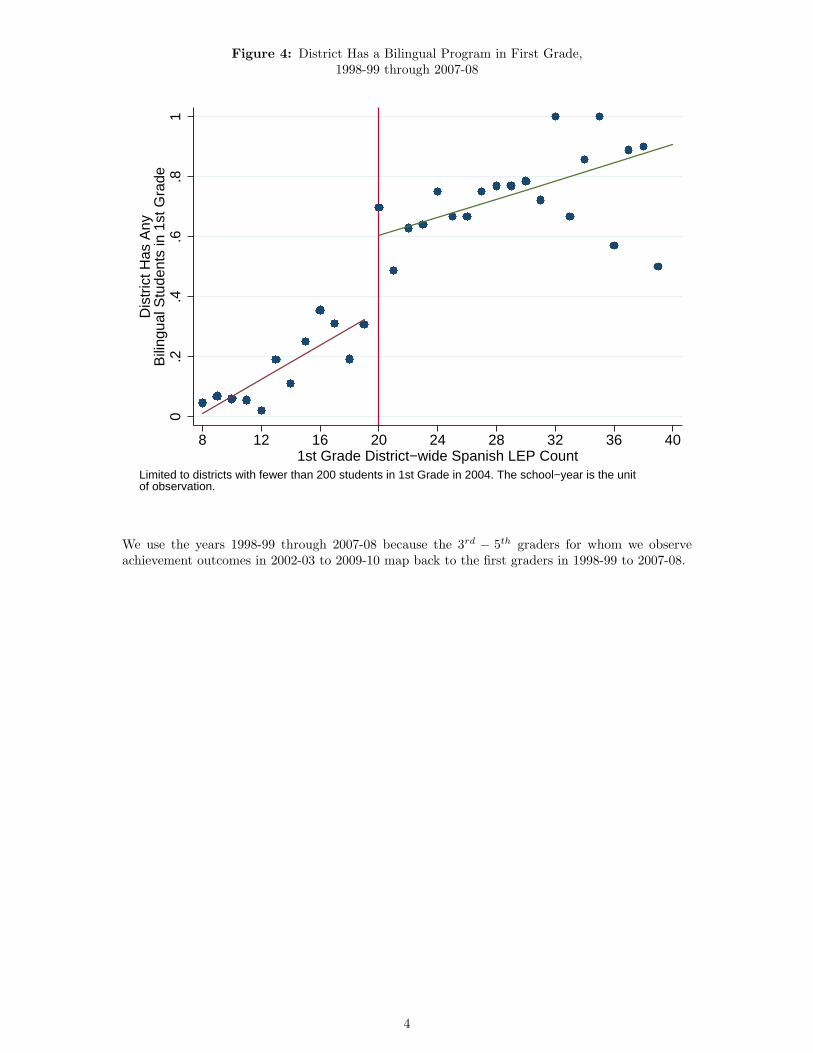
Figure 4: District Has a Bilingual Program in First Grade,1998-99 through 2007-08
0.2
.4.6
.81
Dis
tric
t Has
Any
Bili
ngua
l Stu
dent
s in
1st
Gra
de
8 12 16 20 24 28 32 36 401st Grade District−wide Spanish LEP Count
Limited to districts with fewer than 200 students in 1st Grade in 2004. The school−year is the unitof observation.
We use the years 1998-99 through 2007-08 because the 3rd − 5th graders for whom we observeachievement outcomes in 2002-03 to 2009-10 map back to the first graders in 1998-99 to 2007-08.
4

Fig
ure
5:TA
KS
Per
form
ance
for
Non
-LE
P,N
on-S
pani
shH
ome
Lan
guag
eSt
uden
ts
−.3−.2−.10Mean Score (Standard Deviations)
812
1620
2428
3236
40S
pani
sh L
EP
Cou
nt in
1st
Gra
de C
ohor
t
TA
KS
Mea
n M
ath
Ach
ieve
men
t
7075808590% Meeting Standard
812
1620
2428
3236
40S
pani
sh L
EP
Cou
nt in
1st
Gra
de C
ohor
t
TA
KS
Mea
n M
ath
Pas
s R
ate
20253035% Commendable
812
1620
2428
3236
40S
pani
sh L
EP
Cou
nt in
1st
Gra
de C
ohor
t
TA
KS
Mea
n M
ath
Com
men
dabl
e R
ate
−.3−.2−.10.1Mean Score (Standard Deviations)
812
1620
2428
3236
40S
pani
sh L
EP
Cou
nt in
1st
Gra
de C
ohor
t
TA
KS
Mea
n R
eadi
ng A
chie
vem
ent
75808590% Meeting Standard
812
1620
2428
3236
40S
pani
sh L
EP
Cou
nt
TA
KS
Mea
n R
eadi
ng P
ass
Rat
e
20253035% Commendable
812
1620
2428
3236
40S
pani
sh L
EP
Cou
nt in
1st
Gra
de C
ohor
t
TA
KS
Mea
n R
eadi
ng C
omm
enda
ble
Rat
e
Cover
s3
rd−
5th
Gra
de
from
2002-0
3th
rough
2009-1
0usi
ng
the
“N
on-L
EP,N
on-S
panis
hH
om
eLanguage”
sam
ple
.
5

Fig
ure
6:TA
KS
Per
form
ance
for
Span
ish
Hom
eLan
guag
eSt
uden
ts
−.6−.5−.4−.3−.2Mean Score (Standard Deviations)
812
1620
2428
3236
40S
pani
sh L
EP
Cou
nt in
1st
Gra
de C
ohor
t
TA
KS
Mea
n M
ath
Ach
ieve
men
t
6065707580% Meeting Standard
812
1620
2428
3236
40S
pani
sh L
EP
Cou
nt in
1st
Gra
de C
ohor
t
TA
KS
Mea
n M
ath
Pas
s R
ate
10152025% Commendable
812
1620
2428
3236
40S
pani
sh L
EP
Cou
nt in
1st
Gra
de C
ohor
t
TA
KS
Mea
n M
ath
Com
men
dabl
e R
ate
−.7−.6−.5−.4−.3Mean Score (Standard Deviations)
812
1620
2428
3236
40S
pani
sh L
EP
Cou
nt in
1st
Gra
de C
ohor
t
TA
KS
Mea
n R
eadi
ng A
chie
vem
ent
6065707580% Meeting Standard
8S
pani
sh L
EP
Cou
nt
TA
KS
Mea
n R
eadi
ng P
ass
Rat
e
5101520% Commendable
8S
pani
sh L
EP
Cou
nt
TA
KS
Mea
n R
eadi
ng C
omm
enda
ble
Rat
e
Cover
s3
rd−
5th
Gra
de
from
2002-0
3th
rough
2009-1
0“Spanis
hH
om
eLanguage”
sam
ple
.
6

Full Sample
(8 to 39 LEP in 1st
Grade Cohort)
8 to 19 LEP in 1st
Grade Cohort
20 to 39 LEP in 1st
Grade Cohort
Mean (Standard Deviation) Among All Students in Same School-Grade
% Female 48.6 48.5 48.8
(6.0) (6.1) (5.6)
% White 43.7 47.8 31.2
(24.5) (23.6) (23.1)
% Hispanic 48.0 43.6 61.5
(27.0) (25.4) (27.4)
% Black 7.8 8.0 7.0
(10.5) (10.8) (9.3)
% Economically Disadvantaged 63.1 60.8 70.4
(17.8) (17.3) (17.3)
% LEP 11.7 10.3 16.1
(10.3) (9.0) (12.4)
% in Bilingual Program 3.5 1.3 10.2
(8.7) (4.8) (13.2)
% in Special Education Program 11.4 11.7 10.3
(5.5) (5.7) (4.8)
% in Gifted and Talented Program 7.2 7.2 7.3
(4.9) (5.0) (4.6)
Mean (S.D.) Among Non-LEP, Non-Spanish Home Language Students in Same School-Grade
TAKS Math Standardized Scale Score -0.08 -0.07 -0.13
(0.35) (0.36) (0.33)
TAKS Math Passing Rate 80.0 80.5 78.5
(14.0) (13.8) (14.4)
TAKS Math Commended Rate 27.8 28.0 27.1
(14.4) (14.5) (14.1)
TAKS Reading Standardized Scale Score -0.03 -0.01 -0.08
(0.32) (0.33) (0.30)
TAKS Reading Passing Rate 83.0 83.5 81.4
(12.3) (12.3) (12.2)
TAKS Reading Commended Rate 28.5 28.8 27.4
(13.9) (14.1) (13.2)
Observations (School-Grade-Year) 3761 2835 926
# of Schools 413 375 148
# of Districts 261 247 89
2002-03 through 2009-10
Table 1: Summary Statistics for "Non-LEP, Non-Spanish Home Language" Sample,
Notes: Each school-grade-year for grades 3 through 5 is a separate observation. Sample is limited to observations in districts with
fewer than 200 students in the 1st grade cohort in 2004-05, in district-grade-years with between 8 and 39 LEP students in the 1st
grade cohort, and with non-missing math or reading achievement variables.

Pooled
3rd
Grade
4th
Grade
5th
Grade Pooled
3rd
Grade
4th
Grade
5th
Grade
(1) (2) (3) (4) (5) (6) (7) (8)
Mean Standardized 0.008 -0.014 0.021 0.020 0.006 -0.014 0.024 0.010
Achievement (0.029) (0.036) (0.038) (0.033) (0.026) (0.030) (0.031) (0.028)
Passing Rate -0.257 -0.832 -0.390 0.617 -0.420 -1.479* 0.253 0.189
(1.057) (1.188) (1.250) (1.342) (0.850) (0.835) (1.053) (1.070)
Commended Rate 0.610 -0.223 1.287 0.950 0.531 0.234 0.471 0.885
(1.012) (1.256) (1.446) (1.098) (0.866) (1.199) (0.950) (0.822)
Observations 3,759 1,291 1,246 1,222 3,761 1,291 1,246 1,224
Mean Standardized -0.055 -0.036 -0.059 -0.074 -0.071* -0.048 -0.087* -0.082*
Achievement (0.042) (0.044) (0.052) (0.047) (0.042) (0.043) (0.050) (0.045)
Passing Rate -1.677 -0.512 -2.116 -2.612 -3.076* -1.738 -4.155* -3.437
(1.835) (2.072) (2.189) (2.106) (1.741) (1.650) (2.199) (2.201)
Commended Rate -2.015* -1.444 -1.892 -2.795* -1.128 -0.955 -1.373 -1.159
(1.125) (1.252) (1.470) (1.539) (1.046) (1.440) (1.246) (0.949)
Observations 3,247 1,168 1,067 1,012 3,244 1,170 1,064 1,010
Mean Standardized -0.007 -0.012 -0.001 -0.006 -0.014 -0.015 -0.006 -0.019
Achievement (0.032) (0.037) (0.040) (0.035) (0.029) (0.031) (0.035) (0.030)
Passing Rate -0.870 -0.680 -1.128 -0.747 -1.254 -1.420 -1.108 -1.121
(1.179) (1.370) (1.329) (1.432) (0.973) (0.913) (1.219) (1.227)
Commended Rate 0.302 -0.095 0.785 0.361 0.210 0.277 -0.056 0.421
(1.035) (1.197) (1.417) (1.119) (0.880) (1.157) (0.999) (0.768)
Observations 3,819 1,314 1,266 1,239 3,819 1,314 1,266 1,239
B. "Spanish Home Language" Students
A. "Non-LEP, Non-Spanish Home Language" Students
C. All Students
Table 2: OLS Estimates of Relationship Between District Bilingual Education Provision and TAKS
Achievement
Math Reading
Notes: Observations are at the school-grade-year level, and cover the 2002-03 through 2009-10 school years. Sample is limited
to observations in districts with fewer than 200 students in the 1st grade cohort in 2004-05, in district-grade-years with between
8 and 39 LEP students in the 1st grade cohort, and with non-missing achievement variables. The observations differ slightly
across the panels because the incidence of masked achievement outcomes differs across the student categories. Each coefficient
and associated standard error reported comes from a separate regression that also controls for grade-year fixed effects and the
percent of all students in the school-grade-year who are female, economically disadvantaged, white, black and Hispanic.
Regressions in Panel A (Panel B) also control for the percent female and percent disadvantaged among "non-LEP, non-Spanish
language" students ("Spanish home language" students). Standard errors clustered by district are in parentheses. *, ** and ***
denote significance at the 10%, 5% and 1% levels, respectively.

% Female % White % Hispanic % Black % Disadv % LEP % Gifted % SpecEd Enrollment
(1) (2) (3) (4) (8) (5) (6) (7) (9)
1st Grade Spanish LEP Count >= 20 0.092 -0.793 1.928 -1.148 2.333 0.237 0.554 -0.191 39.514*
(0.657) (3.512) (4.015) (1.619) (2.660) (1.638) (0.536) (0.546) (20.728)
Observations 3,819 3,819 3,819 3,819 3,819 3,819 3,819 3,819 3,819
Joint Significance Test (Prob > Chi2)
B. Mean Among "Non-LEP, Non-Spanish Home Language" Students Only
% Female % Disadv % Gifted
(1) (3) (2)
1st Grade Spanish LEP Count >= 20 0.469 2.888 0.468
(0.801) (3.008) (0.695)
Observations 3,761 3,761 3,761
Joint Significance Test (Prob > Chi2)
C. Mean Among "Spanish Home Language" Students Among
% Female % Disadv % Gifted
(1) (3) (2)
1st Grade Spanish LEP Count >= 20 -1.734 1.258 0.584
(1.299) (1.316) (0.899)
Observations 3,262 3,262 3,262
Joint Significance Test (Prob > Chi2)
Table 3: Tests of Discontinuities in Covariates
Notes: Observations are at the school-grade-year level, and cover the 2002-03 through 2009-10 school years. Observations are at the school-grade-year level, and cover the 2002-03 through 2009-10
school years. Sample is limited to observations in districts with fewer than 200 students in the 1st grade cohort in 2004-05, in district-grade-years with between 8 and 39 LEP students in the 1st grade
cohort, and with non-missing achievement variables. Each coefficient and associated standard error reported comes from a separate regression that also controls for district-wide Spanish LEP count in
the relevant 1st grade cohort, district-wide LEP count interacted with a dummy for being above 20 Spanish LEP students, and grade-year fixed effects. Standard errors clustered by district are in
parentheses. *, ** and *** denote significance at the 10%, 5% and 1% levels, respectively.
0.17
A. Mean Covariate Among All Students in Same School-Grade-Year
Demographic Composition School Program Participation
0.54
0.36
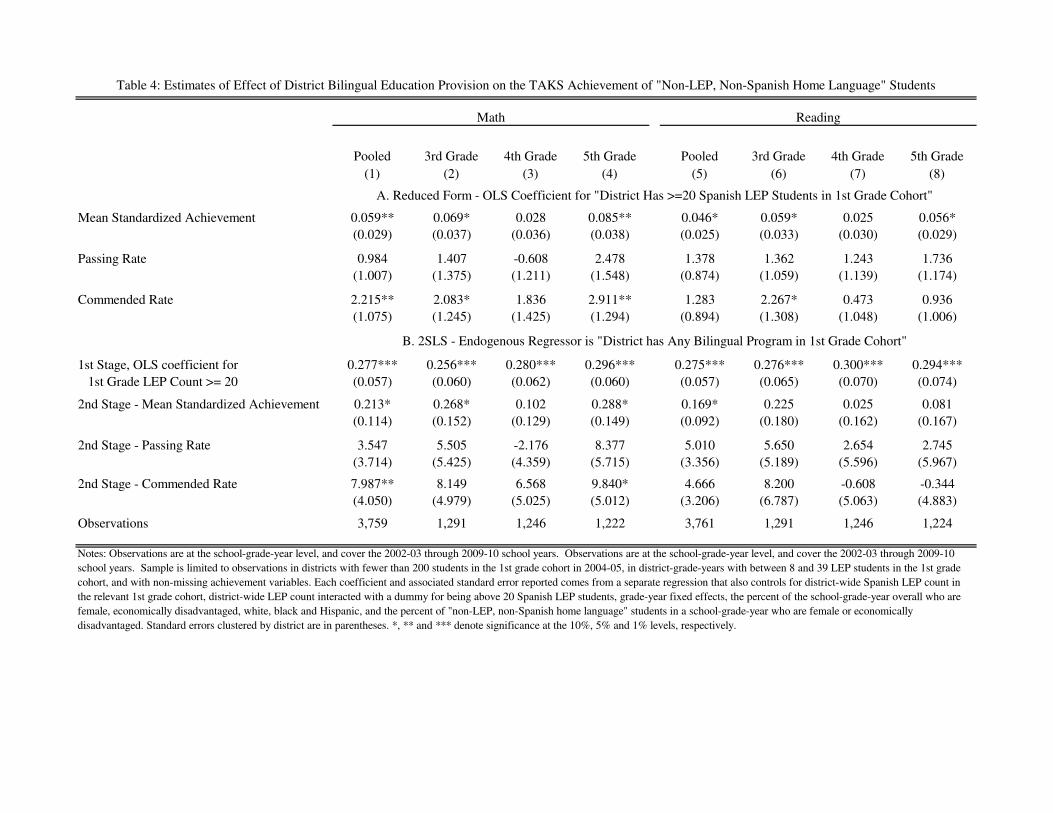
Pooled 3rd Grade 4th Grade 5th Grade Pooled 3rd Grade 4th Grade 5th Grade
(1) (2) (3) (4) (5) (6) (7) (8)
Mean Standardized Achievement 0.059** 0.069* 0.028 0.085** 0.046* 0.059* 0.025 0.056*
(0.029) (0.037) (0.036) (0.038) (0.025) (0.033) (0.030) (0.029)
Passing Rate 0.984 1.407 -0.608 2.478 1.378 1.362 1.243 1.736
(1.007) (1.375) (1.211) (1.548) (0.874) (1.059) (1.139) (1.174)
Commended Rate 2.215** 2.083* 1.836 2.911** 1.283 2.267* 0.473 0.936
(1.075) (1.245) (1.425) (1.294) (0.894) (1.308) (1.048) (1.006)
1st Stage, OLS coefficient for 0.277*** 0.256*** 0.280*** 0.296*** 0.275*** 0.276*** 0.300*** 0.294***
1st Grade LEP Count >= 20 (0.057) (0.060) (0.062) (0.060) (0.057) (0.065) (0.070) (0.074)
2nd Stage - Mean Standardized Achievement 0.213* 0.268* 0.102 0.288* 0.169* 0.225 0.025 0.081
(0.114) (0.152) (0.129) (0.149) (0.092) (0.180) (0.162) (0.167)
2nd Stage - Passing Rate 3.547 5.505 -2.176 8.377 5.010 5.650 2.654 2.745
(3.714) (5.425) (4.359) (5.715) (3.356) (5.189) (5.596) (5.967)
2nd Stage - Commended Rate 7.987** 8.149 6.568 9.840* 4.666 8.200 -0.608 -0.344
(4.050) (4.979) (5.025) (5.012) (3.206) (6.787) (5.063) (4.883)
Observations 3,759 1,291 1,246 1,222 3,761 1,291 1,246 1,224
Notes: Observations are at the school-grade-year level, and cover the 2002-03 through 2009-10 school years. Observations are at the school-grade-year level, and cover the 2002-03 through 2009-10
school years. Sample is limited to observations in districts with fewer than 200 students in the 1st grade cohort in 2004-05, in district-grade-years with between 8 and 39 LEP students in the 1st grade
cohort, and with non-missing achievement variables. Each coefficient and associated standard error reported comes from a separate regression that also controls for district-wide Spanish LEP count in
the relevant 1st grade cohort, district-wide LEP count interacted with a dummy for being above 20 Spanish LEP students, grade-year fixed effects, the percent of the school-grade-year overall who are
female, economically disadvantaged, white, black and Hispanic, and the percent of "non-LEP, non-Spanish home language" students in a school-grade-year who are female or economically
disadvantaged. Standard errors clustered by district are in parentheses. *, ** and *** denote significance at the 10%, 5% and 1% levels, respectively.
Math Reading
Table 4: Estimates of Effect of District Bilingual Education Provision on the TAKS Achievement of "Non-LEP, Non-Spanish Home Language" Students
B. 2SLS - Endogenous Regressor is "District has Any Bilingual Program in 1st Grade Cohort"
A. Reduced Form - OLS Coefficient for "District Has >=20 Spanish LEP Students in 1st Grade Cohort"

Pooled 3rd Grade 4th Grade 5th Grade Pooled 3rd Grade 4th Grade 5th Grade
(1) (2) (3) (4) (5) (6) (7) (8)
Mean Standardized Achievement 0.030 0.053 -0.015 0.050 0.011 0.025 -0.012 0.017
(0.043) (0.052) (0.054) (0.054) (0.043) (0.049) (0.054) (0.056)
Passing Rate 0.455 2.220 -2.406 1.294 -0.141 -0.463 -0.857 0.952
(2.047) (2.646) (2.439) (2.508) (1.891) (1.956) (2.377) (2.663)
Commended Rate 0.954 0.896 0.305 1.842 0.848 2.396 0.529 -0.787
(1.313) (1.401) (1.784) (2.004) (1.222) (1.882) (1.397) (1.332)
1st Stage, OLS coefficient for 0.276*** 0.279*** 0.270*** 0.273*** 0.277*** 0.282*** 0.276*** 0.269***
1st Grade LEP Count >= 20 (0.052) (0.052) (0.057) (0.059) (0.052) (0.052) (0.057) (0.059)
2nd Stage - Mean Standardized Achievement 0.107 0.190 -0.056 0.182 0.040 0.088 -0.044 0.064
(0.155) (0.184) (0.200) (0.202) (0.156) (0.171) (0.197) (0.208)
2nd Stage - Passing Rate 1.652 7.964 -8.897 4.735 -0.509 -1.644 -3.099 3.537
(7.368) (9.273) (9.503) (9.147) (6.830) (6.970) (8.666) (9.910)
2nd Stage - Commended Rate 3.462 3.215 1.129 6.739 3.058 8.503 1.912 -2.922
(4.761) (4.969) (6.589) (7.514) (4.316) (6.516) (4.963) (5.018)
Observations 3,247 1,168 1,067 1,012 3,244 1,170 1,064 1,010
Notes: Observations are at the school-grade-year level, and cover the 2002-03 through 2009-10 school years. Observations are at the school-grade-year level, and cover the 2002-03 through 2009-10
school years. Sample is limited to observations in districts with fewer than 200 students in the 1st grade cohort in 2004-05, in district-grade-years with between 8 and 39 LEP students in the 1st grade
cohort, and with non-missing achievement variables. Each coefficient and associated standard error reported comes from a separate regression that also controls for district-wide Spanish LEP count in
the relevant 1st grade cohort, district-wide LEP count interacted with a dummy for being above 20 Spanish LEP students, grade-year fixed effects, the percent of the school-grade-year overall who are
female, economically disadvantaged, white, black and Hispanic, and the percent of "Spanish home language" students in a school-grade-year who are female or economically disadvantaged. Standard
errors clustered by district are in parentheses. *, ** and *** denote significance at the 10%, 5% and 1% levels, respectively.
Table 5: Estimates of Effect of District Bilingual Education Provision on the TAKS Achievement of "Spanish Home Language" Students
Reading
A. Reduced Form - OLS Coefficient for "District Has >=20 Spanish LEP Students in 1st Grade Cohort"
Math
B. 2SLS - Endogenous Regressor is "District has Any Bilingual Program in 1st Grade Cohort"
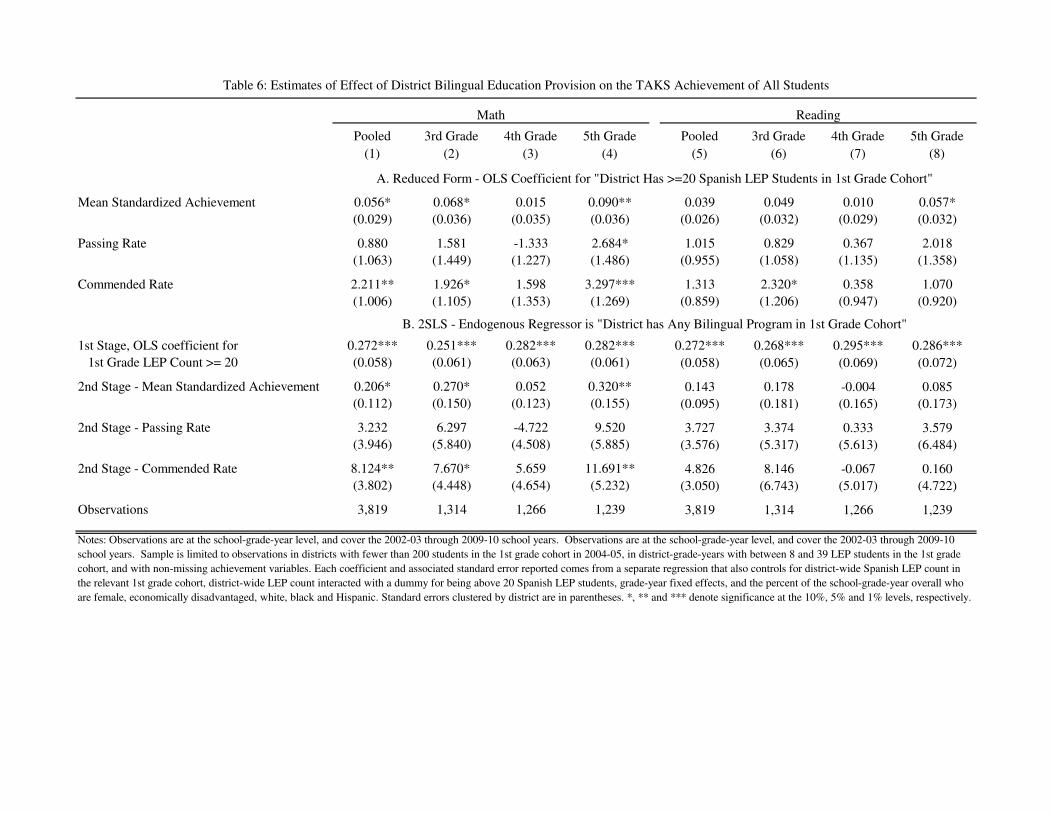
Pooled 3rd Grade 4th Grade 5th Grade Pooled 3rd Grade 4th Grade 5th Grade
(1) (2) (3) (4) (5) (6) (7) (8)
Mean Standardized Achievement 0.056* 0.068* 0.015 0.090** 0.039 0.049 0.010 0.057*
(0.029) (0.036) (0.035) (0.036) (0.026) (0.032) (0.029) (0.032)
Passing Rate 0.880 1.581 -1.333 2.684* 1.015 0.829 0.367 2.018
(1.063) (1.449) (1.227) (1.486) (0.955) (1.058) (1.135) (1.358)
Commended Rate 2.211** 1.926* 1.598 3.297*** 1.313 2.320* 0.358 1.070
(1.006) (1.105) (1.353) (1.269) (0.859) (1.206) (0.947) (0.920)
1st Stage, OLS coefficient for 0.272*** 0.251*** 0.282*** 0.282*** 0.272*** 0.268*** 0.295*** 0.286***
1st Grade LEP Count >= 20 (0.058) (0.061) (0.063) (0.061) (0.058) (0.065) (0.069) (0.072)
2nd Stage - Mean Standardized Achievement 0.206* 0.270* 0.052 0.320** 0.143 0.178 -0.004 0.085
(0.112) (0.150) (0.123) (0.155) (0.095) (0.181) (0.165) (0.173)
2nd Stage - Passing Rate 3.232 6.297 -4.722 9.520 3.727 3.374 0.333 3.579
(3.946) (5.840) (4.508) (5.885) (3.576) (5.317) (5.613) (6.484)
2nd Stage - Commended Rate 8.124** 7.670* 5.659 11.691** 4.826 8.146 -0.067 0.160
(3.802) (4.448) (4.654) (5.232) (3.050) (6.743) (5.017) (4.722)
Observations 3,819 1,314 1,266 1,239 3,819 1,314 1,266 1,239
Notes: Observations are at the school-grade-year level, and cover the 2002-03 through 2009-10 school years. Observations are at the school-grade-year level, and cover the 2002-03 through 2009-10
school years. Sample is limited to observations in districts with fewer than 200 students in the 1st grade cohort in 2004-05, in district-grade-years with between 8 and 39 LEP students in the 1st grade
cohort, and with non-missing achievement variables. Each coefficient and associated standard error reported comes from a separate regression that also controls for district-wide Spanish LEP count in
the relevant 1st grade cohort, district-wide LEP count interacted with a dummy for being above 20 Spanish LEP students, grade-year fixed effects, and the percent of the school-grade-year overall who
are female, economically disadvantaged, white, black and Hispanic. Standard errors clustered by district are in parentheses. *, ** and *** denote significance at the 10%, 5% and 1% levels, respectively.
Table 6: Estimates of Effect of District Bilingual Education Provision on the TAKS Achievement of All Students
B. 2SLS - Endogenous Regressor is "District has Any Bilingual Program in 1st Grade Cohort"
Math Reading
A. Reduced Form - OLS Coefficient for "District Has >=20 Spanish LEP Students in 1st Grade Cohort"

Mean
Achievement
Passing Rate Commended
Rate
Mean
Achievement
Passing Rate Commended
Rate
(1) (2) (3) (4) (5) (6)
0 00.213* 3.547 7.987** 0.169* 5.010 4.666
(0.114) (3.714) (4.050) (0.092) (3.356) (3.206)
0 0Observations 3,759 3,759 3,759 3,761 3,761 3,761
(3.206) 0
0.201* 3.132 7.656* 0.150 4.398 4.074
(0.116) (3.706) (4.147) (0.095) (3.314) (3.341)
0 0Observations 3,759 3,759 3,759 3,761 3,761 3,761
0 0
0 00.211* 3.504 7.931** 0.170* 5.080 4.715
(0.113) (3.677) (4.021) (0.092) (3.345) (3.196)
0 0Observations 3,759 3,759 3,759 3,761 3,761 3,761
0 04) Quadratic Smoother
0 00.118 1.065 1.396 0.114 4.304 3.041
(0.194) (5.737) (6.684) (0.148) (5.305) (5.342)
0 0Observations 3,759 3,759 3,759 3,761 3,761 3,761
0 05) Cubic Smoother
0 00.117 2.594 -0.250 0.006 2.563 -2.401
(0.201) (5.930) (6.225) (0.140) (5.446) (4.835)
0 0Observations 3,759 3,759 3,759 3,761 3,761 3,761
0 06) Bandwidth of 10 to 29
0.151 1.979 4.829 0.151 3.782 5.500
(0.134) (4.206) (4.810) (0.107) (3.652) (3.752)
0 0Observations 2,738 2,738 2,738 2,740 2,740 2,740
0 07) Bandwidth of 8 to 49
0 00.221* 8.394** 8.394** 0.158* 4.328 4.928
(0.118) (4.006) (4.006) (0.090) (3.299) (3.033)
0 0Observations 3,899 3,899 3,899 3,901 3,901 3,901
0 08) Restrict to Districts with Fewer than 200 Students in 1st Grade in 2000 instead of 2004
0 00.176* 2.461 7.301** 0.120 3.024 3.974
(0.103) (3.499) (3.516) (0.080) (2.866) (2.764)
0 0Observations 4,119 4,119 4,119 4,121 4,121 4,121
0 09) Restrict to Districts with Fewer than 200 Students in 1st Grade in 2008 instead of 2004
0 00.161 1.813 6.476* 0.137 3.520 4.429
(0.109) (3.564) (3.701) (0.083) (3.024) (2.876)
0 0Observations 3,757 3,757 3,757 3,759 3,759 3,759
0 010) Restrict to Districts with a Single Elementary School
0 00.374** 9.878* 12.062** 0.374*** 11.781*** 10.109**
(0.152) (5.008) (5.356) (0.134) (4.399) (4.486)
0 0Observations 2,296 2,296 2,296 2,298 2,298 2,298
Table 7: Sensitivity Analysis of 2SLS Estimates of Effects on "Non-LEP, Non-Spanish Home Language"
Students, Pooled Grades 3 - 5
Math Reading
1) Baseline (From Table 4)
District
Provides BE
District
Provides BE
2) Assign Masked Values with 1 Student
3) Assign Masked Values with 4 Students
District
Provides BE
District
Provides BE
Notes: See Table 4 notes regarding base sample and specification. Reported is the 2SLS coefficient for the endogenous regressor,
""District has Any Bilingual Program in 1st Grade Cohort" where the identifying instrument is "District Has >=20 Spanish LEP
Students in 1st Grade Cohort". Standard errors clustered by district are in parentheses. *, ** and *** denote significance at the
10%, 5% and 1% levels, respectively.
District
Provides BE
District
Provides BE
District
Provides BE
District
Provides BE
District
Provides BE
District
Provides BE
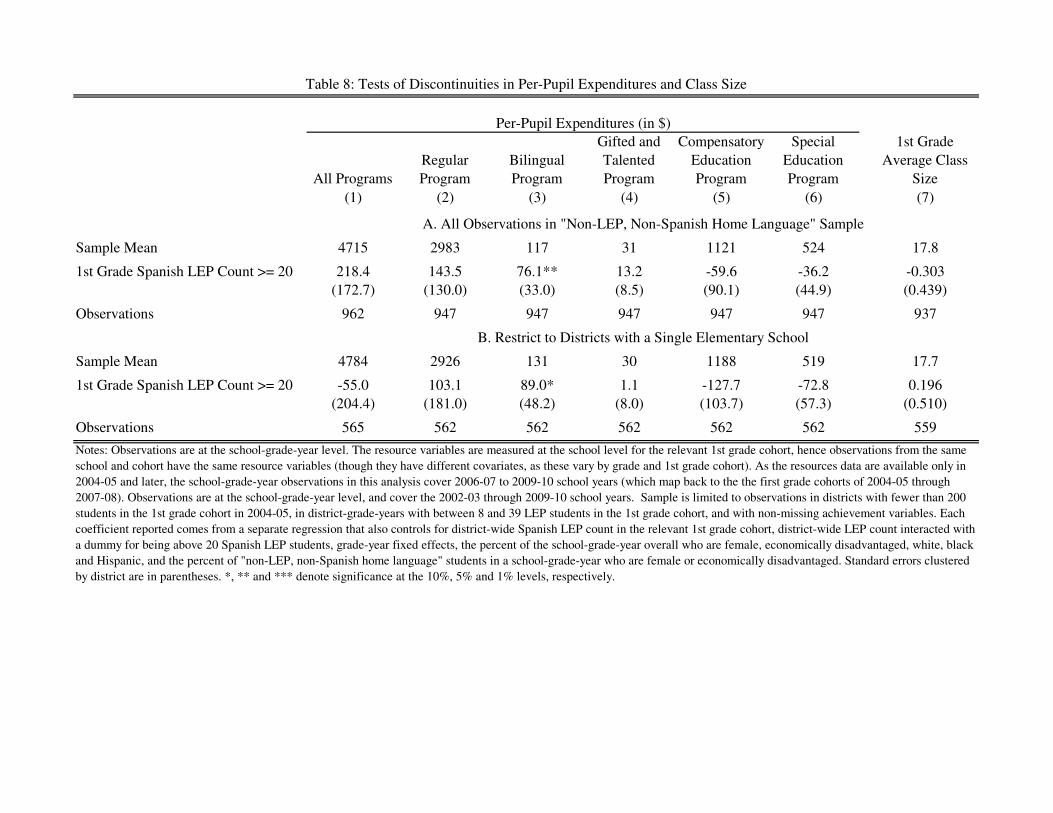
All Programs
Regular
Program
Bilingual
Program
Gifted and
Talented
Program
Compensatory
Education
Program
Special
Education
Program
1st Grade
Average Class
Size
(1) (2) (3) (4) (5) (6) (7)
Sample Mean 4715 2983 117 31 1121 524 17.8
1st Grade Spanish LEP Count >= 20 218.4 143.5 76.1** 13.2 -59.6 -36.2 -0.303
(172.7) (130.0) (33.0) (8.5) (90.1) (44.9) (0.439)
Observations 962 947 947 947 947 947 937
Sample Mean 4784 2926 131 30 1188 519 17.7
1st Grade Spanish LEP Count >= 20 -55.0 103.1 89.0* 1.1 -127.7 -72.8 0.196
(204.4) (181.0) (48.2) (8.0) (103.7) (57.3) (0.510)
Observations 565 562 562 562 562 562 559
Table 8: Tests of Discontinuities in Per-Pupil Expenditures and Class Size
B. Restrict to Districts with a Single Elementary School
Notes: Observations are at the school-grade-year level. The resource variables are measured at the school level for the relevant 1st grade cohort, hence observations from the same
school and cohort have the same resource variables (though they have different covariates, as these vary by grade and 1st grade cohort). As the resources data are available only in
2004-05 and later, the school-grade-year observations in this analysis cover 2006-07 to 2009-10 school years (which map back to the the first grade cohorts of 2004-05 through
2007-08). Observations are at the school-grade-year level, and cover the 2002-03 through 2009-10 school years. Sample is limited to observations in districts with fewer than 200
students in the 1st grade cohort in 2004-05, in district-grade-years with between 8 and 39 LEP students in the 1st grade cohort, and with non-missing achievement variables. Each
coefficient reported comes from a separate regression that also controls for district-wide Spanish LEP count in the relevant 1st grade cohort, district-wide LEP count interacted with
a dummy for being above 20 Spanish LEP students, grade-year fixed effects, the percent of the school-grade-year overall who are female, economically disadvantaged, white, black
and Hispanic, and the percent of "non-LEP, non-Spanish home language" students in a school-grade-year who are female or economically disadvantaged. Standard errors clustered
by district are in parentheses. *, ** and *** denote significance at the 10%, 5% and 1% levels, respectively.
Per-Pupil Expenditures (in $)
A. All Observations in "Non-LEP, Non-Spanish Home Language" Sample