impact of bilingual education programs on limited english...
TRANSCRIPT

Impact of Bilingual Education Programs on Limited English Proficient
Students and Their Peers: Regression Discontinuity Evidence from Texas*
Aimee Chin
University of Houston and NBER
N. Meltem Daysal
Tilburg University
Scott Imberman
University of Houston and NBER
October 2011
ABSTRACT
To estimate the causal effect of bilingual education on the academic achievement
of limited English proficient (LEP) students and their peers, we exploit a policy
rule in Texas requiring a school district to offer bilingual education when its
enrollment of LEP students in a particular elementary grade level and language is
twenty or higher. Using school panel data for 1998-99 to 2009-10, we find
evidence of a significant jump up in the probability that a district offers bilingual
education above this 20-student cutoff. Using this variation in exposure to
bilingual education, we find that bilingual education has weak positive effects on
the standardized test scores of non-LEP, non-Spanish home language students and
no effects on Spanish home language students. We are able to rule out even
relatively small harmful effects on non-LEP, non-Spanish home language students
with 95 percent confidence.
* Chin: Associate Professor, Department of Economics, University of Houston, 204 McElhinney Hall, Houston, TX
77204-5019 (email: [email protected]); Daysal: Assistant Professor, Department of Econometrics and Operations
Research, Tilburg University, Warandelaan 2, P.O. Box 90153, 5000 LE Tilburg, The Netherlands (email:
[email protected]); and Imberman: Assistant Professor, Department of Economics, University of Houston, 204
McElhinney Hall, Houston, TX 77204-5019 (email: [email protected]). We thank Chinhui Juhn, Danielle Li, and
workshop participants at the 2010 National Academy of Education Annual Meeting and 2011 ASSA Meetings for
helpful comments and discussion. Imberman gratefully acknowledges financial support from the National Academy
of Education/Spencer Foundation Postdoctoral Fellowship. A University of Houston Small Grant was used to
purchase the data, for which we are grateful. The authors bear sole responsibility for the content of this paper.

1
I. Introduction
Increasingly, policy makers and educators have to contend with large numbers of limited
English proficient (LEP) children in U.S. public schools. Between 1998-99 and 2008-09, LEP
enrollment in pre-kindergarten to grade 12 grew 51% to 5.3 million; this accounts for 11 percent
of total enrollment, which grew only 7 percent over the same period (NCELA 2011). Lack of
proficiency in English presents a significant barrier to learning in U.S. schools, and LEP students
are observed to have poorer academic performance and higher high school dropout rates (OELA
2008). Therefore, how to help LEP students is an important question.
Two of the most common educational programs offered by school districts to help LEP
students are bilingual education (BE) and English as a Second Language (ESL). BE provides
instruction in English as well as the LEP students’ home language, while ESL is a program that
provides instruction in English only. Typically, LEP students in BE are placed in a class with
other LEP students with the same home language together with a bilingual education teacher
dedicated to that class, whereas LEP students in ESL are placed in mainstream classrooms with
pull-out time with an ESL teacher to improve their English skills. (Section II.A provides more
background on these programs.) Although a large literature attempts to evaluate educational
programs for LEP students, very few studies offer estimates with causal interpretations, and none
consider potential spillover effects to non-LEP peers. (Section II.B discusses the related
literature.) In part due to the lack of clear empirical evidence, whether to use BE or an English-
only approach such as ESL has continued to be a controversial issue in U.S. education policy.
Empirical identification of the effect of BE is difficult because a student’s exposure to BE
is not random. For example, schools that offer BE could differ systematically from schools that
do not. Also, LEP students participating in BE could differ systematically from those who do
2
not. Therefore, estimates of the effect of BE that do not take into account the potential
endogeneity of BE will not in general have causal interpretations, and instead conflate the true
program treatment effect with effects of unmeasured and unobserved attributes of the schools
and students. The innovation of this study is to use variation in student exposure to BE generated
by a policy rule in Texas governing the provision of BE to overcome these identification issues.
The policy rule stipulates that a school district offer BE when its enrollment of LEP students in a
particular elementary grade level and language is twenty or higher. This suggests a regression
discontinuity (RD) design in which the effect of BE on student achievement can be obtained by
comparing student outcomes in districts just above the 20-student cutoff (and therefore more
likely to provide BE) and student outcomes in districts just below the cutoff. Section III details
this identification strategy.
We implement this identification strategy using school panel data for two groups of students:
non-LEP non-Spanish home language students, and Spanish home language students. (Section
IV describes the data.) Focusing on school districts near the 20-Spanish-LEP-student cutoff
defined by the policy rule, we find evidence of a significant jump up in the probability that a
district offers bilingual education above the cutoff. On the other hand, we do not find any
significant jumps at the cutoff in district characteristics unrelated to BE provision, which
validates the interpretation of differences in student outcomes just above and just below the
cutoff as due to district BE provision. This leads us to implement a fuzzy RD design in which we
use variation in BE induced by the policy rule as an instrumental variable to identify the causal
impact of BE. To preview the findings, we find that BE has weak positive effects on the math
and reading standardized test scores of non-LEP non-Spanish home language students and no
effects on Spanish home language students. We are able to rule out even relatively small harmful

3
effects on non-LEP, non-Spanish home language students with 95 percent confidence. Assuming
BE spillover effects to non-LEP students are no more beneficial for students with Spanish home
language than for students without, these results imply that for Spanish home language students
ever classified as LEP do not significantly benefit from bilingual education, at least in terms of
test score achievements. These results, along with robustness checks, are reported in Section V,
and Section VI concludes.
II. Background
A. Bilingual Education in the United States
Bilingual education had existed in American schools since the colonial period.1 At their
peak in the 1880s, German-English bilingual schools served nearly half a million students in
over twenty states, and many of which were part of public school systems (Crawford 1989).
However, around World War I, due to anti-German sentiments and the association of using
foreign languages with being un-American, bilingual education disappeared from American
schools. Bilingual education did not reappear on a national scale until after the passage of the
Bilingual Education Act (BEA) in 1968. This second wave of BE programs was in large part a
response to the low educational attainment of Hispanics in the Southwest.
The Bilingual Education Act (Title VII of the Elementary and Secondary Education Act),
as it was originally passed, did not require the use of native languages and instead funded any
“new and imaginative elementary and secondary school programs designed to meet [LEP
students’] special educational needs.”2 Subsequent reauthorizations, however, did favor bilingual
education programs. BEA grants were awarded by the Department of Education on a competitive
1 Crawford (1989) provides a good history of bilingual education in the U.S., and Nieto (2009) provides a more up-
to-date summary. 2 Public Law No. 90-247, Title VII, Sec. 702, 81 Stat. 816 (1968).

4
basis, and application for these grants was strictly voluntary. These grants were temporary, and
state and local funds would be necessary to continue the educational programs for LEP students
after the grant ended.
The BEA was the first federal law expressly addressing the educational needs of LEP
students, and did so by providing school districts with a financial incentive to provide help. Later
federal laws made it a legal responsibility of school districts to provide special assistance to LEP
students. Title VI of the 1964 Civil Rights Act prohibits discrimination on the basis of race, color
or national origin in federally-assisted programs. The Office for Civil Rights (OCR) was
established in the Department of Education to enforce Title VI compliance in federal education
programs. In May 1970, the OCR issued guidelines for Title VI compliance for school districts
receiving federal funds whose national origin minority group enrollments exceeded 5 percent of
total enrollment: they had to take “affirmative steps” to help LEP children.3 Otherwise, they
would be violating Title VI (by discriminating on the basis of national origin) and risk
termination of federal financial assistance from the Department of Education.
The U.S. Supreme Court’s Lau v. Nichols decision in January 1974 made Title VI
compliance more salient to school districts. Lau was a class action suit filed originally in 1970 on
behalf of 1,800 non-English-speaking Chinese students who alleged they were being denied an
equal educational opportunity by the San Francisco Unified School District because they could
not understand the language of instruction. The Court unanimously ruled that “sink or swim”
instruction violated the Chinese students’ civil rights (under Title VI), and that the Chinese
students were entitled to special assistance. Justice Douglas, in the opinion of the Court, wrote:
“There is no equality of treatment merely by providing the same facilities, textbooks, teachers
and, curriculum; for students who do not understand English are effectively foreclosed from any
3 35 Fed. Reg. 11,595 (1970) as cited in U.S. Commission on Civil Rights (1997), p. 71.
5
meaningful education.”4
Shortly after the Lau decision, Congress passed the Equal Educational Opportunity Act
(EEOA), which basically extended Title VI compliance requirements to school districts not
receiving federal funds. The EEOA requires all school districts to “take appropriate action to
overcome language barriers that impede equal participation by its students in the instructional
programs.”5 The EEOA provides a course for private action if a school district fails to address
the educational needs of LEP students. It is enforced by the Department of Justice, not the OCR.
In 1975, recognizing that few school districts were providing any special assistance to
LEP students and bolstered by the Lau decision, the OCR launched a massive Title VI
enforcement effort. The Lau Remedies, which were guidelines to be imposed on school districts
not in compliance with Title VI under Lau, reflected the OCR’s interpretation of what
constituted “affirmative steps” to providing LEP children with an equal educational opportunity.
Although the Supreme Court did not specify in Lau what form the special assistance for LEP
students should take, the OCR decided to prescribe BE. Thus, through judicial interpretation (via
Lau) and OCR’s interpretation (via the May 1970 guidelines and Lau Remedies), compliance
with Title VI came to mean providing some form of bilingual education.
Following the passage of the BEA, and in an environment that required Title VI
compliance, individual states passed laws mandating bilingual programs using native language
instruction for LEP students. Massachusetts was the first, with a 1971 law, followed by Alaska
(1972), California (1972), Illinois (1973), Texas (1973), New York (1974), and others. The
programs mandated by these laws tended to be transitional BE programs, which have the goal of
mainstreaming the LEP students as soon as they acquire sufficient English-language skills; in the
4 As cited in Crawford (1989), p. 36.
5 Public Law No. 93-380, 88 Stat. 815 (codified as amended in 20 U.S.C. Sec. 1703(f) (1994)). “Appropriate action”
was articulated in the Castaneda v. Pickard decision by the U.S. Court of Appeals for the Fifth Circuit in 1981.

6
interim period, native language instruction is used so that the LEP students can keep up in other
subjects.6 Additionally, these laws did not require every school district to provide bilingual
education to every LEP student. Instead they specified the circumstances under which a school
district would provide BE, and these circumstances generally involved the number and
concentration of LEP students of a particular grade and of a particular language group in a school
district. For example, in Texas, school districts with at least twenty LEP students in a particular
elementary grade and language must offer bilingual education. Below, we will take advantage of
this policy rule in Texas to identify the effects of bilingual education (we detail our identification
strategy in Section III.B).
From 1968 to the late 1990s, both the number of LEP students receiving special
assistance and the number of BE programs grew dramatically. Since the late 1990s, there has
been a shift away from using bilingual education toward using English-only programs to help
LEP students. Revealingly, in 2002, the Bilingual Education Act was renamed the English
Language Acquisition, Language Enhancement, and Academic Achievement Act (Title III of the
No Child Left Behind Act). Also, several states eliminated bilingual education in public schools
through ballot initiatives: California (1998), Arizona (2000) and Massachusetts (2002).
Reflecting this shift, 40 percent of LEP students in U.S. public schools were in a BE program in
2001-02, compared to 63 percent in 1991-92 (the remainder are in English-only programs, with
the largest being ESL) (Zehler et al. 2003).
Given the high rates of immigration in recent decades, the LEP student population will
continue to grow. Moreover, given the recent settlement patterns of immigrants—increasingly
away from traditional immigrant-receiving areas—school districts that previously have not had
6 Dual language programs, whose goal is proficiency in both English and the student’s home language, are rare in
the U.S. and not the subject of this study.

7
much experience with LEP students will be encountering more LEP students. Even by 2001-02,
when the dispersion of immigrants across the U.S. was less wide than it is today, about 43
percent of school districts in the U.S. had at least one LEP student (Zehler et al. 2003). 2.6
percent of school districts with LEP students enrolled 5000 or more LEP students, collectively
accounting for 54 percent of the total number of LEP students, thus the vast majority of school
districts are contending with some, but not many, LEP students. To comply with U.S. civil rights
laws, school districts must provide educational programs to help LEP students, but history (since
1968, sometimes BE is favored and sometimes ESL and other English-only approaches are
favored) and the existing evaluations (which we discuss in the next subsection) do not provide
clear guidance for which educational programs are more effective. This study contributes by
providing new empirical evidence on the effects of bilingual education program provision
(compared to ESL program provision alone)—this is a margin which many school districts are
making decisions today.
B. Related Literature
There is a substantial body of research evaluating the effect of educational programs for
LEP students on the LEP students themselves.7 While most of these papers are correlation
studies, a few recent ones use research designs that are more convincing for identifying causal
relationships. Slavin et al. (2010) conduct a randomized evaluation in which 387 LEP
kindergartners in ten schools were randomly assigned (within school) to either bilingual
education or structured English immersion (an English-only approach). They find no significant
differences in tests measuring English skills by fourth grade, although in the earlier grades, there
7 See, for example, Baker and de Kanter (1981), Willig (1985), Rossell and Baker (1996) and Greene (1998) for
reviews. Slavin et al. (2010) off a more recent discussion of this literature.
8
are significantly lower English measures for students initially assigned to bilingual education.
Matsudaira (2005) uses a regression-discontinuity design taking advantage of a district policy
rule governing which students are classified as LEP (and therefore eligible to participate in
educational programs for LEP students, which in this district is BE or ESL). Comparing students
who scored just above and just below the cutoff on English skill assessments (with the students
just below eligible for BE/ESL services, he finds little difference in academic achievement.
Angrist, Chin, and Godoy (2008) look at policy shifts in Puerto Rico that changed the medium of
instruction from English to Spanish and find no impact on English-speaking ability in adulthood.
These three studies suggest that, while not helping LEP students, English-intensive approaches
do not seem to hurt them either.
However, what is left unanswered is the impact of educational programs for LEP students
on non-LEP students. To our knowledge, our study is the only one to address this question.
Closely related, though, are Cho (2011) and Geay, McNally and Telhaj (2011), both of which
estimate the impact of LEP students on non-LEP peers. These studies are pertinent to ours
because as we discuss in Section IV.A, one channel through which BE provision may impact
non-LEP students is through decreasing the exposure of non-LEP students to LEP students. Cho
uses within-school, and sometimes within-student, variation in having an LEP classmate found in
Early Childhood Longitudinal Study, Kindergarten Cohort, and finds that having at least one
LEP classmate is associated with lower reading test score gains between kindergarten and first
grade but no significant differences in math test score gains. The changes over time in exposure
to LEP students is likely endogenous though, and so, it is unlikely that the estimates have a
causal interpretation. Geay et al. use two distinct identification strategies—within-school
variation in cohort share that are non-native English speakers, and the increase in non-native
9
English speakers in Catholic schools following European Union enlargement—to estimate the
spillover impact on native English speakers using data from England. They do not find evidence
that non-native English speakers hurt the educational outcomes of English speakers.
Besides this study, and the aforementioned Cho and Geay et al. studies, we are not aware
of any others attempting to quantify spillover effects from LEP students to non-LEP students.
However, this study is related to the more general literature on the roles that students’ peers play
in the generation of academic outcomes. In most research on peer effects in primary and
secondary education, researchers have considered the effect of being exposed to peers with
higher or lower achievement test scores (Angrist and Lang 2004; Hanushek, Kain, Markman and
Rivkin 2003; Hoxby and Weingarth 2006; Lavy, Paserman, and Schlosser forthcoming;
Imberman, Kugler, and Sacerdote forthcoming) or who exhibit disruptive behavior (Figlio 2005;
Aizer 2008; Carrell and Hoekstra 2010). There are a handful of papers examining the impact of
immigrants on the educational attainment of natives; these studies are especially related to ours
since many immigrants are LEP when they first enter school in the U.S.8 The empirical evidence
in the U.S. is mixed. While some papers found that immigrants have a negative impact on native
high school graduation rates and college and graduate school enrollment (Betts 1998; Hoxby
1998; Borjas 2007), others found no impact on dropout rates (Liu 2000b) or small positive
effects on native test passing rates and application to top-tier colleges, at least for certain groups
(Liu 2000a; Neymotin 2009).
Our study, which exploits a policy rule governing the provision of bilingual education
programs in Texas public elementary schools to provide new evidence on the causal effect of BE
on both the intended beneficiaries (LEP students) and their classmates (non-LEP students),
8 Since only half of LEP students enrolled in US public schools are foreign-born (Zehler et al., 2003), and many
immigrant students are not LEP, the impact of LEP students on native students may well differ from the impact of
immigrant students.
10
makes several contributions. First, we add to the small handful of studies using convincing
research designs to evaluate educational programs for LEP students. We believe that the local
average treatment effect we estimate below is of particular policy relevance because many
school districts in the U.S. have some but not many LEP students, and are choosing between BE
and English-only programs like ESL. Also, to our knowledge, we are the first to consider
potential spillover effects of BE program to non-LEP students, and among the first few studies to
consider the more general issue of spillover effects of LEP students to non-LEP students. Finally,
because we are using the same identification strategy and data to estimate the effect of BE
provision on both LEP and non-LEP students, it is possible to calculate the net effects of BE
programs without comparing estimates from different settings.
III. Empirical Strategy
A. Conceptual Framework
The direction of the impact of BE programs (compared to ESL programs) on academic
achievement is theoretically ambiguous for both LEP and non-LEP students. LEP students are
the students eligible to participate in BE and ESL. The two programs are the two common
approaches offered by schools to address the learning needs LEP students, and both have some
advantages and disadvantages (e.g., use of native language instruction might delay English
acquisition, but reduce falling behind in math and other subjects while LEP student is learning
English), so which program raises LEP students’ academic performance more is ultimately an
empirical question.
Non-LEP students do not participate in BE or ESL themselves, but they may experience
spillover effects from these programs. The nature of these spillover effects likely differs by

11
program. One reason is that the two programs result in dramatically different distributions of
LEP students across classes within a grade. Mainstream classes have fewer LEP students when
BE is offered because LEP students in BE tend to be grouped together to form a separate class
while LEP students in ESL are in the same classes as non-LEP students (with ESL instruction
provided on a pull-out basis). Exposure to LEP students in class could impact non-LEP students’
academic performance through a number of mechanisms. First, teachers with LEP students in
their class may need to provide extra assistance to these students, which would take time away
from other students. Second, LEP students may be more prone to disruption due to frustration
from difficulties understanding the material taught in English. Third, to the extent that
achievement amongst LEP students is lower than the non-LEP students, there could be an
achievement peer effect which could worsen non-LEP outcomes. For example, the content may
be taught at a lower level to reach even the weaker students. Nonetheless, there are also reasons
to think that exposure to LEP students may be helpful. For example, a more diverse classroom
environment may make school more interesting and hence students could increase effort as a
result. In addition, LEP students may be more proficient along some dimensions (e.g., certain
subjects, or in terms of some non-cognitive skills) that might generate positive peer effects.
Besides through class composition, another way BE programs could generate differential
spillover effects to non-LEP students is through the school budget. BE programs tend to be more
expensive than ESL programs. Because a BE teacher is typically attached to a specific class on a
full-time basis (serving LEP students of a common home language and grade), there is little
possibility for schools to spread the cost of a BE teacher over LEP students of different home
languages and grades as they could with an ESL teacher. Thus, to pay for BE, schools may have
to reallocate resources, and this may impact non-LEP students’ academic performance. While a
12
simple story of BE programs crowding out programs for non-LEP students might suggest
negative effects, in fact schools may be changing both amount and composition of spending, so
these resource effects are ambiguous in direction.
B. Identification Strategy
Given the foregoing considerations, ultimately it is an empirical question how bilingual
education program provision affects student academic achievement. Thus we turn to our
estimation strategy. We wish to estimate the effect of exposure to bilingual education programs
on student academic achievement, which might be approximated as:
idcgidcgdcidcg XBEy επβα +++=
(1)
for student i in school district d who is a member of first grade cohort c and observed at grade g.
y is an educational outcome of interest (we will examine scores and passing rates on Texas
Assessment of Knowledge and Skills (TAKS) math and reading tests), BE is an indicator for the
student’s school district offering a bilingual education program, X is a set of student, school and
district characteristics, and ε is the error term. The parameter of interest is β, which is the effect
of student exposure to bilingual education. Note that the measure of exposure expressed in
Equation 1 is not at the individual level, but at the district-cohort level. This is natural for non-
LEP students, who are never participants in BE programs but nevertheless could experience
spillover effects from them if their school district offers it to their classmates. LEP students, on
the other hand, are eligible to participate in BE programs if their school district offers it to their
cohort but may choose not to take it up; thus, by using this district-cohort level measure of BE
availability, we are capturing an intention-to-treat effect for LEP students rather than the effect
of participation in BE. Focusing on potential exposure to BE, rather than actual take-up of BE,

13
circumvents issues concerning non-random selection of individuals into BE programs. Moreover,
the intention-to-treat effect is of direct interest for policy making, as school districts can only
control whether to offer BE—students cannot be forced to participate in BE.
Nevertheless, even the more aggregate measure of BE used in Equation 1 might be
endogenous. It is not random which school districts offer bilingual education; for example, they
may be the ones with more LEP students, more growth in LEP students, more wealth, LEP
students with especially low English proficiency, etc. Thus, estimates of β using ordinary least
squares (OLS) are unlikely to provide the causal effect of student exposure to a bilingual
program. To address this endogeneity problem, we use a regression-discontinuity approach that
exploits a unique policy rule governing whether or not districts offer bilingual education. The
State of Texas mandates provision of bilingual education in a given language and elementary
grade by a school district when the district-wide population of LEP students in that language and
elementary grade is greater than or equal to 20.9
Our empirical strategy is to compare student outcomes in districts that have slightly less
than 20 LEP students in a language-grade to those with slightly more. In practice, we will focus
only on Spanish LEP students, who represent about 90 percent of Texas’ total LEP enrollment,
because Spanish is the only language group for which there is enough variation across districts to
implement our empirical strategy.10
It is unlikely that districts with 19 Spanish LEP students
differ that much from districts with 20 Spanish LEP students, but due to the policy rule, the latter
districts must offer bilingual education, and we can take the difference in outcomes between the
9 This rule is part of Texas Administrative Code, Title 19, Part 2, Chapter 89, Subchapter BB, Rule §89.1205
(Commissioner’s Rules Concerning State Plan for Educating Limited English Proficient Students). 10
In contrast, LEP students with other home languages are by far less numerous and also more concentrated, leaving
too few observations of school districts near the 20-student cutoff for a particular language and grade. The Spanish
share of LEP students in 2001-02 is 77 percent in the U.S. (Zehler et al. 2003); given Texas’ proximity to Mexico
and Central America, it is not surprising that its Spanish share is somewhat higher.
14
districts with 20 and districts with 19 to learn about the effect of district BE provision. This
example is meant to be illustrative only, as limiting our analysis to only those districts with
exactly 19 or 20 Spanish LEP students would lead to very imprecise estimates. In implementing
our empirical strategy therefore, we expand the neighborhood around the cutoff (as we discuss in
Section IV, our main analysis will use districts with 10 to 39 Spanish LEP students). With the
wider bandwidth, it becomes possible that there exists a relationship between the number of
Spanish LEP students and the outcome that is not solely due to the policy rule. By explicitly
controlling for a smooth function in the forcing variable (number of Spanish LEP students), we
can ensure that we are only using variation due to the policy rule rather than due to some
underlying relationship. In particular, we estimate the following equation capturing the impact of
the policy rule on district BE provision:
idcgidcgdcdcdc XCountLEPfAboveCountLEPBE 11111 )_(20__ επδα ++++= (2)
for student i in school district d who is a member of first grade cohort c and observed at grade g.
BE is an indicator for the student’s school district offering a bilingual education program,
LEP_Count is the district-wide Spanish LEP student count for student i’s first grade cohort,
LEP_Count_Above20 is an indicator for the LEP count being greater than or equal to 20,
f(LEP_Count) is a polynomial in the LEP count, and X1 is a set of student, school and district
characteristics.
Below, we find that being above the 20-Spanish-LEP-student cutoff, after controlling for
X1 and a smooth function of LEP_Count, is statistically significant. We therefore proceed by
instrumenting the potentially endogenous regressor in Equation 1, BE, with
LEP_Count_Above20 (where X in Equation 1 is comprised of X1 and a smooth function of
LEP_Count) in order to obtain an estimate of β with a causal interpretation. This strategy is often

15
referred to as a fuzzy regression discontinuity design (Imbens and Lemieux 2008, Lee and
Lemieux 2009). The first-stage equation associated with the 2SLS estimation of Equation 1 is
given by Equation 2.
We will also report the results of estimating the reduced-form equation,
.)_(20__ 1 idcgidcgdcdcidcg RFRFRFRF XCountLEPfAboveCountLEPy επδα ++++= (3)
The reduced-form effect of being just above the 20-student cutoff, RFδ , indicates the effect of
increasing the likelihood of a school district offering BE. It is desirable to rescale this reduced-
form effect to obtain the interpretation of the effect of a school district offering BE, which is
what is given by the 2SLS estimate of β.
The fuzzy RD strategy identifies the local average treatment effect (LATE) for school
districts close to the 20-student cutoff. These school districts tend to be smaller, be less urban
and (of course) have fewer LEP students. Thus, the effect of a district offering BE on student
academic performance estimated in this study may not reflect the average treatment effect or
generalize to larger districts. However, it must be recognized that there are few studies that use a
convincing research design to identify the effects of BE (and none of these consider spillover
effects to non-LEP students), so our new evidence is of interest even if it is estimating a LATE.
Additionally, we believe this LATE is per se interesting because as we discussed in Section II.A,
a majority of school districts in the U.S. with any LEP students have relatively small LEP
enrollments. As immigrants increasingly settle outside of traditional immigrant-receiving places,
the number of these low-LEP-enrollment school districts will grow.
IV. Data
To implement our RD strategy, we use publicly-available data on the test scores and

16
demographic characteristics of students enrolled in Texas public elementary schools at the
school-grade-year for two student types.11
The two student types are non-LEP non-Spanish home
language students (which we will sometimes refer to as the non-LEP group below), and students
with Spanish as a home language. The latter category is comprised of students who are currently
LEP, formerly LEP (but since mainstreamed) and never LEP. In terms of Equations 1-3 then, i
indexes school-student type rather than the individual student. It is worth noting that the policy
variation we are exploiting is at the district-grade-year level, thus our data are at a less aggregate
level than the policy.
To assess whether the policy rule is binding, we must examine whether the probability of
a district offering BE increases at the 20-student cutoff. In our empirical work below, we will use
the counts of Spanish LEP students from first grade as the relevant counts for determining BE
provision. LEP status is temporary, with LEP students exiting LEP status once they have learned
English.12
Consider a district with 20 Spanish LEP students in a first grade class and hence offers
bilingual education. By the time these students reach third grade, there will likely be fewer than
20 Spanish LEP students in the cohort. Nonetheless, even though the LEP count falls, the district
would most likely still provide bilingual education.13
Given that in practice, if a given first-grade
cohort qualifies for BE, the district commits to provide it for several years, it seems appropriate
to use the LEP count in the first grade class for a student’s cohort rather than concurrent LEP
counts.
Because the policy rule specifies a 20-student cutoff, we restrict the data to districts near
11
We obtained the test score data through a public information request to the Texas Education Agency. 12
Due to mainstreaming, LEP status drops off considerably as students age. Using data on LEP counts by grade and
district acquired from the Texas Education Agency, we estimate that LEP shares in Texas fall from 11% in
kindergarten and 1st grade to only 4% by 8
th grade.
13 Texas supports a transitional BE program where LEP students are moved to mainstream classes once they acquire
sufficient English skills. Typically students stay in BE several years before attaining the English skills to be
mainstreamed, and so the district typically commits to provide BE to this cohort for this duration.

17
this cutoff. Our main analysis uses observations in districts with 10 to 39 Spanish LEP students
in a given first-grade cohort.14
We further restrict the data to smaller districts, which we define as
districts with total first-grade enrollment under 200 in the 2004-05 school year, in order to form a
more homogeneous sample of districts.15
Figure 1 maps the districts satisfying the sample criteria
just for the 2004-05 first grade cohort, and indicates that the districts in our sample are not only
located all over Texas, but also districts above the cutoff are often located next to districts below
the cutoff.16
This provides some reassurance that on the basis of geographic location, the districts
just above and just below the cutoff are comparable. We provide more formal analysis of the
comparability of students enrolled in districts above and below the cutoff in Section V.B.
We use standardized test score data for 2002-03 through 2009-10. The Texas Assessment
of Knowledge and Skills (TAKS) math and reading tests were introduced in 2002-03 (replacing
the Texas Assessment of Academic Skills), and to avoid combining student achievement
measures based on different tests, we do not use earlier test score data. Students are tested
beginning third grade, and our policy rule concerns BE provision in elementary schools, thus we
will have three grades with test score outcomes: third, fourth and fifth. We link test takers to
their first grade cohort’s district-wide number of Spanish LEP students and district-wide
provision of bilingual education, so we are using demographic data for 1998-99 to 2007-08.17
In
total, our data analysis involves twenty-four grade-year groups, which we observe for each
school and student type. Table 1 provides the means and standard deviations of the variables we
14
Our conclusions are robust to different bandwidth selections, as we show in the robustness checks of Section V.E. 15
We have used first grade enrollment totals from other years to define the set of districts to be included, and our
empirical results are unchanged. We do not impose the 200 cap on every year for sample inclusion because that
would lead to an unbalanced panel of districts to the extent that districts are experiencing enrollment growth or loss
(which could be endogenous to student test scores). 16
Our regression analysis uses other cohorts as well; we created a map for a single cohort for illustrative purposes. 17
For third grade observations, we use the first grade cohort two years prior, for fourth grade we use the first grade
cohort three years prior and for fifth grade, we use the first grade cohort four years prior. For example, for fifth
grade test takers in 2002-03, first grade cohort characteristics are taken from 1998-99.
18
use in our empirical analysis.
V. Results
A. The Discontinuity in District Provision of Bilingual Education
If the Texas Education Agency’s policy rule governing BE provision is binding, then we
should observe a discontinuity in district BE provision at the 20-student cutoff, with districts
above the cutoff having higher rates of BE provision. This is exactly what we see in Figure 2,
which plots mean share of districts providing BE by the number of Spanish LEP students.
Visually, there is a jump up at the 20-student cutoff. To more formally assess whether this
difference in BE provision below and above is statistically significant, we estimate Equation 2.
These results are reported in the first row of Panel II in Table 2 (for the sample used for
analyzing impacts on non-LEP non-Spanish home language students) and Table 3 (for the
sample used for analyzing impacts on Spanish home language students). The coefficient for
being above the cutoff is always positive and significant across the different samples, indicating
that the policy rule does induce school districts that otherwise would not offer BE to offer it. For
the samples that pool third to fifth graders, we find that districts with more than 20 Spanish LEP
students in the first grade cohort are about 26 percentage points more likely to offer bilingual
education than districts below the cutoff. This is a sizable effect—this is a 60 percent increase
over the mean for district BE provision among the school-grade-year observations below the
cutoff (which is 16 percent).
It can be noted that there is not perfect adherence to the policy rule (had this been the
case, 100 percent of districts would provide BE above the cutoff). One reason is that
participation in BE requires parental consent, and many parents choose ESL for their child even
19
when BE is available. What we are able to measure in the data is whether the district actually
does provide BE; we cannot observe when they have offered BE but there is zero take-up. A
second reason is that it is difficult to recruit certified bilingual education teachers, and school
districts are allowed to delay providing BE if they are unable to find a qualified BE teacher.
Part and parcel of district BE provision is changing the distribution of LEP students
across classes within a grade. In particular, mainstream classes have fewer LEP students when
the district provides BE because LEP students in BE form their own separate classes. Figure 3,
Panel A shows that there is a jump up in the share of LEP students participating in BE at the 20-
student cutoff. There is a corresponding jump down in the share of LEP students in ESL, as
generally in Texas, LEP students are placed in either BE or ESL. ESL students are typically
placed in mainstream classes, so this implies that the LEP share of mainstream classes jumps
down, as can be seen in Figure 3, Panel B.
As discussed in Section III.A, concomitant with district BE provision could be shifts in
resource allocations because generally BE programs cost more. The top right graph of Figure 4
shows that indeed, there is a jump up in per student school expenditures on BE/ESL program at
the 20-student cutoff (the difference at the cutoff is significant at the 10 percent level). There is
no observable jump in total program expenditures, indicating that net new revenues are not
arriving to cover the cost of BE. Nor is there any change at the cutoff in regular program
spending, which encompasses the basic instructional programs of the school (excludes the
special programs), and average class size. However, there are compositional changes in funds for
special programs—above the cutoff, we observe decreases in spending on compensatory
education and special education (the difference at the cut-off is not significant at conventional

20
levels though), but increases in spending on gifted and talented programs and BE/ESL programs
that are significant at the 10 percent level.18
To summarize, the policy rule does provide significant variation in district provision of
bilingual education for a particular first grade cohort. In interpreting the effect of district BE
provision estimated using variation induced by the rule, one of the mechanisms could be changes
in the class composition: when the district provides BE, LEP students get more exposure to other
LEP students of the same language group, and non-LEP students get less exposure to LEP
students. Other mechanisms could be school resource reallocations. There could be other
mechanisms as well (for example, there could be an impact on the quantity and quality of
instruction time, but we have no measures of this); however, changing the overall level of per
student spending does not appear to be one of these because there is no discontinuity in per
student spending at the 20-student cutoff.
B. Tests of the Validity of the Regression Discontinuity Design
As we noted before, BE programs tend to be more expensive than ESL programs,
creating incentives for school districts to manipulate their enrollment or LEP classifications to
avoid having to provide BE. If school districts have a great deal of control over their number of
LEP students, then students on one side of the threshold could be systematically different from
those on the other side, invalidating the RD design.
In order to test this, we first provide a visual check by plotting in Figure 5 the distribution
18
With regard to state funds for compensatory education programs, these funds are designated for provision of
instruction or services to students at risk of dropping out of school (poor students and LEP students are among the
at-risk groups), and the rule is that they are not to be used to fund regular programs or programs mandated by state
law. Below the 20-student cut-off, schools might receive state funds for compensatory education to provide
supplemental educational services, and above the cutoff—when BE is mandated by state law—these funds decrease
because BE encapsulates some of those services. To the extent that non-LEP at-risk students benefited from those
compensatory programs typically used by LEP students, then BE provision could have negative effects for them.
21
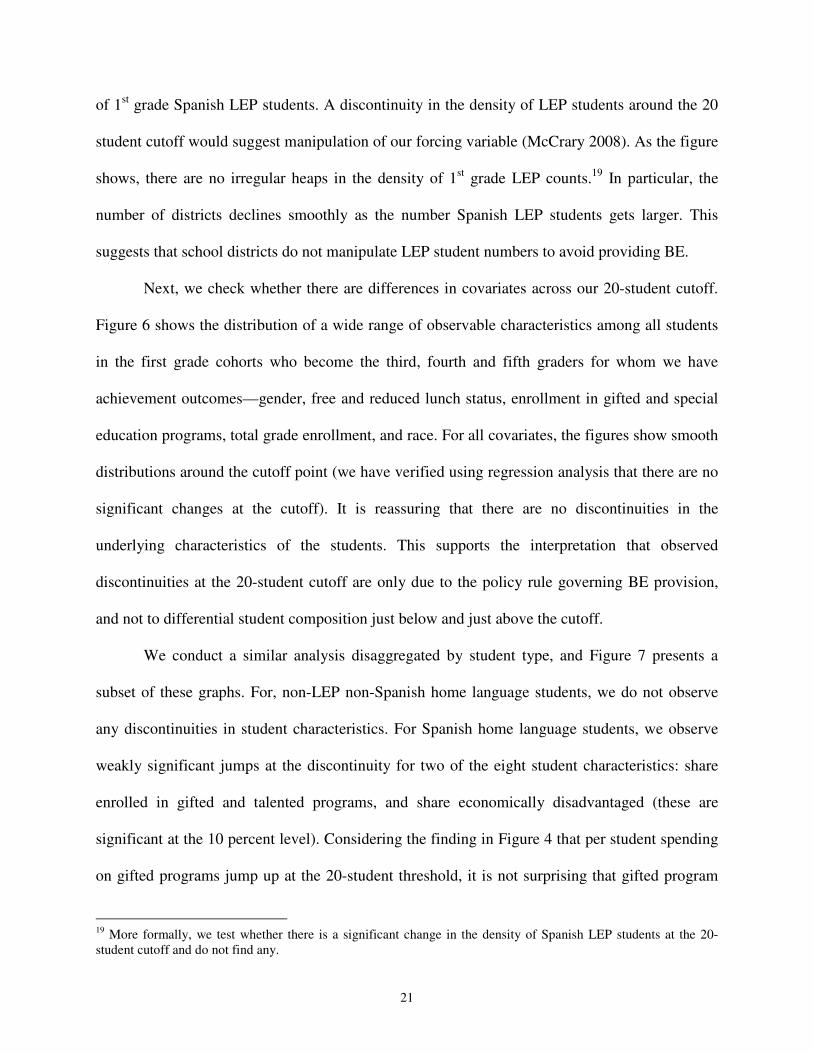
of 1st grade Spanish LEP students. A discontinuity in the density of LEP students around the 20
student cutoff would suggest manipulation of our forcing variable (McCrary 2008). As the figure
shows, there are no irregular heaps in the density of 1st grade LEP counts.
19 In particular, the
number of districts declines smoothly as the number Spanish LEP students gets larger. This
suggests that school districts do not manipulate LEP student numbers to avoid providing BE.
Next, we check whether there are differences in covariates across our 20-student cutoff.
Figure 6 shows the distribution of a wide range of observable characteristics among all students
in the first grade cohorts who become the third, fourth and fifth graders for whom we have
achievement outcomes—gender, free and reduced lunch status, enrollment in gifted and special
education programs, total grade enrollment, and race. For all covariates, the figures show smooth
distributions around the cutoff point (we have verified using regression analysis that there are no
significant changes at the cutoff). It is reassuring that there are no discontinuities in the
underlying characteristics of the students. This supports the interpretation that observed
discontinuities at the 20-student cutoff are only due to the policy rule governing BE provision,
and not to differential student composition just below and just above the cutoff.
We conduct a similar analysis disaggregated by student type, and Figure 7 presents a
subset of these graphs. For, non-LEP non-Spanish home language students, we do not observe
any discontinuities in student characteristics. For Spanish home language students, we observe
weakly significant jumps at the discontinuity for two of the eight student characteristics: share
enrolled in gifted and talented programs, and share economically disadvantaged (these are
significant at the 10 percent level). Considering the finding in Figure 4 that per student spending
on gifted programs jump up at the 20-student threshold, it is not surprising that gifted program
19
More formally, we test whether there is a significant change in the density of Spanish LEP students at the 20-
student cutoff and do not find any.

22
enrollment increases. We view the school resource allocations as an outcome of district BE
provision, so the significant impact on gifted program enrollment does not invalidate our
identification strategy.
Overall, Figures 6 and 7 suggest that underlying student characteristics are similar
between districts just below and above the cut-off.
C. Effect of Bilingual Education on Non-LEP Non-Spanish Home Language Students
The upper left graph of Figure 8 reports the average standardized math achievement score
for non-LEP, non-Spanish home language students in grades 3-5. The graph shows slightly
higher achievement among students in schools located in districts above the cutoff. A similar
increase can be seen in a comparison of math passing rates of non-LEP students in districts to the
left and to the right of the cutoff (see upper right graph of Figure 8). A similar pattern is found
for the reading test outcomes: The lower two graphs of Figure 8 show relatively higher
achievement and passing rates for students in districts with more than 20 Spanish LEP students
in first grade cohorts.
Table 2 provides results from a formal evaluation of the achievement and passing rate
difference around the cutoff, as described in section III.B. Each cell of Table 2 represents a
coefficient from a separate regression. In Columns 1 to 4, we provide results for math test
outcomes from the pooled sample (Column 1), as well as separately for each grade (Columns 2
to 4). Columns 5 to 8 follow the same structure for reading test outcomes.
In Panel A, we report results from the reduced-form relationship between student
outcomes and the forcing variable, i.e. the coefficient estimaties of RFδ in Equation 3. The
coefficient in the first row of Column 1 indicates that non-LEP students in schools in districts
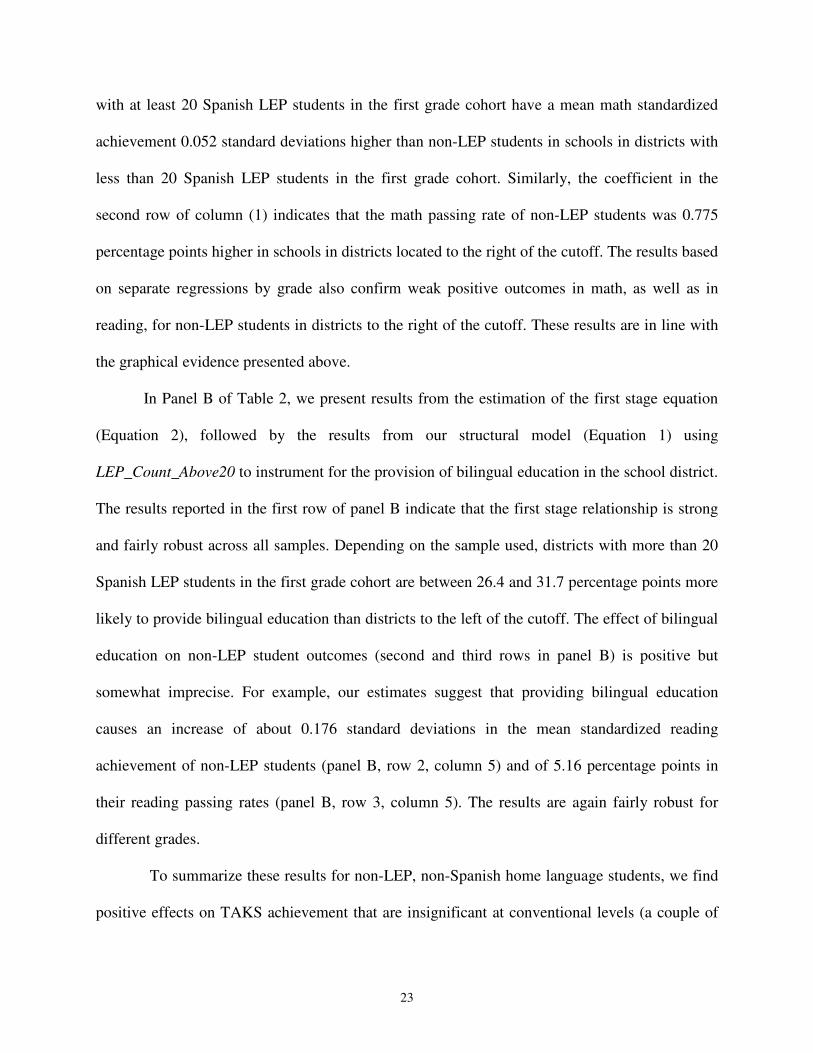
23
with at least 20 Spanish LEP students in the first grade cohort have a mean math standardized
achievement 0.052 standard deviations higher than non-LEP students in schools in districts with
less than 20 Spanish LEP students in the first grade cohort. Similarly, the coefficient in the
second row of column (1) indicates that the math passing rate of non-LEP students was 0.775
percentage points higher in schools in districts located to the right of the cutoff. The results based
on separate regressions by grade also confirm weak positive outcomes in math, as well as in
reading, for non-LEP students in districts to the right of the cutoff. These results are in line with
the graphical evidence presented above.
In Panel B of Table 2, we present results from the estimation of the first stage equation
(Equation 2), followed by the results from our structural model (Equation 1) using
LEP_Count_Above20 to instrument for the provision of bilingual education in the school district.
The results reported in the first row of panel B indicate that the first stage relationship is strong
and fairly robust across all samples. Depending on the sample used, districts with more than 20
Spanish LEP students in the first grade cohort are between 26.4 and 31.7 percentage points more
likely to provide bilingual education than districts to the left of the cutoff. The effect of bilingual
education on non-LEP student outcomes (second and third rows in panel B) is positive but
somewhat imprecise. For example, our estimates suggest that providing bilingual education
causes an increase of about 0.176 standard deviations in the mean standardized reading
achievement of non-LEP students (panel B, row 2, column 5) and of 5.16 percentage points in
their reading passing rates (panel B, row 3, column 5). The results are again fairly robust for
different grades.
To summarize these results for non-LEP, non-Spanish home language students, we find
positive effects on TAKS achievement that are insignificant at conventional levels (a couple of

24
estimates are significant at the 10 percent level (and more are at the 20 percent level)). Even
though these 2SLS estimates are somewhat imprecise, and we cannot reject the null hypothesis
that they are zero at conventional levels, we are able to reject even relatively small negative
effects on non-LEP, non-Spanish home language. The 95 percent confidence interval for the
pooled effect on mean math score of 0.176 (Panel A, Column 1, second row) is [-0.05, 0.44], and
that for the pooled standardized reading score of 0.196 (Panel A, Column 5, second row) is [-
0.02, 0.37]. Thus, we can reject at the 5 percent significant level that district BE provision
lowered mean math scores by more than 0.05 standard deviations, or that district BE provision
lowered mean reading scores by more than 0.02 standard deviations.
D. Effect of Bilingual Education on Spanish Home Language Students
In Figure 9 and Table 3, we conduct a similar exercise for Spanish home language
students, who are comprised of currently LEP, previously LEP and never LEP students. Figure
10 plots the mean achievement and passing grades in math and reading for Spanish home
language students as a function of the number of Spanish LEP students in the first grade cohort
in the district. The graphs show a similar pattern as in the case of non-LEP students, with
students in districts to the right of the cutoff having slightly better outcomes than students in
districts to the left of the cutoff, though the impact seems much smaller as compared to that on
non-LEP students.
Table 3 presents the estimation results. The table is structured in the same way as Table
2. The reduced-form estimates, reported in Panel A, are generally smaller than those for the non-
LEP students and sometimes negative, suggesting that the performance of Spanish home
language students is not significantly different in districts to the left or to the right of the cutoff.

25
This confirms the visual evidence from Figure 9.
The results presented in Panel B provide causal effects of the BE programs on student
outcomes. The 2SLS estimates are smaller than in the case of non-LEP students and sometimes
negative, though also more imprecisely estimated. Overall, these results indicate that district BE
provision does not benefit Spanish home language students, at least in terms of test score
achievements.
While these estimates do not directly provide estimates of the effect of district BE
provision on Spanish home language students ever classified as LEP (and therefore potential
participants in BE and ESL programs)—many students with Spanish as a home language are
never classified as LEP—it is possible to get a back-of-the-envelope estimate based on our
results.20
On the one hand, if we assume that the effect of district BE provision is the same across
all students never classified as LEP, regardless of whether Spanish is a home language, then the
effect for Spanish home language students is simply a weighted average of the effect we
estimated for non-LEP, non-Spanish home language students and the effect on ever-LEP Spanish
home language students.21
In our sample, 40 percent of Hispanics are classified as LEP in first
grade, and applying these weights, we get a point estimate of -0.36 standard deviations as the
effect of district BE provision on the math and reading mean achievement of ever-LEP Spanish
home language students.
On the other hand, to the extent that the spillover effect of district BE provision for
never-LEP Spanish home language students is less than what we estimated for non-LEP, non-
20
We are unable to directly estimate this because we do not have separate test score data on students who are
currently non-LEP but had previously been classified as LEP. While we do have data on Spanish home language
students by current LEP status, we have chosen to combine them in order to avoid difficulties in interpreting results
due to endogenous mainstreaming of students. 21
The weights would be the share of Spanish home language students who are never-LEP and ever-LEP,
respectively.

26
Spanish home language students, then the point estimate becomes less negative. Under the
assumption that the spillover effect of district BE program provision is zero for never-LEP
Spanish home language students, then the implied effect of district BE provision on ever-LEP
students is -0.07 standard deviations for math score and -.09 for reading score. Not every ever-
LEP student enrolls in BE when it is available—the previous estimates are intention-to-treat
estimates—and if we wanted to recover the effect of student participation in BE, we would
rescale the reduced-form effect by the change in BE participation induced by the policy rule.
Thus the implied effect of student participation in BE would be larger in magnitude than the
intention-to-treat effects. Obviously considering the imprecision of the source estimates, we must
recognize the very wide confidence intervals around these point estimates.
E. Robustness Checks
Table 4 reports the results of several specification and robustness checks. Each cell
represents a separate regression. In Columns 1 to 4, we provide results for math and reading test
outcomes of non-LEP students from the pooled sample. The remaining columns follow the same
structure for Spanish home language student test outcomes. The first row reproduces the baseline
reduced form estimates for reference (see Panel A, Columns 1 and 5 of Tables 2 and 3).
In row 2, we check the sensitivity of the estimates to the inclusion of covariates. If the
rule with respect to the provision of bilingual education provides truly exogenous variation
around the cutoff, then the inclusion of control variables should improve the precision of the
estimates, but should not change the estimated coefficients. For that reason, we check the
sensitivity of our estimates to the exclusion of controls from the baseline equation. The results
indicate that our baseline estimates are robust to the exclusion of all controls.

27
In rows 3 and 4, we check the sensitivity of the estimates to the way we have treated
masked values in the data. For our Spanish LEP student count data, values are masked when the
number is between 1 and 4. In our main analysis, we assigned the average value of 2.5 to those
district first grade cohorts with masked values, and here we assign the minimum and maximum
values. The results are qualitatively similar with the different imputation, and in fact the reduced-
form effects on non-LEP students’ mean math and reading test scores now tend to be significant
at the 10 percent level.
Our baseline model assumes that the underlying regression model is linear in the forcing
variable (the number of Spanish LEP students in the first grade cohort). To the extent that this
functional form is misspecified, the RD design leads to a bias in the treatment effect. In rows 5
and 6, we test the sensitivity of our results to the assumed functional form of the forcing variable
by choosing polynomials of different degrees. The estimates are generally similar whether we
use a linear, quadratic or cubic functional form.
Next, we next check the sensitivity of our estimates to the chosen bandwidth. Our
baseline results use a bandwidth of 10 Spanish LEP students in the first grade cohort to the left
and 20 to the right of the 20-student cutoff. In row 7, we restrict the bandwidth to 10 Spanish
LEP students on each side of the cutoff, while in row 8 we increase the bandwidth to 15 students
to the left and 30 to the right of the cutoff. In all cases, the results are quantitatively and
qualitatively similar to our baseline results, with an increase in precision due to the larger
samples.
In our baseline estimates we used school districts with fewer than 200 students in 2004-
2005. Finally, in rows 9 and 10 we check whether our sample selection rule has any influence on
our estimates by changing the “baseline” year and restricting the sample to school districts with
28
fewer than 200 students 2000-2001 (row 9) or in 2008-2009 (row 10). The results in both rows
are very similar to our baseline estimates, suggesting that our results are not due to our sample
selection rule.
V. Conclusion
In this paper, we examine the effects of BE programs (versus ESL programs alone) on
the achievement of intended beneficiaries (LEP students) and their classmates (non-LEP
students). In order to address a potential bias due to the endogeneity in the provision of BE
programs, we exploit the plausibly exogenous variation in student exposure to BE generated by a
policy rule in Texas. The policy rule requires that school districts provide BE when they have 20
or more LEP students in a particular elementary school grade and language. This motivates our
identification strategy, which is a regression discontinuity (RD) design in which we compare
student outcomes in districts that have slightly less than 20 LEP students in a language-grade to
those with slightly more. Using panel data from Texas public elementary schools for 1998-99 to
2009-10, we find that BE has weak positive effects on the standardized test scores of non-LEP
students but no significant effects on LEP students themselves. We are able to rule out even
relatively small harmful effects on non-LEP, non-Spanish home language students with 95
percent confidence.
Given the high rates of low-skilled immigration in recent decades and the dispersion in
settlement patterns of immigrants away from traditional immigrant-receiving areas, the issue of
how to help LEP students is likely to keep its place at the center stage of policy debates. Our
results contribute to this debate by providing a convincing research design to evaluate the
relative merits of BE programs compared to ESL programs alone – a question relevant to many

29
school districts. Our findings also have insights for drawing a more complete picture of the net
benefits of these programs as we examine potential spillover effects of BE programs to non-LEP
students and suggest that any cost-benefit analysis on the value of BE should take these
spillovers into account.

30
References
Aizer, Anna. “Peer Effects and Human Capital Accumulation: The Externalities of ADD.”
NBER Working Paper No. 14354. Cambridge, MA: National Bureau of Economic Research,
2008.
Angrist, Joshua, Aimee Chin and Ricardo Godoy. “Is Spanish-only Schooling Responsible for
the Puerto Rican Language Gap?” Journal of Development Economics 85(1-2) 2008: 105-128.
Angrist, Joshua and Kevin Lang. “Does Schooling Integration Generate Peer Effects? Evidence
from Boston’s Metco Program.” American Economic Review, 94(5) 2004: 1613-1634.
Baker, K.A. and A.A. de Kanter. Effectiveness of Bilingual Educational: A Review of the
Literature. Washington, D.C.: Office of Planning, Budget and Evaluation, U.S. Department of
Education, 1981.
Betts, Julian R. “Educational Crowding Out: Do Immigrants Affect the Educational Attainment
of American Minorities?” in Daniel S. Hamermesh and Frank D. Bean (eds.), Help or
Hindrance? The Economic Implications of Immigration for African-Americans. New York:
Russell Sage Foundation, 1998.
Borjas, George. “Do Foreign Students Crowd Out Native Students from Graduate Programs?” in
Paula E. Stephan and Ronald G. Ehrenberg, eds., Science and the University (Science and
Technology in Society). Wisconsin: University of Wisconsin Press, 2007.
Carrell, Scott, and Mark Hoekstra. “Externalities in the Classroom: How Children Exposed to
Domestic Violence Affect Everyone’s Kids,” American Economic Journal: Applied Economics,
2(1) 2010: 211-228.
Cho, Rosa. “Are there Peer Effects Associated with Having English Language Learner (ELL)
Classmates?: Evidence from the Early Childhood Longitudinal Study Kindergarten Cohort (ECLS-
K).” Brown University, mimeo, 2011.
Crawford, James. Bilingual Education: History, Politics, Theory and Practice. Trenton, NJ:
Crane Publishing Company, Inc., 1989.
Figlio, David. “Boys Named Sue: Disruptive Children and Their Peers.” NBER Working Paper
No. 11277. Cambridge, MA: National Bureau of Economic Research, 2005.
Geay, Charlotte, Sandra McNally and Shqiponja Telhaj. “Non-native Speakers of English in the
Classroom: What are the Effects on Pupil Performance?” London School of Economics Centre
for Economic Performance, mimeo, 2011.
Greene, Jay P. “A Meta-Analysis of the Effectiveness of Bilingual Education.” Tomas Rivera
Policy Institute, 1998.
31
Gould, Eric D., Victor Lavy, and M. Daniele Paserman. “Does Immigration Affect the Long-
Term Educational Outcomes of Natives? Quasi-Experimental Evidence.” Economic Journal,
119(540) 2009: 1243-1269.
Hahn, Jinyong, Petra Todd and Wilbert van der Klaauw. “Identification and Estimation
of Treatment Effects with a Regression-Discontinuity Design.” Econometrica, 69(1) 2001: 201-
209.
Hanushek, Eric, John Kain, Jacob Markman, and Steven Rivkin. “Does Peer Ability Affect
Student Achievement?” Journal of Applied Econometrics, 18(5) 2003: 527-544.
Hoxby, Caroline M. “The Effects of Class Size On Student Achievements: New Evidence From
Population Variation.” Quarterly Journal of Economics, 115(4) 2000a: 1239-1285.
Hoxby, Caroline M. “Peer Effects in the Classroom: Learning from Gender and Race Variation,”
NBER Working Paper No. 7867. Cambridge, MA: National Bureau of Economic Research,
2000b.
Hoxby, Caroline M. “Do Immigrants Crowd Disadvantaged American Natives out of Higher
Education?” in Daniel S. Hammermesh and Frank D. Bean (eds.), Help or Hindrance? The
Economic Implications of Immigration for African-Americans. New York: Russell Sage
Foundation, 1998.
Hoxby, Caroline and Gretchen Weingarth. “Taking Race Out of the Equation: School
Reassignment and the Structure of Peer Effects” Presented at the 2006 American Economics
Association Annual Meetings at http://www.aeaweb.org/annual_mtg_papers/2006/
0108_1300_0803.pdf, 2006.
Imbens, Guido and Thomas Lemieux. “Regression Discontinuity Designs: A Guide to Practice.”
Journal of Econometrics, 142(2) 2008: 615 - 635.
Imberman, Scott, Adriana Kugler, and Bruce Sacerdote. “Katrina’s Children: Evidence on the
Structure of Peer Effects from Hurricane Evacuees.” Forthcoming in American Economic
Review.
Lavy, Victor, Daniele Paserman and Analia Schlosser. “Inside the Black Box of Ability Peer
Effects: Evidence from Variation in High and Low Achievers in the Classroom.” Forthcoming in
Economic Journal.
Lee, David S. and Thomas Lemieux. “Regression Discontinuity Designs in Economics.” NBER
Working Paper No. 14723. Cambridge, MA: National Bureau of Economic Research, 2009.
Liu, Samuel T. Essays on the Effects of Immigration on Education and Crime. Ph.D. thesis, MIT,
2000.

32
Matsudaira, Jordan D. “Sinking or Swimming? Evaluating the Impact of English Immersion
versus Bilingual Education on Student Achievement.” University of California, Berkeley,
mimeo, 2005.
McCrary, Justin. “Manipulation of the Running Variable in the Regression Discontinuity Design:
A Density Test.” Journal of Econometrics, 142(2) 2008: 698-714.
National Clearinghouse for English Language Acquisition (NCELA). “The Growing Numbers of
English Learner Students 1998/99-2008/09.” Washington D.C.: U.S. Department of Education
Office of English Acquisition mini-poster, February 2011.
Neymotin, Florence. “Immigration and its Effect on the College-Going Outcomes of Natives.”
Economics of Education Review 28, 2009: 538-550.
Nieto, Diego. “A Brief History of Bilingual Education in the United States.” Perspectives on
Urban Education Spring 2009: 61-72.
Office of English Language Acquisition , Language Enhancement, and Academic Achievement
for Limited English Proficient Students (OELA). Biennial Report to Congress on the
Implementation of the Title III State Formula Grant Program, School Years 2004–06.
Washington, DC: Department of Education, 2008.
Rossell, Christine H. and Keith Baker. “The Educational Effectiveness of Bilingual Education.”
Research in the Teaching of English 30 (February 1996), 7-74.
Slavin, Robert E., Nancy Madden, Margarita Calderón, Anne Chamberlain and Megan
Hennessy. “Reading and Language Outcomes of a Five-Year Randomized Evaluation of
Transitional Bilingual Education.” Educational Evaluation and Policy Analysis 33(1) 2011: 47-
58.
U.S. Commission on Civil Rights, A Better Chance to Learn: Bilingual Bicultural Education,
U.S. Commission on Civil Rights Clearinghouse Publication No. 51, 1975.
Willig, Ann C. “Meta-Analysis of Selected Studies on the Effectiveness of Bilingual Education.”
Review of Educational Research 55 (Fall 1985), 269-317.
Zehler, Annette M., Howard L. Fleischman, Paul J. Hopstock, Todd G. Stephenson, Michelle L.
Pendzick and Saloni Sapru, Descriptive Study of Services to LEP Students and LEP Students
with Disabilities, Volume IA Research Report – Text, Washington, DC: Department of
Education, 2003.

Figure 1: Texas School Districts with 10-39 Spanish LEP Students in the 2004-05 First Grade Cohort

.4.6
.81
Dis
tric
t H
as A
ny
Bili
ng
ua
l S
tude
nts
in 1
st G
rade
1998-99 through 2007-08
Figure 2: District Has a Bilingual Program in 1st Grade0
.2
Dis
tric
t H
as A
ny
Bili
ng
ua
l S
tude
nts
in 1
st G
rade
10 15 20 25 30 35 401st Grade District-wide Spanish LEP Count
Limited to districts with fewer than 200 students in 1st Grade in 2004. The school-year is the unitof observation.

Figure 3: Impact on Class Composition
Panel B: % of Regular Class Students in 1st Grade in ESL
020
40
60
80
100
Mean 1
st G
rade B
E a
s a
% o
f LE
P in D
istr
ict-G
rade
10 12 14 16 18 20 22 24 26 28 30 32 34 36 38 401st Grade District-wide Spanish LEP Count
Limited to districts with fewer than 200 students in 1st Grade in 2004. The school-year is the unitof observation.
1998-99 through 2007-08
Panel A: % of LEP Students in 1st Grade in BE0
51
01
52
0
Me
an
1st G
rade
% E
SL
in R
egu
lar
Cla
sses in
Dis
tric
t-G
rad
e
10 15 20 25 30 35 401st Grade District-wide Spanish LEP Count
Limited to districts with fewer than 200 students in 1st Grade in 2004. The school-year is the unitof observation.
1998-99 through 2007-08
Panel B: % of Regular Class Students in 1st Grade in ESL

Figure 4: Impact on Resource Allocations and Class Size
250
03
00
03
50
04
00
04
50
0M
ean
Pe
r-pu
pil
Re
gu
lar
Pro
gra
m S
pe
nd
ing
in S
cho
ol
10 15 20 25 30 35 40District-Grade Spanish LEP Count in 1st Grade
Regular Program Spending4
50
05
00
05
50
06
00
06
50
0M
ean
Pe
r-pu
pil
All
Pro
gra
m E
xpe
nd
iture
s in
Sch
oo
l
10 15 20 25 30 35 40District-Grade Spanish LEP Count in 1st Grade
All Program Expenditures
2500
3000
3500
4000
Mean P
er-
pupil
Regula
r P
rogra
m S
pendin
g in S
chool
10 15 20 25 30 35 40District-Grade Spanish LEP Count in 1st Grade
Regular Program Spending
0100
200
300
400
Mean P
er-
pupil
Bili
ngual/E
SL P
rogra
m S
pendin
g in S
chool
10 15 20 25 30 35 40District-Grade Spanish LEP Count in 1st Grade
Bilingual/ESL Program Spending4000
4500
5000
5500
6000
Mean P
er-
pupil
All
Pro
gra
m E
xpenditure
s in S
chool
10 15 20 25 30 35 40District-Grade Spanish LEP Count in 1st Grade
All Program Expenditures
020
40
60
80
Mean P
er-
pupil
Gifte
d &
Tale
nte
d S
pendin
g in S
chool Gifted & Talented Expenditures
400
500
600
700
800
Mean P
er-
pupil
Specia
l E
ducation S
pendin
g in S
chool Special Education Expenditures
500
1000
1500
2000
Mean P
er-
pupil
Specia
l E
ducation S
pendin
g in S
chool Compensatory Education Expenditures
Notes: Some values may exceed or end up below the maximum value (e.g. above 100% or below 0 students) due to approximation of masked values. Sample covers
schools from 2004-05 through 2007-08 with 1st grades in non-LEP, non-Spanish language Sample. We limit to 2004-05 and later here as expenditure data is only available
after this date and class-size data is incomplete prior to 2003-04.
Mean P
er-
pupil
Gifte
d &
Tale
nte
d S
pendin
g in S
chool
10 15 20 25 30 35 40District-Grade Spanish LEP Count in 1st Grade
400
Mean P
er-
pupil
Specia
l E
ducation S
pendin
g in S
chool
10 15 20 25 30 35 40District-Grade Spanish LEP Count in 1st Grade
Mean P
er-
pupil
Specia
l E
ducation S
pendin
g in S
chool
10 15 20 25 30 35 40District-Grade Spanish LEP Count in 1st Grade
16
17
18
19
20
21
Mean 1
st G
rade C
lass S
ize
10 15 20 25 30 35 40District-Grade Spanish LEP Count in 1st Grade
1st Grade Class Size

.04
.06
.08
.1D
en
sity
1998-99 through 2007-08
Figure 5: Distribution of District 1st Grade LEP Counts0
.02
.04
10 15 20 25 30 35 401st Grade District-wide Spanish LEP Count
Limited to districts with fewer than 200 Students in 1st Grade in 2004

Figure 6: Relationship Betweeen 1st Grade District LEP Counts & 1st Grade Student Characteristics - All Students44
46
48
50
52
Mean %
Fem
ale
in G
rade
10 15 20 25 30 35 40District-Grade Spanish LEP Count in 1st Grade Cohort
Female
80
100
120
140
160
Mean E
nro
llment in
Gra
de
10 15 20 25 30 35 40District-Grade Spanish LEP Count in 1st Grade Cohort
Enrollment
68
10
12
14
16
Mean %
Specia
l E
d in G
rade
10 15 20 25 30 35 40
Special Education
12
34
5
Mean %
G&
T in G
rade
10 15 20 25 30 35 40District-Grade Spanish LEP Count in 1st Grade
Gifted & Talented
60
65
70
75
80
Mean %
Econom
ically
Dis
advanta
ged in G
rade
10 15 20 25 30 35 40District-Grade Spanish LEP Count in 1st Grade
Economically Disadvantaged
Notes: Some values may exceed or end up below the maximum value (e.g. above 100% or below 0 students) due to
approximation of masked values. Sample covers schools from 1998-99 through 2007-08 with 1st grades in non-LEP, non-
Spanish language sample.
10
20
30
40
50
Mean %
White in G
rade
10 15 20 25 30 35 40District-Grade Spanish LEP Count in 1st Grade Cohort
White
40
50
60
70
80
90
Mean %
His
panic
in G
rade
10 15 20 25 30 35 40District-Grade Spanish LEP Count in 1st Grade Cohort
Hispanic
05
10
15
20
Mean %
Bla
ck in G
rade
10 15 20 25 30 35 40District-Grade Spanish LEP Count in 1st Grade Cohort
Black80
100
Mean E
nro
llment in
Gra
de
10 15 20 25 30 35 40District-Grade Spanish LEP Count in 1st Grade Cohort
68M
ean %
Specia
l E
d in G
rade
10 15 20 25 30 35 40District-Grade Spanish LEP Count in 1st Grade

Figure 7: Relationship Betweeen 1st Grade District LEP Counts & 1st Grade Student Characteristics
A. Non-LEP, Non-Spanish Home Language Students
B. Spanish Home Language Students
40
45
50
55
Mean %
Fem
ale
in G
rade
10 15 20 25 30 35 40District-Grade Spanish LEP Count in 1st Grade Cohort
Female
24
68
Mean %
Gifte
d in G
rade
10 15 20 25 30 35 40District-Grade Spanish LEP Count in 1st Grade Cohort
Gifted
55
60
65
70
75
80
Mean %
Econom
ically
Dis
advanta
ged in G
rade
10 15 20 25 30 35 40District-Grade Spanish LEP Count in 1st Grade Cohort
Econoimcally Disadvantaged
50
55
60
Mean %
Fem
ale
in G
rade
Female
23
4M
ean %
Gifte
d in G
rade
Gifted
85
90
95
Mean %
Econom
ically
Dis
advanta
ged in G
rade
Econoimcally Disadvantaged
Notes: Some values may exceed or end up below the maximum value (e.g. above 100% or below 0 students) due to approximation of
masked values. Uses schools from 1998-99 through 2007-08 with 1st grades in the relevant sample.
40
45
Mean %
Fem
ale
in G
rade
10 15 20 25 30 35 40District-Grade Spanish LEP Count in 1st Grade Cohort
1M
ean %
Gifte
d in G
rade
10 15 20 25 30 35 40District-Grade Spanish LEP Count in 1st Grade Cohort
75
80
Mean %
Econom
ically
Dis
advanta
ged in G
rade
10 15 20 25 30 35 40District-Grade Spanish LEP Count in 1st Grade Cohort

Figure 8: TAKS Performance for Non-LEP, Non-Spanish Home Language Students
3rd - 5th Grade, 2002-03 through 2009-10-.
3-.
2-.
10
Me
an
Sco
re (
Sta
nd
ard
De
via
tion
s)
10 12 14 16 18 20 22 24 26 28 30 32 34 36 38 40Spanish LEP Count in 1st Grade Cohort
TAKS Mean Math Achievement
70
75
80
85
90
% M
eetin
g S
tand
ard
10 12 14 16 18 20 22 24 26 28 30 32 34 36 38 40Spanish LEP Count in 1st Grade Cohort
TAKS Mean Math Pass Rate
.1
TAKS Mean Reading Achievement
90
TAKS Mean Reading Pass Rate
-.3
-.2
-.1
0.1
Me
an
Sco
re (
Sta
nd
ard
De
via
tion
s)
10 12 14 16 18 20 22 24 26 28 30 32 34 36 38 40Spanish LEP Count in 1st Grade Cohort
TAKS Mean Reading Achievement
75
80
85
90
% M
ee
tin
g S
tan
dard
10 12 14 16 18 20 22 24 26 28 30 32 34 36 38 40Spanish LEP Count
TAKS Mean Reading Pass Rate

Figure 9: TAKS Performance for Students with Spanish Home Language
3rd - 5th Grade, 2002-03 through 2009-10
80
TAKS Mean Reading Pass Rate
-.3
TAKS Mean Reading Achievement
60
65
70
75
80
% M
eetin
g S
tand
ard
10 12 14 16 18 20 22 24 26 28 30 32 34 36 38 40Spanish LEP Count in 1st Grade Cohort
TAKS Mean Math Pass Rate
-.6
-.5
-.4
-.3
-.2
Me
an
Sco
re (
Sta
nd
ard
De
via
tion
s)
10 12 14 16 18 20 22 24 26 28 30 32 34 36 38 40Spanish LEP Count in 1st Grade Cohort
TAKS Mean Math Achievement
60
65
70
75
80
% M
eetin
g S
tand
ard
10 12 14 16 18 20 22 24 26 28 30 32 34 36 38 40Spanish LEP Count
-.7
-.6
-.5
-.4
-.3
Me
an
Sco
re (
Sta
nd
ard
De
via
tion
s)
10 12 14 16 18 20 22 24 26 28 30 32 34 36 38 40Spanish LEP Count in 1st Grade Cohort
% White 41.6 % Special Education 1.3
(24.1) (5.8)
% Hispanic 49.7 % Gifted 13.9
(26.6) (9.9)
% Black 7.8 TAKS Math Standardized Scale Score, -0.09
(10.7) Non-LEP, Non-Spanish Home Language (0.35)
% Economically Disadvantaged 64.8 TAKS Math Passing Rate, 79.7
(16.6) Non-LEP, Non-Spanish Home Language (14.0)
% LEP 14.8 TAKS Reading Standardized Scale Score, -0.04
(10.5) Non-LEP, Non-Spanish Home Language (0.32)
% Bilingual 5.9 TAKS Reading Passing Rate, 82.6
(3.4) Non-LEP, Non-Spanish Home Language (12.3)
% White 40.53 % Special Education 1.12
(24.0) (5.5)
% Hispanic 50.81 % Gifted 15.0
(26.6) (11.1)
% Black 7.8 TAKS Math Standardized Scale Score, -0.38
(10.7) Spanish Home Language (0.41)
% Economically Disadvantaged 66.0 TAKS Math Passing Rate, 71.521
(16.2) Spanish Home Language (20.5)
% LEP 15.9 TAKS Reading Standardized Scale Score, -0.48
(11.6) Spanish Home Language (0.39)
% Bilingual 5.8 TAKS Reading Passing Rate, 70.9
(3.4) Spanish Home Language (20.3)
† At-risk is only available for school-wide statistics in 2004-05 and later.
Standard deviation is reported in parentheses below each variable's mean. Each school-grade-year for
grades 3 through 5 is a separate observation. Limited to observations in districts with fewer than 200
students in the 1st grade cohort in 2004 and district-grades with between 10 and 39 Spanish LEP
students in its 1st grade cohort.
# of Districts 213
Table 1 - School Characteristics
2002-03 through 2009-10
B. Spanish Home Language Sample
Observations (School-Grade-Year) 2716
# of Schools 334
Observations (School-Grade-Year) 3019
349
215# of Districts
# of Schools
A. Non-LEP, Non-Spanish Home Language Sample

Pooled 3rd Grade 4th Grade 5th Grade Pooled 3rd Grade 4th Grade 5th Grade
(1) (2) (3) (4) (5) (6) (7) (8)
Mean Standardized Achievement 0.052 0.099 0.025 0.067* 0.046* 0.052 0.032 0.047
(0.031) (0.078) (0.039) (0.039) (0.025) (0.067) (0.031) (0.030)
Passing Rate 0.775 2.845 -0.688 1.798 1.348 2.330 1.286 1.357
(1.073) (2.890) (1.298) (1.611) (0.909) (2.302) (1.192) (1.224)
1st Stage, OLS coefficient for 0.264*** 0.317*** 0.267*** 0.281*** 0.261*** 0.317*** 0.267*** 0.272***
1st Grade LEP Count >= 20 (0.059) (0.098) (0.064) (0.063) (0.059) (0.098) (0.064) (0.063)
2nd Stage - Mean Standardized Achievement 0.196 0.287 0.095 0.237 0.176* 0.248 0.118 0.172
(0.127) (0.176) (0.146) (0.155) (0.100) (0.155) (0.117) (0.117)
2nd Stage - Passing Rate 2.934 6.601 -2.573 6.404 5.160 6.561 4.811 4.992
(4.145) (6.444) (4.906) (6.083) (3.714) (5.008) (4.661) (4.708)
Observations 3,017 1,039 1,003 975 3,019 1,039 1,003 977
Observations are at the school-grade-year level for the 2002-03 through 2009-10 school years, and limited to those in districts with fewer than 200 students in the 1st
grade cohort in 2004 and district-grades with between 10 and 39 Spanish LEP students in its 1st grade cohort. Hence, for 3rd grade observations we use the 1st grade
cohort two years prior, for 4th grade we use the 1st grade cohort 3 years prior and for 5th grade, we use the 1st grade cohort 4 years prior. For "mean standardized
scale scores" we take the average scale score among non-LEP, non-Spanish home language students in the school-grade-year unit and convert to standard deviation
units using the state-wide mean and standard deviation. For "mean passing rate" we use the percent of all non-LEP non-Spanish home language students in each
school-grade-year unit who achieve a passing score on the TAKS exam. In our data, any value that refers to fewer than 5 students is masked. Hence we replace all
masked values for controls with 2.5 students. We drop observations with masked values for achievement. Regressions control for district-wide Spanish LEP count in
the relevant 1st grade cohort, district-wide Spanish LEP count interacted with being above 20 Spanish LEP, grade-year fixed effects, the % of students in the
analyzed category in a school-grade-year who are female or economically disadvantaged, and the % of the school-grade-year overall who are female, economically
disadvantaged, white, black and Hispanic. *, ** and *** denote significance at the 10%, 5% and 1% levels, respectively.
I. Math II. Reading
Table 2 - Estimates of Effect of Providing Bilingual Education on TAKS Achievement for
Non-LEP, Non-Spanish Home Language Students
B. 2SLS - Endogenous Regressor is "District has Any Bilingual Program in 1st Grade Cohort"
A. Reduced Form - Instrumental Variable is "District Has 20 or More Spanish LEP Students in 1st Grade Cohort"
Pooled 3rd Grade 4th Grade 5th Grade Pooled 3rd Grade 4th Grade 5th Grade
(1) (2) (3) (4) (1) (2) (3) (4)
Mean Standardized Achievement -0.007 0.031 -0.074 0.021 -0.010 0.013 -0.032 -0.014
(0.047) (0.056) (0.058) (0.059) (0.046) (0.051) (0.058) (0.061)
Passing Rate -1.401 0.625 -4.533* -0.487 -1.417 -1.197 -1.512 -1.393
(2.221) (2.779) (2.688) (2.775) (2.011) (2.027) (2.514) (2.918)
1st Stage, OLS coefficient for 0.261*** 0.267*** 0.258*** 0.255*** 0.263*** 0.269*** 0.265*** 0.250***
1st Grade LEP Count >= 20 (0.054) (0.053) (0.059) (0.060) (0.054) (0.053) (0.059) (0.060)
2nd Stage - Mean Standardized Achievement -0.027 0.116 -0.286 0.082 -0.038 0.048 -0.121 -0.054
(0.180) (0.207) (0.248) (0.232) (0.177) (0.187) (0.227) (0.243)
2nd Stage - Passing Rate -5.359 2.343 -17.553 -1.906 -5.395 -4.452 -5.699 -5.560
(8.813) (10.315) (11.766) (10.918) (7.857) (7.663) (9.712) (11.747)
Observations 2,722 968 898 856 2,716 969 895 852
Observations are at the school-grade-year level for the 2002-03 through 2009-10 school years, and limited to those in districts with fewer than 200 students in the 1st
grade cohort in 2004 and district-grades with between 10 and 39 Spanish LEP students in its 1st grade cohort. Hence, for 3rd grade observations we use the 1st grade
cohort two years prior, for 4th grade we use the 1st grade cohort 3 years prior and for 5th grade, we use the 1st grade cohort 4 years prior. For "mean standardized
scale scores" we take the average scale score among Spanish home language students in the school-grade-year unit and convert to standard deviation units using the
state-wide mean and standard deviation. For "mean passing rate" we use the percent of all Spanish home language students in each school-grade-year unit who achieve
a passing score on the TAKS exam. In our data, any value that refers to fewer than 5 students is masked. Hence we replace all masked values for controls with 2.5
students. We drop observations with masked values for achievement. Regressions control for district-wide Spanish LEP count in the relevant 1st grade cohort, district-
wide Spanish LEP count interacted with being above 20 Spanish LEP, grade-year fixed effects, the % of students in the analyzed category in a school-grade-year who
are female or economically disadvantaged, and the % of the school-grade-year overall who are female, economically disadvantaged, white, black and Hispanic. *, **
Table 3 - Estimates of Effect of Providing Bilingual Education on TAKS Achievement for
Spanish Home Language Students
II. Reading
B. 2SLS - Endogenous Regressor is "District has Any Bilingual Program in 1st Grade Cohort"
A. Reduced Form - Instrumental Variable is "District Has 20 or More Spanish LEP Students in 1st Grade Cohort"
I. Math
Mean
Standardized
Scale Scores
Mean
Passing Rate
Mean
Standardized
Scale Scores
Mean
Passing Rate
Mean
Standardized
Scale Scores
Mean
Passing Rate
Mean
Standardized
Scale Scores
Mean
Passing Rate
(1) (2) (3) (4) (5) (6) (7) (8)
1st Grade LEP Count >= 20 0.052 0.775 0.046* 1.348 -0.007 -1.401 -0.010 -1.417
(0.031) (1.073) (0.025) (0.909) (0.047) (2.221) (0.046) (2.011)
1st Grade LEP Count >= 20 0.044 0.668 0.040 1.271 -0.018 -1.866 -0.023 -1.916
(0.049) (1.577) (0.045) (1.433) (0.049) (2.301) (0.049) (2.104)
1st Grade LEP Count >= 20 0.051 0.726 0.044* 1.265 -0.008 -1.471 -0.011 -1.481
(0.032) (1.075) (0.026) (0.905) (0.047) (2.213) (0.046) (2.004)
1st Grade LEP Count >= 20 0.053* 0.813 0.048* 1.405 -0.007 -1.382 -0.010 -1.396
(0.031) (1.071) (0.025) (0.910) (0.047) (2.227) (0.046) (2.019)
5) Quadratic Smoother
1st Grade LEP Count >= 20 0.036 0.272 0.018 0.963 -0.111 -4.665 -0.079 -3.099
(0.063) (1.932) (0.048) (1.644) (0.075) (3.279) (0.069) (3.112)
6) Cubic smoother
1st Grade LEP Count >= 20 0.087 2.184 0.040 2.919 0.013 -1.354 0.024 0.956
(0.097) (2.872) (0.070) (2.732) (0.108) (4.364) (0.093) (4.386)
7) Bandwidth of 10 to 29
1st Grade LEP Count >= 20 0.041 0.540 0.041 1.023 -0.021 -2.479 -0.021 -2.432
(0.035) (1.133) (0.028) (0.933) (0.053) (2.365) (0.053) (2.365)
8) Bandwidth of 5 to 49
1st Grade LEP Count >= 20 0.060** 0.938 0.052** 1.169 -0.011 -1.893 -0.016 -1.309
(0.028) (0.977) (0.023) (0.799) (0.039) (1.804) (0.038) (1.715)
9) Restrict to Districts w/ Fewer than 200 Students in 1st Grade in 2000
1st Grade LEP Count >= 20 0.052 0.733 0.042 1.029 -0.012 -1.776 -0.008 -1.695
(0.033) (1.154) (0.025) (0.895) (0.044) (2.064) (0.041) (1.802)
10) Restrict to Districts w/ Fewer than 200 Students in 1st Grade in 2008
1st Grade LEP Count >= 20 0.049 0.508 0.044 1.128 -0.013 -1.478 -0.019 -2.240
(0.035) (1.196) (0.027) (0.959) (0.047) (2.189) (0.045) (2.057)
A. Non-LEP, Non-Spanish Home Language Students B. Spanish Home Language Students
Math Reading
Table 4 - Reduced-Form Sensitivity and Robustness Checks, Pooled Grades 3 - 5
Reading
For Panel A, see Table 2 notes, and for Panel B, see Table 3 notes. The text provides discussion of each of these sensitivity/robustness checks. *, ** and
*** denote significance at the 10%, 5% and 1% levels, respectively.
3) Replace Masked Values with 1
4) Replace Masked Values with 4
Math
1) Baseline (From Tables 2 and 3)
2) Only Grade-Year Fixed Effects as Controls