impact of bazian cement factory on air, water, soil, …
TRANSCRIPT

Iraqi Journal of Agricultural Sciences –1027:49(3):354- 366 AL-Taay & et al.
354
IMPACT OF BAZIAN CEMENT FACTORY ON AIR, WATER, SOIL, AND
SOME GREEN PLANTS IN SULAIMANI CITY-IRAQ M. S. A. AL-Taay
* A. H. A. Al-Assie
** R. O.Rasheed
***
Researcher
Prof. Assist.Prof. Coll. of Sci., Univ. of Tikrit Coll. of Sci., Univ. of Tikrit Coll. of Sci. Univ. of Sulaimani
ABSTRACT
This study was carried out to assess impacts of industrial activities on environmental quality in Bazian
cement factory, Sulaimani. Environmental impact of factory was carried out from September 2015 to
August 2016 at studied area located at north west of city with coordinates of 35º36'242"-
045º04'470".Pollutant particles can have as consequence reduction of biodiversity and quality of
water, soil and whole ecosystems. Especially, cement dust can be emitted at every stage of cement
production which affects on photosynthetic process, leaf stomata, discoloration, enzymatic
malfunction, growth reduction and productivity of plants. In this study, water, soil, air and three
plants (Platycladus orientalis , Eucalyptus spp. and Melia azedarach) samples were collected. Ten water
sources including 6 wells, 3 tanks and control in and around factory were selected in order to evaluate
some physicochemical characteristics of water. Concentrations of some heavy metals including
cadmium, chromium, lead, copper, nickel, iron and zinc were determined to evaluate pollution status.
Soil samples include twelve different sites nine of them are cement dust exposed with three control
sites. Same work for them had done. Heavy metal analysis and chlorophyll content for plants also
determined. Air gases results had taken online from computer fixed on main stack monthly. Also dust
from main stack had collected and analyzed for physicochemical parameters and heavy metals.
Results showed that were within normal standards.
Keywords:Cement ; impacts; heavy metals; plants; physicochemical parameters.
الطائي وآخرون 477-463(49)938 1027-مجلة العلوم الزراعية العراقية
العراق-ات الخضراء في مدينة السميمانيةتأثير مصنع اسمنت بازيان عمى اليواء والماء والتربة وبعض النبات ريزان عمر رشيد مقداد شياب أحمد الطائي عقيل حسين عمي العاصي
أستاذ مساعدأستاذ باحث لعموم, جامعة السميمانيةكمية ا كمية العموم, جامعة تكريت كمية العموم,جامعة تكريت
المستخمصلمصنع , السميمانية. تمت الدراسة ان للأسمنتالدراسة لتقييم تأثيرات الأنشطة الصناعية عمى جودة البيئة في مصنع بازيىذه أجريت -"35º36'242 احداثياتشمال غرب السميمانية ب في المنطقة التي تقع 5102 آبإلى 5102 أيمولبازيان من اسمنت
045º04'470". بأكمميا. وبصفة خاصة, بيئيةإلى تخفيض التنوع البيولوجي ونوعية المياه والتربة والنظم ال يمكن أن تؤدي المموثاتمونيا, الأوراق, وتانتفاخ يمكن أن ينبعث غبار الإسمنت في كل مرحمة من مراحل إنتاج الأسمنت مما تؤثر في عممية التمثيل الضوئي, و
نتاجية النباتات. في ىذه الدراسة تم جمع عينات المياه والتربة واليواء وثلاثة نباتات )بلاتيكلا دوس والعجز الأنزيمي, والحد من النمو وا في المصنع وحولو عينة سيطرةخزانات و 3بئر و 2, ميميا أزيداراش(. تم اختيار عشرة مصادر مياه منيا أورينتاليس, ويوكاليبتوس
تم الثقيمة الكادميوم والكروم والرصاص والنحاس والنيكل والزنك عناصرلتقييم بعض الخصائص الفيزيائية والكيميائية لممياه. تركيز بعض ال. وقد مقارنةغبار الاسمنت مع ثلاثة مواقع تحت تاثير عينات التربة اثني عشر موقعا مختمفا تسعة منيا شممتلتقييم حالة التموث. تقديرىا
الثقيمة ومحتوى الكموروفيل لمنباتات. وقد عناصرال. كما تم تحديد ذات الطرق المستخدمةفي قياس نسب العناصر لعينات المياه تم تحديدا تم جمع وتحميل الغبار من المدخنة شيريا. كم ةالرئيسي دخنةعمى الم مثبتالانترنت من الكمبيوتر ال نتائج الغازات الجوية من اخذت
.الميةالنتائج أنو في حدود المعايير الع أغمب الثقيمة. وأظيرت اصرعنعايير الفيزيائية والكيميائية واللملتحديد ا : مصنع الأسمنت. التأثيرات البيئية؛ معادن ثقيمة؛ النباتات. المعممات الفيزيائية.مفتاحيةالكممات ال
*Received:23/7/2017, Accepted:24/12/2017

Iraqi Journal of Agricultural Sciences –1027:49(3):354- 366 AL-Taay & et al.
353
INTRODUCTION
Different industrial activities are degrading
various environmental components like water,
air, soil and plant vegetation. Environmental
pollution as a result of cement industry could
be defined as adverse impact induced for
water, air and soil through various activities,
beginning from mining activity of raw material
up to its crushing, grinding, and other
processes developing in a cement plant.
Cement industry is one of 17 most polluting
industries listed by Central Pollution Control
Board (CPCB) (27).
Water is basic need for survival of any living
beings, plants and animals. Establishment and
operation of any industry affects water
resources of area. Ground water is generally
considered cleaner than surface water, on
which majority of population depend (11).
Both ground and surface water chemistry are
controlled by composition of its recharge
components, geological and hydrological
variations within aquifers (44). Polluted
Improved knowledge is required for
understanding and evaluating suitability of
groundwater for different purposes.
Groundwater quality comprises physical,
chemical and biological qualities of
groundwater (35). Temperature, turbidity,
colour, taste and odour make up list of
physical water quality parameters. Since most
groundwater are colourless, odourless and
without specific taste, concern is chemical
qualities. Naturally, groundwater contains
mineral ions and these ions slowly dissolve
from soil particles, sediments and rocks as
water travels along mineral surfaces in pores
or fractures of unsaturated zone and aquifer
(23).
Cement sector is emitting large amount of
oxides of sulfur, nitrogen and carbon. These
gases can contribute to health problems and
environmental impacts, such as acid rain,
ground level ozone, global warming, water
quality deterioration, and visual impairment
(11).
Toxic metals and organic compounds are
released when industrial waste is burnt in
cement kiln. Other sources of dust emissions
include clinker cooler, crushers, grinders, and
materials-handling equipment (31). Dust
which is emitted during cement processes are
eventually deposited on soil, sediment, water
and plants. Dust emissions from cement and
other related industries therefore have to be
given attention for control. This is necessary in
view of pollution load and its impact on the
environment (28).
In a major research on effect of pollutant
substances on vegetation performed in areas
around cement industry in most parts of world,
clearly, destruction of plant life by rising
material entry has been proved. Emissions
from cement factories toward nature via
weather, water and soil that are included as
feeder sources of plant and their concentration
beside plant disturbs their metabolic activities
in providing vital needs (43). Robert G.
Blezard defined cement as “adhesive
substance capable of uniting fragments or
masses of solid matter to a compact whole”
(16). Cement industries are generally
associated with high dust emissions into
atmosphere. Emitted dusts are naturally
eliminated as deposits to earth surface through
dry or wet deposition in rainfall (34).
Damaging consequences of released dust
particles for soil, flora and fauna of the cement
factory neighborhood could be considerable
(8) and damaging effects of dust fall, which is
characterized by enriched heavy metals such
as Lead (Pb), Nickel (Ni), Chromium (Cr),
Copper (Cu), Zinc (Zn), and Cadmium (Cd)
(6) and on water (18). A cement factory
(Bazian Cement) was situated at Bazian and
joined Lafarge Group in 2008 in frame of
acquisition of Orascom Cement Group. Aim of
present study is:1. get some information about
impacts of bazian cement factory on dust,
water, soil, plants and air components in and
out of factory to show its effect to
environment. 2. study physicochemical
parameters in dust, water, soil, plants and air.
3. determine chlorophyll content of study
plants. 4. Evaluation of heavy metals
concentration in dust, water, soil and plants
leaves. 5. evaluate heavy metals
bioaccumilation in plants tissue.
MATERIALS AND METHODS
Study area: Sulaimani is one of important
Iraqi cities of Kurdistan region. Sulaimani
province occupies more than 1200 km² in
Kurdistan region of Iraq. Most of region is
high plateau, more than 850 m above sea level,

Iraqi Journal of Agricultural Sciences –1027:49(3):354- 366 AL-Taay & et al.
354
becoming increasingly mountainous towards
Zagros mountain in north, from this area the
large perennial river, the lesser Zab descends
eventually draining to river Tigris. There are
also many ephemeral watercourses which
become dry during summer; area bounds with
springs and sources of underground water,
most of which are used for water supply and
irrigation purposes (29). Bazian cement
factory is one of the greatest and largest
cement factory in Kurdistan region, that
located at north west of Sulaimani governorate
35º36'245"- 045º04'473" nearly 30 km far
from city centre of Sulaimani within the
boundaries of bazian. Plant equipments are
designed and manufactured by a leading
German company "Polysius - AG" and
constructed by an Egyptian leading company
in Middle East and Mediterranean Basin
"Orascom construction". Environmental
effects of this factory should be assessed
because of its high economic importance.
Therefore, impact of emissions should be
determined. Geological formation of a certain
area have a great impact on water quality due
to erosion or leaching land crust or during
percolation toward different aquifers .
Kurdistan region of Iraq made of foothills,
mountains and alluvial basin (32), so it is
playing a vital role in distribution and
occurrence of ground water. Area bounded by
Latitudes (35º29'50"- 35º42'45") and
Longitudes (44º57'30"- 45º16'25") and
occupies area estimated to be about 316.5 km2.
Series of mountains (Kuwaik and Uloblagh)
divide whole basin in two-sub basins termed
“Recent sub basin” and “Pila Spi basin” (14).
Sampling sites and sample collection Water samples were collected from ten
sampling sites. Selected sites included wells
and tanks situated at different locations. Water
samples were collected for chemical and
physical parameters according to a regular
schedule per month interval periods during
september 2015 to August 2016. Table 1 show
water sources and their coordinates. All water
samples were collected following instructions
recommended by American Public Health
Association APHA (3). 3 plants and their soils
collected from four sites in and near factory
(1km) (12 sites) as shown in Table 2.
Table 1. show sites of water sources , coordinates Symbol used in study Describtion Coordinates Sites
SW1 Located inside factory near the boiler. 35º36'198"- 045º04'684" Well 3
SW2 Located inside factory near packing part. 35º36'190"- 045º04'644" Well 5
SW3 Located inside factory near packing part. 35º36'588"- 045º04'268" Well 6
SW4 Located outside factory near gate3. 35º36'217"- 045º04'802" Well 7
SW5 Located inside factory near gate3. 35º36'084"- 045º04'582" Well 8
SW6 Located inside factory near gate2 and packing part. 35º36'344"- 045º04'225" Well 10
ST1 Located inside factory near water station. 35º36'362"- 045º04'426" Tank 1000
ST2 Located inside factory near CCR. 35º36'211"- 045º04'457" Tank 2000
ST3 Located inside factory in water station. 35º36'364"- 045º04'428" Tank 6000
Table 2. show sites of plants and their soil with coordinates Plants and their soils Symbol Describtion Coordinates Sites
Platycladus oreintalis
Melia azsdarach,Eucalyptus spp.
SS1,SS5,SS9 (For soils)
SP1.SP5,SP9 (For plants)
Occur near main stack with
wind direction.
35º36'242"- 045º04'470" CCR
Platycladus oreintalis
Melia azsdarach,Eucalyptus spp.
SS2,SS6,SS10 (For soils)
SP2,SP6,SP10 (For plants)
Occur near main stack but
against wind direction in the
biggining of factory.
35º36'190"- 045º04'644" Gate3
Platycladus oreintalis
Melia azsdarach,Eucalyptus spp.
SS3,SS7,SS11 (For soils)
SP3,SP7,SP11 (For plants)
Out of factory (1 km) far
from it.
35º36'233"- 045º04'837" Out
Platycladus oreintalis
Melia azsdarach,Eucalyptus spp.
SS4,SS8,SS12 (For soils)
SP4,SP8,SP12 (For plants)
Occur in city center far from
any pollution source.
35º33'726"- 045º21'299" Control

Iraqi Journal of Agricultural Sciences –1027:49(3):354- 366 AL-Taay & et al.
355
Figure 1. Locations of sites and water sources in
studied area within Bazian, Sulaimani, Iraq.
(Google, 2015)
Field analysis:
Air and water temperature (°C):
Both of air and water temperature were
measured by using a clean mercury
thermometer with scale marked from (0 to 100
°C), air temperature was measured in shadow
while water temperature was measured by
immersing thermometer in water for few
minutes to obtain a constant reading.
Thermometer was rinsed with distilled water
after each use (2).
Hydrogen ion concentration (pH): Hydrogen
ion concentration of water samples were
measured immediately in the field using
portable pH meter model.The instrument was
calibrated initially by standard buffers of 4,7
and 9 as describe by (2).
Electrical conductivity (EC) in µS cm-1
:
Conductivity of water samples were
determined using standard procedure of (2),
before each sampling, calibration of
instrument was done by specific standard
solutions (0.1N KCl), final results were
corrected at (25°C) and expressed in μS cm-1
.
Total dissolved solid (TDS) in mg l-1
:
TDS were measured with pH-conductivity-
TDS meter (COMBO HI model 98130).
Turbidity was determined by using Turbidity
meter LP2000 (HANNA Instruments) after
instrument calibration by known turbidity
standard solutions. Turbidity was expressed
with Nephlometric Turbidity Unit (NTU).
Total hardness: An accurate method was used
for determination of total hardness and
calcium hardness depending on procedure
given by Theroux et al. (47). Measurements of
total hardness were conducted depending on
mathematical model below: (ppm Ca × 2.496)
+ (ppm Mg × 4.115) = ppm Total hardness as
CaCO3 Calcium and Magnesium Hardness:
hardness of calcium and magnesium in each
water sample was measured and calculated
according to equations outlined by Theroux et
al. (47): (ppm Ca × 2.496) = Calcium hardness
as CaCO3 (ppm Mg × 4.112) = Magnesium
hardness as CaCO3.
Alkalinity: It is measure of ability of water
to neutralize acids. Total alkalinity was
determined by titration method recommended
by (2), after adding (5) drops of methyl
orange to 50 ml of water samples, mixture
was with H2SO4 (0.01N), results were
represented as mgl-1
using the following
equation:
Alkalinity as mg CaCO3.l-1
= A×B×50000/
ml of sample
Where: A=ml of H2SO4 titrant
B=Normality of H2SO4
Sodium and potassium (Na+ and K
+):
Sodium and potassium are relatively abundant
elements, and they are present to some extent
in most natural waters (15). Flame photo-
metric method was used as described in APHA

Iraqi Journal of Agricultural Sciences –1027:49(3):354- 366 AL-Taay & et al.
356
(3) using Corning- 400 Flame-photometer-
U.K. Sodium and potassium emission readings
were taken at wavelength of 589 and 767 nm,
respectively. A series of standard stock
solutions (0.1 to 8 mg l-1
) of Na+ and K
+ from
NaCl and KCl were prepared for calibration of
the instrument, and creating calibration curve.
Final results were expressed in mg l-1
.
Chloride (Cl–): Agentometric method (Mohor
Method) was used for determination of
chloride content in water sample. Silver nitrate
solution (AgNO3) as a titrant and potassium
chromate (K2CrO4) as indicator were used, as
described by Sawyer and MacCarty (42).
Chloride (mg Cl l-1
) = (V1 – V2) × N ×
35.45/Volume of sample × 1000 where V1 is
volume of silver nitrate required by the sample
(ml), V2 – volume of silver nitrate required by
the blank (ml), N – normality of silver nitrate,
and 35.45 is molecular weight of Cl- .
Reactive phosphorus (PO4-3
): All methods
for estimating reactive phosphorus are mainly
colorimetric dependence, and most are
depended on the formation of a blue colour
solution above acidic base. For laboratory,
procedure is described by Parsone et al. (36).
Water samples were allowed to react with a
mixed reagent, consisting of ammonium
molybdate, ascorbic acid (kept frozen between
analysis), concentration of sulphuric acid, and
trivalent antimony 1-tartarate solution.
Absorbance of this solution was measured
spectro-photometrically using UV-VIS.
Spectrophotometer (TU.1800, UK), at
wavelength of 885 nm. Results were expressed
in mg l -1
.
Nitrate nitrogen (NO3-): Nitrate
concentration of water samples were estimated
by using a special nitrate-sensitive membrane
electrode (Ino lab.pH, Ion, Cond.750-
Multiparameter laboratory, WTW, Germany).
Results were expressed in mg l-1
.
Sulfate ion (SO4-2
) in mg l-1
:
Turbidimetric method as described by (1) was
used for sulfate determination, when barium
chloride was used, and results were recorded at
wave length 420 nm within 30 seconds
intervals and the SO4-2
concentration is
determined by comparison of reading with a
standard curve of sulfate concentration in the
range 0.0 to 40 mg l-1
.
Heavy metals in water samples (mg l-1
):
Heavy metals in water samples were
determined by atomic absorption as
recommended by APHA (3). Procedure of in-
situation was conducted depending on direct
Air-Acetylene (C2H2). (17); 40). Analyst 700-
Atomic absorption spectrophotometer and
Varian-24fs Flame Atomic Absorption
Spectrophotometer was used for determination
heavy metals. Chemical digestion was done in
laboratories of biology department then
sample analysis have done at directorate of
environment labs. in Sulaimani city.
Soil laboratory analysis
Soil samples at each location were taken to lab
and they were analyzed for chemical and
physical properties. Briefly; returning bag to
lab soil samples were dried and sieved.
Extraction method: 60 g of an air-dried sample
were mixed with 300 ml of de-ionised water
(if 1:1 or 60 to 300 if 1:5). Mixture was shaken
in a rotary shaker for an hour, then left to
stand. Extract was passed through a filter
paper. Then chemical composition of extracts
(K+ , Na
+ , Mg
2+, Ca
2+, Cl
- , NO3
- , SO4
2-, PO4
and nutrients) was determined like water
samples.
Hydrogen ion concentration (pH):
Approach of this measurement was performed
according to (19). Procedure of measuring is
as follow:1. pH value was determined for a 1:5
soil: distilled water suspension, by taking 20
gm of dry ground soil: 100 ml of distilled
water. 2. Suspension was shaken using a
mechanical stirrer and allow to stand for 30
minutes. 3. Suspension was filtered with
filtering papers. 4. Electrode of pH meter
(HANA instrument, 024125) was immersed
into filtered sample, and pH value was
recorded.
Electrical conductivity (EC) in µS cm-1
:
Soil EC is a measurement that correlates to
soil salinity. Electrical conductivity was
determined by method described by (19).
Heavy metals in soil samples (mg l-1
):
Acid digestion of soil was used for preparation
of samples to be measured by Atomic
Absorption Spectrometry (AAS) using Di-
Acid (HNO3-HClO4) method by (19).
Heavy metals in main stack dust (mg l-1
):
Sample of dust had taken from higher point of
main stack. Dust had collected in clean bag.

Iraqi Journal of Agricultural Sciences –1027:49(3):354- 366 AL-Taay & et al.
357
Acid digestion for method was used for
preparation of sample to be measured by
Atomic Absorption Spectrometry (AAS) using
Di-Acid (HNO3-HClO4) method by (19).
Plant laboratory Analysis
Chlorophyll determination (mg l-1
):
Collection of plant samples: In this study,
three commonly green trees (Eucalyptus spp. ,
Melia azedarach L. and Platycladus
orientalis) were collected for experimental
purpose. These species are mostly preferred to
grow in conditions under effect of main stack.
Healthy and uninfected trees were collected at
their stage of maturity; and care was also taken
during sampling of leaves to avoid
mechanical injuries. Fresh leaf samples were
wash thoroughly first in tap water followed by
distilled water in the laboratory, analyzed for
determination of chlorophylls (Chl-a and Chl-
b).
Analytical procedure: Accurately weighted
0.5g of fresh plant leaf sample was taken, and
homogenized with 10 ml of extractant solvent
(Acetone 80%). Homoginized sample very
well by mortar and pestle and must pulverized
completely, thus a few grains of sand may
help. This is leaf homogenate , then filter leaf
homogenate through filter paper. Retentate is
removed by filter paper (and discarded) and
the extract (or filtrate) is collected in a test-
tube. Solution mixture was analyzed for
Chlorophyll-a, Chlorophyll-b and content in
spectrophotometer. Equation used for
quantification of Chlorophyll-a, Chlorophyll-
b, and carteniods are: Arnon's equation to
convert absorbance measurements to mg Chl
g-1
leaf tissue (13): Chl a (mg g-1
) = [(12.7 ×
A663) - (2.6 × A645)] × ml acetone / mg leaf
tissue
Chl b (mg g-1) = [(22.9 × A645) - (4.68 ×
A663)] × ml acetone / mg leaf tissue
Total Chlorophyll = Chlorophyll
a+Chlorophyll b.
Heavy metals in plant samples (mg l-1
):
Acid digestion of plant leaves samples was
used for samples preparation to be analyzed by
Atomic Absorption Spectrometry (AAS) using
Di-Acid (HNO3-HClO4) method by (19).
Statistical Analysis
Basic statistics of measured parameters were
estimated. Patterns of variation due to different
plants and different sites were tested by using
one-way ANOVA. Range test was used as a
post hoc test to compare between means at
p>0.05. Software SPSS, version10 (SPSS,
1998) was used.
RESULTS AND DISCUSSION
Physicochemical parameters and heavy
metals of water:
Summary of physical and chemical parameters
from ten stations of water are given in Table 3,
including mean of values and WHO standards.
Concentration of heavy metals of water
samples (Cd, Cr, Pb, Cu, Ni, Zn and Fe) are
shown in Table 4.
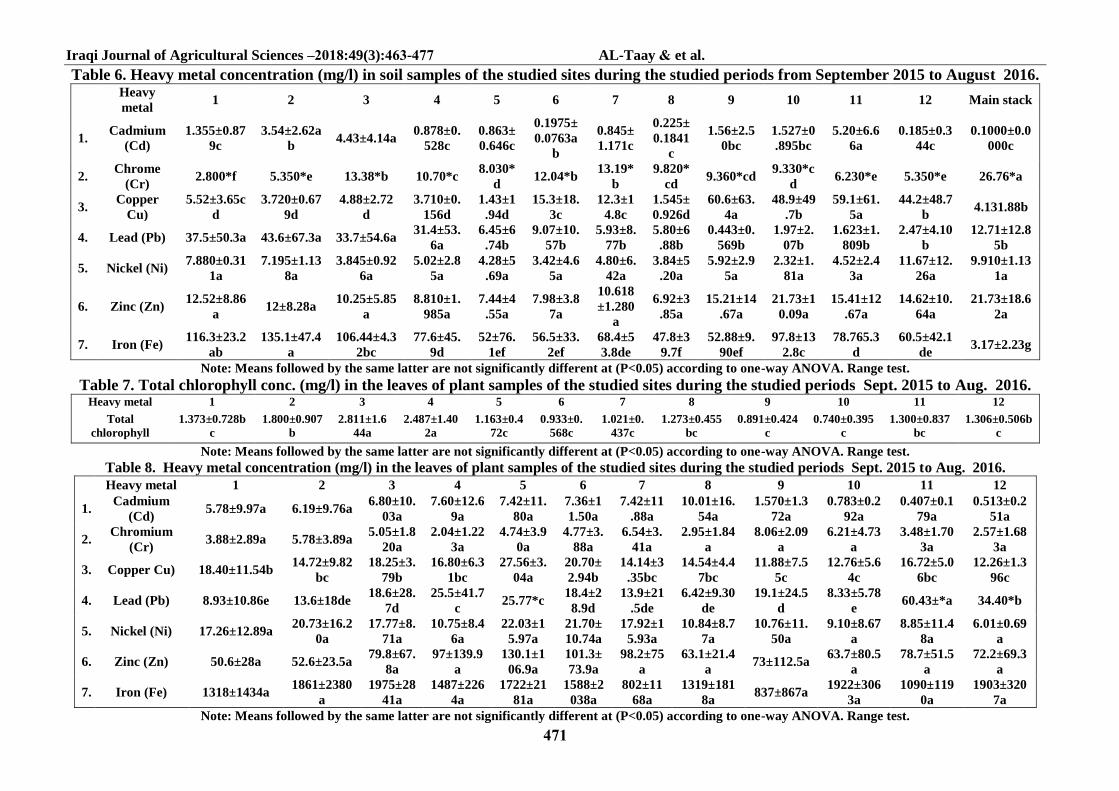
Physicochemical parameters and heavy
metals of Soil:
Both of table 5 and 6 give the same results but
for soil samples. Different from water samples,
control samples for every type of plants here
we take fourth site far from any pollution
source in city centre (garden). That mean here
become three controls.
Parameters of plants leaves:
Chlorophyll determenation for three types of
plants during study period by determination of
both chlorophyll a and b had done.
After digestion of leaves of collected plants,
determination of heavy metals by atomic
absorbtion spectrophotometer for same seven
metals those were determined for water and
soil. Table 7 and 8 show total chlorophyll
conentrations and heavy metals concentrations
in collecting plants leaves respectivly.
Physicochemical parameters and heavy
metals of dust:
A summary of physical and chemical
parameters of dust sample are given within
Table 5. Concentration of heavy metals (Cd,
Cr, Pb, Cu, Ni, Zn and Fe) are shown in Table
6
.

Iraqi Journal of Agricultural Sciences –1027:49(3):354- 366 AL-Taay & et al.
358
Table 3. Physico-chemical parameters of water samples of the studied sites during the studied periods from September 2015 to August 2016
Note: means followed by same latter are not significantly different at (P<0.05) according to one-way ANOVA. Range test.
Tank2000 Tank1000 Tank6000 Control Well10 Well8 Well7 Well6 Well5 Well3 WHO Parameter S/N
26.64±6.39a 26.55±6.49a 26.82±6.38a 25.55±6.30a 26±6.36a 26.09±6.52a 26.18±7.21a 26±7.35a 25.69±6.57a 25.45±6.61a - Air Temp. 1.
21.45±2.06a 20.54±2.38a 20.45±2.54a 20.45±2.01a 20.18±2.31a 20.09±2.16a 20.18±2.04a 20.36±2.54a 20.36±2.46a 19.63±2.76a - Water
Temp. 2.
7.18±0.30a 7.39±0.23a 7.45±0.28a 7.47±0.56a 7.48±0.28a 7.40±0.28a 7.41±0.28a 7.43±0.32a 7.50±0.32a 7.40±0.26a 6.5-
8.5 pH 3.
360.6±68.7b 339.5±42.9b 361.6±35.5b 560.3±202.2a 342.4±27.3b 383.6±27.5b 385.7±19.3b 346.5±14.2b 332.2±21.8b 323.7±39.1b 400-
1400 EC 4.
313.4±122.1a 269.3±49b 271.9±54.5b 357.9±123.2a 256.9±53.6b 260.5±62.6b 271.5±48.2b 256±44.1b 254.2±42b 252.3±50.3b 500-
1500 T.D.S 5.
183.3±22.6a 179.8±21.9a 176.46±25.8a 191.1±57.4a 180.1±25.2a 197.2±33.5a 189±27.7a 187.2±20.3a 181.6±22.9a 172.4±26.6a 200 Alkalanity 6.
3.020.96b 3.61±1.12b 3.25±1.55b 3.82±1.81b 3.30±1.36b 3.55±1.15b 6.22±3.32a 5.04±2.66ab 4.20±1.28ab 6.24±4.81a 5 Turbidity 7.
259±63.6a 266.5±79.7a 244.2±68.5a 285.2±137a 290.5±78.7a 279.5±71.5a 281.5±84a 260±53a 247.8±44.4a 220.6±56.8a 100-
500
Total
Hardness 8.
27.75±14.43a 29.12±18.49a 37.95±32.67a 38.91±24.69a 26.09±13.84a 33.07±18.45a 30.12±17.8a 29.13±19.85a 26.89±11.14a 19.23±7.77a 250 Chloride
Cl -
9.
6.71±2.199bc 6.28±1.262bc 6.43±0.693bc 8.19±6.00a 5.61±0.987c 8.10±1.171a 7.10±0.700ab 5.35±5.355c 5.32±5.327c 6.45±0.723bc 20 Sodium Na 10.
0.94±0.897a 0.80±0.746a 1.05±1.187a 1.18±1.187a 1±1.504a 0.66±0.550a 0.86±1.202a 0.77±1.036a 0.77±0.808a 0.73±0.648a Potasium
K 11.
30.15±11.08a 26.04±10.77a 23.09±7.97a 25.64±19.57a 32.15±10.99a 34.15±17.86a 35.51±18.05a 31.99±13.92a 35.38±13.19a 30.45±12.38a 30 Magnisium
Mg 12.
55.49±13.96b 53.79±22.61b 53.52±26.75b 73.6±51.8a 60.15±32.77ab 54.06±7.98b 52.06±6.87b 47.17±10.54b 43.12±8.11b 49.39±13.60b 100 Calcium
Ca 13.
37.171.5a 18.39±11.79a 17.88±11.37a 39.6±33.5a 23.78±19.16a 15.26±7.96a 18.59±7.60a 20.51±9.51a 20.69±9.52a 17.56±10.14a 250 Sulphate 14.
1.47±1.299a 1.016±0.833a 1.32±1.288a 1.74±2.020a 0.98±0.700a 1.47±1.554a 1.77±1.782a 1.96±1.925a 1.75±1.592a 1.46±1.213a 10-45 Nitrate 15.
0.31±0.1152a 0.30±0.1051a 0.32±0.1048a 0.34±0.1371a 0.34±0.0907a 0.35±0.1179a 0.37±0.0992a 0.35±0.1084a 0.35±0.1005a 0.31±0.0937a 1 Phosphate 16.

Iraqi Journal of Agricultural Sciences –1027:49(3):354- 366 AL-Taay & et al.
360
Table 4. Heavy metal concentration (mg/l) in water samples of the studied sites during the studied periods from Sept. 2015 to August 2016.
Tank2000 Tank1000 Tank6000 Control Well10 Well8 Well7 Well6 Well5 Well3 WHO Heavy metal
0.0001* N.D N.D N.D N.D 0.0081* 0.0024* N.D 0.0001* 0.0008* 0.003 Cadmium
(Cd) 1.
0.0001* 0.0001* N.D 0.0022* 0.0001* 0.0111* 0.0110* 0.0101* 0.0003* 0.0045* 0.05 Chrome (Cr) 2.
0.0255±0.0143
5b
0.0262±0.0060
9b
0.0394±0.010
13a
0.006±0.0041
7d
0.0345±0.019
15a
0.0187±0.01809
c
0.0109±0.0120
1cd
0.0226±0.01427
b
0.0061±0.00413
d
0.0189±0.00723
c 2 Copper Cu) 3.
0.0026±0.0019
8a N.D N.D 0.0001±* 0.0001±*
0.00035±0.0003
54b
0.0003±0.0002
83b
0.00025±0.0002
12b
0.0001±0.00000
0b
0.00025±0.0000
75b 0.01 Lead (Pb) 4.
0.0269±0.0049
5a
0.017625±0.01
841a
0.01805±0.02
22a 0.0083±*
0.0204±0.032
6a
0.00305±0.0043
1a
0.00462±0.003
84a
0.00385±0.0043
9a 0.0386±0.0376a
0.01198±0.0121
9a 0.07 Nickel (Ni) 5.
0.0487±0.0549
a
0.01660±0.006
97a
0.01598±0.00
900a
0.00630±0.00
985a
0.02613±0.01
705a
0.01068±0.0085
4a
0.00997±0.007
09a
0.00628±0.0068
1a
0.01652±0.0041
2a
0.01233±0.0039
5a 3 Zinc (Zn) 6.
0.1696±0.0980
a 0.11580.0662a
0.1674±0.061
8a
0.2886±0.307
a
0.1133±0.021
3a 0.1484±0.0807a
0.1586±0.0582
a 0.2120±0.1003a 0.1449±0.0634a 0.0924±0.0545a 0.3 Iron (Fe) 7.
Note: Means followed by the same latter are not significantly different at (P<0.05) according to one-way ANOVA. Range test.
Table 5. Physico-chemical parameters of soil samples of the studied sites during the studied periods from September 2015 to August 2016.
Main stack 12 11 10 9 8 7 6 5 4 3 2 1 Parameter
7.20±0.2280
a
7.46±0.2827
a
7.52±0.3103
a
7.54±0.2806
a
7.41±0.333
a
7.51±0.22
80a
7.58±0.27
08a
7.60±0.272
6a
7.45±0.
364a
7.42±0.
2118a
7.45±0.
1787a
7.57±0.38
9a
7.46±0.34
3a pH 1.
1182±641a 369.9±248.3
b 324.6±242b 334.5±235b
372.5±318.
7b
380.7±281
.4b
353.7±279
.4b
314.2±212.
3b
320.3±
230.2b
370.8±
281b
340.6±
274.9b
350.4±281
.6b
342.1±276
.4b EC 2.
1107±596a 521.8±305b 646±424b 554±376b 682±461b 516.4±290
b
578.8±324
.9b 555±334b
546.5±
303.6b
541.6±
296.4b
588.7±
325.9b
584.3±319
.3b
522.7±178
.9b Alkalanity 3.
2603±4452a 857±680b 836±625b 833±587b 782±737b 757±439b 684±451b 741±459b 812±52
8b
757±38
4b
615±41
6b 805±465b 838±439b
Total
Hardness 4.
1380±2358a 371±551c 303±483c 415±747c 247±424c 325±573c 242±332c 898±2552b 314±54
6c
480±10
91c
192±29
9.3c 233±382c 317±577c Chloride Cl- 5.
60.4±18.28
bc 33.3±5.38b 19.6±1.22a 20.1±17.3c 20.7±12.2c
27.4±2.87
a
23.3±2.11
bc 29.4±2.88a
24.3±1
1.1a
26.43.2
1ab
20.4±1
8.32c
22.3±17.2
32c
23±2.169b
c Sodium Na 6.
95.4±131.4a 10.70±10.44
b
4.435±2.914
b 9.89±9.72b
6.30±4.00
b
7.83±5.94
b
5.388±2.7
23b 5.69±4.51b
3.807±
2.541b
8.82±1
0.42b
7.67±9.
40b
19.2±39.9
b
15.04±11.
55b Potasium K 7.
273±400a 114.1±132.9
b 88.7±66.5b 87.3±56.0b
59.6±53.3
b 98±94.2b
89.3±75.9
b 95.7±86.0b
98.8±8
8.4b
90.4±8
5.6b
77.3±7
4.7b
98.6±88.9
b
103.6±79.
1b
Magnisium
Mg 8.
230.5±240a 167.6±58.6b 153.6±70.1b 185.2±69.9b 203±66.6b 122.3±64.
8b
123.4±65.
4b
120.1±10.3
b
132.4±
45.4b
126.7±
30.22b
118.8±
50.4b
136.9±20.
29b
132.7±8.3
4b Calcium Ca 9.
734±1222a 86.5±70.6b 90.5±81.4b 95.5±96.5b 89.7±92.9
b
86.4±79.7
b
85.1±79.3
b 82.8±69.5b
90.9±6
8.1b
74.9±4
0.8b
78.5±5
0.1b
70.8±34.9
b
67.8±34.5
b Sulphate 10.
30±58.7a 25.3±38.6a 28.3±46.9a 29.1±46.3a 27.8±49.8a 26.9±38.0
a
31.4±48.0
a 30.4±46.2a
29.3±4
9.5a
28±36.
6a
33.2±5
0.1a
32.9±46.2
a
23.9±35.4
a Nitrate 11.
2.223±1.104
a
2.027±1.161
a
1.964±1.106
a
2.050±1.009
a
1.977±1.10
4a
1.836±1.2
46a
2.032±1.4
56a
2.170±1.46
9a
1.977±
1.066a
1.732±
1.040a
2.491±
1.484a
2.341±1.4
68a
1.923±0.9
97a Phosphate 12.
Note: Means followed by the same latter are not significantly different at (P<0.05) according to one-way ANOVA. Range test.
Iraqi Journal of Agricultural Sciences –1027:49(3):354- 366 AL-Taay & et al.
362
Table 6. Heavy metal concentration (mg/l) in soil samples of the studied sites during the studied periods from September 2015 to August 2016.
Main stack 12 11 10 9 8 7 6 5 4 3 2 1 Heavy
metal
0.1000±0.0
000c
0.185±0.3
44c
5.20±6.6
6a
1.527±0
.895bc
1.56±2.5
0bc
0.225±
0.1841
c
0.845±
1.171c
0.1975±
0.0763a
b
0.863±
0.646c
0.878±0.
528c 4.43±4.14a
3.54±2.62a
b
1.355±0.87
9c
Cadmium
(Cd) 1.
26.76*a 5.350*e 6.230*e 9.330*c
d 9.360*cd
9.820*
cd
13.19*
b 12.04*b
8.030*
d 10.70*c 13.38*b 5.350*e 2.800*f
Chrome
(Cr) 2.
4.131.88b 44.2±48.7
b
59.1±61.
5a
48.9±49
.7b
60.6±63.
4a
1.545±
0.926d
12.3±1
4.8c
15.3±18.
3c
1.43±1
.94d
3.710±0.
156d
4.88±2.72
d
3.720±0.67
9d
5.52±3.65c
d
Copper
Cu) 3.
12.71±12.8
5b
2.47±4.10
b
1.623±1.
809b
1.97±2.
07b
0.443±0.
569b
5.80±6
.88b
5.93±8.
77b
9.07±10.
57b
6.45±6
.74b
31.4±53.
6a 33.7±54.6a 43.6±67.3a 37.5±50.3a Lead (Pb) 4.
9.910±1.13
1a
11.67±12.
26a
4.52±2.4
3a
2.32±1.
81a
5.92±2.9
5a
3.84±5
.20a
4.80±6.
42a
3.42±4.6
5a
4.28±5
.69a
5.02±2.8
5a
3.845±0.92
6a
7.195±1.13
8a
7.880±0.31
1a Nickel (Ni) 5.
21.73±18.6
2a
14.62±10.
64a
15.41±12
.67a
21.73±1
0.09a
15.21±14
.67a
6.92±3
.85a
10.618
±1.280
a
7.98±3.8
7a
7.44±4
.55a
8.810±1.
985a
10.25±5.85
a 12±8.28a
12.52±8.86
a Zinc (Zn) 6.
3.17±2.23g 60.5±42.1
de
78.765.3
d
97.8±13
2.8c
52.88±9.
90ef
47.8±3
9.7f
68.4±5
3.8de
56.5±33.
2ef
52±76.
1ef
77.6±45.
9d
106.44±4.3
2bc
135.1±47.4
a
116.3±23.2
ab Iron (Fe) 7.
Note: Means followed by the same latter are not significantly different at (P<0.05) according to one-way ANOVA. Range test.
Table 7. Total chlorophyll conc. (mg/l) in the leaves of plant samples of the studied sites during the studied periods Sept. 2015 to Aug. 2016. 12 11 10 9 8 7 6 5 4 3 2 1 Heavy metal
1.306±0.506b
c
1.300±0.837
bc
0.740±0.395
c
0.891±0.424
c
1.273±0.455
bc
1.021±0.
437c
0.933±0.
568c
1.163±0.4
72c
2.487±1.40
2a
2.811±1.6
44a
1.800±0.907
b
1.373±0.728b
c
Total
chlorophyll
Note: Means followed by the same latter are not significantly different at (P<0.05) according to one-way ANOVA. Range test.
Table 8. Heavy metal concentration (mg/l) in the leaves of plant samples of the studied sites during the studied periods Sept. 2015 to Aug. 2016.
12 11 10 9 8 7 6 5 4 3 2 1 Heavy metal
0.513±0.2
51a
0.407±0.1
79a
0.783±0.2
92a
1.570±1.3
72a
10.01±16.
54a
7.42±11
.88a
7.36±1
1.50a
7.42±11.
80a
7.60±12.6
9a
6.80±10.
03a 6.19±9.76a 5.78±9.97a
Cadmium
(Cd) 1.
2.57±1.68
3a
3.48±1.70
3a
6.21±4.73
a
8.06±2.09
a
2.95±1.84
a
6.54±3.
41a
4.77±3.
88a
4.74±3.9
0a
2.04±1.22
3a
5.05±1.8
20a 5.78±3.89a 3.88±2.89a
Chromium
(Cr) 2.
12.26±1.3
96c
16.72±5.0
6bc
12.76±5.6
4c
11.88±7.5
5c
14.54±4.4
7bc
14.14±3
.35bc
20.70±
2.94b
27.56±3.
04a
16.80±6.3
1bc
18.25±3.
79b
14.72±9.82
bc 18.40±11.54b Copper Cu) 3.
34.40*b 60.43±*a 8.33±5.78
e
19.1±24.5
d
6.42±9.30
de
13.9±21
.5de
18.4±2
8.9d 25.77*c
25.5±41.7
c
18.6±28.
7d 13.6±18de 8.93±10.86e Lead (Pb) 4.
6.01±0.69
a
8.85±11.4
8a
9.10±8.67
a
10.76±11.
50a
10.84±8.7
7a
17.92±1
5.93a
21.70±
10.74a
22.03±1
5.97a
10.75±8.4
6a
17.77±8.
71a
20.73±16.2
0a 17.26±12.89a Nickel (Ni) 5.
72.2±69.3
a
78.7±51.5
a
63.7±80.5
a 73±112.5a
63.1±21.4
a
98.2±75
a
101.3±
73.9a
130.1±1
06.9a
97±139.9
a
79.8±67.
8a 52.6±23.5a 50.6±28a Zinc (Zn) 6.
1903±320
7a
1090±119
0a
1922±306
3a 837±867a
1319±181
8a
802±11
68a
1588±2
038a
1722±21
81a
1487±226
4a
1975±28
41a
1861±2380
a 1318±1434a Iron (Fe) 7.
Note: Means followed by the same latter are not significantly different at (P<0.05) according to one-way ANOVA. Range test.

Iraqi Journal of Agricultural Sciences –1027:49(3):354- 366 AL-Taay & et al.
361
Water: Air temperatures in this study were
between (14-38°C). Different variation in
Sulaimani was found by Al-Shaheen (9), who
recorded air temperature ranged from 3 to 43
oC, and by Farkha and Abdulrahman (21) who
recorded air temperature between 21 and 40
oC
as minimum and maximum temperature, our
results agreed with those observed by
Muhammad (32) through his work at cement
factory in Sulaimani and recorded air
temperature ranged from 16.56
to 23.45 o
C.
Water temperature is most important factor
of water which has a great deal of influence on
various chemical and biological reactions
taking place in water. Temperature of
groundwater was ranged between 15 to 24°C,
and this reflected seasonal variations
throughout monitoring period. pH indicate
slightly acidic to basic character at a given
temperature. pH is an significant factor that
decides the suitability of water for various
purposes (7). Range of pH values in water
samples (6.67 to 8.23), which are within 6.5 to
8.5 recommended by WHO (50) in drinking
water as shown in Table 3 indicated that all
groundwater collected from study areas are
excellent. Closeness of value may be due to
similarity in parent material of study area.
Electrical Conductivity is a useful tool to
evaluate purity of water (4). EC ranges from
226 to 935 μScm-1
. Value found in the present
study indicated that all wells and tanks water
were under 2,250 μScm-1
as suitable. Large
variation in EC is mainly attributed to
lithologic composition and anthropogenic
activities prevailing in area. Normally,
irrigation water with an EC of < 700 μScm-1
causes little or no threat to most crops, while
EC > 3000 μScm-1
may limit their growth
(48). Total dissolved solids usually related to
conductivity. Water containing more than 500
mg/l of TDS is not considered desirable for
drinking water supplies, though more highly
mineralized water may be used where better
quality water is not available (26). Maximum
value of TDS during study period was found
as 630 mg l-1
at sampling location (ST2) in
December and minimum was 189 mg l-1
in
(SW1) in September. TDS values of all water
samples of selected sites are within limits.
Hardness is property of water which prevents
lather formation with soap and increases
boiling points of water (37). Total Hardness
was found in water samples ranges from 143
mg l-1
(ST3) to 475 mg l-1
(SW6), which
shows values higher than permissible limit
prescribed by WHO (50). Turbidity: In most
waters, turbidity is due to colloidal and
extremely fine dispersions. Turbidity values
varied between 0.38 NTU (SW6) to 18.7 NTU
(SW1). Many of water samples shows greater
value than limit prescribed by (50).
Sodium is a common element present to some
extent in most natural waters. Its concentration
varied from negligible in fresh water to
considerable in seawater and brackish water.
When combined with certain anions, sodium
imparts a salty taste to drinkable (15). Average
abundance of sodium cation in ground water is
generally less than 5 mg l-1
; moreover sodium
cation consists about 0.02-0.62% of soil and
about 2.5% of the earth’s crust (3). Most water
supplies contain less than 20 mg l-1
, but in
some countries its level may exceed 250 mg l-
1. Saline intrusion, mineral deposits, and
sewage effluents can all contribute significant
quantities of sodium to water. An overall mean
sodium ion concentration recorded for the
present work was 2.12 mg l-1
. Minimum
sodium ion concentration was 0.8 mg l-1
determined at (ST2) during mid-March, while
maximum sodium ion concentration was 10.2
mg l-1
measured at (SW5) during same month.
No firm conclusion can be drawn concerning
the possible association between sodium in
drinking water and occurrence of
hypertension; therefore, no health based
guideline value is proposed. However,
maximum permissible concentration of sodium
was 250 mg l-1
(50). Accordingly, all studied
groundwater samples during this investigation
were within desirable concentrations and were
in safe side for drinking purpose. Potassium:
Potassium is slightly less common than
sodium and more abundant in sedimentary
rocks. Sources of potassium are principal
potassium minerals of silicate rocks, such as
mica and microcline (24). It is well known that
potassium concentration is less than that of
sodium in natural waters (22). Potassium
occurs in ground water as a result of mineral
dissolution, from decomposing plant material,
and from agricultural runoff (3). Potassium ion
concentration showed an overall mean 1.13

Iraqi Journal of Agricultural Sciences –1027:49(3):354- 366 AL-Taay & et al.
364
mgl-1
.Minimum potassium ion concentration
was 0.12 mg l-1
noted at (ST2) during
December, while Maximum potassium ion
concentration was 5.4 mg l-1
observed at
(SW6) during August. Samples revealed lower
concentrations of potassium than sodium in
accordance to results obtained in Sulaimani
city by Mustafa (33). According to previously
mentioned standards, and correspondingly
present results, at all studied sites water were
within desirable levels and were in safe side
for drinking water purpose. Calcium and
magnesium: source of calcium and
magnesium in natural water are various types
of rocks, industrial waste and sewage (49).
Values of calcium varied from 33.3 mg l-1
(SW2) to 156 mg l-1
(SW6) and values of
magnesium ranged from 13 mg l-1
(ST3) to 63
mg l-1
(SW5). Sequence of mean concentration
values of cations in groundwater of study area
is K > Na > Mg > Ca as shown in Table 3.
Ca2+
, Mg2+
and pH are primarily controlled by
water-rock interaction in area (5). Chloride
content ranges from 1.72 to 88 mgl-1
with
values within 250 mgl-1
recommended by
WHO (50) recorded in all water sources.
Alkalinity is an important characteristic of
natural and polluted water, in which
measurement of potential hydrogen
differentiates between their alkalinity or
acidity (24). Minimum level of alkalinity in
studied area was 133 mg l-1
recorded from
(ST3) in May while maximum value observed
was 285 mg l-1
recorded for (SW5) during
March. Result can be concluded that variation
in alkalinity may be connected with more than
one factor, among them dissolved carbon
dioxide concentration, microorganism
activities, and hydrolysis of bicarbonate ions.
Anon (12) explained that most Iraqi waters are
generally dominated by HCO3 ions which
hydrolyses to give an alkaline solution.
Bicarbonates in feed water act as a major
source for carbonate, bicarbonate and
hydroxide alkalinity. Carbon dioxide is
insoluble in warmer water and so is removed
with hot water. This cause an increase in pH
again and a shift in alkalinity forms from
bicarbonate to carbonate and from carbonate to
hydroxide (42). Sulphate concentration
ranges from 5.01 to 251.8 mgl-1
which are
within normal range recommended for
drinking water by WHO (50). Obtained results
was lower than result obtained by Mustafa
(33) and Rashid (39) for well water, but they
agree with that obtained by Hussien and
Gharbie (25) who concluded that presence of
the sulphate ion in groundwater is due to
dissolution of leached sulphate, and gypsum,
which exists in soils. Nitrate concentration
ranged between 0.001 to 6.96 mgl-1
which
were all within WHO (50) acceptable limit of
50 mgl-1
in drinking water. This implies that
all indistrial and anthropogenic activities in
area do not affect groundwater sources. High
nitrate concentration causes met-
hemoglobinemia with symptoms of paleness,
bluish mucous membranes, digestive and
respiratory problems (30). Reactive
Phosphorus: Phosphorus is a chemical
commonly material found in soil, rock and
plants. It is an essential nutrient for plants’
growth. Ground water rarely contains more
than 0.1 mg l-1
phosphorus unless they have
passed through soil containing phosphate or
have been polluted by organic matter (15).
Phosphorus concentration during period of this
investigation ranged between (0.2-0.68) mg P-
PO4 l-1
. High levels of phosphorus may be a
result of excessive use of fertilizers such as
super-phosphate in area which lead to increase
of phosphate concentrations in ground water.
Both phosphate and clay particles have
negative changes resulting in passage of the
ion through soil during rainfalls and
recharging aquifers as described and observed
by Shekha (45). Majority of heavy metals were
not detected in groundwater of study area,
while other heavy metals (Pb, Mn and Ni) are
within range recommended by WHO (50) in
drinking water. Statistical results for
physicochemical parameters revealed only
significant differences at (P<0.05) among
studied sites for most parameters. TDS,
turbidity and calcium values revealed
significant differences among sites and
months. Sodium vice versa had revealed
significant differences among months only.
And for heavy metals were revealed
significant differences among seasons for
Cadmium and chromium only. But for zinc
and iron were non significant for both. Copper
revealed both in seasons and sites. Lead only
in seasons. Nickel in sites.

Iraqi Journal of Agricultural Sciences –1027:49(3):354- 366 AL-Taay & et al.
363
Soil: Physicochemical properties for soil samples
summarized in both tables 5 , 6. Physicochemical
parameters were used to determine quality of soil
for growth of plants and if there are any effect of
cement components on them. pH values of soil
samples revealed no significant differences at all
sites, although it ranged from 7.07 to 8.44 and
showed no appreciable differences within
localities. Differences among pH values may
attributed to differences of water physicochemical
which affects gases and organisms activities, due
to the reduction in CO2 while Photosynthesis and
Respiration (10). Soil with pH greater than 8.5 is
generally called as sodic soil. But pH of all soils
samples are less than 8.5 indicating that soil
samples are free from sodicity hazards. This
redaction could be due to the decreased amount of
carbonate and bicarbonate. Differences within sites
may attribute to site of main stack and wind. Also
pH of water that used for irrigation ranged from
6.67 to 8.23. Statistically there were significant
differences in soil total soluble salts content
between sites but within normal ranges and not far
from results in control sites. Concentrations of
detected metals (Cd, Cr, Cu, Pb, Ni, Fe, and Zn),
showed variable values depending upon the
sampling site. Increment of soil metals in the same
area may be a result of precipitation of heavy
metals over years and that was clear from the
results of main stack soil. These results are lower
than results mentioned by Baban and Aziz (14).
Also here for heavy metals results showed it like
control. Using this factory for 12 years did not
increase concentration of heavy metals to toxic
levels in the soil. Statistical results for
physicochemical parameters revealed
significant differences at (P<0.05) among both
studied sites and months for most parameters.
pH, nitrate and phosphate values revealed
significant differences only among sites. And
for heavy metals were significant for both
seasons and sites just for nickel and zinc were
only in sites.
Plants: Total chlorophyll concentration is a
unifying parameter for indicating the effect of
specific interventions. However, it is important
to record changes in two components of
chlorophyll, chlorophyll A (chla) and
chlorophyll B (chlb) and especially their ratio.
This is due to the fact that heavy metals could
affect each component at a different level
creating changes in some part of plants
physiology and not in others. Concentrations
of chla and chlb and total chlorophyll (total
chl/chla/chlb), were calculated using the
methodology developed by Arnon (13). Here
in this study there were normal values of
heavey metals against normal values of
chlorophyll. Statistical results for total
chlorophyll revealed significant differences at
(P<0.05) among both studied sites and months.
This study indicates that total chlorophyll in
control plants was always higher but not much.
Exposure to particulate deposition may alter
plant growth without physical damage to plant.
Moreover, accumulation of dust particulates
on studied plant leaves could be a major
problem in their production. It was proposed
that the pigments content of light harvesting
complex is an important aspect related to
tolerance of plants to dust pollution.
Chlorophyll content is essential for the
photosynthetic activity and reduction in
chlorophyll content has been used as indicator
of air pollution it is fairly sensitive to air
pollutants. Continuous cement factory
pollution closes stomata so interfering with
gaseous exchange. In all three plants species
growing near factory were having lesser
quantity of chlorophyll (41). In present study it
was not clearly indicates that cement industry
pollution affect photo synthetic activity and
chlorophyll content adversely. Mean
concentrations of some heavy elements in
plants are presented in table 8, for (Platycladus
orientalis , Eucalyptus spp. and Melia
azedarach) respectively. All selected elements
Pb, Cd, Cr, Ni, Fe, Cu and Zn are low and
values are generally below 100mgKg-1
and not
far from control samples results. Statistical
results for heavy metals in plants leaves
revealed significant differences only among
sites for most metals, only for copper and lead
were for both. In this study Melia azedarach
was more sensitive to dust pollution followed
by Eucalyptus spp. and Platycladus oreintalis.
It was not clearly indicates that cement factory
pollution affect photo synthetic activity and
chlorophyll content. In comparison to gaseous
air pollutants, only limited studies have been
carried out on effect of particulates air
pollutants on plants espicially in Sulaimani
city.
Dust of main stack: Cement dust changes
elemental concentration of soil and its
physicochemical properties . It is also major
source of such particulate matter as SOx,

Iraqi Journal of Agricultural Sciences –1027:49(3):354- 366 AL-Taay & et al.
364
NOx, and CO2 emissions. In this study, it
clearly show increase in physicochemical
parameters and heavy metals in dust. Cause
of these results because of it is first point of
dust eject before spreading in air. Plants
results for heavy metals showed that they can
use for biomonitoring of environment quality,
either as bioindicators of quality or as
bioaccumulators of atmospheric deposition.
All results show that most of parameters were
within permissible limits set by WHO (50).
Reasons for this normality in values is might
be due to main stack filters and continously
mesurements for all parameters in and out of
factory, so other factories must follow same
tools, as a result not all industrial factories are
pollution source, if they follow environmental
information.
RECOMMENDATIONS
Other studies should complete other
parameters. Study of bioremediation by micro-
organisms in future. This study must
conducted by other study by genetic tools to
give another evidence for these plants for
accumilation and biomonitoring pollution.
ACKNOWLEDGEMENTS
First, praise be to Allah for sustaining my soul
with nourishment to end this research work.
There are assured people whom without their
support we would have great difficulties
finishing this work. First, it has been a great
benefit working with my supervisors Assistant
professor Dr. Rezan Omer Rasheed and Dr.
Akeel al-assie whom without their guidance,
support and fruitful comments and discussions,
this project would never have been completed.
Special thanks are also extended to support of
chairman and staff at Biology Department,
Sulaimani University college of science. I
didnt forget staff and director of Bazian
cement factory, whom introduce me help all
study periods. Also special thanks to staff of
environment directory.
REFERENCES
1.A.P.H.A. (American Public Health
Association) 1999. Standard Methods for
Examination of Water and Waste Water. 20th
ed. Washington DC, USA. Vol (2).
2.A.P.H.A. (American Public Health
Association) 2005. Standard Methods for the
Examination of Water and Wastewater. 21th
ed. Washington DC, USA. Vol (2).
3.A.P.H.A. (American Public Health
Association) 1998. Standard Methods for the
Examination of Water and Wastewater. 20th
ed. Washington DC, USA. Vol (2).
4.Acharya G. D., M.V. Hathi, A.D. Patel and
K.C.Parmar, , 2008. Chemical properties of
groundwater in bhiloda taluka region, North
Gujarat, India. E-Journal of Chemistry, 5(4):
792-796.
5.Adedeji A and I.T. Ajibade 2005. Quality of
well water in Ede area Southwestern Nigeria.
J. Hum. Ecol. 17:223-228.
6.Adejumo J., O. Obioh, F.Akeredolu,
H.Olaniyi and O. Asubiojo 1994. The
Atmospheric Deposition of Major, Minor and
Trace Elements within and Around Three
Cement Factories. J. Radioanal. Nucl. Chem.
179:95-204.
7.Ahipathy M.V, and E.T.Puttaiah , 2006.
Ecological characteristics of vrishabhavathi
River in Bangalore (India) , Environmental
Geology, 49:1217-1222.
8.Akeredolu F. 1989. Atmospheric
environment problems in Nigeria: An
overview. Atmos. Environ. 23(4):783-792.
9.Al-Shaheen, F.A.A. 2012. Some Ecological
Studies on Saprolegniaceae and their
Pathogenisity to some Fish in Dukan Basin.
M.Sc. thesis, Univ. of Sulaimani. pp. 45.
10.Alyasery, A.A. 2007. Study of
phisichemical of different areas in sok asheuak
and alhbayesh in De gar. De gar Gournal, vol.
3(3): 103-107.
11.Anita Dubey. 2016. Assessment of impact
of cement dust on ground water of the area
near jaypee rewa cement plant, rewa, M.P.
Research inspiration journal; 2(1): 202-207.
12.Anon 1975. Contributions on Natural
Resources Research, Iraq. UNDP Tech. Rep.,
Paris.
13.Arnon D. 1949. Copper Enzymes in
Isolated chloroplasts, polyphenoxidase in beta
vulgaris. plant physiology 24: 1-15.
14.Baban, E. N., and B. K. Aziz, 2015. Two
dimension resistivity imaging/tomography for
hydrogeological study in Bazian basin-west
Sulaimani City, Kurdistan region-Iraq.
In Near-Surface Asia Pacific Conference,
Waikoloa, Hawaii, 7-10 July 2015 (pp. 215-
218).
15.Bartram, J. and R. Balance 1996. Water
quality monitoring – A Practical guide to the

Iraqi Journal of Agricultural Sciences –1027:49(3):354- 366 AL-Taay & et al.
365
design and implementation of freshwater
quality studies and monitoring programs.
united nations environment program and the
World Health Organization. ISBN 0 419
22320 7 (Hbk) 0 419 21730 4 (Pbk).
16.Blezard, R. G. 1998. The history of
calcareous cements. Lea's chemistry of cement
and concrete, 4, 1-23.
17.Dana A. Mohammed Barzinji and Dilshad
G.A. Ganjo 2014. Assessment of the chemical
quality of water in the Halabja-Sulaimani,
Kurdistan Region of Iraq. Asian Journal of
Water, Environment and Pollution, 11(2): 19–
28.
18.Edmund R. E., C. Augusta, Nsonwu-
Anyanwu, J. O. Sunday, A. O. Chinyere, H. E.
Maise and I. E. Deborah 2017. Element
content of surface and underground water
sources around a cement factory site in
calabar, Nigeria. Iranian Journal of
Toxicology. 11(1); 19-25.
19.Estefan, G., R. Sommer, and J. Ryan, 2013.
Methods of soil, plant, and water analysis: a
manual for the West Asia and North Africa
region. ICARDA, Beirut, Lebanon, 143.
20.Farhad H.Aziz and Samiaa J. Abdulwahid
2012. Data base for evaluation water quality
standards of kurdistan region of Iraq.
International journal of the environment and
water. 1(1); 66-79.
21.Farkha, T. K., and A. S. Abdulrahman,
2011. An ecological study on the occurrence
and distribution of aquatic fungi in sarchnar
water spring within Sulaimani
Province/Kurdistan Region of Iraq.Journal of
Al-Nahrain University, 14(4): 137-145.
22.Golterman, H.L. 1975. Physiological
limnology: an approach to the physiology of
lake ecosystems. In Physiological limnology:
an approach to the physiology of lake
ecosystems. Elsevier Scientific.
23.Harter, T. 2003. Groundwater quality and
groundwater pollution. UCANR Publications.
pp.1.
24.Hem, J.D. 1985. Study and Interpretation of
Chemical Characteristics of Natural Water.
USGS Water Supply Paper 254.
http://pubs.usgs.gov/wsp/wsp2254/pdf/intro.
pdf.
25.Hussien, B.M. and M.A. Gharbie 2010.
Hydrogeo-chemical evaluation of ground
water within Abujir Fault Zone , Hit-Kubaisa
Region , central Iraq .Iraqi Bulletin of Geology
and Mining 6(1) :121 -138.
26.Jain C.K. 2002. A Hydro-Chemical study
pf a mountainous watershed: the Ganga ,India,
water Research ,36(5),1262-1274.
27.Kumar, S. S., N. A., Singh, V., Kumar, B.,
S., Sunisha, Preeti, S., Deepali, and S. R. Nath,
(2008). Impact of dust emission on plant
vegetation in the vicinity of cement plant.
Environmental Engineering and Management
Journal, 7(1), 31-35.
28.Maina H. M, J. N. Egila and R. A. Peter
2015. Impact of cement dust deposition on
plants in the vicinity of Ashaka Cement
Factory, Gombe State, Nigeria. ARPN Journal
of Science and Technology. 5(8): 406-414.
29.Maulood B. K. And G. C. F. Hinton 1979.
Tychoplanktonic Diatoms from a Stenothermal
Spring in Iraqi Kurdistan. Br. Phyc. J. 14: 175-
183.
30.McCasland, M., N.M. Trautmann, R.J.
Robert and K.S. Porter, 2007. Nitrate: Health
effects in drinking water.
http://psep.cce.cornell.edu/factsslides-
self/facts/nit-heef-grw85.aspx.
31.Mishra , S. and N. A. Siddiqui , 2014. A
review on environmental and health impacts
of cement manufacturing emissions.
International Journal of Geology, agriculture
and environmental sciences, 2(3), 26-31.
32.Muhammad, Sh. A. 2008. An Ecological
Study on the Tasluja Cement Plant and Mining
Site, Sulaimani- Kurdistan Region of Iraq.
Ph.D. Dissertation Univ. of Sulaimani.
33.Mustafa, O.M. 2006. Impact of Sewage
Wastewater on the Environment of Tanjero
River and its Basin within Sulaimani City /NE
Iraq. M.Sc. thesis Univ. of sulaimani.
34.Olaleye VF 2005. Chthofaun survey of
rivers within Ewekoro Cement Manufacturing
Operational Areas. Biodivers. Conserv.
14:2171-2184.
35.Oluseyi T, K. Olayinka and I. Adeleke
2011. Assessment of groundwater pollution in
the Residential Areas of Ewekoro and
Shagamu due to Cement Production. Afr. J.
Environ. Sci. Technol. 5(10):786-794.
36.Parsone, T.R., Y. Maita, and C.M. Lalli
1984. A Manual of chemical and biological
methods for Sea water analysis. Pergamon
Press, Oxford.

Iraqi Journal of Agricultural Sciences –1027:49(3):354- 366 AL-Taay & et al.
366
37.Patil, V.T. and R.R. Patil, 2010.
Physicochemical Analysis of selected
groundwater samples of amalner town in
Jalgaon District, Maharashtra, India. E-
Journal of Chemistry, 7(1):111-116.
38.Quentin, K.E., and W. Schneider 1988.
Water analysis: A practical guide to physic-
chemical, chemical and microbiological water
examination and quality qssurance. Springer-
Verlag Berlin Heidelberg. New York.
39.Rashid, Kh.A. 2010. Environmental
Implications of Tanjaro Waste Disposal site in
the city of Sulaimani. Ph.D. Dissertation Univ.
of Sulaimani.
40.Ruqia N., K. Muslim, M. Muhammad, R.
Hameed, R.Naveed, S.Surraya, A.Nosheen, S.
Muhammad , U.Mohib, R.Muhammad, and S.
Zeenat 2015. Accumulation of heavy metals
(Ni, Cu, Cd, Cr, Pb, Zn, Fe) in the Soil, Water
and Plants and Analysis of Physico-chemical
parameters of soil and water collected from
Tanda Dam kohat. J. Pharm. Sci. & Res. 7(3):
89-97.
41.Sadhana C. , K.Ashwani and D. G. Anand
2013. Effect of cement industry pollution on
chlorophyll content of some crops at kodinar,
gujarat, India. International Academy of
Ecology and Environmental Sciences, 3(4):
288-295.
42.Sawyer, C.N. and P.L. McCarty 1978.
Chemistry for environmental engineering, 3rd
edition, McGraw-Hill, NY.
43.Schuhmacher, M., J.L. Domingo, and J.
Garreta, 2004. Pollutants Emitted by a Cement
Plant: Health risks for the population living in
the Neighborhood. Environmental Research,
95: 198-206.
44.Shahnawaz M. and K. Singh 2009.
Groundwater quality of Piro and Jagdishpur
Blocks Bhorps district, a middle gangatic
plain. Intl. J. Pharma. Qual. Assur. 1(1):9-10.
45.Shekha, Y.A. 2001. An Ecological study
and bacteriological study for ground water in
Arbil Region. Jour. of Brayati Center. 18: 207-
221.
46.Shraddha M. and A. S. Nehal 2014. A
Review on environmental and health impacts
Of cement manufacturing Emissions. IJGAES.
2(3): 26-31.
47.Theroux, F.R., E.F. Eldridge, and L.W.
Mallmann 2001. Laboratory Manual of
Chemical and Bacterial Analysis of Water and
Sewage. Chopara,Jodhpur Company Inc.
48.Tijani, M. N. 1994. Hydrogeochemical
assessment of ground water in moro area,
Kwara State, Nigeria. Environmental geology,
24; 194-202.
49.Trivedi, R.K. and P.K. Goel, 1984.
Chemical and Biological Methods for Water
Pollution Studies,Environmental Publication,
Karad, India, pp. 251.
50.WHO (World Health Organization) 2006.
Guidelines for Drinking-Water Quality.3rd
ed.
Recommendations, Geneva Switzerland pp.
515.