impact of ammonia and sulphate concentration on thermophilic anaerobic digestion
TRANSCRIPT

Bioresource Technology 101 (2010) 9040–9048
Contents lists available at ScienceDirect
Bioresource Technology
journal homepage: www.elsevier .com/locate /bior tech
Impact of ammonia and sulphate concentration on thermophilic anaerobic digestion
J.A. Siles a, J. Brekelmans b, M.A. Martín a,*, A.F. Chica a, A. Martín a
a Departamento de Química Inorgánica e Ingeniería Química, Facultad de Ciencias, Universidad de Córdoba, Campus Universitario de Rabanales, Edificio C-3,Ctra. Madrid-Cádiz, km 396, 14071 Córdoba, Spainb Colsen b.v., Kreekzoom 5 4561 GX Hulst, The Netherlands
a r t i c l e i n f o
Article history:Received 19 April 2010Received in revised form 28 June 2010Accepted 30 June 2010Available online 13 July 2010
Keywords:Thermophilic anaerobic digestionInhibition phenomenonC/N ratioC/SO2�
4 ratioKinetics
0960-8524/$ - see front matter � 2010 Elsevier Ltd. Adoi:10.1016/j.biortech.2010.06.163
* Corresponding author. Tel.: +34 957 218586; fax:E-mail address: [email protected] (M.A. Martín).
a b s t r a c t
The effect of increasing concentrations of ammonia and sulphate on thermophilic anaerobic digestion(52 �C) was studied at laboratory-scale. The substrate consisted of a synthetic solution supplementedwith ammonia and sodium sulphate. In terms of biogas production, the results showed that the C/Nand C/SO2�
4 thresholds were 4.40 and 1.60, respectively, corresponding to 620 mg FA (free ammonia)/Land 1400 mg SO2�
4 /L. No reduction in biogas production was observed until reaching the above concen-tration of sulphate in the sulphate toxicity test. However, when the concentration of ammonia wasincreased to 620 mg FA/L in the ammonia toxicity test, a gradual decrease of 21% was observed for thebiogas. In order to characterise each set of experiments kinetically, a biogas production first-order kineticmodel was used to fit the experimental data. The proposed model accurately predicted the behaviour ofthe microorganisms affecting the thermophilic anaerobic digestion, allowing its evolution to bepredicted.
� 2010 Elsevier Ltd. All rights reserved.
1. Introduction
Anaerobic digestion is an attractive waste treatment practice inwhich both pollution control and energy recovery can be achieved.Anaerobic digestion is defined as the biological conversion of or-ganic material into a variety of end products including ‘biogas’whose main constituents are methane (65–70%) and carbon diox-ide (Wheatley, 1990). The advantages of anaerobic digestion in-clude low levels of biological sludge, low nutrient requirementsand high efficiency in the production of methane, which can beused as an energy source for on-site heating and electricity (Nal-lathambi Gunaseelan, 2009). The activity of the bacteria involvedin the process varies with its age, morphology and temperature,with optimal temperature conditions at mesophilic (35 �C) andthermophilic (55 �C) range (Demeyer et al., 1981). Anaerobic pro-cesses operating under thermophilic conditions have gained muchattention in recent years due to their apparent advantages overmesophilic processes. Advantages include high pathogen destruc-tion, enhanced hydrolysis of complex organic/biological materials,better volatile solids destruction and higher biogas production po-tential (Santha and Sung, 2001). However, commercial anaerobicdigestion processes often do not achieve optimal performancedue to a wide variety of inhibitory substances or factors, which isusually indicated by a decrease in the steady-state rate of methanegas production and the accumulation of organic acids. The most
ll rights reserved.
+34 957 218625.
significant inhibitors are ammonia, sulphide, light metal ions, hea-vy metals and organics such as phenols or aldehydes (Chen et al.,2008). Knowledge of the possible contaminants present in thewastes, their origins and their degree of toxicity is essential for suc-cessful anaerobic treatment. For example, animal or municipalwastes, food industry wastes (i.e. dairy wastewaters) and agricul-tural residues (i.e. orange peel) often have very high total ammonianitrogen concentrations due to the presence of urea, protein andorganic nitrogen that readily release this compound upon anaero-bic treatment, being the principal instability associated with theanaerobic digestion of these wastes (Hansen et al., 1998). Freeammonia (NH3) has been suggested as the active component caus-ing ammonia inhibition since it is freely membrane-permeable.The ammonia molecule may diffuse passively into the cell due tothe fact that it is uncharged and lipid soluble, causing protonimbalance and consequent changes in the intracellular pH, potas-sium deficiency, an increase in the maintenance energy require-ment and the inhibition of a specific enzyme reaction (Sprott andPatel, 1986). However, significant differences can be found in theliterature regarding the inhibiting ammonia concentration. Kosterand Lettinga (1984) proposed a level of 80 mg N/L of free ammoniaas the minimum inhibitory level, while 150 mg N/L of free ammo-nia was proposed by McCarty and McKinney (1961). Some metha-nogenic strains are inhibited at 4.2 g/L, while others are resistant toammonia levels higher than 10 g/L (Jarrell et al., 1987). Hashimoto(1986) found ammonia inhibition at about 2.5 g N/L for both mes-ophilic and thermophilic reactors when the reactors were not pre-viously acclimatised to ammonia.

Nomenclature
Alk alkalinity (mg CaCO3/L)C/N carbon (g)/Nitrogen (g) ratioC/SO2�
4 carbon (g)/Sulphate (g) ratioCOD soluble soluble chemical oxygen demand (mg/L)FA free ammonia (mg NH3/L)G cumulative biogas volume (mL)Gm cumulative biogas volume at infinite time (mL)G experimental experimental maximum methane volume (mL)K0G apparent kinetic constant (1/h)
KG specific methane production kinetic constant (L/g VSS�h)MS mineral solids (mg/L)OLR organic loading rate (g COD/g VSS�day)t time (h)TAN total ammonia nitrogen (mg/L)TS total solids (mg/L)VA volatile acidity (mg acetic/L)VS volatile solids (mg/L)X biomass concentration (mg VS/L)
J.A. Siles et al. / Bioresource Technology 101 (2010) 9040–9048 9041
Moreover, many industrial wastewaters, such as those from thefermentation, edible oil, paper pulp, food and beverage industriescontain high concentrations (up to 40 g/L) of sulphate (Colleranet al., 1995). The reduction of sulphates during the anaerobic treat-ment of wastewaters is generally undesirable due to a reduction inmethane yield and problems of corrosion, malodour and toxicitycaused by H2S. This toxicity can lead to severe process disturbanceand, in extreme cases, complete process failure (Koster et al.,1986). First, sulphate stimulates the growth of sulphate reducingbacteria which out-compete methane producing bacteria for sub-strates (H2 and acetate). Moreover, H2S readily permeates the cellmembrane and denatures native proteins inside the cytoplasmproducing sulphide and disulphide cross-links between polypep-tide chains. Sulphides are also involved in the precipitation ofnon-alkali metals in digesters, thus reducing their availability formethane producing bacteria (Oude Elferink et al., 1994). However,the literature on anaerobic digestion of sulphate-containing waste-waters is highly complex and often contradictory, making it impos-sible to draw reliable conclusions on inhibition concentrations. Forexample, the optimal level of sulphur reported in the literaturevaries from 1 to 25 mg S/L. Moreover, the levels for inhibition ofmethane producing bacteria also vary, with IC50 values of 50–125 mg H2S/L at pH 7–8 for suspended sludge and 250–90 mgH2S/L at pH 6.4–7.2 and pH 7.8–8.0, respectively (Chen et al.,2008). Additionally, much of the data reported in the literaturewas obtained by adding sulphide to a system rather than by feed-ing sulphate. Thus, the interaction between sulphate reducing andnon-sulphate reducing bacteria was not considered (Parkin et al.,1990).
The major reason for these variations is the complexity of theanaerobic digestion process where mechanisms such as antago-nism, synergism, acclimatisation and complexion could signifi-cantly affect the phenomenon of inhibition (Chen et al., 2008).This can also be attributed to the differences in substrates andinocula concentrations, environmental conditions such as temper-ature and pH, and acclimatisation periods (Angelidaki and Ahring,1994). Nevertheless, various types of inhibition can be counter-acted by increasing the biomass retention in the reactor by immo-bilising the microorganisms with different types of inert material,removing pollutants by air stripping or chemical precipitation,diluting the waste or co-digesting with other substrates. For thisreason, kinetic studies are helpful for reproducing the empiricalbehaviour of the process and understanding the inhibitory mecha-nisms of biodegradation, while saving time and money (Galí et al.,2009). However, the development of an up-to-date model of organ-ic matter anaerobic digestion is fraught with considerable difficul-ties due to the numerous variables involved in an anaerobicsystem. Anaerobic digestion models have basically focussed onsewage sludge, although modelling the treatment of other residueslike wastewater and agro-wastes have recently drawn much atten-tion (Martín et al., 2010).
The main purpose of this study is to determine the ammoniaand sulphate concentration thresholds that may inhibit thermo-philic anaerobic digestion, evaluate the biogas yield coefficient,performance, stability, the most appropriate C/N and C/SO2�
4 ratiosand biogas production kinetics. The study was carried out in fourbatch laboratory-scale reactors at thermophilic temperature(52 �C). From a practical point of view, this research study can beconsidered of special interest given that knowledge about the max-imum thresholds of ammonia and sulphate required to inhibit theanaerobic digestion process is a very important aspect for the pilot-scale and full-scale treatments of highly polluted wastes with sul-phate and ammonia.
2. Methods
2.1. Experimental set-up
The experimental set-up was similar to that described by Jime-nez et al. (2004) and consisted of four 1.5-litre Pyrex reactors withtwo connections to load feedstock, remove effluent and ventilatethe biogas. The content of the reactors was magnetically stirredand temperature was maintained constant at 52 �C by means of aheater system and a thermostatic jacket containing water at54 �C. The generated biogas was collected and the volume mea-sured using 8-litre cylinders connected to each reactor. The cylin-ders contained diluted hydrochloric acid (pH < 2) to avoid thesolubilisation of carbon dioxide from the biogas. A colouring agent(methyl orange) was also added to visualise variations in colourand indicate the pH of the solution. The biogas volume displacedan equal measurable volume of water from the reservoir.
The reactors were inoculated with methanogenically-active bio-mass obtained from a full-scale anaerobic reactor used to treatagricultural wastes (vegetables processing: carrots, spinach, lettuce,etc.) from the Ecofuels b.v. biogas plant (Well, The Netherlands).The inoculum was selected on the basis of its high methanogenicactivity (Field et al., 1988), showing values ranging from 0.98 to1.09 g COD/g VSS�day. Its pH, total ammonia nitrogen (TAN), freeammonia (FA) and sulphate concentrations were found to be7.87, 1960 mg TAN/L, 377 mg FA/L and 198 mg SO2�
4 /L, respec-tively. On the other hand, total solids (TS), volatile solids (VS)and mineral solids (MS) contents were found to be 4.85%, 2.91%and 1.94%, respectively.
2.2. Substrate
The raw material used as substrate in this study consisted of aglucose solution (COD = 115.25 ± 0.35 g/L) supplemented withNa2SO4 and ammonia until reaching the same level found in theinoculum. This solution was used to feed the blanks reactors usedin the experiments. However, the TAN concentration was increased

9042 J.A. Siles et al. / Bioresource Technology 101 (2010) 9040–9048
from 1960 to 4400 mg/L (equivalent to 238–745 mg FA/L) in theammonia toxicity test, while the sulphate content remained atthe initial level (200 mg/L). By contrast, the sulphate concentrationwas increased from 200 to 1800 mg SO2�
4 /L and the TAN level waskept constant (1960 mg/L) in the sulphate toxicity test. All the re-agents were supplied by Boom b.v. (The Netherlands).
2.3. Anaerobic digesters: experimental procedure
The anaerobic reactors were initially loaded with the inoculumat a concentration of 6% TS (w/w). In all cases, a commerciallyavailable nutrient solution (Methanostim plus�, Avecom) wasadded when the sludge was loaded, and periodically during theexperiments (every 20 days). This solution was used to activatebacterial growth and metabolism at the beginning of the processand compensate for the shortage of nutrients in the substrate (Fan-nin, 1987; Field et al., 1988). In some cases, it was also necessary toadd alkalinity periodically to compensate for shortages in the sub-strate. In order to activate the biomass prior to the experiments,the reactors were first fed with the glucose solution at a COD/TS ra-tio of 0.03 (g/g). During this initial period, the organic load added tothe reactors was gradually increased from 0.03 to 0.10 g COD/g TSover an 18-day period. During this acclimatisation period, the vol-ume of biogas was measured as a function of time. Each assaylasted a maximum of 24 h; the time interval required to com-pletely biomethanise each load. Once this preliminary acclimatisa-tion step was finished, a series of batch experiments were carriedout to study ammonia and sulphate inhibition on thermophilicanaerobic digestion. Each set of experiments consisted of one blankand one test reactor. The blanks were fed with the initial substrateas described above, while maintaining the TAN and sulphate con-centrations at constant levels. Given that both blanks operated un-der the same operational conditions, the results were expressed asmeans. As described above, the ammonia and sulphate concentra-tions were gradually increased in the ammonia and sulphate toxic-ity tests, respectively. All the experiments were carried out over a50-day period. In all cases, the volume of biogas was measured as afunction of time and samples were taken and analysed before andafter feeding. The duration of each experiment was equal to thetime interval required for maximum gas production, which wasfound to be in the range of 22–24 h. The organic load added tothe reactors was maintained at 0.1 g COD/g TS and the hydraulicretention time was fixed at 20 days, with recirculation of the solidfraction of the digestate. Each load was carried out at least in dupli-cate and the results expressed as means.
2.4. Chemical analyses
The following parameters were determined in the effluents ofeach load: pH, soluble chemical oxygen demand (COD soluble), to-tal solids (TS), volatile solids (VS), mineral solids (MS), volatile fattyacids (VA), alkalinity (Alk), total ammonia nitrogen (TAN), freeammonia (FA) and sulphate. pH was determined by using aHQ40d (HACH) pH-meter with a gel-filled electrode fitted with atemperature probe (Model 51935-00). In order to determineCOD, TAN and sulphate, a LCK test kit DRLANGE CADAS 30 spectro-photometer was used. TS, VS, MS, VA and Alk analyses were carriedout in accordance with the Standard Methods of the APHA (APHA,1989). Composition of the biogas produced by the reactors wasmeasured by using a Varian CP 3800 gas chromatograph with agas sampling loop using argon as the carrier gas at a flow of50 ml min�1. The chromatograph was fitted with a Haysep C col-umn and a molecular sieve 13 � (80–100 mesh) operating at atemperature of 50 �C. Calibration was performed using a standardgas containing 35% CO2 and 65% CH4 (BOC, Guildford, UK).
2.5. Calculation of the free ammonia concentration
Total ammonia in aqueous solution consists of two principalforms: the ammonium ion ðNHþ4 Þ and un-ionised ammonia (NH3).The relative concentrations of each are pH dependent as describedby the following equilibrium equation:
Ka ¼ ½NH3�½Hþ�½NHþ4 �
ð1Þ
The relative concentrations of the two forms are also temperaturedependent (Emerson et al., 1975):
pKa ¼ 0:09108þ 2729:92ð273:2þ TÞ ð2Þ
Based on Eqs. (1) and (2), and using the pH and temperature ofthe solution, free ammonia concentration was calculated from thefollowing formula (Østergaard, 1985):
½NH3�½TAN� ¼ 1þ 10�pH
10� 0:09018þ2729:92
TðKÞ
� �0B@
1CA�1
ð3Þ
where [NH3] is the concentration of free ammonia (mg/L), [TAN] isthe total ammonia concentration (mg/L) and T (K) is the tempera-ture (Kelvin).
2.6. Software
Sigma-Plot software (version 11.0) was used to design graphs,perform the statistical analysis and fit the experimental data pre-sented in this study.
3. Results and discussion
3.1. Biogas yield coefficient
The biogas yield coefficient was determined from the experi-mental maximum biogas volume produced and the COD added,which were known in all loads. Fig. 1 shows the variation in themean values of the biogas yield coefficient obtained in the blanks(circles) and in the ammonia (triangles) and sulphate toxicity tests(squares) over experimentation time. Additionally, the evolution offree ammonia (solid line) and sulphate (dashed line) concentra-tions are shown. The biogas yield coefficient for the blanks slightlydecreased over the experiments reaching a mean value ± standarddeviation of 440 ± 30 mL biogas/g COD added (at 1 atm, 0 �C), whilethe value of this variable varied for both the ammonia and sulphatetests. Concretely, during the first 14-day period of the ammoniatoxicity test, which corresponded to FA concentrations in the rangeof 220 ± 25 mg/L, no significant differences were observed betweenthe blanks and the toxicity test. Nevertheless, a substantial de-crease from 438 to 347 mL biogas/g COD added (at 1 atm, 0 �C)(21%) was observed when the FA concentration was enhanced untilreaching a concentration of 620 ± 20 mg/L over a 14-day period.Subsequently, the inhibitor concentration was enhanced and main-tained at 745 ± 50 mg/L over a 21-day period and the biogas yieldcoefficient remained relatively constant, showing a mean value of300 ± 10 mL biogas/g COD added (at 1 atm, 0 �C). However, dueto the strong acidification observed during the last 2 days it wasimpossible to recover the microbial activity. On the other hand,for the sulphate toxicity test, the biogas yield coefficient remainedrelatively constant and quite similar to the blanks (430 ± 25 mLbiogas/g COD added) for sulphate concentrations in the range of200–1400 mg/L (over a 26-day period). Nevertheless, this variabledecreased by 12% when the sulphate concentration was increased

Time (d)
0 5 10 15 20 25 30 35 40 45 50
Y b
ioga
s/S
(mL
/g C
OD
add
ed)
0
50
100
150
200
250
300
350
400
450
500
Sulp
hate
(m
g/L
)
0
500
1000
1500
2000
2500
3000
3500
4000
4500
5000
BlankSulphate toxicity testSulphate
Y b
ioga
s/S
(mL
/g C
OD
add
ed)
0
50
100
150
200
250
300
350
400
450
500
550
FA
(m
g/L
)
0
250
500
750
1000
1250
1500
1750
2000
2250
2500
BlankAmmonia toxicity testFree ammonia (FA)
Fig. 1. Variation in biogas yield coefficient with the free ammonia (FA) and sulphate concentration across experiments.
J.A. Siles et al. / Bioresource Technology 101 (2010) 9040–9048 9043
and maintained at 1700 mg/L for 7 days. Moreover, biogas produc-tion decreased to 310 ± 15 mL biogas/g COD added when the sul-phate concentration reached a final value of 1800 mg/L, and alethal inhibition was observed after 7 days under these conditions.
Several biogas samples were taken and analysed from the blankand toxicity tests during the experiments. The mean methane con-tent was found to be 61.9%, 66.0% and 67.4% for the blank, ammo-nia and sulphate test, respectively. The higher methane contentfound in the samples used for the toxicity tests might be due tothe cellular lysis that occurs following the addition of the inhibitorcompounds as highly biodegradable organic matter is easily avail-able for the still active biomass (Koster et al., 1986). According toWheatley (1990), and considering biomass growth and cell main-tenance null, 350 mL of methane are theoretically produced (at1 atm, 0 �C) per gram of COD. In experimental terms, and takinginto account the composition of the biogas, the effectiveness ofthe process was found to be 82% for the blank, which decreasedto 56% in the last step of the ammonia toxicity test at an FA concen-tration of 700 mg/L, and 60% for the sulphate toxicity test. Thismeans that most of the COD removed is employed for methaneproduction and the microbial metabolism is chiefly oriented to-wards generating gas. However, both ammonia and sulphate playa clear role in the inhibition of methanogenic bacteria (Chenet al., 2008). The addition of ammonia to a total concentration of5 or 7 g N/L to the feed of reactors fed with cattle manure contain-ing 2 g N/L resulted in a decrease in the methane yield coefficient
from 0.2 to 0.05 L/g VS after three weeks of operation, correspond-ing to 25% of the methane yield coefficient of the control reactorsreceiving no extra ammonia. The decrease was faster for the reac-tors with 7 g TAN/L (Borja et al., 1996).
3.2. Influence of the C/N and C/SO2�4 ratio
During anaerobic treatment, a complex microbial community(Grotenhuis, 1992) consisting of many interacting microbial spe-cies degrades natural polymers such as polysaccharides, proteins,nucleic acids, and lipids into methane and carbon dioxide in theabsence of oxygen. A wide range of important ratios that influencethis degradation and transformation steps has been described inthe literature (Aiyuk et al., 2006). According to Kizilkaya andBayrakli (2005), microorganisms generally utilise carbon and nitro-gen in the ratio of 25–30:1, but C:N ratios can often be consider-ably lower or higher than this ideal. Sewage sludge, for example,has a C:N ratio of approximately 9:1. On the other hand, Lettinga(1981) and Hulshoff Pol et al. (1998) reported a minimumCOD:SO2�
4 of 10:1, suggesting that H2S inhibition occurs for lowervalues and also leads to obnoxious odour, corrosion, deterioratedbiogas quantity and decreased COD removal. In this study, the C/N and C/SO2�
4 ratios ranged from 14.48 to 3.23 and from 11.25 to1.25, respectively.
Fig. 2 shows the variation in biogas production (mL at 1 atm and0 �C) with the C/N and C/SO2�
4 ratios throughout the experiments.

C/N, C/SO42- ratios
0 2 4 6 8 10 12 14 16
Bio
gas
(mL
)
0
500
1000
1500
2000
2500
3000
3500
4000
4500
Ammonia toxicity testSulphate toxicity test
Fig. 2. Variation in biogas production (at 0 �C and 1 atm) with the C/N and C/SO2�4 ratios.
9044 J.A. Siles et al. / Bioresource Technology 101 (2010) 9040–9048
In the case of the ammonia toxicity test, biogas production rangedfrom 4078 ± 57 mL to 3378 ± 138 mL when the ratio reached a va-lue of 13.0. Biogas production, however, remained stable untilreaching a value of 4.42 (corresponding to an FA concentration of620 ± 20 mg/L), where the most significant decrease was observed(for lower ratios). Consequently, the experimental results indicatethat this is the lowest value that can be reached to prevent com-plete digester failure. Another study on cattle manure at thermo-philic temperature also indicated that free ammonia above700 mg FA/L resulted in poor treatment performance at a pH of7.4–7.9 (Angelidaki and Ahring, 1994). On the other hand, in thesulphate toxicity test this variable remained relatively stable ataround 4098 ± 54 mL for C/SO2�
4 ratios higher than 1.6 (equivalentto 1400 mg SO2�
4 /L), although a strong decrease was observedwhen the ratio decreased, suggesting that this is the threshold thatcould be reached. Choi and Rim (1991) reported that aceticlasticmethane producing bacteria predominated when the COD/SO2�
4 ra-tio was above 2.7 and that sulphate reducing bacteria predomi-nated when this ratio was below 1.7. Active competitionoccurred between these ratios. O’Flaherty and Colleran (1999) re-ported that, after 72 days of operation, the addition of sulphateat a concentration of 4 g/L in the influent of a mesophilic anaerobiclaboratory-scale anaerobic hybrid reactor treating a propionate,butyrate and ethanol-containing wastewater, decreased COD re-moval efficiency by 60%.
3.3. Stability
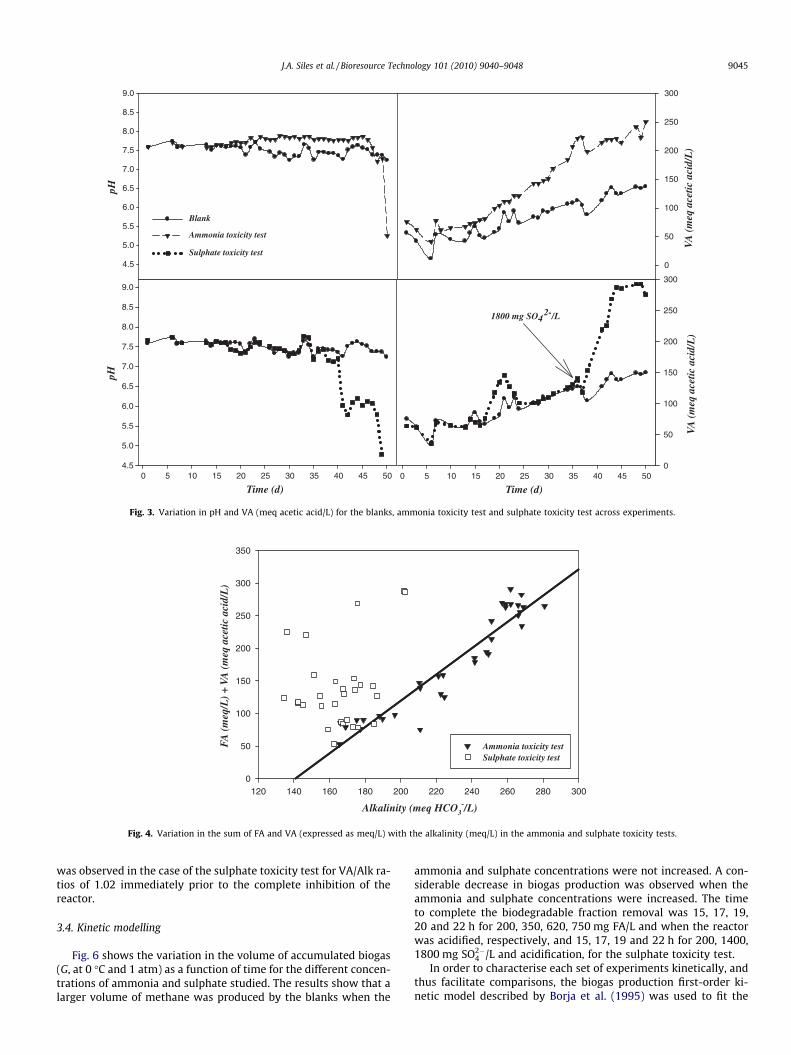
The stability of the process was evaluated based on the varia-tion of the pH, alkalinity (Alk), volatile acidity (VA) and volatileacidity/alkalinity ratio (VA/Alk) during anaerobic digestion. Fig. 3shows the variation in pH and volatile acidity for the blanks (cir-cles), ammonia toxicity test (triangles) and sulphate toxicity test(squares). The pH of the blanks was approximately constant acrossthe experiments, with a mean value of 7.49 ± 0.13, even when theVA increased from 75.4 to 150 meq acetic acid/L. These values re-mained within the optimal range for methanogenic bacteria (Fan-nin, 1987; Wheatley, 1990). On the other hand, the pH was slightlyhigher (7.76 ± 0.09) in the ammonia toxicity test due to the addi-tion of ammonia. However, as ammonia inhibits methanogenmetabolism, VA accumulates, resulting in a lower pH in the laststeps of the study. The VA concentration enhanced from 75.4 to
249.9 meq acetic acid/L, suggesting that the methanogenic bacteriaare not able to digest it. The greatest difference with respect to theVA values obtained in the blank was observed after 25 d. This cor-responds to an FA concentration of 620 ± 20, again suggesting thatthis is the highest threshold that must be reached to operate understable conditions.
By contrast, pH and VA evolved in a very similar manner in boththe sulphate toxicity test and in the blank for sulphate concentra-tions of 1400 mg/L. However, clear differences were observedwhen reaching a concentration of 1800 mg SO2�
4 . Under these con-ditions, pH decreased to 6.02 ± 0.15 prior to a lethal acidification atpH 4.79, and VA was enhanced until reaching a final value of292.7 meq acetic acid/L.
Moreover, providing excess ammonia also contributed to the in-creased alkalinity of the experimental digester. One effect of add-ing ammonia was increased bicarbonate concentration in thedigester due to the formation of an ammonium salt with bicarbon-ate taken from dissolved CO2 (Georgacakis et al., 1982):
NHþ4 þ OH�¢ NH3 þH2O ð4ÞCO2 þH2O ¢ Hþ þHCO�3 ð5ÞNHþ4 þ OH� þHþ þHCO�3 ¢ ðNHþ4 þHCO�3 Þsalt þH2O ð6Þ
Fig. 4 shows the variation in the sum of FA and VA (expressed asmeq of NH3/L and meq acetic acid/L, respectively) with the alkalin-ity concentration in both the ammonia and sulphate toxicity tests.As can be observed, there is no clear trend in the data for the sul-phate test, while a clear proportionally is shown for the ammoniatest as a consequence of the previously described reactions (4)–(6).
Fig. 5 shows the variation in the biogas production with the VA/Alk ratio for both the ammonia and sulphate toxicity tests as wellas for the blanks. The volatile acidity (VA)/alkalinity (Alk) ratioindicates reactor instability and should preferably be much lessthan unity (Aiyuk et al., 2006). As can be observed, biogas produc-tion decreased in all the cases when the VA/Alk ratio increased,although the blank remained relatively stable with a 17% decreasein biogas production. Nevertheless, biogas production decreased byaround 46% when the VA/Alk ratio increased to 0.86 due to theaddition of ammonia in the test reactor (745 mg FA/L). These re-sults are in line with those published by Gallert and Winter(1997), who reported that a free ammonia concentration of 560–568 mg FA/L led to a 50% inhibition in methanogenesis at pH 7.6under thermophilic conditions. On the other hand, a 39% decrease
VA
(m
eq a
cetic
aci
d/L
)
0
50
100
150
200
250
300
pH
4.5
5.0
5.5
6.0
6.5
7.0
7.5
8.0
8.5
9.0
Blank
Ammonia toxicity test
Time (d)0 5 10 15 20 25 30 35 40 45 50
VA
(m
eq a
cetic
aci
d/L
)
0
50
100
150
200
250
300
Sulphate toxicity test
Time (d)0 5 10 15 20 25 30 35 40 45 50
pH
4.5
5.0
5.5
6.0
6.5
7.0
7.5
8.0
8.5
9.0
1800 mg SO42-/L
Fig. 3. Variation in pH and VA (meq acetic acid/L) for the blanks, ammonia toxicity test and sulphate toxicity test across experiments.
Alkalinity (meq HCO3-/L)
120 140 160 180 200 220 240 260 280 300
FA
(m
eq/L
) +
VA (
meq
ace
tic a
cid/
L)
0
50
100
150
200
250
300
350
Ammonia toxicity testSulphate toxicity test
Fig. 4. Variation in the sum of FA and VA (expressed as meq/L) with the alkalinity (meq/L) in the ammonia and sulphate toxicity tests.
J.A. Siles et al. / Bioresource Technology 101 (2010) 9040–9048 9045
was observed in the case of the sulphate toxicity test for VA/Alk ra-tios of 1.02 immediately prior to the complete inhibition of thereactor.
3.4. Kinetic modelling
Fig. 6 shows the variation in the volume of accumulated biogas(G, at 0 �C and 1 atm) as a function of time for the different concen-trations of ammonia and sulphate studied. The results show that alarger volume of methane was produced by the blanks when the
ammonia and sulphate concentrations were not increased. A con-siderable decrease in biogas production was observed when theammonia and sulphate concentrations were increased. The timeto complete the biodegradable fraction removal was 15, 17, 19,20 and 22 h for 200, 350, 620, 750 mg FA/L and when the reactorwas acidified, respectively, and 15, 17, 19 and 22 h for 200, 1400,1800 mg SO2�
4 /L and acidification, for the sulphate toxicity test.In order to characterise each set of experiments kinetically, and
thus facilitate comparisons, the biogas production first-order ki-netic model described by Borja et al. (1995) was used to fit the

VA (eq acetic) / Alk (eq HCO 3-)
0.2 0.3 0.4 0.5 0.6 0.7 0.8 0.9
Bio
gas
(mL
)
0
1000
2000
3000
4000
5000
Blak
Ammonia toxicity test
VA (eq acetic) / Alk (eq HCO 3-)
0.2 0.3 0.4 0.5 0.6 0.7 0.8 0.9 1.0 1.1
Sulphate toxicity test
Fig. 5. Variation in biogas production (at 0 �C and 1 atm) with the VA/Alk ratio for the blanks and ammonia and sulphate toxicity tests.
G (
mL
)
0
500
1000
1500
2000
2500
3000
3500
4000
4500
200 mg FA/L350 mg FA/L620 mg FA/L750 mg FA/LAcidification
Time (h)
0 5 10 15 20 25 30
G (
mL
)
0
500
1000
1500
2000
2500
3000
3500
4000
200 mg SO42-
/L
1400 mg SO42-/L
1800 mg SO42/L
Acidification
Sulphate toxicity test
Ammonia toxicity test
Fig. 6. Variation in biogas volume accumulated (G) (at 0 �C and 1 atm) as a function of time for increasing loads of FA and sulphate.
9046 J.A. Siles et al. / Bioresource Technology 101 (2010) 9040–9048
experimental data. According to this model, the volume of biogasaccumulated (G) (mL, at 1 atm, 0 �C) at a given time t (h) fits thefollowing equation:
G ¼ Gm½1� expð�KG0tÞ� ð7Þ
where Gm is the maximum biogas volume accumulated at an infi-nite digestion time; G is zero at t = 0 and the rate of gas production
becomes zero at t equal to infinite. KG0 is an apparent kinetic con-
stant for biogas production (h�1) that includes biomassconcentration:
K 0G ¼ KG � X ð8Þ
where KG is the specific methane production kinetic constant (L/gVS�h) and X is the biomass concentration (g VS/L), which remained

Table 1OLR, Gexperimental, Gm, KG
0 , KG and R2 values with standard deviations obtained for different FA concentrations.
FA (mg/L) OLR (g COD/g VS�d) Gexperimental (mL) Gm (mL) KG0 (h�1) KG (L/g h) R2
200 0.280 4032 ± 119 4203 ± 60 0.1619 ± 0.0074 0.0047 ± 0.0002 0.9892350 0.247 3439 ± 132 3620 ± 82 0.1509 ± 0.0093 0.0044 ± 0.0003 0.9887620 0.221 3101 ± 105 3314 ± 75 0.1481 ± 0.0099 0.0043 ± 0.0003 0.9863750 0.201 2752 ± 71 2929 ± 56 0.1264 ± 0.0069 0.0037 ± 0.0002 0.9925Acidification 0.191 1923 ± 36 2009 ± 60 0.1212 ± 0.0095 0.0035 ± 0.003 0.9859
Table 2OLR, Gexperimental, Gm, KG
0 , KG and R2 values with standard deviations obtained for different sulphate concentrations.
Sulphate (mg/L) OLR (g COD/g VS�d) Gexperimental (mL) Gm (mL) KG0 (h�1) KG (L/g h) R2
200 0.280 4032 ± 119 4203 ± 60 0.1619 ± 0.0074 0.0047 ± 0.0002 0.98921400 0.247 3487 ± 200 3869 ± 133 0.1317 ± 0.0130 0.0038 ± 0.0005 0.97921800 0.201 2768 ± 125 2974 ± 75 0.1303 ± 0.0128 0.0037 ± 0.0004 0.9948Acidification 0.191 1554 ± 15 1627 ± 80 0.1254 ± 0.0115 0.0036 ± 0.0006 0.9651
J.A. Siles et al. / Bioresource Technology 101 (2010) 9040–9048 9047
relatively constant throughout the experiments (3.43% VS). The KG0
and Gm values for each load were calculated numerically from theexperimental data obtained by non-linear regression using Sigma-Plot (version 11.0). Tables 1 and 2 show the Gm and KG
0 valuesand their standard deviations obtained in the experiments, whichwere always lower than 3% and 8% in the ammonia toxicity testand lower than 5% and 10% for the sulphate test, respectively. Thissuggests that the proposed model adequately fits the experimentaldata for all the loads studied. Additionally, the theoretical values ofmaximum biogas production (Gm) were calculated using Eq. (7) andcompared with their corresponding experimental values. The devi-ations obtained were lower than 7% in practically all cases; againsuggesting that the proposed model can be used to accurately pre-dict the behaviour of the process and that the kinetic parametersobtained represent the behaviour of the microorganisms affectingthe thermophilic anaerobic digestion under the effect of increasingconcentrations of ammonia or sulphate. From the K0G values, andonce the biomass concentration values were determined, the valuesof the specific methane production kinetic constant, KG, were calcu-lated using Eq. (8). Tables 1 and 2 also show these KG values. Amarked decrease in the KG value was observed when the FA and sul-phate concentrations were increased. In the case of the ammoniatoxicity test, a decrease of 25.5% was observed and the allowed or-ganic loading rate (OLR) varied from 0.280 to 0.191 g COD/g VS�ddue to the greater amount of time needed to digest the substrate.In a parallel manner, a 23.4% decrease was found for the sameOLR variation in the sulphate toxicity test, again indicating thatinhibition occurred due to the addition of these inhibitor com-pounds in the reactors.
4. Conclusions
Thermophilic anaerobic digestion is clearly affected by increas-ing concentrations of ammonia and sulphate. In terms of biogasproduction, the threshold C/N and C/SO2�
4 ratios were found to be4.40 and 1.60, respectively, which correspond to 620 mg FA/Land 1400 mg SO2�
4 /L. The first-order kinetic model proposed pre-dicts the behaviour of anaerobic digestion under the study condi-tions. The kinetic parameters obtained show the relationshipbetween the rate and maximum biogas production and the con-centration of each inhibitor compound. These data are very inter-esting for carrying out the full-scale treatment of substrates witha high concentration of ammonia and/or sulphate.
Acknowledgements
The authors are very grateful to the Colsen b.v. Agency (Hulst,The Netherlands) and The Spanish Ministry of Science and Innova-
tion for funding José Ángel Siles López through Project CTM2005-01293 and Grant BES-2006-14074. This study was co-financed bythe European Social Fund. We also wish to express our gratitudeto Jorrit Hillaert, Witsea Harmsen and Davey Smet for their contri-bution to this research.
References
Aiyuk, S., Forrez, I., Lieven, D.K., van Haandel, A., Verstraete, W., 2006. Anaerobic andcomplementary treatment of domestic sewage in regions with hot climates—areview. Bioresour. Technol. 97, 2225–2241.
Angelidaki, I., Ahring, B.K., 1994. Anaerobic thermophilic digestion of manure atdifferent ammonia loads: effect of temperature. Water Res. 28, 727–731.
APHA (American Public Health Association), 1989. Standard Methods for theExamination of Water and Wastewater, 17th ed. Washington, DC, USA.
Borja, R., Martín, A., Alonso, V., García, C.J., Banks, C.J., 1995. Influence of differentpretreatments on the kinetics of anaerobic digestion of olive mill wastewater.Water Research 29, 489–495.
Borja, R., Sánchez, E., Weiland, P., 1996. Influence of ammonia concentration onthermophilic anaerobic digestion of cattle manure in Upflow Anaerobic SludgeBlanket (UASB) reactors. Proc. Biochem. 31 (5), 477–483.
Colleran, E., Finnegan, S., Lens, P., 1995. Anaerobic treatment of sulphate-containingwastestreams. Antonie van Leeuwenhoek 67, 29–46.
Chen, Y., Cheng, J.J., Creamer, K.S., 2008. Inhibition of anaerobic digestion process: areview. Bioresour. Technol. 99 (10), 4044–4064.
Choi, E., Rim, J.M., 1991. Competition and inhibition of sulfate reducers andmethane producers in anaerobic treatment. Water Sci. Technol. 23, 1259–1264.
Demeyer, A., Jacob, F., Jay, M., Menguy, G., Perrier, J., 1981. La ConversionBioénergétique du Rayonnement Solaire et les Biotechnologies. Editiontechnique et documentation, Paris.
Emerson, K., Russo, R.C., Lund, R.E., Thurston, R.V., 1975. Aqueous ammoniaequilibrium calculation: effect of pH and temperature. J. Fish. Res. Board Can.32, 2379–2383.
Fannin, K.F., 1987. Start-up, operation, stability and control. In: Chynoweth, D.P.,Isaacson, R. (Eds.), Anaerobic Digestion of Biomass. Elsevier, London, pp. 171–196.
Field, J., Sierra, R., Lettinga, G., 1988. Ensayos anaerobios. In: Fdz.-Polanco, F., García,P.A., Hernando, S. (Eds.), 4 Seminario de Depuración Anaerobia de AguasResiduales. Spain, Secretariado de Publicaciones, Universidad de Valladolid,Valladolid, pp. 52–82.
Galí, A., Benabdallah, T., Astals, S., Mata-Alvarez, J., 2009. Modified version of ADM1model for agro-waste application. Bioresour. Technol. 100, 2783–2790.
Gallert, C., Winter, J., 1997. Mesophilic and thermophilic anaerobic digestion ofsource-sorted organic waste: effect of ammonia on glucose degradation andmethane production. Appl. Microbiol. Biotechnol. 48, 405–410.
Georgacakis, D., Sievers, D.M., Iannotti, E.L., 1982. Buffer stability in manuredigesters. Agri. Wastes 4, 427–441.
Grotenhuis, J.T.C., 1992. Structure and stability of methanogenic granular sludge.Ph.D. Thesis. Wageningen University, Wageningen, The Netherlands.
Hansen, K.H., Angelidaki, I., Ahring, B.K., 1998. Anaerobic digestion of swinemanure: inhibition by ammonia. Water Research 32, 5–12.
Hashimoto, G., 1986. Ammonia inhibition of methanogenesis from cattle wastes.Agric. Wastes 17, 241–261.
Hulshoff Pol, L.W., Lens, P.N.L., Stams, A.J.M., Lettinga, G., 1998. Anaerobic treatmentof sulphate rich wastewater. Biodegradation 9, 213–224.
Jarrell, K.F., Saulnier, M., Ley, A., 1987. Inhibition of methanogenesis in pure culturesby ammonia, fatty acids, and heavy metals, and protection against heavy metaltoxicity by sewage sludge. Can. J. Microbiol. 33, 551–555.
Jimenez, A.M., Borja, R., Martín, A., 2004. A comparative kinetic evaluation of theanaerobic digestion of untreated molasses and molasses previously fermentedwith Penicillium decumbens in batch reactors. Biochem. Eng. J. 18 (2), 121–132.

9048 J.A. Siles et al. / Bioresource Technology 101 (2010) 9040–9048
Kizilkaya, R., Bayrakli, B., 2005. Effects of N-enriched sewage sludge on soil enzymeactivities. Appl. Soil Ecol. 30, 192–202.
Koster, I.W., Lettinga, G., 1984. The influence of ammonium-nitrogen on the specificactivity of pelletized methanogenic sludge. Agric. Wastes 9, 25–216.
Koster, I.W., Rinzema, A., de Vegt, A.L., Lettinga, G., 1986. Sulphide inhibition of themethanogenic activity of granular sludge at different pH levels. Water Research12, 1561–1567.
Lettinga, G., 1981. Anaerobic treatment of wastewater and energy production. Inter-American Seminar on Biogas. Joao Pessoa, Brazil.
Martín, M.A., Siles, J.A., Chica, A.F., Martín, A., 2010. Modelling the anaerobicdigestion of wastewater derived from the pressing of orange peel produced inorange juice manufacturing. Bioresour. Technol. 101 (11), 3909–3916.
McCarty, P.L., McKinney, R.E., 1961. Salt toxicity in anaerobic digestion. J. WaterControl Fed. 33, 399–415.
Nallathambi Gunaseelan, V., 2009. Biomass estimates, characteristics, biochemicalmethane potential, kinetics and energy flow from Jatropha curcus on dry lands.Biomass. Bioen. 33 (4), 589–596.
O’Flaherty, V., Colleran, E., 1999. Effect of sulphate addition on volatile fatty acidand ethanol degradation in an anaerobic hybrid reactor I: process disturbanceand remediation. Bioresour. Technol. 68, 101–107.
Oude Elferink, J.W.H.S., Visser, A., Hulshoff Pol, L.W., Stams, A.J.M., 1994. Sulfatereduction in methanogenic bioreactors. FEMS Microbiol. Rev. 15, 119–136.
Østergaard, N., 1985. Biogasproduktion i det thermofile temperaturinterval. STUBrapport nr. 21. Kemiteknik Dansk Teknologisk Institut, Taastrup.
Parkin, G.F., Lynch, N.A., Kuo, W., Van Keuren, E.L., Bhattacharya, S.K., 1990.Interaction between sulfate reducers and methanogens fed acetate andpropionate. Res. J. Water Pollut. Control Fed. 62, 780–788.
Santha, H., Sung, S., 2001. Valuable by-products recovery from cattle wastes usingtemperature-phased anaerobic digestion process. In: WEF’s Biosolids SpecialtyConference 2001, San Diego, CA.
Sprott, G.D., Patel, G.B., 1986. Ammonia toxicity in pure cultures of methanogenicbacteria system. Appl. Microbiol. 7, 358–363.
Wheatley, A., 1990. Anaerobic Digestion: A Waste Treatment Technology. Elsevier,London.