impact of accelerated stresses on power transformer insulation · transformer oil as per is: 335 -...
TRANSCRIPT
Energy and Power Engineering, 2017, 9, 217-231 http://www.scirp.org/journal/epe
ISSN Online: 1947-3818 ISSN Print: 1949-243X
DOI: 10.4236/epe.2017.94015 April 20, 2017
Impact of Accelerated Stresses on Power Transformer Insulation
Jashandeep Singh1, Yog Raj Sood2, Piush Verma1
1Rayat-Bahra Group of Institution, Patiala, Punjab, India 2NIT, Puducherry, India
Abstract The paper is based on the experimental investigation of accelerated stresses on insulation of power transformer. The effects of individual thermal and elec-trical stresses have been graphically presented. The factors accelerated thermal aging factor (ATAF) and accelerated electrical aging factor (AEAF) have been introduced, it helps to understand the contribution of thermal and electrical stresses and degradation trends of insulating properties. The accelerated aging factors have been mathematically correlated with different properties of insu-lation such as moisture, breakdown voltage (BDV), tan delta and resistivity. These parameters were determined experimentally for fresh oil samples and for samples subjected to accelerated aging.
Keywords Accelerated Thermal Aging Factor (ATAF), Accelerated Electrical Aging Factor (AEAF), Moisture, Breakdown Voltage (BDV), Resistivity, Tan Delta
1. Introduction
The insulation of power transformer degraded under a combination of various stresses. The stresses reduce the dielectric capability of a transformer and increase the probability of failure. In this paper, the impact of accelerated stresses of power transformer insulation is presented. The various parameters used to measure these impacts are moisture, breakdown voltage (BDV), tan δ and resistivity [1].
2. Experimentation
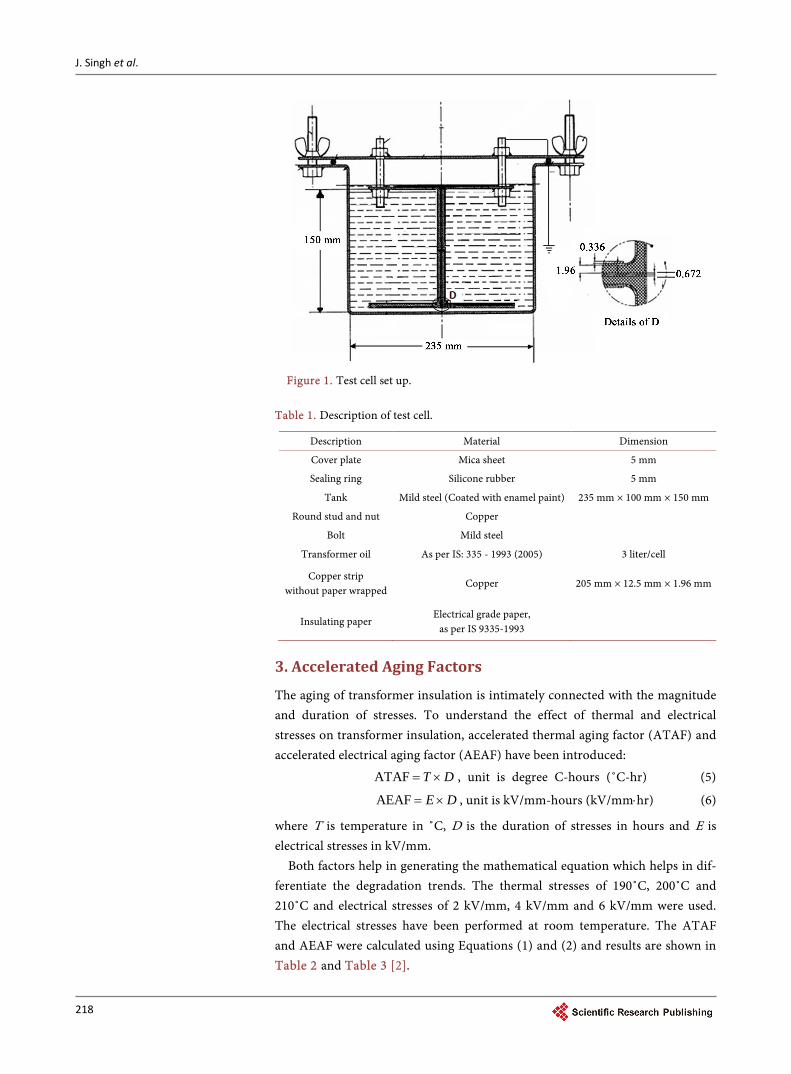
To measure the impact of accelerated thermal and electrical stresses on the transformer insulating oil, the special test cell shown in Figure 1 has been fabri-cated. The capacity of the test cell was 3 liters. The description of test cell is given in Table 1 [2].
How to cite this paper: Singh, J., Sood, Y.R. and Verma, P. (2017) Impact of Acce-lerated Stresses on Power Transformer Insulation. Energy and Power Engineering, 9, 217-231. https://doi.org/10.4236/epe.2017.94015 Received: July 18, 2017 Accepted: April 17, 2017 Published: April 20, 2017 Copyright © 2017 by authors and Scientific Research Publishing Inc. This work is licensed under the Creative Commons Attribution International License (CC BY 4.0). http://creativecommons.org/licenses/by/4.0/
Open Access
J. Singh et al.
218
Figure 1. Test cell set up.
Table 1. Description of test cell.
Description Material Dimension
Cover plate Mica sheet 5 mm
Sealing ring Silicone rubber 5 mm
Tank Mild steel (Coated with enamel paint) 235 mm × 100 mm × 150 mm
Round stud and nut Copper
Bolt Mild steel
Transformer oil As per IS: 335 - 1993 (2005) 3 liter/cell
Copper strip without paper wrapped
Copper 205 mm × 12.5 mm × 1.96 mm
Insulating paper Electrical grade paper,
as per IS 9335-1993
3. Accelerated Aging Factors
The aging of transformer insulation is intimately connected with the magnitude and duration of stresses. To understand the effect of thermal and electrical stresses on transformer insulation, accelerated thermal aging factor (ATAF) and accelerated electrical aging factor (AEAF) have been introduced:
ATAF T D= × , unit is degree C-hours (˚C-hr) (5)
AEAF E D= × , unit is kV/mm-hours (kV/mm⋅hr) (6)
where T is temperature in ˚C, D is the duration of stresses in hours and E is electrical stresses in kV/mm.
Both factors help in generating the mathematical equation which helps in dif-ferentiate the degradation trends. The thermal stresses of 190˚C, 200˚C and 210˚C and electrical stresses of 2 kV/mm, 4 kV/mm and 6 kV/mm were used. The electrical stresses have been performed at room temperature. The ATAF and AEAF were calculated using Equations (1) and (2) and results are shown in Table 2 and Table 3 [2].

J. Singh et al.
219
Table 2. Accelerated Thermal Aging Factor (ATAF).
Temperature (˚C) Aging (hours) ATAF (˚C-hr)
190 150 ATAF1 = 28,500
200 150 ATAF2 = 30,000
210 150 ATAF3 = 31,500
190 300 ATAF4 = 57,000
200 300 ATAF5 = 60,000
210 300 ATAF6 = 63,000
190 450 ATAF7 = 85,500
200 450 ATAF8 = 90,000
210 450 ATAF9 = 94,500
190 600 ATAF10 = 114,000
200 600 ATAF11 = 120,000
210 600 ATAF12 = 126,000
190 750 ATAF13 = 142,500
200 750 ATAF14 = 150,000
210 750 ATAF15 = 157,500
Table 3. Accelerated Electrical Aging Factor (AEAF).
Electrical stress (kV/mm) Aging (hours) AEAF (kV/mm-hr)
2 150 AEAF1 = 300
2 300 AEAF2 = 600
4 150
2 450 AEAF3 = 900
6 150
2 600 AEAF4 = 1200
4 300
2 750 AEAF5 = 1500
4 450 AEAF6 = 1800
6 300
4 600 AEAF7 = 2400
6 450 AEAF8 = 2700
4 750 AEAF9 = 3000
6 600 AEAF10 = 3600
6 750 AEAF11 = 4500
4. Moisture Content
The virgin insulating oil and paper have moisture content of 50 ppm and about 0.5% by weight respectively. Moisture in the transformer reduces the insulation strength. The main reasons for moisture content changes over the life cycle are:
J. Singh et al.
220
moisture interactivity with environment due to leakage, additional moisture generation due to chemical reactions [3], transformer breathing, decomposing the cellulosic materials under stresses, aging phenomena, exposure to atmos-pheric moisture during maintenance, failure to dry out the insulation during manufacturing [4]. The moisture content is a life-shortening parameter. It can weakens the withstand breakdown voltage of the insulation system [5], promotes local heating, reduces the overload capability of transformers in emergency con-ditions [6], accelerates the process of insulation deterioration [5], decreasing the electrical and mechanical strength [7]. Electrical or partial discharges can occur in a high voltage region due to a disturbance of the moisture equilibrium [8] [9] increase the electrical conductivity and dissipation factor. According to Fabre [10], the rate of thermal aging of paper is proportional to its moisture content. Moisture in transformer oil can also lead to partial discharge, bubble formation when high temperatures are attained in the winding and an abrupt desorption of moisture takes place from the paper toward the oil [9]. Moisture is a polar liquid having high permittivity and therefore is attracted to areas of strong electrical field [11]. As the transformer warms up, moisture migrates from the solid insu-lation into the fluid. The rate of migration depends on the conductor tempera-ture and the rate-of-change of conductor temperature. The moisture moving between the cellulose and oil are different for each direction as the moisture in the cellulose is not evenly distributed. The migration of small amounts of mois-ture from paper to oil has been associated with the phenomenon of static electri-fication appearing when there is a charge accumulation on the interfaces be-tween dry and humid zones [12] [13]. Moisture transfer can be activated by moisture concentration gradient, temperature gradient and pressure gradient [13]. In addition dissolved moisture in oil can precipitate out during rapid cool down periods and become free water which may or may not re-dissolve [14]. Excessive amounts of moisture can accelerate the degradation process of the cellulose and prematurely aged the transformers insulation system [14].
The moisture in cellulosic insulation may be determined from moisture in oil samples using oil/paper moisture equilibrium curves such as Fabre-Pichon curves, Oommen curves, Griffin curves, MIT curves [11] [16] Infra red tech-niques (IR) and Interfacial polarization (IP) [17] [18] [19].
5. Breakdown Voltage (BDV)
The breakdown voltage (BDV) is an important parameter to gauge the condition of oil. The BDV of oil is high when it is dry and clean, it goes down slowly as the moisture contents and conducting impurities increase as a result of oxidation of oil [20]. The BDV decreases consistently with aging because of release of mois-ture in the oil, due to increase in the size and number density of free particles generated due to dissolved gases and polar compounds, etc. [21]. The BDV bears a non-linear relationship with aging [20]. The breakdown characteristics depend on initial moisture of the insulation, initial temperature and temperature gra-dient.
J. Singh et al.
221
6. Results and Discussions
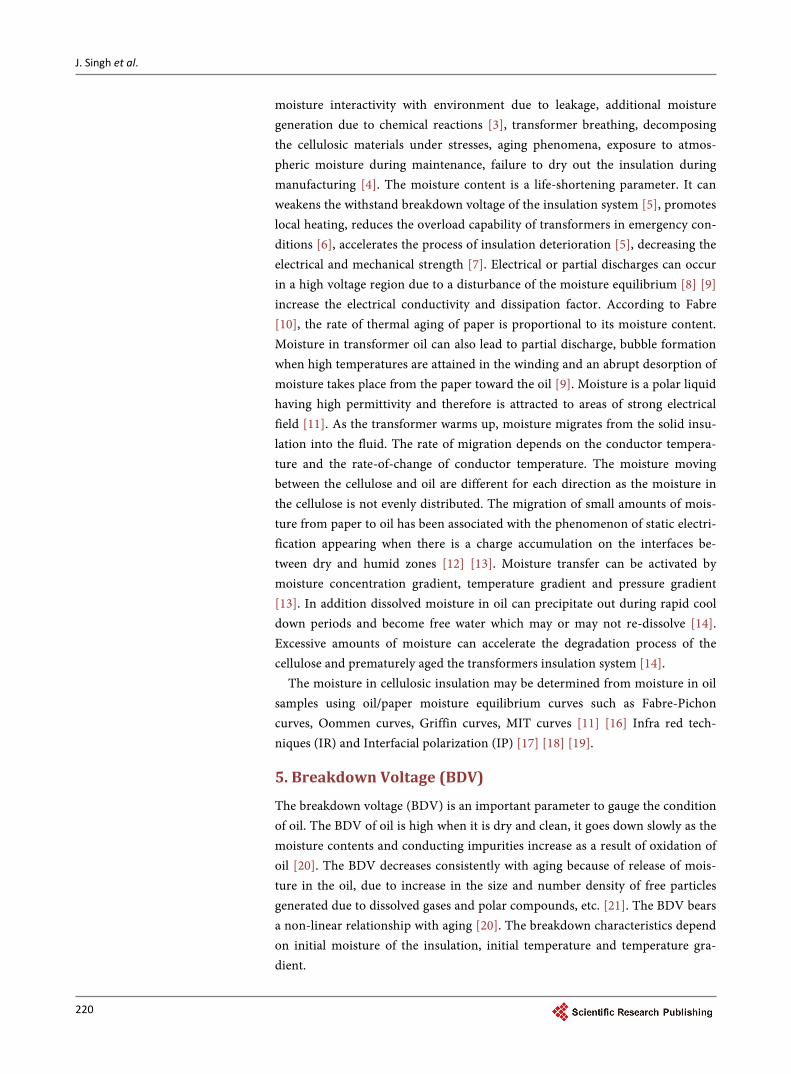
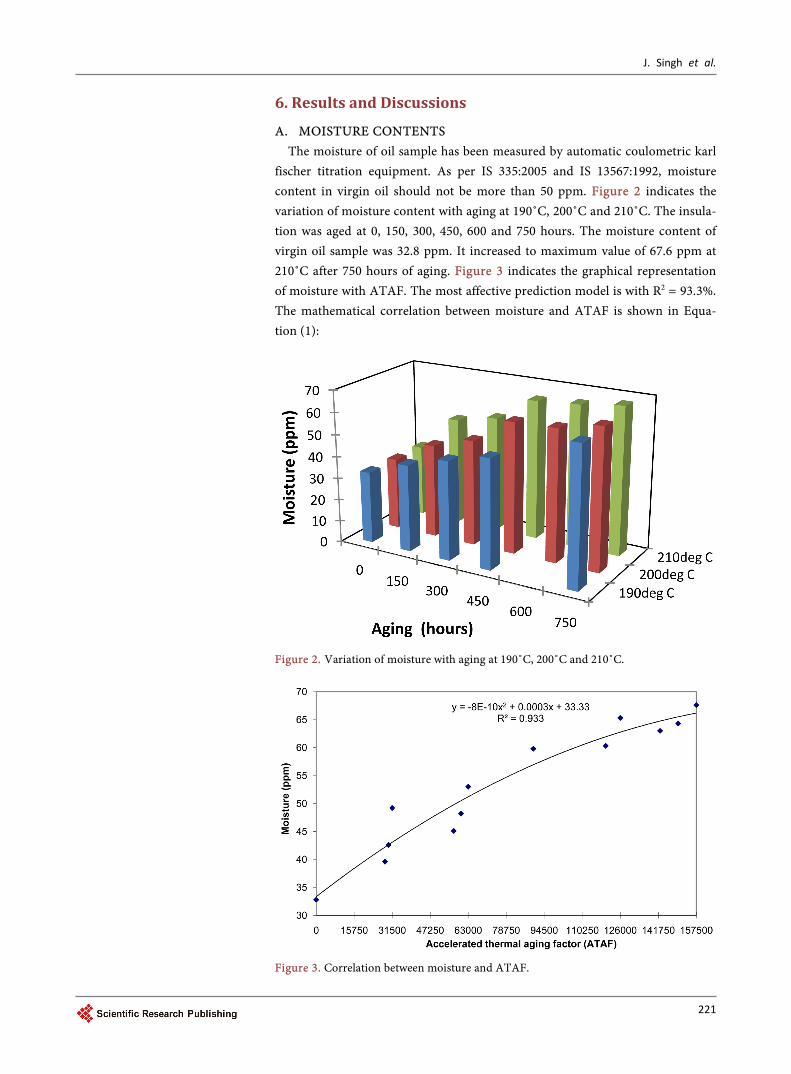
A. MOISTURE CONTENTS The moisture of oil sample has been measured by automatic coulometric karl
fischer titration equipment. As per IS 335:2005 and IS 13567:1992, moisture content in virgin oil should not be more than 50 ppm. Figure 2 indicates the variation of moisture content with aging at 190˚C, 200˚C and 210˚C. The insula-tion was aged at 0, 150, 300, 450, 600 and 750 hours. The moisture content of virgin oil sample was 32.8 ppm. It increased to maximum value of 67.6 ppm at 210˚C after 750 hours of aging. Figure 3 indicates the graphical representation of moisture with ATAF. The most affective prediction model is with R2 = 93.3%. The mathematical correlation between moisture and ATAF is shown in Equa-tion (1):
Figure 2. Variation of moisture with aging at 190˚C, 200˚C and 210˚C.
Figure 3. Correlation between moisture and ATAF.
J. Singh et al.
222
( )10 2Moisture 8 10 ATAF 0.0003ATAF 33.33−= − × + + (1)
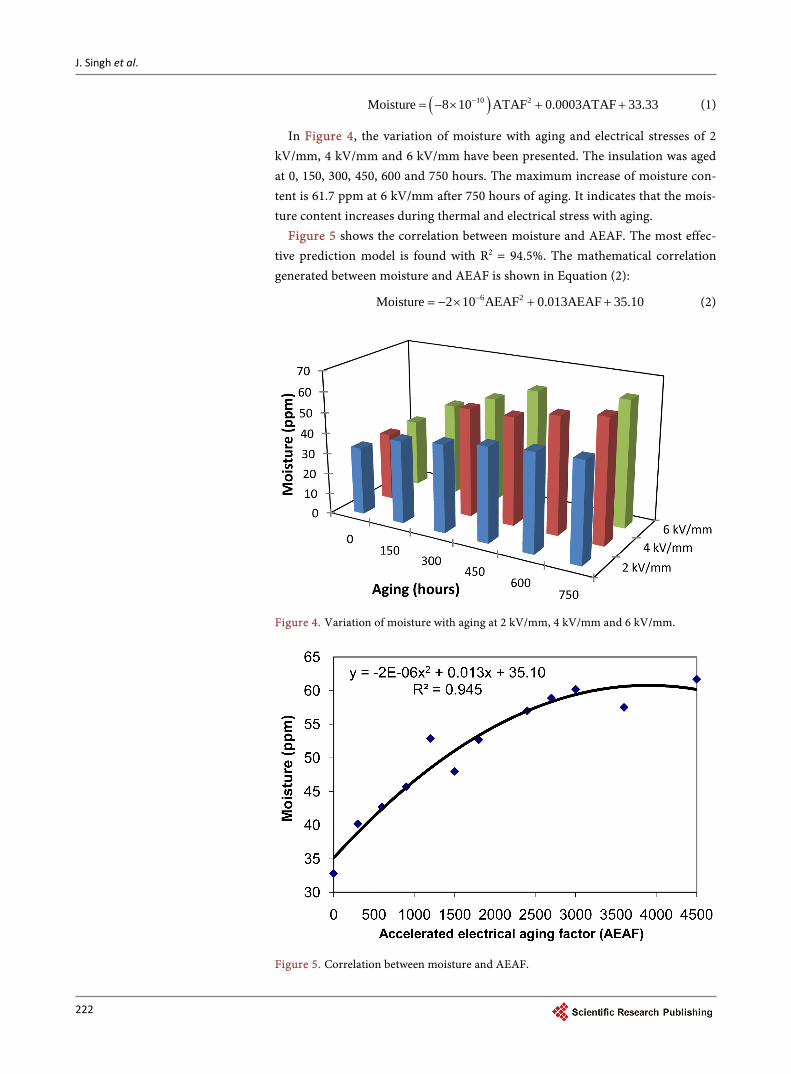
In Figure 4, the variation of moisture with aging and electrical stresses of 2 kV/mm, 4 kV/mm and 6 kV/mm have been presented. The insulation was aged at 0, 150, 300, 450, 600 and 750 hours. The maximum increase of moisture con-tent is 61.7 ppm at 6 kV/mm after 750 hours of aging. It indicates that the mois-ture content increases during thermal and electrical stress with aging.
Figure 5 shows the correlation between moisture and AEAF. The most effec-tive prediction model is found with R2 = 94.5%. The mathematical correlation generated between moisture and AEAF is shown in Equation (2):
6 2Moisture 2 10 AEAF 0.013AEAF 35.10−= − × + + (2)
Figure 4. Variation of moisture with aging at 2 kV/mm, 4 kV/mm and 6 kV/mm.
Figure 5. Correlation between moisture and AEAF.
J. Singh et al.
223
According to Fofana [22], due to aging process, the decomposition of hydro-carbon molecules takes place by thermal and electric stresses. The energy re-quired for the decomposition of weakly bonded hydrocarbons is supplied by the high voltage stress. The absorption of large amount of energy causes excitation of molecules, which in certain cases leads to the hemolytic breakdown of weak chemical bonds generating “gases” (along with low molecular weight hydrocar-bons)”. When this process takes place, the evolved gases leave the broken mole-cules in the liquid phase, which act as free radical, and there is high probability that it will react with other similar free radical which is no longer soluble in the blend of hydrocarbons. Due to the decomposition of long hydrocarbon chains that leave molecules with a broken covalent bond in the oil, it increases the conductivity which further affects the moisture and breakdown. B. BREAKDOWN VOLTAGE (BDV)
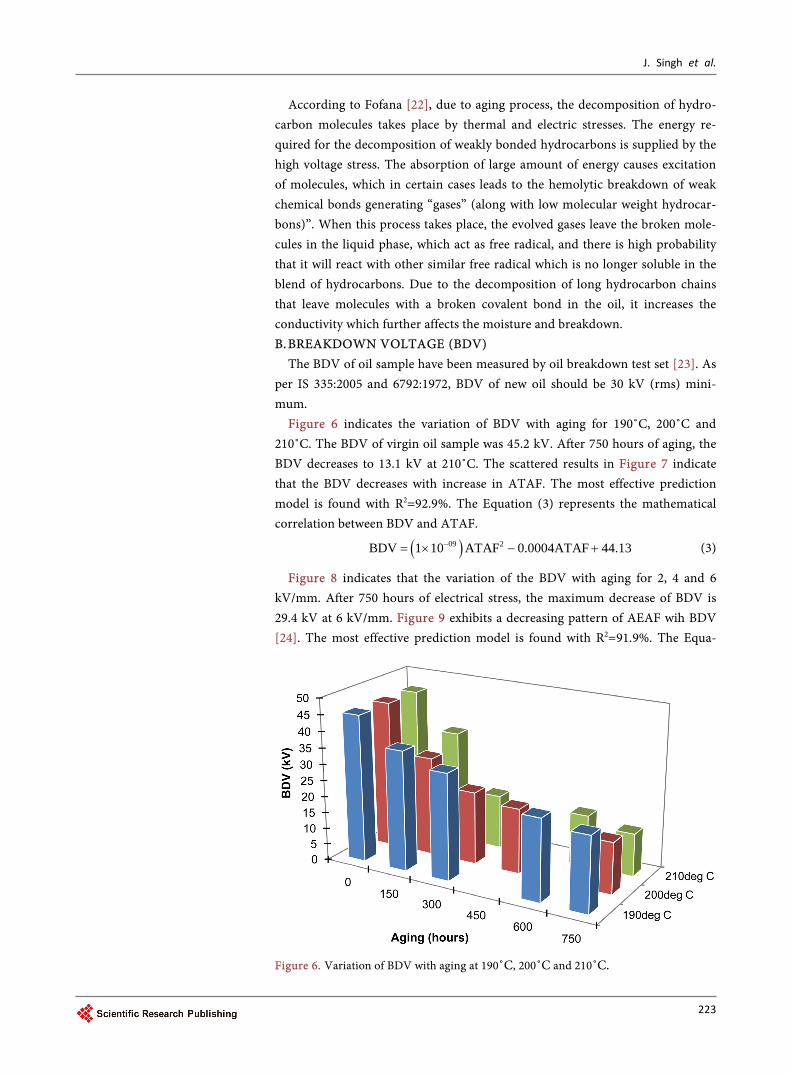
The BDV of oil sample have been measured by oil breakdown test set [23]. As per IS 335:2005 and 6792:1972, BDV of new oil should be 30 kV (rms) mini-mum.
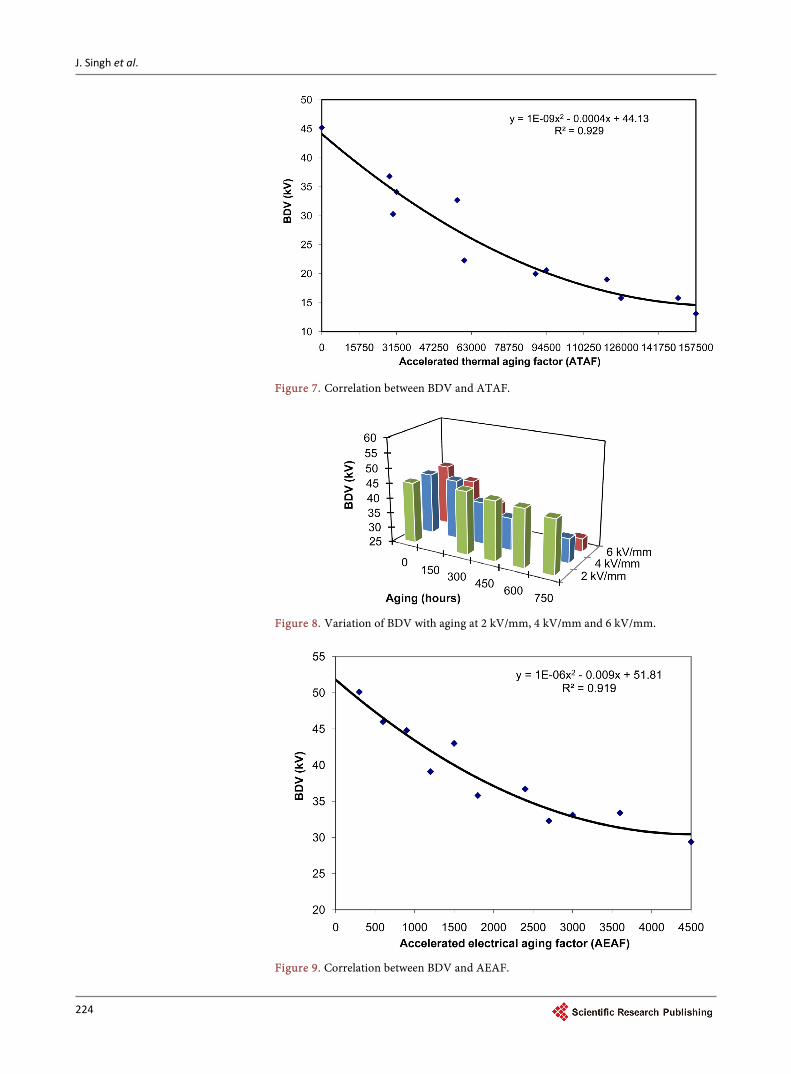
Figure 6 indicates the variation of BDV with aging for 190˚C, 200˚C and 210˚C. The BDV of virgin oil sample was 45.2 kV. After 750 hours of aging, the BDV decreases to 13.1 kV at 210˚C. The scattered results in Figure 7 indicate that the BDV decreases with increase in ATAF. The most effective prediction model is found with R2=92.9%. The Equation (3) represents the mathematical correlation between BDV and ATAF.
( )09 2BDV 1 10 ATAF 0.0004ATAF 44.13−= × − + (3)
Figure 8 indicates that the variation of the BDV with aging for 2, 4 and 6 kV/mm. After 750 hours of electrical stress, the maximum decrease of BDV is 29.4 kV at 6 kV/mm. Figure 9 exhibits a decreasing pattern of AEAF wih BDV [24]. The most effective prediction model is found with R2=91.9%. The Equa-
Figure 6. Variation of BDV with aging at 190˚C, 200˚C and 210˚C.
J. Singh et al.
224
Figure 7. Correlation between BDV and ATAF.
Figure 8. Variation of BDV with aging at 2 kV/mm, 4 kV/mm and 6 kV/mm.
Figure 9. Correlation between BDV and AEAF.
J. Singh et al.
225
tion (4) represents the mathematical correlation between BDV and AEAF.
( )06 2BDV 1 10 AEAF 0.009AEAF 51.81−= × − + (4)
7. Dielectric Dissipation Factor or Tan Delta
The tan δ is very important parameter to measure the quality of the insulation. The variation of tan δ with applied voltage provides useful information about the source of any imperfection in the insulation. It increases with insulation de-terioration and serves as an early indicator of failure hazards. A low value of tan δ is generally desirable. The high value of tan δ gives an early indication of the contamination and presence of moisture content, conductive contamination, soluble varnishes, resins etc. [25].
8. Resistivity
Resistivity is the most sensitive property of oil, it varies with temperature. It is desirable to have resistivity of oil as high as possible. It reduces considerably due to presence of moisture, acidity and solid contaminants [17] [26]. High resistivi-ty reflects low content of free ions and ion-forming particles, and indicates a low concentration of conductive contaminants [27]. Contamination of oil, which would not otherwise be detected by acidity test, will immediately be detected by the changes in the value of resistivity.
9. Results and Discussions
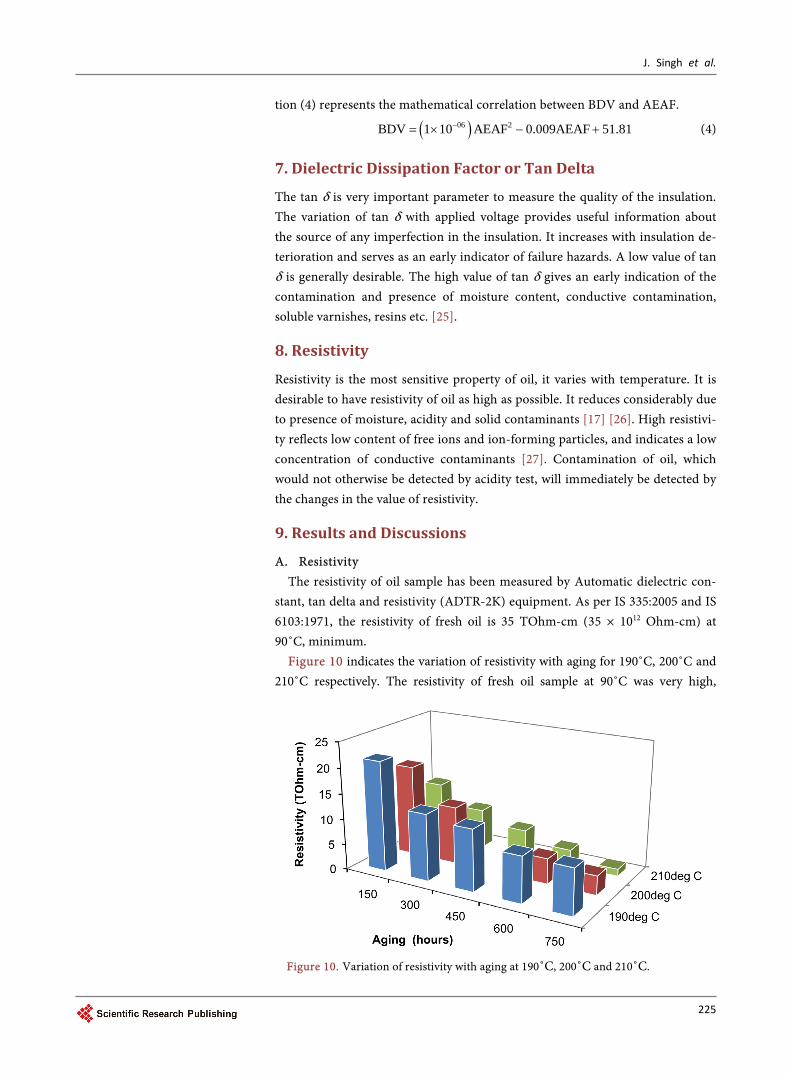
A. Resistivity The resistivity of oil sample has been measured by Automatic dielectric con-
stant, tan delta and resistivity (ADTR-2K) equipment. As per IS 335:2005 and IS 6103:1971, the resistivity of fresh oil is 35 TOhm-cm (35 × 1012 Ohm-cm) at 90˚C, minimum.
Figure 10 indicates the variation of resistivity with aging for 190˚C, 200˚C and 210˚C respectively. The resistivity of fresh oil sample at 90˚C was very high,
Figure 10. Variation of resistivity with aging at 190˚C, 200˚C and 210˚C.
J. Singh et al.
226
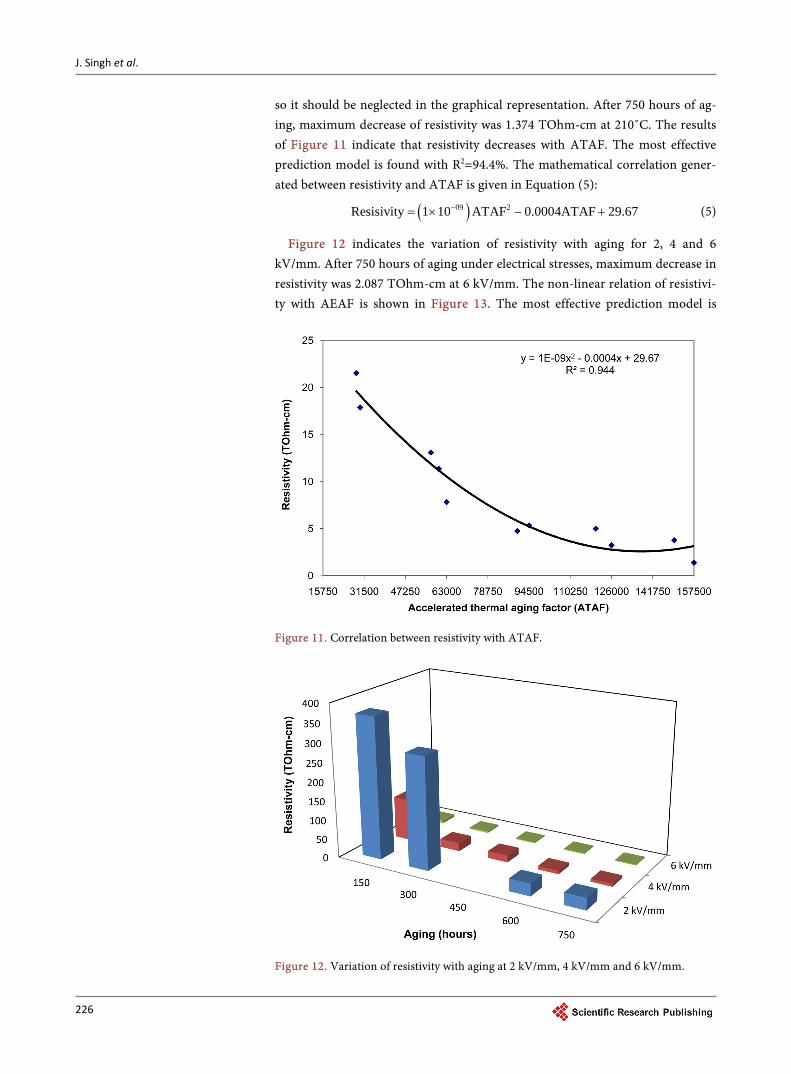
so it should be neglected in the graphical representation. After 750 hours of ag-ing, maximum decrease of resistivity was 1.374 TOhm-cm at 210˚C. The results of Figure 11 indicate that resistivity decreases with ATAF. The most effective prediction model is found with R2=94.4%. The mathematical correlation gener-ated between resistivity and ATAF is given in Equation (5):
( )09 2Resisivity 1 10 ATAF 0.0004ATAF 29.67−= × − + (5)
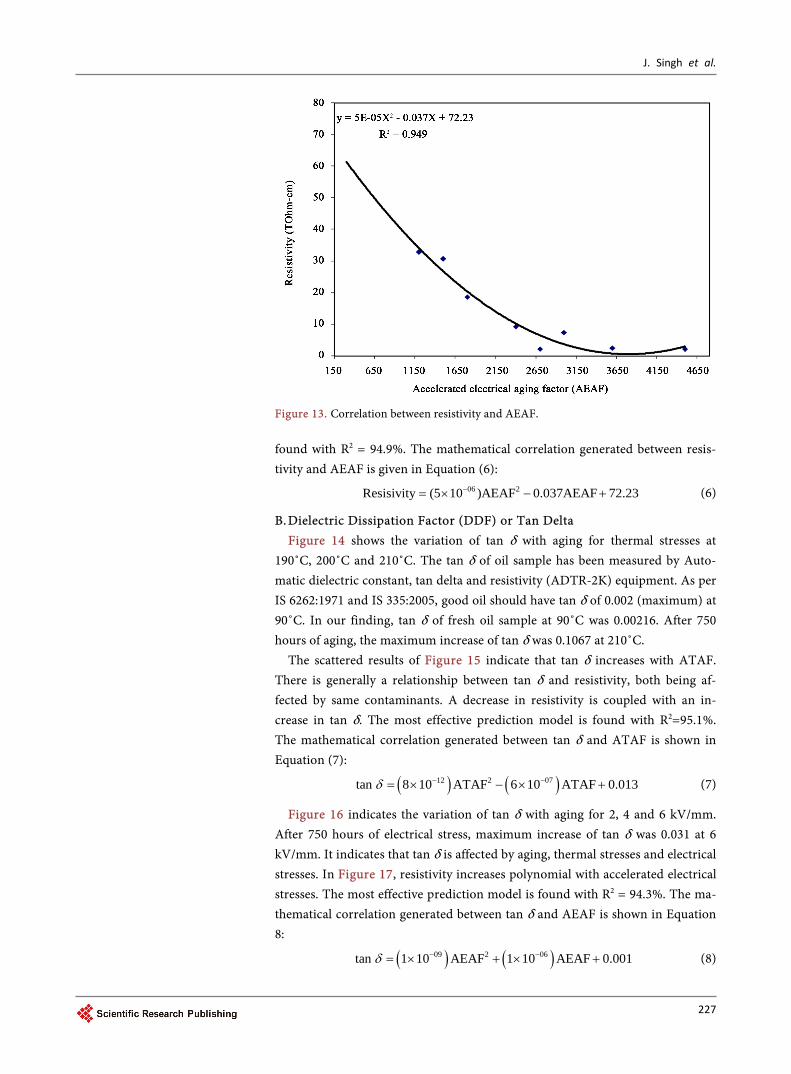
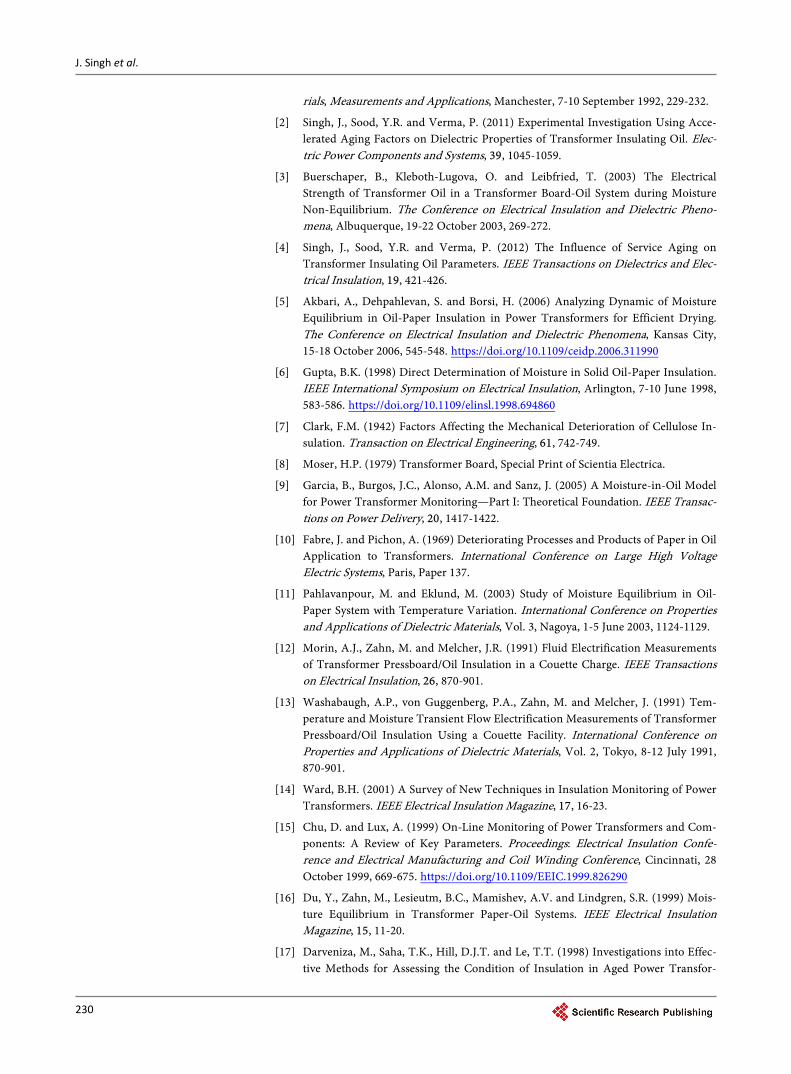
Figure 12 indicates the variation of resistivity with aging for 2, 4 and 6 kV/mm. After 750 hours of aging under electrical stresses, maximum decrease in resistivity was 2.087 TOhm-cm at 6 kV/mm. The non-linear relation of resistivi-ty with AEAF is shown in Figure 13. The most effective prediction model is
Figure 11. Correlation between resistivity with ATAF.
Figure 12. Variation of resistivity with aging at 2 kV/mm, 4 kV/mm and 6 kV/mm.
J. Singh et al.
227
Figure 13. Correlation between resistivity and AEAF. found with R2 = 94.9%. The mathematical correlation generated between resis-tivity and AEAF is given in Equation (6):
06 2Resisivity (5 10 )AEAF 0.037AEAF 72.23−= × − + (6)
B. Dielectric Dissipation Factor (DDF) or Tan Delta Figure 14 shows the variation of tan δ with aging for thermal stresses at
190˚C, 200˚C and 210˚C. The tan δ of oil sample has been measured by Auto-matic dielectric constant, tan delta and resistivity (ADTR-2K) equipment. As per IS 6262:1971 and IS 335:2005, good oil should have tan δ of 0.002 (maximum) at 90˚C. In our finding, tan δ of fresh oil sample at 90˚C was 0.00216. After 750 hours of aging, the maximum increase of tan δ was 0.1067 at 210˚C.
The scattered results of Figure 15 indicate that tan δ increases with ATAF. There is generally a relationship between tan δ and resistivity, both being af-fected by same contaminants. A decrease in resistivity is coupled with an in-crease in tan δ. The most effective prediction model is found with R2=95.1%. The mathematical correlation generated between tan δ and ATAF is shown in Equation (7):
( ) ( )12 2 07tan 8 10 ATAF 6 10 ATAF 0.013δ − −= × − × + (7)
Figure 16 indicates the variation of tan δ with aging for 2, 4 and 6 kV/mm. After 750 hours of electrical stress, maximum increase of tan δ was 0.031 at 6 kV/mm. It indicates that tan δ is affected by aging, thermal stresses and electrical stresses. In Figure 17, resistivity increases polynomial with accelerated electrical stresses. The most effective prediction model is found with R2 = 94.3%. The ma-thematical correlation generated between tan δ and AEAF is shown in Equation 8:
( ) ( )09 2 06tan 1 10 AEAF 1 10 AEAF 0.001δ − −= × + × + (8)

J. Singh et al.
228
Figure 14. Variation of tan δ with aging at 190˚C, 200˚C and 210˚C.
Figure 15. Correlation between tan δ and ATAF.
Figure 16. Variation of tan δ with aging at 2, 4 and 6 kV/mm.

J. Singh et al.
229
Figure 17. Correlation between tan δ and AEAF.
10. Conclusions
The effect of thermal and electrical stresses on the transformer oil has been ex-perimentally investigated in this paper. The term accelerated thermal aging fac-tor (ATAF) and accelerated electrical aging factor (AEAF) have been introduced in order to quantify the thermal and electrical stresses. The graphically repre-sentation between moisture, BDV, tan delta and resistivity with aging, ATAF and AEAF has been presented. It is presented that as the moisture increases with ATAF and AEAF, the BDV decreases in same pattern. Similarly as tan delta in-creases with ATAF and AEAF, resistivity decreases with same pattern. It is due to the fact that these properties are affected by the same contaminants.
This paper contributes that electrical stresses also play an important role in the degradation of the insulation along with thermal stresses but the degradation of insulation by thermal stresses is comparatively more as compared to electrical stresses. Further, all the properties were correlated with ATAF and AEAF and mathematical correlation has been generated.
Acknowledgements
The authors are thankful to Punjab Technical University, Jalandhar & Technol-ogy Information Forecasting and Assessment Council and Centers of Relevance and Excellence (TIFAC-CORE) on Power Transformer Diagnostics and Dr. R. K. Jarial, Associate Professor and Office-in-charge, HV Lab, NIT Hamirpur for providing necessary infrastructural facilities for carrying out the research work.
References [1] Emsley, A.M. and Stevens, G.C. (1992) A Reassessment of the Low Temperature
Thermal Degradation of Cellulose. International Conference on Dielectric Mate-
J. Singh et al.
230
rials, Measurements and Applications, Manchester, 7-10 September 1992, 229-232.
[2] Singh, J., Sood, Y.R. and Verma, P. (2011) Experimental Investigation Using Acce-lerated Aging Factors on Dielectric Properties of Transformer Insulating Oil. Elec-tric Power Components and Systems, 39, 1045-1059.
[3] Buerschaper, B., Kleboth-Lugova, O. and Leibfried, T. (2003) The Electrical Strength of Transformer Oil in a Transformer Board-Oil System during Moisture Non-Equilibrium. The Conference on Electrical Insulation and Dielectric Pheno-mena, Albuquerque, 19-22 October 2003, 269-272.
[4] Singh, J., Sood, Y.R. and Verma, P. (2012) The Influence of Service Aging on Transformer Insulating Oil Parameters. IEEE Transactions on Dielectrics and Elec-trical Insulation, 19, 421-426.
[5] Akbari, A., Dehpahlevan, S. and Borsi, H. (2006) Analyzing Dynamic of Moisture Equilibrium in Oil-Paper Insulation in Power Transformers for Efficient Drying. The Conference on Electrical Insulation and Dielectric Phenomena, Kansas City, 15-18 October 2006, 545-548. https://doi.org/10.1109/ceidp.2006.311990
[6] Gupta, B.K. (1998) Direct Determination of Moisture in Solid Oil-Paper Insulation. IEEE International Symposium on Electrical Insulation, Arlington, 7-10 June 1998, 583-586. https://doi.org/10.1109/elinsl.1998.694860
[7] Clark, F.M. (1942) Factors Affecting the Mechanical Deterioration of Cellulose In-sulation. Transaction on Electrical Engineering, 61, 742-749.
[8] Moser, H.P. (1979) Transformer Board, Special Print of Scientia Electrica.
[9] Garcia, B., Burgos, J.C., Alonso, A.M. and Sanz, J. (2005) A Moisture-in-Oil Model for Power Transformer Monitoring—Part I: Theoretical Foundation. IEEE Transac-tions on Power Delivery, 20, 1417-1422.
[10] Fabre, J. and Pichon, A. (1969) Deteriorating Processes and Products of Paper in Oil Application to Transformers. International Conference on Large High Voltage Electric Systems, Paris, Paper 137.
[11] Pahlavanpour, M. and Eklund, M. (2003) Study of Moisture Equilibrium in Oil- Paper System with Temperature Variation. International Conference on Properties and Applications of Dielectric Materials, Vol. 3, Nagoya, 1-5 June 2003, 1124-1129.
[12] Morin, A.J., Zahn, M. and Melcher, J.R. (1991) Fluid Electrification Measurements of Transformer Pressboard/Oil Insulation in a Couette Charge. IEEE Transactions on Electrical Insulation, 26, 870-901.
[13] Washabaugh, A.P., von Guggenberg, P.A., Zahn, M. and Melcher, J. (1991) Tem-perature and Moisture Transient Flow Electrification Measurements of Transformer Pressboard/Oil Insulation Using a Couette Facility. International Conference on Properties and Applications of Dielectric Materials, Vol. 2, Tokyo, 8-12 July 1991, 870-901.
[14] Ward, B.H. (2001) A Survey of New Techniques in Insulation Monitoring of Power Transformers. IEEE Electrical Insulation Magazine, 17, 16-23.
[15] Chu, D. and Lux, A. (1999) On-Line Monitoring of Power Transformers and Com-ponents: A Review of Key Parameters. Proceedings: Electrical Insulation Confe-rence and Electrical Manufacturing and Coil Winding Conference, Cincinnati, 28 October 1999, 669-675. https://doi.org/10.1109/EEIC.1999.826290
[16] Du, Y., Zahn, M., Lesieutm, B.C., Mamishev, A.V. and Lindgren, S.R. (1999) Mois-ture Equilibrium in Transformer Paper-Oil Systems. IEEE Electrical Insulation Magazine, 15, 11-20.
[17] Darveniza, M., Saha, T.K., Hill, D.J.T. and Le, T.T. (1998) Investigations into Effec-tive Methods for Assessing the Condition of Insulation in Aged Power Transfor-
J. Singh et al.
231
mers. IEEE Transactions on Power Delivery, 13, 1214-1223.
[18] Griffin, P.J. (1996) Water in Transformers—So What! National Grid Cond.
[19] Oommen, T.V. (1983) Moisture Equilibrium in Paper-Oil Insulation Systems. Elec-trical/Electronics Insulation Conference, Chicago, 3-6 October 1983, 162-166.
[20] Pradhan, M.K. and Ramu, T.S. (2004) Criteria for Estimation of End of Life of Power and Station Transformers in Service. Electrical Insulation and Dielectric Phenomena, Boulder, 17-20 October 2004, 220-223. https://doi.org/10.1109/ceidp.2004.1364228
[21] Arakelian, V.G. and Fofana, I. (2007) Water in Oil-Filled High-Voltage Equipment Part I: Water Content as Physicochemical Tools for Insulation Condition Diagnos-tic. IEEE Electrical Insulation Magazine, 23, 15-24.
[22] Fofana, I., N’cho, J.S., Aka-Ngnui, T. and Beroual, A. (2010) Effect of Electrical Discharge on Oil Decaying Process. International Conference on High Voltage En-gineering and Application, New Orleans, 11-14 October 2010, 564-567.
[23] Myers, C. (1998) Transformer-Condition Monitoring by Oil Analysis Large or Small Contentment or Catastrophe. 1st IEE/IMechE International Conference on Power Station Maintenance-Profitability through Reliability, Edinburgh, 30 March- 1 April 1998, 53-58. https://doi.org/10.1049/cp:19980061
[24] Pradhan, M.K. (2006) Assessment of the Status of Insulation during Thermal Stress Accelerated Experiments on Transformer Prototypes. IEEE Transactions on Dielec-trics and Electrical Insulation, 13, 227-237.
[25] American Standard, ASTM D 924:04, “Standard Test Method for Dissipation Factor (or Power Factor) and Relative Permittivity (Dielectric Constant) of Electrical Insu-lating Liquids”.
[26] Verma, P., Roy, M., Verma, A., Bhanot, V. and Pandey, O.P. (2005) Changes in Electrical and Chemical Properties of Transformer Oil under Accelerated Thermal Stress and Its Service Life. Rhinology International Journal, 8, 42-48.
[27] Indian Standard, IS 6103:1971, “Method of Test for Specific Resistance (Resistivity) of Electrical Insulating Liquids”.
Submit or recommend next manuscript to SCIRP and we will provide best service for you:
Accepting pre-submission inquiries through Email, Facebook, LinkedIn, Twitter, etc. A wide selection of journals (inclusive of 9 subjects, more than 200 journals) Providing 24-hour high-quality service User-friendly online submission system Fair and swift peer-review system Efficient typesetting and proofreading procedure Display of the result of downloads and visits, as well as the number of cited articles Maximum dissemination of your research work
Submit your manuscript at: http://papersubmission.scirp.org/ Or contact [email protected]