impact of a large cylindrical roughness on tidal bore...
TRANSCRIPT
ARTICLE
Impact of a large cylindrical roughness on tidal bore propagationS.C. Yeow, H. Chanson, and H. Wang
Abstract: A tidal bore is a hydrodynamic shock, surging upstream in some shallow-water bays and estuaries during the flood tideunder large tidal range. This study investigates experimentally the propagation of tidal bores over a large cylindrical roughnesselement, representative of damaged bridge pier foundation. In the initially steady flow, the large cylindrical element generated a wakeregion, with extents comparable to steady flow literature. During the tidal bore propagation, the presence of the element had negligibleeffect on the free-surface properties, but a significant impact in terms of the instantaneous velocity and Reynolds stresses. This resultedin longer transient recirculation both upstream and downstream of the element and larger maximum velocity recirculation magnitudes,as well as enhanced turbulent stress levels and potential bed erosion around the large element, within two diameters from theelement centre. The results showed the potential development of a large scour hole around the cylindrical element.
Key words: tidal bores, large roughness element, physical modelling, unsteady turbulent mixing.
Résumé : Un mascaret est observé dans un certain nombre d’estuaires, durant la marée montante avec un grand marnage. Onprésente ici une étude expérimentale de propagation de mascaret sur une rugosité importante, en pratique un élémentcylindrique. Dans l’écoulement initialement permanent, la rugosité générait un sillage, de dimensions comparables a cellesreportées dans la littérature. Durant le passage du mascaret, la présence de la rugosité cylindrique modifiait le champs devitesses et des contraintes de Reynolds. Les résultats indiquaient une augmentation des contraintes de cisaillement, et donc desrisques d’érosion, autour de la rugosité, dans un périmètre correspondant a un rayon de deux diamètres de rugosité.
Mots-clés : mascarets, grande rugosité, modèlisation physique, mélange turbulent instationnaire.
IntroductionA tidal bore is a discontinuity of the water depth, and a
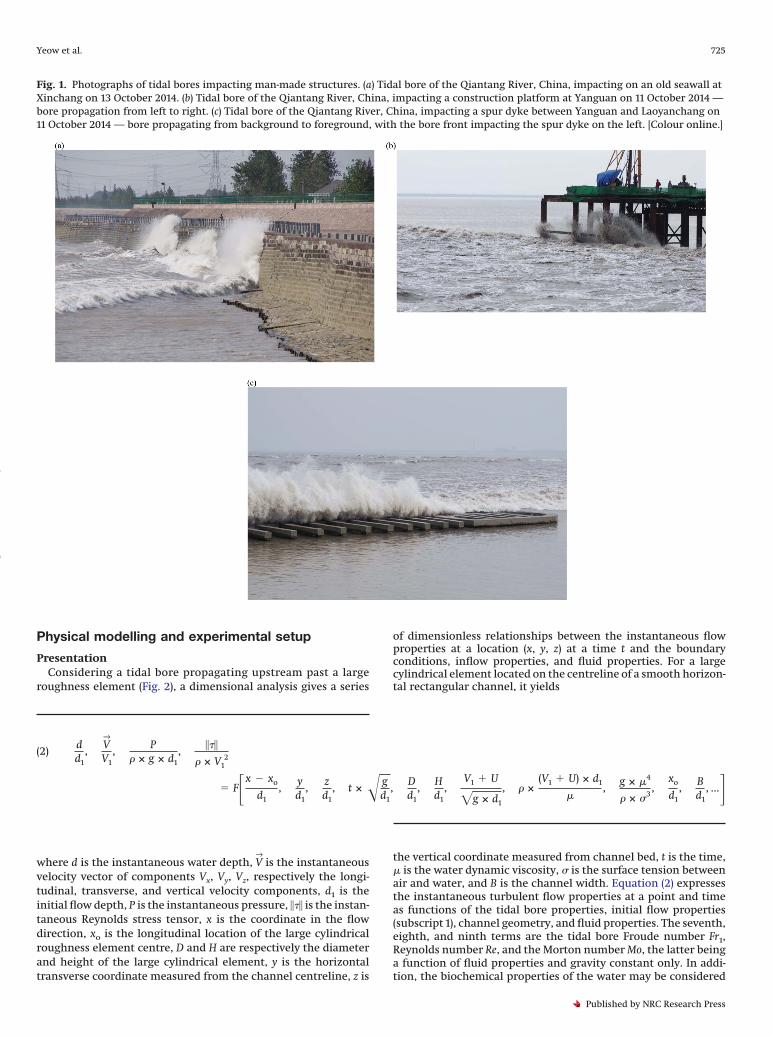
hydrodynamic shock, surging upstream in shallow-water baysand estuaries during the flood tide under spring tidal conditions,when the tidal range exceeds 4–6 m and the flood tide confinedto the narrow funnelled estuary (Tricker 1965; Lighthill 1978;Chanson 2011a). It is estimated worldwide that over 400–450 es-tuaries are affected by a tidal bore. For example, in the Bay ofFundy, several rivers are subject to a tidal bore process, includingthe Petitcodiac, Hebert, Cornwallis, Maccan, and Salmon Rivers.Figure 1 presents photographs of tidal bores propagating up-stream. A tidal bore has a significant impact on the environmentalsystem and the ecology of the river mouth (Rulifson and Tull 1999;Locke et al. 2003; Ezer et al. 2008). Tidal bores can also be danger-ous, impacting adversely on man-made structures (Fig. 1) and en-dangering lives. In recent years, the Hoogly River bore (India)gained in strength because of the completion of upstream dams,and the tidal bore destroyed several bridge structures. The impactof a tidal bore on bridges and bridge piers was rarely documented,although some studies were conducted on the impact of the G15Shenhai Expressway and G15W Changtai Expressway bridges overthe Hangzhou Bay and Qiantang River mouth (China) (Lu et al.2009; Xu and Liang 2010). Another example is the 15th centuryPont Aubaud bridge on the Sélune River (France) (Chanson 2011b).Further research was conducted on the impact of tidal bores ongroyne structures (Xu et al. 2016). A related literature is the impactof tsunami bores on man-made structures, include bridge piers(e.g., Arnason et al. 2009; Mori et al. 2013; St-Germain et al. 2014).
A tidal bore is a positive surge, also called compression wave ortranslating hydraulic jump (Henderson 1966; Liggett 1994). The
shape of the bore front is characterized by its Froude number Fr1,whose expression may be derived based upon momentum consid-erations for an irregular channel cross-section:
(1) Fr1 �V1 � U
�g × (A1/B1)
where V1 is the initial flow velocity positive downstream, U is thebore celerity positive upstream, g is the gravity acceleration, A1 isthe initial flow cross-sectional area, and B1 is the initial free-surface width (Leng and Chanson 2015). For Fr1 < 1.3 to 1.4, the boreis undular: its front is followed by a train of quasi-periodic free-surface undulations (Peregrine 1966; Treske 1994). For largerFroude numbers, the bore has a marked roller (Hornung et al.1995; Docherty and Chanson 2012) as illustrated in Figs. 1b and 1c.
A major challenge with any field investigation is the lack of con-trol and of repeatability of each bore event (e.g., Simpson et al. 2004;Xie and Pan 2013; Keevil et al. 2015). In contrast, laboratory observa-tions allow to conduct carefully-controlled experiments and to inves-tigate systematically all relevant hydrodynamic parameters. It is thepurpose of this study to investigate thoroughly the propagation oftidal bores over a large cylindrical roughness element, representa-tive of a damaged bridge pier foundation. Herein new measurementswere conducted in a relatively large-size facility (L = 15 m, B = 0.5 m)and free-surface elevation and velocity were recorded simultane-ously. The turbulence and turbulent mixing generated by the pas-sage of the tidal bore were carefully documented under controlledflow conditions. The experimental results showed the impact of thelarge element on the steady and unsteady turbulent shear stresses inthe close vicinity of the element.
Received 18 December 2015. Accepted 18 May 2016.
S.C. Yeow, H. Chanson, and H. Wang. The University of Queensland, School of Civil Engineering, Brisbane QLD 4072, Australia.Corresponding author: H. Chanson (email: [email protected]).Copyright remains with the author(s) or their institution(s). Permission for reuse (free in most cases) can be obtained from RightsLink.
724
Can. J. Civ. Eng. 43: 724–734 (2016) dx.doi.org/10.1139/cjce-2015-0557 Published at www.nrcresearchpress.com/cjce on 25 May 2016.
Can
. J. C
iv. E
ng. D
ownl
oade
d fr
om w
ww
.nrc
rese
arch
pres
s.co
m b
y U
nive
rsity
of
Que
ensl
and
on 0
8/05
/16
For
pers
onal
use
onl
y.
Physical modelling and experimental setup
PresentationConsidering a tidal bore propagating upstream past a large
roughness element (Fig. 2), a dimensional analysis gives a series
of dimensionless relationships between the instantaneous flowproperties at a location (x, y, z) at a time t and the boundaryconditions, inflow properties, and fluid properties. For a largecylindrical element located on the centreline of a smooth horizon-tal rectangular channel, it yields
(2)dd1
,V¡
V1,
P� × g × d1
,���
� × V12
� F�x � xo
d1,
yd1
,zd1
, t × � gd1
,Dd1
,Hd1
,V1 � U
�g × d1
, � ×(V1 � U) × d1
�,
g × �4
� × �3,
xo
d1,
Bd1
, ...�
where d is the instantaneous water depth, V¡
is the instantaneousvelocity vector of components Vx, Vy, Vz, respectively the longi-tudinal, transverse, and vertical velocity components, d1 is theinitial flow depth, P is the instantaneous pressure, ��� is the instan-taneous Reynolds stress tensor, x is the coordinate in the flowdirection, xo is the longitudinal location of the large cylindricalroughness element centre, D and H are respectively the diameterand height of the large cylindrical element, y is the horizontaltransverse coordinate measured from the channel centreline, z is
the vertical coordinate measured from channel bed, t is the time,� is the water dynamic viscosity, � is the surface tension betweenair and water, and B is the channel width. Equation (2) expressesthe instantaneous turbulent flow properties at a point and timeas functions of the tidal bore properties, initial flow properties(subscript 1), channel geometry, and fluid properties. The seventh,eighth, and ninth terms are the tidal bore Froude number Fr1,Reynolds number Re, and the Morton number Mo, the latter beinga function of fluid properties and gravity constant only. In addi-tion, the biochemical properties of the water may be considered
Fig. 1. Photographs of tidal bores impacting man-made structures. (a) Tidal bore of the Qiantang River, China, impacting on an old seawall atXinchang on 13 October 2014. (b) Tidal bore of the Qiantang River, China, impacting a construction platform at Yanguan on 11 October 2014 —bore propagation from left to right. (c) Tidal bore of the Qiantang River, China, impacting a spur dyke between Yanguan and Laoyanchang on11 October 2014 — bore propagating from background to foreground, with the bore front impacting the spur dyke on the left. [Colour online.]
Yeow et al. 725
Published by NRC Research Press
Can
. J. C
iv. E
ng. D
ownl
oade
d fr
om w
ww
.nrc
rese
arch
pres
s.co
m b
y U
nive
rsity
of
Que
ensl
and
on 0
8/05
/16
For
pers
onal
use
onl
y.
particularly in natural estuarine systems, as well as the sedimentcharacteristics.
In tidal bores, a Froude similitude is derived theoretically(Henderson 1966; Lighthill 1978; Leng and Chanson 2015). That is,the model and prototype Froude numbers must be equal. In thepresent study, the same fluids (air and water) were used in modeland prototype, and this added a dimensional constraint; i.e., theMorton number was an invariant. Both Froude and Morton simil-itudes were adopted herein following Hornung et al. (1995) andDocherty and Chanson (2012), although the Reynolds number wasunderestimated. The present study focused on experiments per-formed under controlled flow conditions in a relatively large sizefacility selected to minimize potential viscous scaling effects; e.g.,using relatively large initial depths and velocities, and Reynoldsnumbers (Table 1).
Experimental channel and instrumentationNew experiments were conducted in a 15 m long by 0.5 m wide
horizontal channel. The flume was made of smooth PVC bed andglass walls. The initially steady flow was supplied by an upstreamwater tank, 2.0 m long and 1.25 m wide, equipped with baffles andtwo rows of flow straighteners, leading the water to the channelthrough a smooth three-dimensional convergent. The initial flowdepth could be controlled by a radial gate located next to thedownstream end of the channel: x = 14.75 m, where x is the longi-tudinal distance from the glass-walled flume’s upstream end. Thetidal bore was generated by the rapid closure of a Tainter gatelocated at x = 14.10 m just upstream of the radial gate (Fig. 2). TheTainter gate closure time was less than 0.15 s to 0.2 s and the gateclosure time had no impact on the upstream bore propagation.
The water discharge was measured with a Venturi meter withan accuracy of 2%. In steady flows, the water depth was measuredusing pointer gauges with an error of ±0.5 mm. The unsteady flowdepth was measured with a series of acoustic displacement metersMicrosonicTM Mic + 25/IU/TC located at several longitudinal dis-tances above the channel centreline: x = 6.1 m, 7.1 m, 8.1 m, 9.1 m,13.85 m, 14.15 m with an accuracy of 0.18 mm (Microsonic 2004).
The last sensor (x = 14.15 m) was located immediately downstreamof the Tainter gate as sketched in Fig. 2. The instantaneous veloc-ity measurements were performed using an acoustic Dopplervelocimeter (ADV) NortekTM Vectrino + (Serial No. VNO 0802)equipped with a three-dimensional side-looking head. The ADVhead is seen in Fig. 3. The error on the velocity data was 1% of thevelocity range (±1 m/s herein): that is ± 0.01 m/s (Nortek 2009). Theacoustic displacement meters and ADV were synchronized within1 ms, and sampled simultaneously at 200 Hz. The vertical transla-tion of ADV system was controlled by a fine adjustment traverseconnected to a MitutoyoTM digimatic unit. The error on the verti-cal position was less than 0.025 mm. The horizontal (longitudinaland transverse) positions of the ADV were recorded within 0.5 mm.
Channel bed configuration and initial flow conditionsTwo channel bed configurations were tested. Configuration A
was the original smooth PVC bed. In Configuration B, a large rough-ness element was fixed to the PVC bed, with its centre on the channelcentreline (y = 0) at xo = 7.1 m (Figs. 2 and 3). The cylindrical elementwas manufactured out of PVC, with an accuracy of ±0.1 mm. Itsdiameter was D = 0.060 m and its height H = 0.020 m.
The presence of the large cylindrical roughness element on thechannel bed had an influence on the initially steady flow field. Itseffect was investigated in terms of the vertical distributions oftime-averaged longitudinal velocity and standard deviations ofthe three velocity components to establish the region of influenceof the roughness element. The measurements were performedupstream of, directly at or above the element and downstream ofthe roughness element. Overall the results showed that the largeroughness element had little impact on the flow upstream of andat the element, except in its immediate vicinity. Downstream ofthe element, a wake region was observed. Within the experimen-tal flow conditions (Table 1), the wake region extended up to adistance (x − xo)/D < 20, with a vertical extent z/H < 4 where H is theheight of the element, and a transverse extent −4 < y/D < 4. Typicalresults are illustrated in Fig. 4, where x − xo is the longitudinaldistance from the large element centre. In Fig. 4, the downstream
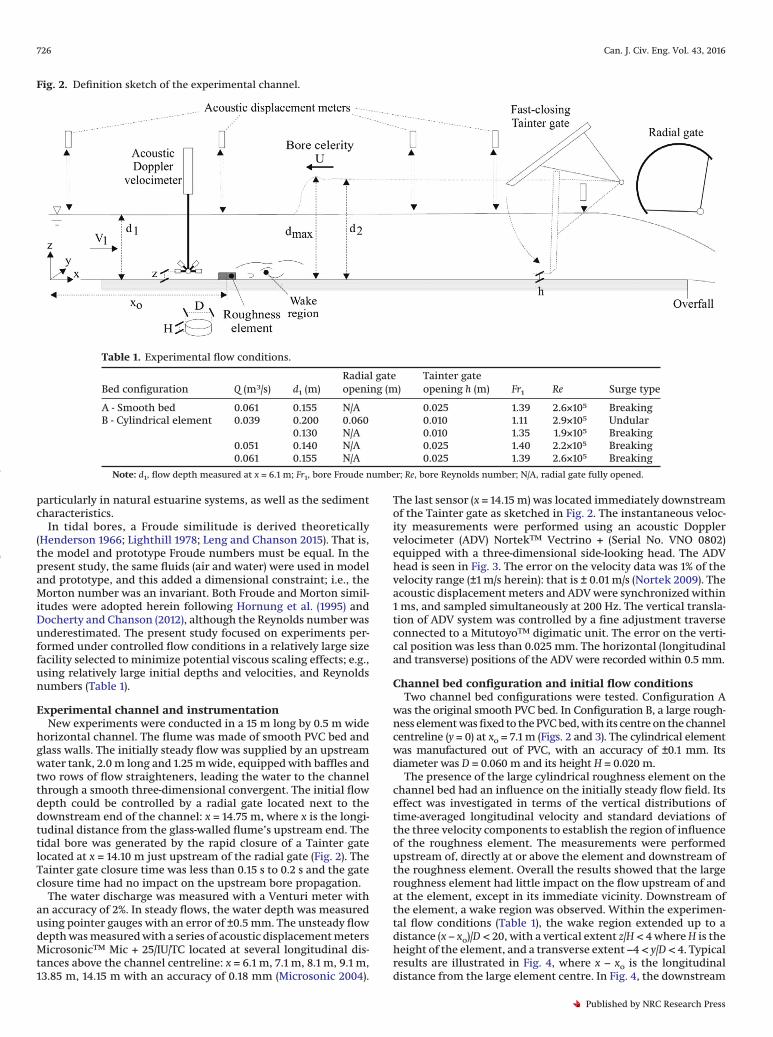
Fig. 2. Definition sketch of the experimental channel.
Table 1. Experimental flow conditions.
Bed configuration Q (m3/s) d1 (m)Radial gateopening (m)
Tainter gateopening h (m) Fr1 Re Surge type
A - Smooth bed 0.061 0.155 N/A 0.025 1.39 2.6×10⁵ BreakingB - Cylindrical element 0.039 0.200 0.060 0.010 1.11 2.9×10⁵ Undular
0.130 N/A 0.010 1.35 1.9×10⁵ Breaking0.051 0.140 N/A 0.025 1.40 2.2×10⁵ Breaking0.061 0.155 N/A 0.025 1.39 2.6×10⁵ Breaking
Note: d1, flow depth measured at x = 6.1 m; Fr1, bore Froude number; Re, bore Reynolds number; N/A, radial gate fully opened.
726 Can. J. Civ. Eng. Vol. 43, 2016
Published by NRC Research Press
Can
. J. C
iv. E
ng. D
ownl
oade
d fr
om w
ww
.nrc
rese
arch
pres
s.co
m b
y U
nive
rsity
of
Que
ensl
and
on 0
8/05
/16
For
pers
onal
use
onl
y.

Fig. 3. Photographic sequence of tidal bore propagation (from right to left) with 0.12 s between successive photographs (from left to right, topto bottom) — flow conditions: Q = 0.061 m3/s, d1 = 0.155 m at x = 5.9 m, Fr1 = 1.39, Tainter gate opening after closure: h = 25 mm, shutter speed:1/400 s. [Colour online.]
Fig. 4. Dimensionless vertical distributions of time-averaged longitudinal velocity Vx and standard deviation of longitudinal velocity vx′
downstream of the cylindrical element in steady flow — flow conditions: Q = 0.038 m3/s, d1 = 0.130 m at x = 5.9 m, flow direction from left toright. Note the large cylindrical element drawn with a thick solid line on bottom left. [Colour online.]
Yeow et al. 727
Published by NRC Research Press
Can
. J. C
iv. E
ng. D
ownl
oade
d fr
om w
ww
.nrc
rese
arch
pres
s.co
m b
y U
nive
rsity
of
Que
ensl
and
on 0
8/05
/16
For
pers
onal
use
onl
y.
half of the large element is shown with a thick solid black line.Altogether the extents of the wake region was comparable withliterature results for a short cylindrical element (Raupach 1992;Sutton and McKenna-Neuman 2008).
Experimental flow conditionsThis study focused on fully-developed positive surges for which
the mean properties became independent of time and space, thusindependent of the generation process. Detailed velocity mea-surements were performed at several longitudinal locationsx upstream of, above and downstream of the cylindrical element onthe channel centreline, as well as at several transverse locations y.The initially steady flow data indicated that the flow was partiallydeveloped at x = 6.1 m upstream of the element and the dimen-sionless boundary layer thickness /d1 ranged between 0.5 and 0.6depending upon the initial flow conditions.
Three water discharges were tested: Q = 0.039 m3/s, 0.051 m3/s,and 0.061 m3/s (Table 1). For each experiment, the tidal bore wasgenerated by the rapid closure of the Tainter gate and the borepropagated upstream as sketched in Fig. 2 and illustrated in Fig. 3.The radial gate was fully opened for the breaking bore experi-ments; it was partially closed to raise the initial water depth d1during the undular bore experiment.
Several experimental series were performed. Series 1 includedsteady flow velocity measurements upstream and downstream ofthe large roughness element, to document the effects of the ele-ment on the initially steady flow and the extent the wake regiondownstream of the cylindrical element. At each location, the ve-locity was sampled at 200 Hz for 180 s. Series 2 focused on free-surface measurements during the propagation of positive surge.
Series 3 included a series of instantaneous velocity and free-surface elevation measurements during the propagation of tidalbore. Both instantaneous and ensemble-averaged experimentswere performed. For each run, the instruments were started 60 sprior to gate closure. The sampling stopped when the bore frontreached the upstream convergent structure. For each set ofensemble-averaged experiments, a total of 25 runs were repeatedduring experiments Series 2 and 3. The median free-surface eleva-tions and velocity components were calculated from the totalensemble, as well as the fluctuating properties. Table 1 summa-rizes the experimental flow conditions.
Flow patternsFree-surface measurements under unsteady flow conditions
were conducted for three breaking and one undular bore flowconditions (Table 1). The rapid gate closure generated a bore prop-agating upstream against the initially steady flow. Figure 3 showsa typical sequence of photographs taken during the propagationof a breaking bore. In Fig. 3, the scale is provided by the cylindricalelement size (D = 0.06 m). The bore passage was characterized by arapid rise in free-surface elevation. For Fr1 < 1.3, the bore free-surface was smooth and the first wave crest was followed by atrain of secondary undulations. For larger Froude numbers, amarked roller was observed associated with large-scale turbu-lence and air bubble entrainment (Fig. 3).
The free-surface properties were analyzed based upon the ensemble-averaged free-surface data. Typical results are presented in Figs. 5and 6, in terms of the ratio of conjugate depths and maximum
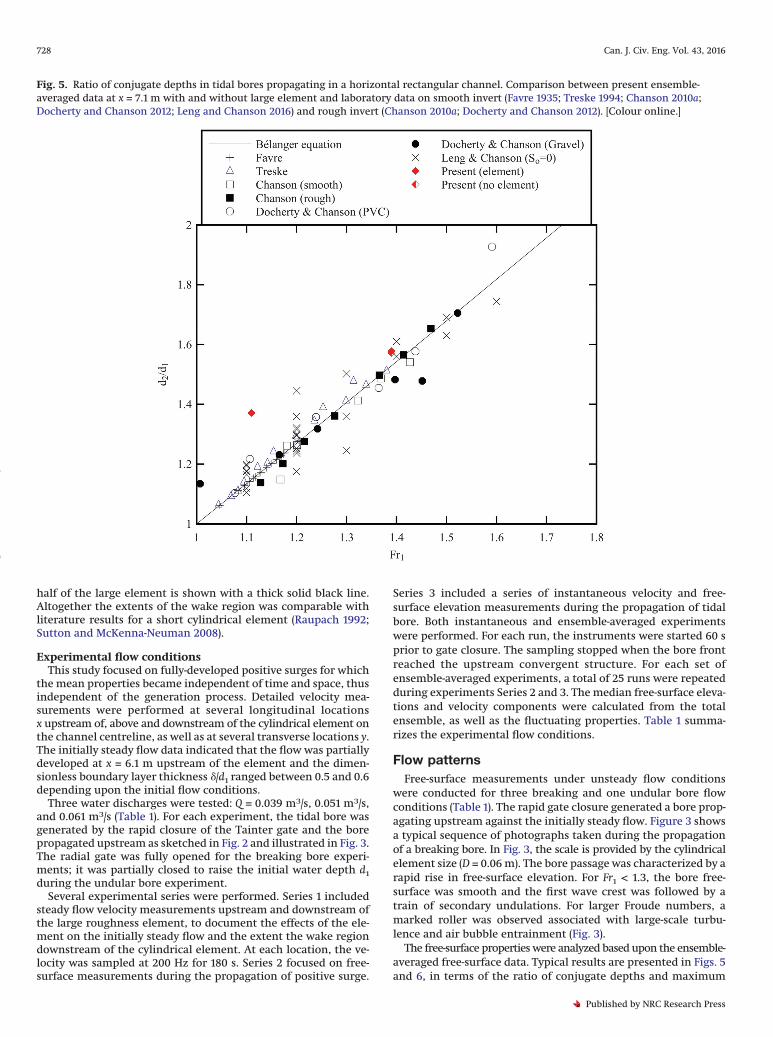
Fig. 5. Ratio of conjugate depths in tidal bores propagating in a horizontal rectangular channel. Comparison between present ensemble-averaged data at x = 7.1 m with and without large element and laboratory data on smooth invert (Favre 1935; Treske 1994; Chanson 2010a;Docherty and Chanson 2012; Leng and Chanson 2016) and rough invert (Chanson 2010a; Docherty and Chanson 2012). [Colour online.]
728 Can. J. Civ. Eng. Vol. 43, 2016
Published by NRC Research Press
Can
. J. C
iv. E
ng. D
ownl
oade
d fr
om w
ww
.nrc
rese
arch
pres
s.co
m b
y U
nive
rsity
of
Que
ensl
and
on 0
8/05
/16
For
pers
onal
use
onl
y.
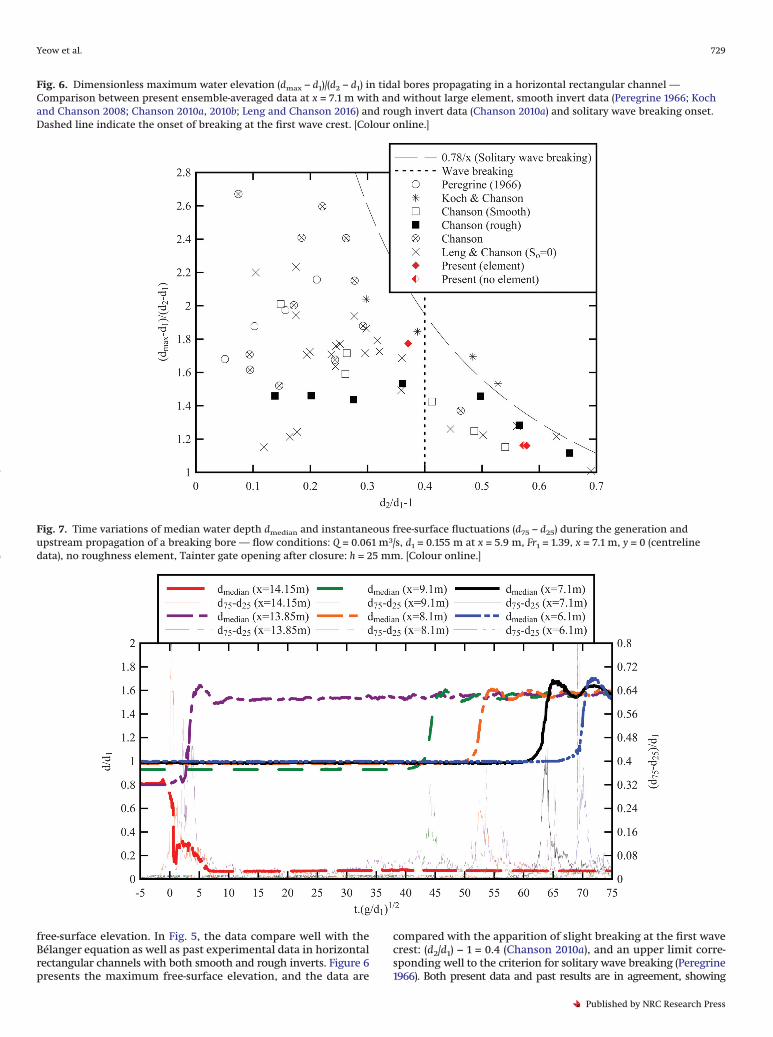
free-surface elevation. In Fig. 5, the data compare well with theBélanger equation as well as past experimental data in horizontalrectangular channels with both smooth and rough inverts. Figure 6presents the maximum free-surface elevation, and the data are
compared with the apparition of slight breaking at the first wavecrest: (d2/d1) − 1 = 0.4 (Chanson 2010a), and an upper limit corre-sponding well to the criterion for solitary wave breaking (Peregrine1966). Both present data and past results are in agreement, showing
Fig. 6. Dimensionless maximum water elevation (dmax – d1)/(d2 – d1) in tidal bores propagating in a horizontal rectangular channel —Comparison between present ensemble-averaged data at x = 7.1 m with and without large element, smooth invert data (Peregrine 1966; Kochand Chanson 2008; Chanson 2010a, 2010b; Leng and Chanson 2016) and rough invert data (Chanson 2010a) and solitary wave breaking onset.Dashed line indicate the onset of breaking at the first wave crest. [Colour online.]
Fig. 7. Time variations of median water depth dmedian and instantaneous free-surface fluctuations (d75 – d25) during the generation andupstream propagation of a breaking bore — flow conditions: Q = 0.061 m3/s, d1 = 0.155 m at x = 5.9 m, Fr1 = 1.39, x = 7.1 m, y = 0 (centrelinedata), no roughness element, Tainter gate opening after closure: h = 25 mm. [Colour online.]
Yeow et al. 729
Published by NRC Research Press
Can
. J. C
iv. E
ng. D
ownl
oade
d fr
om w
ww
.nrc
rese
arch
pres
s.co
m b
y U
nive
rsity
of
Que
ensl
and
on 0
8/05
/16
For
pers
onal
use
onl
y.

Fig. 8. Ensemble-averaged longitudinal velocity as a function of time: comparison between bed configuration A (no element) and bedconfiguration (with element) — flow conditions: Q = 0.061 m3/s, d1 = 0.155 m at x = 5.9 m, Fr1 = 1.39, z/d1 = 0.04, y = 0 (centreline), Tainter gateopening after closure: h = 25 mm; blue arrow marks transient recirculation. (a) Bed configuration A (no element). (b) Bed configuration B:(x – xo)/D = −2 (i.e., upstream of large element). (c) Bed configuration B: (x – xo)/D = +2 (i.e., downstream of large element). [Colour online.]
730 Can. J. Civ. Eng. Vol. 43, 2016
Published by NRC Research Press
Can
. J. C
iv. E
ng. D
ownl
oade
d fr
om w
ww
.nrc
rese
arch
pres
s.co
m b
y U
nive
rsity
of
Que
ensl
and
on 0
8/05
/16
For
pers
onal
use
onl
y.
an upper limit corresponding well to the criterion for solitary wavebreaking (Peregrine 1966).
The propagation of tidal bores was associated with large instan-taneous free-surface fluctuations during the bore passage. This isillustrated in Fig. 7, showing the time variations of the ensemble-averaged water depth and difference between third and first quar-tiles (d75 – d25) during the generation and upstream propagation ofa breaking bore. In Fig. 7, the time t is measured from the Taintergate closure, the median depth data are shown with thick linesand the free-surface fluctuations are plotted in thin lines. For aGaussian distribution of the data about the ensemble-averaged,the difference between third and first quartiles (d75 – d25) would beequal to 1.3 times the standard deviation. The experimental re-sults indicated further maximum free-surface fluctuations shortlyafter the bore leading edge, as reported by Leng and Chanson(2016).
Both visual observations and instantaneous and ensemble-averaged acoustic displacement meter data showed the negligibleimpact of the large roughness element on the free-surface char-acteristics. For example, the breaking bore data reported in Figs. 5and 6 show no distinctive difference between the two bed config-urations.
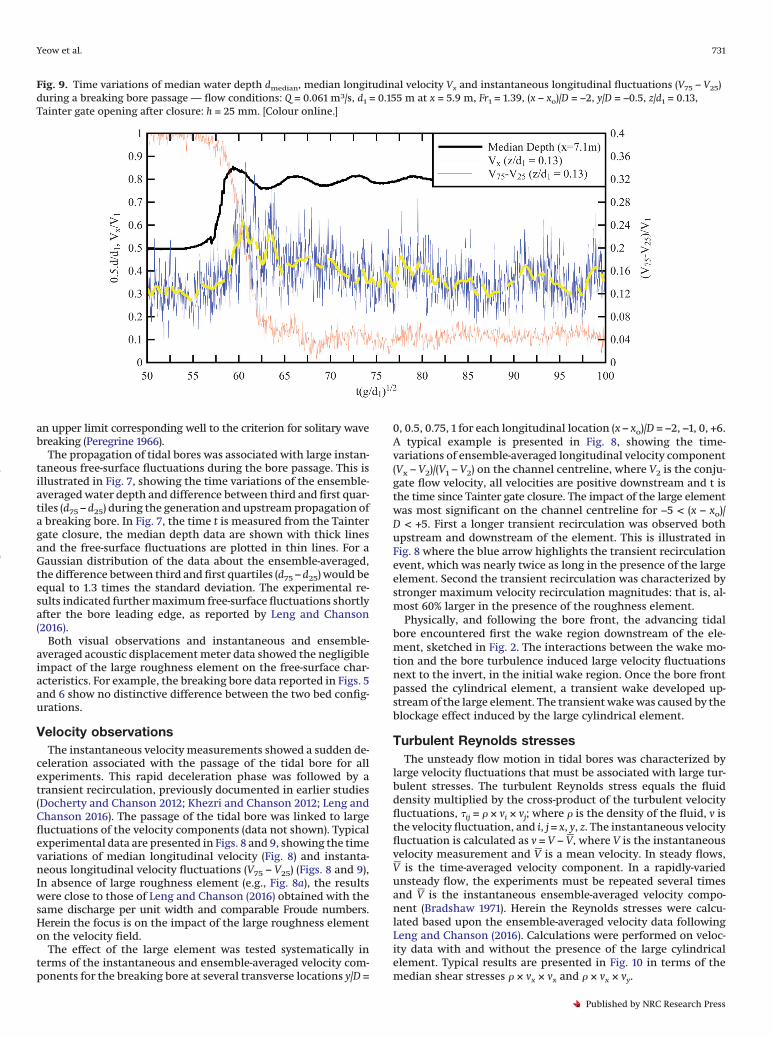
Velocity observationsThe instantaneous velocity measurements showed a sudden de-
celeration associated with the passage of the tidal bore for allexperiments. This rapid deceleration phase was followed by atransient recirculation, previously documented in earlier studies(Docherty and Chanson 2012; Khezri and Chanson 2012; Leng andChanson 2016). The passage of the tidal bore was linked to largefluctuations of the velocity components (data not shown). Typicalexperimental data are presented in Figs. 8 and 9, showing the timevariations of median longitudinal velocity (Fig. 8) and instanta-neous longitudinal velocity fluctuations (V75 – V25) (Figs. 8 and 9),In absence of large roughness element (e.g., Fig. 8a), the resultswere close to those of Leng and Chanson (2016) obtained with thesame discharge per unit width and comparable Froude numbers.Herein the focus is on the impact of the large roughness elementon the velocity field.
The effect of the large element was tested systematically interms of the instantaneous and ensemble-averaged velocity com-ponents for the breaking bore at several transverse locations y/D =
0, 0.5, 0.75, 1 for each longitudinal location (x – xo)/D = −2, −1, 0, +6.A typical example is presented in Fig. 8, showing the time-variations of ensemble-averaged longitudinal velocity component(Vx – V2)/(V1 – V2) on the channel centreline, where V2 is the conju-gate flow velocity, all velocities are positive downstream and t isthe time since Tainter gate closure. The impact of the large elementwas most significant on the channel centreline for −5 < (x – xo)/D < +5. First a longer transient recirculation was observed bothupstream and downstream of the element. This is illustrated inFig. 8 where the blue arrow highlights the transient recirculationevent, which was nearly twice as long in the presence of the largeelement. Second the transient recirculation was characterized bystronger maximum velocity recirculation magnitudes: that is, al-most 60% larger in the presence of the roughness element.
Physically, and following the bore front, the advancing tidalbore encountered first the wake region downstream of the ele-ment, sketched in Fig. 2. The interactions between the wake mo-tion and the bore turbulence induced large velocity fluctuationsnext to the invert, in the initial wake region. Once the bore frontpassed the cylindrical element, a transient wake developed up-stream of the large element. The transient wake was caused by theblockage effect induced by the large cylindrical element.
Turbulent Reynolds stressesThe unsteady flow motion in tidal bores was characterized by
large velocity fluctuations that must be associated with large tur-bulent stresses. The turbulent Reynolds stress equals the fluiddensity multiplied by the cross-product of the turbulent velocityfluctuations, �ij = � × vi × vj; where � is the density of the fluid, v isthe velocity fluctuation, and i, j = x, y, z. The instantaneous velocityfluctuation is calculated as v = V − V, where V is the instantaneousvelocity measurement and V is a mean velocity. In steady flows,V is the time-averaged velocity component. In a rapidly-variedunsteady flow, the experiments must be repeated several timesand V is the instantaneous ensemble-averaged velocity compo-nent (Bradshaw 1971). Herein the Reynolds stresses were calcu-lated based upon the ensemble-averaged velocity data followingLeng and Chanson (2016). Calculations were performed on veloc-ity data with and without the presence of the large cylindricalelement. Typical results are presented in Fig. 10 in terms of themedian shear stresses � × vx × vx and � × vx × vy.
Fig. 9. Time variations of median water depth dmedian, median longitudinal velocity Vx and instantaneous longitudinal fluctuations (V75 – V25)during a breaking bore passage — flow conditions: Q = 0.061 m3/s, d1 = 0.155 m at x = 5.9 m, Fr1 = 1.39, (x – xo)/D = −2, y/D = −0.5, z/d1 = 0.13,Tainter gate opening after closure: h = 25 mm. [Colour online.]
Yeow et al. 731
Published by NRC Research Press
Can
. J. C
iv. E
ng. D
ownl
oade
d fr
om w
ww
.nrc
rese
arch
pres
s.co
m b
y U
nive
rsity
of
Que
ensl
and
on 0
8/05
/16
For
pers
onal
use
onl
y.

Fig. 10. Time variations of ensemble-averaged Reynolds stresses vxvx and vxvy: comparison between bed configuration A (no element) andbed configuration B at (x – xo)/D = −2 (upstream of large element) - Flow conditions: Q = 0.061 m3/s, d1 = 0.155 m at x = 5.9 m, Fr1 = 1.39, y = 0(centreline), Tainter gate opening after closure: h = 25 mm. (a) Bed configuration A (no element), z/d1 = 0.04. (b) Bed configuration B at(x – xo)/D = −2, z/d1 = 0.04. (c) Bed configuration B at (x – xo)/D = −2, z/d1 = 0.13. [Colour online.]
732 Can. J. Civ. Eng. Vol. 43, 2016
Published by NRC Research Press
Can
. J. C
iv. E
ng. D
ownl
oade
d fr
om w
ww
.nrc
rese
arch
pres
s.co
m b
y U
nive
rsity
of
Que
ensl
and
on 0
8/05
/16
For
pers
onal
use
onl
y.

The experimental data showed that the propagation of the borewas associated with a marked increase in Reynolds stress magni-tude during and immediately after the front passage, togetherwith large and rapid fluctuations in turbulent stresses (Fig. 10).The maximum Reynolds stresses were typically observed after thebore arrival. The corresponding time lag was comparable withand without the roughness element, and close to the findings ofLeng and Chanson (2016). Overall the patterns were observed forall Reynolds stress tensor components.
The presence of the cylindrical element was felt primarily up-stream of the element and around the element. Lesser effect wasobserved downstream of the element. Upstream of the largeroughness element, the bore front passage was followed by anincrease in the mean normal and tangential stresses immediatelyupstream of the element at (x – xo)/D = −1. Further upstream, onlya slight increase in shear stresses was observed up to (x – xo)/D < −2.Beside the element, that is (x – xo) = 0, its presence impacted ontothe shear stress data close to the bed at y/D = 0.75 and 1, with largerturbulent stress magnitudes. Beyond these locations, the effect ofthe cylindrical element was negligible.
The present results showed that a large roughness element mayimpact onto both steady and unsteady flow motions. During borepropagation, large shear stress levels were observed around theelement that might lead to enhanced scour and bed erosion, typ-ically within two diameters from the element centre. The repeti-tion of tidal bore events (e.g., twice a day during semi-diurnalspring tides) could yield the development of a large scour holesurrounding the cylindrical element, as observed during the con-struction of the G15W Changtai Expressway bridge across theQiantang River, China (Ren and Luo 2010; D.Z. Pan. 2013, personalcommunication).
ConclusionIn tidal bore affected estuaries and shallow-water bays, the up-
stream propagation of the bore induces significant mixing andhigh turbulence levels. The literature has been focused mostly onthe propagation of tidal bores in flat bed channels, and the effectsof large roughness elements were un-accounted for. Herein aphysical study was performed to assess the impact of a large cy-lindrical roughness element on the upstream propagation of tidalbores, including the steady and unsteady turbulent shear stressesin the close vicinity of the element.
In the initially steady flow, the large and flat cylindrical element(D/H = 3) generated a wake region, extending up to 20 diametersdownstream and +/− 4 diameters in the transverse direction. Theextents of the wake region were consistent with relevant steadyflow literature. During the tidal bore propagation, the presence ofthe element had negligible effect on the free-surface properties.Its impact was felt in terms of the instantaneous velocity, with alonger transient recirculation both upstream and downstreamof the element and larger maximum velocity recirculation mag-nitudes for −5 < (x – xo)/D < +5. Larger velocity fluctuations werefurther recorded and the results were associated with larger tur-bulent shear stresses around the roughness element. The resultssuggested some enhanced turbulent stress levels, hence potentialbed erosion, around the large element within two diameters fromthe element centre. The finding indicated the potential develop-ment of a large scour hole around the element in mobile bedchannels, associated with the propagation of tidal bores.
Further investigations should be conducted using mobile bedmaterials, and could encompass both cylindrical element and cy-lindrical column. The latter would be representative of a bridgepier and an important application could be the prediction of scourhole development around a pier, for example in a tidal bore af-fected estuary.
AcknowledgementsThe authors thank Ms. Xinqian (Sophia) Leng, The University of
Queensland, for her input and advice. They acknowledge the help-ful review comments. They further acknowledge the technicalsupport of Jason Van Der Gevel and Stewart Matthews, The Uni-versity of Queensland. The financial support through the Austra-lian Research Council (Grant DP120100481) is acknowledged.
ReferencesArnason, H., Petroff, C., and Yeh, H. 2009. Tsunami Bore Impingement onto a
Vertical Column. Journal of Disaster Research, 4(6): 392–403. doi:10.20965/jdr.2009.p0391.
Bradshaw, P. 1971. An Introduction to Turbulence and its Measurement. Perga-mon Press, Oxford, UK, The Commonwealth and International Library ofScience and technology Engineering and Liberal Studies, Thermodynamicsand Fluid Mechanics Division, 218 pages.
Chanson, H. 2010a. Unsteady Turbulence in Tidal Bores: Effects of Bed Rough-ness. Journal of Waterway, Port, Coastal, and Ocean Engineering, 136(5):247–256. doi:10.1061/(ASCE)WW.1943-5460.0000048.
Chanson, H. 2010b. Undular Tidal Bores: Basic Theory and Free-surface Charac-teristics. Journal of Hydraulic Engineering, 136(11): 940–944. doi:10.1061/(ASCE)HY.1943-7900.0000264.
Chanson, H. 2011a. Tidal Bores, Aegir, Eagre, Mascaret, Pororoca: Theory andObservations. World Scientific, Singapore, 220 pages.
Chanson, H. 2011b. Undular Tidal Bores: Effect of Channel Constriction andBridge Piers. Environmental Fluid Mechanics, 11(4): 385–404, 4 videos. doi:10.1007/s10652-010-9189-5.
Docherty, N.J., and Chanson, H. 2012. Physical Modelling of Unsteady Turbu-lence in Breaking Tidal Bores. Journal of Hydraulic Engineering, 138(5): 412–419. doi:10.1061/(ASCE)HY.1943-7900.0000542.
Ezer, T., Hobbs, R., and Oey, L.Y. 2008. On the Movement of Beluga Whales inCook Inlet, Alaska: Simulations of Tidal and Environmental Impacts Using aHydrodynamic Inundation Model. Oceanography, 21(4): 186–195. doi:10.5670/oceanog.2008.17.
Favre, H. 1935. Etude Théorique et Expérimentale des Ondes de Translation dansles Canaux Découverts. Dunod, Paris, France (in French).
Henderson, F.M. 1966. Open Channel Flow. MacMillan Company, New York,USA.
Hornung, H.G., Willert, C., and Turner, S. 1995. The Flow Field Downstream ofa Hydraulic Jump. Journal of Fluid Mechanics, 287: 299–316. doi:10.1017/S0022112095000966.
Keevil, C.E., Chanson, H., and Reungoat, D. 2015. Fluid Flow and SedimentEntrainment in the Garonne River Bore and Tidal Bore Collision. Earth SurfaceProcesses and Landforms, 40(12): 1574–1586. doi:10.1002/esp.3735.
Khezri, N., and Chanson, H. 2012. Undular and Breaking Bores on Fixed andMovable Gravel Beds. Journal of Hydraulic Research, 50(4): 353–363. doi:10.1080/00221686.2012.686200.
Koch, C., and Chanson, H. 2008. Turbulent Mixing beneath an Undular BoreFront. Journal of Coastal Research, 24(4): 999–1007. doi:10.2112/06-0688.1.
Leng, X., and Chanson, H. 2015. Breaking Bore: Physical Observations of RollerCharacteristics. Mechanics Research Communications, 65: 24–29. doi:10.1016/j.mechrescom.2015.02.008.
Leng, X., and Chanson, H. 2016. Coupling between Free-surface Fluctuations,Velocity Fluctuations and Turbulent Reynolds Stresses during the UpstreamPropagation of Positive Surges, Bores and Compression Waves. EnvironmentalFluid Mechanics, 16, 25 pages (In Print). doi:10.1007/s10652-015-9438-8.
Liggett, J.A. 1994. Fluid Mechanics. McGraw-Hill, New York, USA.Lighthill, J. 1978. Waves in Fluids. Cambridge University Press, Cambridge, UK,
504 pages.Locke, A., Hanson, J.M., Klassen, G.J., Richardson, S.M., and Aube, C.I. 2003. The
damming of the Petitcodiac River: Species, populations, and habitats lost.Northeastern Naturalist, 10(1): 39–54. doi:10.2307/3858671.
Lu, H.Y., Pan, C.H., and Zeng, J. 2009. Numerical simulation and analysis forcombinational effects of two bridges on the tidal bore in the Qiantang River.In Proceedings of 5th International Conference on Asian and Pacific Coasts,Singapore, 3: 325–333. doi:10.1142/9789814287951_0133.
Microsonic. 2004. Instruction manual mic+ Ultrasonic Sensors with one ana-logue output. Microsonic GmbH, Germany, 3 pages.
Mori, N., Cox, D.T., Yasuda, T., and Mase, H. 2013. Overview of the 2011 TohokuEarthquake Tsunami damage and its relation with coastal protection alongthe Sanriku coast. Earthquake Spectra, 29(S1): S127–S143. doi:10.1193/1.4000118.
Nortek. 2009. Vectrino Velocimeter User Guide. Nortek AS, Norway, 42 pages.Peregrine, D.H. 1966. Calculations of the Development of an Undular Bore. Jour-
nal of Fluid Mechanics, 25: 321–330. doi:10.1017/S0022112066001678.Raupach, M.R. 1992. Drag and drag partition on rough surfaces. Boundary Layer
Meteorology, 60: 375–395. doi:10.1007/BF00155203.Ren, L.L., and Luo, C.Y. 2010. The monitor of Qiantangjiang strong tidal water
velocity and scouring of river-spanning bridge in Jiashao. Shanxi Architec-ture, 36(18): 305–306. [In Chinese.]
Rulifson, R.A., and Tull, K.A. 1999. Striped Bass Spawning in a Tidal Bore River:the Shubenacadie Estuary, Atlantic Canada. Transactions of the American
Yeow et al. 733
Published by NRC Research Press
Can
. J. C
iv. E
ng. D
ownl
oade
d fr
om w
ww
.nrc
rese
arch
pres
s.co
m b
y U
nive
rsity
of
Que
ensl
and
on 0
8/05
/16
For
pers
onal
use
onl
y.

Fisheries Society, 128: 613–624. doi:10.1577/1548-8659(1999)128<0613:SBSIAT>2.0.CO;2.
Simpson, J.H., Fisher, N.R., and Wiles, P. 2004. Reynolds Stress and TKE Produc-tion in an Estuary with a Tidal Bore. Estuarine, Coastal, and Shelf Science,60(4): 619–627. doi:10.1016/j.ecss.2004.03.006.
St-Germain, P., Nistor, I., Townsend, R., and Shibayama, T. 2014. Smoothed-Particle Hydrodynamics Numerical Modeling of Structures Impacted by Tsu-nami Bores. Journal of Waterway, Port, Coastal, and Ocean Engineering,140(1): 66–81. doi:10.1061/(ASCE)WW.1943-5460.0000225.
Sutton, S.L.F., and McKenna-Neuman, C. 2008. Variation in Bed Level ShearStress on Surfaces Sheltered by Nonerodible Roughness Elements. Journal ofGeophysical Research, Earth Surface, 113, paper F103016, 12 pages. doi:10.1029/2007JF000967.
Treske, A. 1994. Undular Bores (Favre-Waves) in Open Channels - Experimental Studies.Journal of Hydraulic Research, 32(3): 355–370. doi:10.1080/00221689409498738.
Tricker, R.A.R. 1965. Bores, Breakers, Waves and Wakes. American Elsevier Publ.Co., New York, USA.
Xie, D.F., and Pan, C.H. 2013. A preliminary study of the turbulence features ofthe tidal bore in the Qiantang River, China. Journal of Hydrodynamics, SeriesB, 25(6): 903–911. doi:10.1016/S1001-6058(13)60439-4.
Xu, C.J., Yin, M., and Pan, X.D. 2016. Field Test and Numerical Simulation of TidalBore Pressures on Sheet-Pile Groin in Qiantang River. Marine Georesourcesand Geotechnology, 34: 303–312. doi:10.1080/1064119X.2014.954683.
Xu, Z., and Liang, B. 2010. Experimental Study on Local Scour of Jiubao BridgePier in Hangzhou. Zhejiang Hydrotechnics, 170(4): 13–17. [In Chinese.]
List of symbols
A flow cross-section area (m2)A1 initial cross-section area (m2)B free-surface width (m)
B1 initial free-surface width (m)D large roughness element diameter (m)d water depth (m)
d1 initial water depth (m)d2 conjugate water depth (m)
dmax maximum water depth (m) during tidal bore passageFr Froude number
Fr1 tidal bore Froude numberg gravity constant (m/s2) or acceleration of gravityH large roughness element height (m)L test section length (m)
Mo Morton number
P pressure (Pa)Q water discharge (m3/s)
Re flow Reynolds numbert time (s) since Tainter gate closure
U tidal bore celerity (m/s) positive upstreamV1 initial flow velocity (m/s)V2 conjugate flow velocity (m/s)Vx longitudinal velocity component (m/s)Vy transverse velocity component (m/s)Vz vertical velocity component (m/s)V mean velocity (m/s); in a steady flow, V is the time-averaged
velocity; in a rapidly-varied unsteady flow, V is the instanta-neous ensemble-averaged velocity
v velocity fluctuation (m/s)vx longitudinal velocity fluctuation (m/s)vy transverse velocity fluctuation (m/s)vz vertical velocity fluctuation (m/s)x longitudinal distance (m)
xo longitudinal position (m) of large roughness element centrey transverse distance (m) from the channel centrelinez vertical elevation distance (m) measured from the channel
invert� water viscosity (Pa·s)� water density (kg/m3)� surface tension (N/m) between air and water� shear stress (Pa)
Subscript
i = x, y or zj = x, y or zx longitudinal componenty transverse componentz vertical component1 initial flow conditions2 conjugate flow conditions (i.e., after the tidal bore)
25 first quartile75 third quartile
734 Can. J. Civ. Eng. Vol. 43, 2016
Published by NRC Research Press
Can
. J. C
iv. E
ng. D
ownl
oade
d fr
om w
ww
.nrc
rese
arch
pres
s.co
m b
y U
nive
rsity
of
Que
ensl
and
on 0
8/05
/16
For
pers
onal
use
onl
y.