impact assessment on smart metering · table 20. advantages and disadvantages of solutions to...
TRANSCRIPT

ROMANIA
Advisory Services Agreement on
Developing the Capacity of the Central Public Administration to Carry Out Impact Studies
Impact Assessment on Smart Metering:
Data and methodologies for a cost-benefit analysis of smart metering implementation in Romania
National Regulatory Authority for Energy

2
TABLE OF CONTENTS
Acknowledgements .......................................................................................................... 6
Executive Summary .......................................................................................................... 7
1. Status quo .................................................................................................................... 9
1.1. The importance of cost-benefit analysis for smart metering implementation in Romania ............ 9
1.2. Scope and objectives of this report ............................................................................................... 10
1.3. Background: What has been done thus far in the area of costs and benefits of smart meters in Romania ................................................................................................................................................ 11
2. Cost-benefit analyses of smart meters in other European countries............................. 14
2.1. Germany ......................................................................................................................................... 16
2.2. The United Kingdom ...................................................................................................................... 19
2.3. The Netherlands ............................................................................................................................. 23
2.4. Ireland ............................................................................................................................................ 27
2.5. Hungary .......................................................................................................................................... 31
2.6. France ............................................................................................................................................. 33
2.7. Lessons learned for Romania ......................................................................................................... 34
3. Costs of Smart Meters in Romania .............................................................................. 37
3.1. Data from DSOs’ 2015-2016 pilot studies ...................................................................................... 37
3.2. Issues with smart metering cost data ............................................................................................ 44
3.3. Solutions to issues with smart metering cost data ........................................................................ 45
4. Benefits of smart meters in Romania .......................................................................... 53
4.1. Data from Distribution System Operators’ 2015-2016 pilot studies ............................................. 53
4.2. Identification of affected stakeholders .......................................................................................... 58
4.3. Key societal benefits ...................................................................................................................... 59
4.4. Issues with missing data ................................................................................................................ 61
4.5. Recommendations on carrying out a full cost benefit analysis on smart meters ......................... 61
Annex A. Previous cost-benefit analysis costs and benefits estimates: summary ............. 67
Annex B. Previous cost-benefit analysis benefits estimates – detailed ............................. 69
Annex C. Benefits types and metrics used as part of the pilot studies .............................. 75
Annex D. Sources for cost-benefit analysis in other European countries .......................... 76
Annex E. Smart metering trials, net conservation effects, and sample sizes ..................... 77
Annex F. Interoperability: issues for RIA ......................................................................... 79
3
LIST OF FIGURES Figure 1. Discounted costs (€/metering point) ..................................................................................... 17
Figure 2. Discounted benefits (€/metering point) ................................................................................ 18
Figure 3. One-page summary of the impact assessment by DECC (2014) ............................................ 21
Figure 4. Typologies of costs (percentages and absolute spending) .................................................... 22
Figure 5. Typologies of benefits (percentages and absolute amount) ................................................. 22
Figure 6. Costs of smart meters (in € per meter, from international review) ...................................... 25
Figure 7. DSO annual costs (in € per meter, from international review) .............................................. 25
Figure 8. Net cashflow (undiscounted) ................................................................................................. 26
Figure 9. Cumulative net present values’ impact on smart meter rollout ........................................... 26
Figure 10. Sensitivity analysis of main categories of costs and benefits .............................................. 27
Figure 11. Assumed rollout schedule .................................................................................................... 28
Figure 12. Suppliers’ capital costs of smart metering ........................................................................... 29
Figure 13. NPVs for different stakeholders (in thousands of Euros) .................................................... 30
Figure 14. Sensitivities of different variables (in thousands of Euros) ................................................. 31
Figure 15. Cumulative penetration of smart meters and standard meters .......................................... 32
Figure 16. Benefits and costs in the Hungarian cost-benefit analysis (€ per metering point) ............. 33
Figure 17. Costs in cost-benefit analyses of smart metering implementation ..................................... 35
Figure 18. Benefits in cost-benefit analyses on smart metering implementation ............................... 35
Figure 19. Average unit cost per consumer (RON) ............................................................................... 38
Figure 20. Breakdown of costs per meter ............................................................................................. 38
Figure 21. Unit investment cost per customer, 2015 pilots ................................................................. 41
Figure 22. Investment costs for the purchase of single-phase smart meters in 2015 pilots ................ 42
Figure 23. Investment cost for the purchase of three-phase smart meters......................................... 42
Figure 24. Investment cost for the purchase of balance meters, 2015 pilots ...................................... 43
Figure 25. Cost of the communication system (per meter) in 2015 pilots ........................................... 43
Figure 26. Share of benefits (data from pilot studies) .......................................................................... 56
Figure 27. Reductions in meter reading costs and O&M costs (RON per meter) ................................. 57
Figure 28. Typical smart metering architecture .................................................................................... 81
4
LIST OF TABLES Table 1. List of costs and cost-related assumptions ............................................................................. 11
Table 2. Benefits and benefits-related assumptions ............................................................................ 12
Table 4. List of benefits (from EU 2012/148/EU Recommendation) .................................................... 15
Table 5. Main assumptions underpinning German Cost-Benefit Analysis ............................................ 17
Table 6. Energy savings ......................................................................................................................... 18
Table 7. Sensitivity analysis: changes that induce negative net present values ................................... 19
Table 8. Changes in results of cost-benefit analyses of smart metering carried out by UK governments between 2011 and 2014 (million pounds) ............................................................................................ 23
Table 9. Categories of DSO costs .......................................................................................................... 24
Table 10. Profile of usage-related benefits ........................................................................................... 28
Table 11. Electricity generation benefits and costs .............................................................................. 30
Table 12. Benefits associated with lower system marginal prices ....................................................... 30
Table 13. Key assumptions in the Hungarian cost-benefit analysis ...................................................... 32
Table 14. Costs in the French cost-benefit analysis .............................................................................. 34
Table 15. Benefits in the French cost-benefit analysis ......................................................................... 34
Table 16. Summary of costs from pilots in 2015-2016 ......................................................................... 38
Table 17. Average cost by equipment type as of data from 2016 pilots by 12.31.2016 ...................... 39
Table 18. Unit cost per meter: 2015 pilots and 2016 pilots ................................................................. 39
Table 19. Auxiliaries installed in the pilot projects in order to ensure communication ....................... 44
Table 20. Advantages and disadvantages of solutions to capping smart metering market prices ...... 47
Table 21. Values per €/meter in other European countries ................................................................. 47
Table 22. Key differences between a national economic cost-benefit analysis and fiscal costing ...... 48
Table 23. Depreciation of CAPEX in the Irish cost-benefit analysis ...................................................... 50
Table 24. The main benefits of smart meters (from 2015 pilot studies) .............................................. 54
Table 25. Smart meter additional benefits (from 2015 pilot studies) .................................................. 55
Table 26. Calculations for deriving reductions in technical losses ....................................................... 57
Table 27. Studies filling gaps in terms of wider stakeholder data ........................................................ 63
Table 28. Comparison between four approaches ................................................................................. 66
5
LIST OF ACRONYMS Acronyms Explanation
ANRE National Regulatory Authority for Energy (Autoritatea Naţională de Reglementare în Domeniul Energiei)
CAPEX Capital expenditure CBA Cost-benefit analysis DCC Data and Communications Company DSO Distribution system operator ERGEG European Regulators' Group for Electricity and Gas GPRS General packet radio services HV High voltage IA Impact assessment ICT Information communication technologies IEA International Energy Agency IHD In-home display LV Low voltage MV Medium voltage NPV Net present value OPEC Operational expenditure PLC Power line communication RIA Regulatory Impact Assessment SAIDI System average interruption duration index SAIFI System average interruption frequency index SM Smart meter SN Substantiation note ToU Time of use
6
ACKNOWLEDGEMENTS
This report is delivered under the Advisory Services Agreement on “Developing the Capacity of the Central Public Administration to Carry Out Impact Studies” between the General Secretariat of the Government and the International Bank for Reconstruction and Development, signed on March 9, 2016. It is part of Output 1, “Two reports on impact assessment, one report on data collection and analytical methodology used for the impact assessment in emergency medicine, one report on analytical methodology for the impact assessment in smart metering, and one report documenting the dissemination event to share international experience on smart metering, as set forth in Component A.1(b) and A.1(c)” under the above-mentioned agreement, respectively under the Amendment No. 1 to the agreement.
This report was prepared by a World Bank team that includes: Francesca de Nicola, Arabela Aprahamian, Mădălina Prună and Oana Franț. The following international and Romanian experts provided technical and methodological guidance: Jacopo Torriti and Otilia Nutu.
The team would like to thank Marialisa Motta, Paulo Guilherme Correa, Tatiana Proskuryakova, Elisabetta Capannelli, and the Romania Portfolio Team for the continuous advice and support provided. The report benefitted from helpful comments from the following colleagues and peer-reviewers: Catalin Pauna, Alfredo Briseno, and Varun Nangia.
The team would also like to thank the counterparts in the Department for the Coordination of Policies and Priorities in the Chancellery of the Prime Minister led by Oana Pintilei, Ramona Oana Lohan, Radu Puchiu, Dragos Negoita and Anca Lupu for the precious support and collaboration provided.
Disclaimer
This report is a product of the International Bank for Reconstruction and Development/the World Bank. The findings, interpretation, and conclusions expressed in this paper do not necessarily reflect the views of the Executive Directors of the World Bank or the Governments they represent. The World Bank does not guarantee the accuracy of the data included in this work.
This report does not necessarily represent the position of the European Union or the Romanian Government.
Copyright Statement
The material in this publication is copyrighted. Copying and/or transmitting portions of this work without permission may be a violation of applicable laws.
For permission to photocopy or reprint any part of this work, please send a request with the complete information to either: (i) General Secretariat of the Government - Chancellery of the Prime Minister, Directorate for Coordination of Policy and Programs (Victoriei Square, No 1, Bucharest, Romania) or (ii) the World Bank Group Romania (Vasile Lascăr Street, No 31, Et 6, Sector 2, Bucharest, Romania).
7
EXECUTIVE SUMMARY
Romania needs to make important decisions on smart metering implementation, but has yet to conduct an up-to-date cost-benefit analysis that fully measures the economic impacts of this radical change in electricity systems. A cost-benefit analysis is the most diffused economic tool for appraising the costs and benefits of different policies and regulations. The importance of a cost-benefit analysis is higher for policies that are associated with substantial investments of public resources. The implementation of smart meter implementation systems falls within the category of investments. This report summarizes the data on costs and benefits available to date and provides information about methodologies for carrying out a cost-benefit analysis of smart metering in Romania.
The report presents the main features of existing cost-benefit analyses of smart metering in the following European countries: Germany, the UK, the Netherlands, Ireland, Hungary, and France. The main lessons learned for Romania relate to reductions in electricity consumption and loss reductions. Consumption reduction critical for cost-benefit analysis because of the long-term savings it can generate: a relatively small percentage of benefits in terms of savings are multiplied by millions of users.
The total cost of smart metering implementation generally ranges between €50 and €100 per meter. In Germany, where the most expensive communications technology (GPRS) is adopted, the cost for the entire system is estimated at over €233 per metering point. On the other hand, the cheapest communications technology (PLC) is principally applied in the countries with the lowest reported cost, including Romania and Hungary. About 93% of the costs are associated with communications, IT, and meters. Overall, the total discounted costs for the UK, Germany, the Netherlands, Ireland, and Hungary are, respectively, €281.65, €492.12, €240.28, €260.49, and €242.42. These are significantly high compared to the Romanian estimate of costs, i.e. €97.73, from the AT Kearney study.
In regard to benefits, reductions in meter reading operations vary from €14.5 per meter (in Hungary) to €145.8 (in the UK). The discrepancies between reduction meter reading costs can be connected to divergent regulatory and operational arrangements with regard to the billing cycle and differences in labor costs (as explained above about installation costs). Reductions in the technical losses of electricity are high only for the UK and Romania. Reductions in commercial losses are significantly higher (€43.6) in the AT Kearney study for Romania than in any other country, with Hungary as the second highest at €19.6. Overall, the total discounted benefits for the UK, Germany, Netherlands, Ireland, and Hungary are, respectively, €308.9, €484.9, €287.3, €187.7, €164.6, and €129.4.
The report also presents available Romanian data from the distribution system operators (DSOs) as part of the 2015-2016 pilot studies on smart metering implementation. Overall, the average cost per meter varied significantly from the initial cost appraisal in the AT Kearney study, which was estimated as 98 EUR per consumer. Actual costs in the 2015 pilots were 126 EUR per consumer and 60 EUR RON per consumer in the 2016 pilots. Initial costs per consumer in the pilot projects submitted to ANRE for approval in 2016 were 93 EUR. Overall, costs decreased substantially between the pilots in 2015 and 2016. Regarding communication costs, cheaper PLC solutions were widely adopted with costs as low as 15 EUR per consumer; however, communication costs reached 57-61 EUR per consumer where GSM/GPRS and RF were installed.
Benefits from the 2015-2016 pilot studies on smart metering implementation point to meter reading costs reductions of 55-97%, a reduction of operating costs for activities requiring the physical presence of specialized teams of 27-97%, and CPT reduction varying from increases of 38% to reductions of up to 100%.

8
These findings point to the challenges of carrying out a precise cost-benefit analysis for smart metering implementation. A set of technical and methodological issues is raised in regard to issues with missing benefits data, smart metering cost data, the depreciation of meters, and tariff effects.
The report does not cover emerging areas of costs and benefits associated with the digitalization of metering infrastructure. These include cybersecurity and the standardization of interoperability. In addition, recent evidence from the rollout process in other European countries suggests that the non-acceptance of meters at the end-user level may increase the costs of meter replacement and reduce benefits.
It is concluded that Romania is in a good position to perform a meaningful cost-benefit analysis, but more attention needs to be paid to the entirety of stakeholders, including end-users. The following recommendations are provided in regard to carrying out a full cost benefit analysis of smart meters in Romania:
1. embedding findings from pilot studies in decisions on smart metering rollout;
2. focusing on societal costs and benefits; and
3. quantifying electricity cost savings for consumers.
The report provides an indication of the implications regarding time and different data and methodology options associated with these recommendations.
9
1. STATUS QUO
Romania needs to make important decisions on smart metering implementation, but has yet to conduct an up-to-date cost-benefit analysis that fully measures the economic impacts of this radical change in electricity systems. This report summarizes the data on costs and benefits available to date and provides information about methodologies for carrying out a cost-benefit analysis on smart metering in Romania.
Similar to other countries, decisions concerning substantial public investments in smart metering infrastructure are very difficult for policy-makers without the support of strong empirical evidence.
Advocates of smart metering list several benefits, including lower metering cost, energy savings for residential customers, greater supply reliability, variable pricing schemes to attract new customers, and easier detection of fraud. In addition, other benefits are foreseen in relation to distributed generation as the smart meter can be used to separately measure electricity delivered by distributed generation to the grid. Moreover, the smart metering communication infrastructure can be used to remotely control distributed generation. Demand side response and dynamic pricing can be enabled via the smart meter.
On the other hand, some argue that smart meters at the societal level may bring about more costs than benefits. For instance, there is limited evidence so far that smart meters will save energy (or money) to end-users. The presence of smart meters may not end estimated billing and may even make it more difficult for consumers to switch suppliers. Other drawbacks of smart metering rollouts include making a long-term financial commitment to the new metering technology and related software; managing and storing vast quantities of metering data; and ensuring the security of metering data.
The decision on whether and how to spend several millions of Euros on such a radical change for electricity systems cannot be based solely on perceptions, lobbying, and private interests. The decision on smart metering implementation in Romania will have to be based on the economic rationale of a cost-benefit analysis and emphasize costs and benefits associated with end users.
This report sets out to inform the smart metering community of public policy-makers, regulators, the industry, and civil society about data and methodologies that should be adopted when carrying out a cost-benefit analysis of Smart Metering implementation in Romania. The report takes into account work carried out as part of the World Bank Group pilot project and international experiences with cost-benefit analyses of smart metering.
1.1. The importance of cost-benefit analysis for smart metering implementation in Romania
Cost-benefit analysis is the most diffused economic tool for appraising the costs and benefits of different policies and regulations. The importance of cost-benefit analysis is greater for policies that feature large investments of public resources. Cost-benefit analyses on smart meter implementation are within this category.
Cost-benefit analysis determines whether the benefits of a project or decision outweigh its costs. When, as is the case for national energy policies and regulations, public authorities perform cost-benefit analyses, the costs and benefits consist of broad and societal impacts from a public perspective. In other words, public cost-benefit analyses take a wider societal perspective,

10
determining whether a project is a good allocation of societal resources, without regard to the distribution of benefits.
Like other European Union (EU) Member States, the Romanian government has an obligation to carry out a cost-benefit analysis as a result of the EU Third Energy Package requirement in order to determine the viability of a smart rollout. The recommended methodological approach to developing a cost-benefit analysis on smart meters is presented in the European Commission’s Recommendation 2012/148/EU1. Key aspects of the methodology involve (i) the approach; (ii) minimum functionality of the smart metering system; (iii) costs; and (iv) benefits.
In addition to the EU obligation, carrying out an updated cost-benefit analysis will inform the complex decision-making associated with a sizable investment for the Romanian government. The impacts from a rollout of smart meters will involve a range of actors: (i) consumers (in terms of accurate costs and real-time information to enable them to manage energy consumption and potentially receive new services), (ii) DSOs (in terms of the management of frequent data on consumption and changes in costs to serve), and (iii) society (in terms of carbon emissions). There are also benefits for the transmission system operator stemming from the use—subject to appropriate data, privacy, and access controls—of data collected through smart metering to better manage the network and to inform long-term investment in the electricity grid. Assessing the costs and benefits of intervention also means taking into account the volumes of smart metering implementation that would occur without direct government investment.
DSOs regularly invest large sums in utility equipment devoted to public service in pursuit of their regulatory or charter obligations to serve. Extending and maintaining the service of deprived or underdeveloped distribution networks, for example, is a generally accepted unit of cost that is often implicit in the regulatory obligations. DSOs are well placed to assess the costs and benefits of these investments as they routinely fulfill these non-discretionary obligations while minimizing the cost of doing so. Regulators are also prepared to defend their decisions in this cost-minimization framework while relying on data supplied by utilities. However, smart metering development may not fit into this time-tested paradigm of cost minimization because it brings about a higher level of innovation and relates to the whole network. For instance, if a smart meter in a low-voltage distribution network can improve reliability beyond currently acceptability levels, it is unclear whether it is mandatory to invest resources to do so. This may depend on how much must be invested to obtain the improvements for DSOs, suppliers and consumers and whether the improvement gained is worth the money.
These complexities call for a consistent approach when selecting the type of data and methodologies that should be included in any cost-benefit analysis of smart metering implementation.
1.2. Scope and objectives of this report
The main aim of this report is to provide guidance in regard to the data and methodologies for a cost-benefit analysis of smart metering implementation in Romania. The report takes into account work carried out as part of the World Bank Group pilot project as well as examples of cost-benefit analyses performed in Europe for smart metering.
The report is to be read as the technical accompanying document of “Report 1 - How to carry out a RIA on smart metering in Romania.” It presents a comprehensive set of guidelines and specific instructions for estimating the benefits and costs of smart meter implementation. It combines
1 European Commission Recommendation 2012/148/EU of March 9, 2012 on preparations for the rollout of smart metering systems (OJ L 73, 13.3.2012, p.9).

11
economic techniques for cost-benefit analysis with smart meter specific knowledge, hence pointing to possible methodological and data-related solutions. It is not a cost-benefit analysis of smart meters in Romania per se; rather, it offers guidance regarding methodological and data issues that should be considered when carrying out such an analysis.
Performing a cost-benefit analysis of smart meters poses interesting and challenging problems in terms of measuring physical impacts and estimating economic benefits from them. However, when smart meters are part of first-of-kind or pilot projects (as is the case in Romania), there are additional challenges to producing a meaningful cost-benefit analysis.
1.3. Background: What has been done thus far in the area of costs and benefits of smart meters in Romania
The AT Kearney study was carried out in 2012 for the European Bank of Reconstruction and Development.
The overall approach of the AT Kearney cost-benefit analysis consists of an engineering bottom-up costing technique. The cost-benefit analysis considers different cost layers (i.e., meter layer, middleware layer, and application layer), system maintenance, and costs of financing. The layers consist of data concentrators and balancing meters placed on each substation. The data communication takes place through PLC wiring from the meters to the concentrators and through various communication channels from concentrators to the central application.
Table 1. List of costs and cost-related assumptions Used for
calculating Variable No. Unit Reasons
Meter layer
Depreciation period of smart meters
10 years Maximum depreciation period permitted
Legalization period of smart meters
10 years This is the new legalization period for electricity meters
Number of smart meters installed per day
8 pcs Same rate as for the traditional meters
Number of FTE for the installation of 1 smart meter
1 FTE No need for installation team to be composed of 2 people
Middleware layer
Number of installed balancing meters and concentrators
68.117 pcs Equal to the number of substations. We have assumed a measurement and protection block for each concentrator
Depreciation period of balancing meters, concentrators
10 years Same depreciation period for couplers, modems
Depreciation period of Wi-Fi, WiMAX towers, fiber optics
15 years More complex assets, longer depreciation period
Application layer
Depreciation of computer hardware and applications
5 years
System maintenance
Average power of meter 0.9 W Benchmark from similar projects of A.T. Kearney
Average power of concentrator 2.5 W Benchmark from similar projects of A.T. Kearney
% of meters damaged 1 % Benchmark from similar projects of A.T. Kearney

12
Failure rate for remote connection/disconnection
2 % Benchmark from similar projects of A.T. Kearney – 1% after 2018 onward due to learning curve
Number of connections/disconnections per day by one team
8 pcs Benchmark from similar projects of A.T. Kearney
% of concentrators damaged 1.5 % Benchmark from similar projects of A.T. Kearney
% of automatic read requiring manual verifications
1 % Benchmark from similar projects of A.T. Kearney – constant decrease to 0.35% in 2032 due to learning curve
Number of maintenance operations per concentrator
1 pcs/ year
At least once a year a concentrator has to be verified that it functions properly to grasp onto the benefits from having it
Events occurrence rate 3 % Benchmark from similar projects of A.T. Kearney – constant decrease to 0.12% in 2022 due to learning curve
Costs of financing
% of capital from external sources (debt)
90 % Majority of the investment to be supported with debt since investment budgets are not high
Loan interest rate 6 % 1% external financing interest rate plus 5% ROBOR
The original AT Kearney cost categories and cost-related assumptions are summarized in Table 1.
The unit costs of the proposed system are low when compared with other European countries (Section 2 of this report). The average expenditure per metering point is estimated at just under €100. The report includes total costs and unit costs of meters, data concentrators, and balancing meters, though the total costs are not broken down into capital and operating expenditures. These originally did not include a €25 per metering point cost of distribution investment. Areas of costs and benefits that are not included in the AT Kearney study (and should be included, as stated by the EU Recommendation (2012/148/EU) are call center costs, consumption impact (apart from via commercial losses), CO2 costs (though these are considered separately), and the deferral of network investment benefits.
Table 2. Benefits and benefits-related assumptions Used for calculating Variable No. Unit Reasons
Reduced meter
reading costs
Average no. of readings/year 4 pcs On average, meter readings for household customers are done once every 3 months (4 times a year)
Average cost of single reading/meter/year
0.001 000 EUR Average value based on the questionnaires received from distributors
Reduced electricity
commercial losses
Commercial losses level 7 % Average value based on the questionnaires received from distributors and ANRE
Increase in distribution tariff to cover network losses
3 % We assumed an average increase in the distribution tariff to cover network losses by 3% in the assumed years of implementation
Reduced electricity Technical
losses
The average annual volume of energy not registered in the inductive meter
0.0025 MWh A.T. Kearney project experience
Average inductive meter power 4 W A.T. Kearney project experience

13
Average electronic meter power
0.7 W A.T. Kearney project experience
Reduced distribution operation
costs
Meter legalization cost (including installation/deinstallation)
0.011 000 EUR Average value based on the questionnaires received from distributors
No. of meters connections/ disconnections per day per employee
10 pcs On average, 10 connections or disconnections operations can be performed per day
% of employment cost in total cost of connections/disconnection
40 % The difference is represented by other costs like cars, fuel, etc.
Reduced outages
System average interruption frequency index (SAIFI) - unplanned
6.1 pcs Average value based on the questionnaires received from distributors; ANRE
System average interruption duration index (SAIDI) – unplanned
7.97 h Average value based on the questionnaires received from distributors; ANRE
Potential of reduction of average time needed to identify and fix the failure
1 % A.T. Kearney project experience
Deferred Distribution
capacity investments
Purchasing cost of 1-phase traditional electronic meter
0.21 000 EUR Average value based on the questionnaires received from distributors
Purchasing cost of 3-phase traditional electronic meter
0.1 000 EUR Average value based on the questionnaires received from distributors
Average no. of traditional meters that can be installed per day
8 pcs A.T. Kearney project experience
Almost 70% of the overall benefits of the project are accounted for by two variables– reduced manual meter reading costs, which is based on a savings of 4 manual reads per meter per year; and reduced commercial losses. In the core scenario, it is assumed that commercial losses—estimated at 7%—will be reduced by 60% of this amount. The only end-user level demand impact included under the benefits is indirectly related to the commercial losses, as it is assumed that 50% of the reduction in commercial losses will be subsequently invoiced to customers, and 50% manifest in a reduction in consumption.

14
2. COST-BENEFIT ANALYSES OF SMART METERS IN OTHER EUROPEAN COUNTRIES
Romania is not alone when it comes to conducting cost-benefit analyses of smart metering implementation. This section presents the main features of existing cost-benefit analyses of smart metering in the following European countries: Germany, the UK, the Netherlands, Ireland, Hungary, and France. It concludes by identifying key lessons learned for Romania in terms of data and methodological issues associated with categories of costs and benefits.
All European countries had to follow the recommendations of the European Commission, though their cost-benefit analyses all varied, as it is explained in this section of the report. To facilitate the take-up of this new technology the European Commission published Recommendation (2012/148/EU) to prepare for the rollout of smart-metering systems. The recommendation provides step-by-step guidelines for Member States regarding how to conduct a cost-benefit analysis. It also refers to the common minimum functionalities of smart metering systems and addresses data protection and security issues.
The recommendation puts forward a four-stage approach consisting of the following:
1. Tailoring to local conditions - Pilot programs and “real-life” experience should be used in assumptions. At least two scenarios should be contemplated: (a) BAU; and (b) an 80% rollout by 2020.
2. Cost-benefit analysis – This is supposed to follow “seven CBA steps,” indicating costs to be incurred by the consumer and to be compared with long-term benefits.
3. Sensitivity analysis – The analysis should identify “critical variables” and analyze the magnitude of the cost-benefit analysis’ outcome for the positive rollout conditions (i.e., when benefits exceed costs).
4. Performance assessment, externalities, and social impact – The analysis is supposed to assess externalities (e.g., in terms of the environment and carbon implications), as well as the impact of public policy measures and social benefits (i.e., ensuring appropriate weighting factors).
The seven CBA steps are not mandatory and involve the following:
1. Reviewing and describing technologies, elements, and goals. 2. Mapping assets into functionalities. 3. Mapping functionalities into benefits. 4. Establishing the baseline. 5. Monetizing benefits and identifying beneficiaries. 6. Identifying and quantifying costs. 7. Comparing costs and benefits.
In the implementation of this methodological approach, various factors need to be considered, including the following:
• The distinction between social and private costs and benefits. The principal purpose of the cost-benefit analysis is to determine if a widespread rollout of smart meters is economically viable for the country as a whole. In practice, certain participants may bear a disproportionate share of the costs, which by itself does not provide grounds for overturning the results. However, benefits distribution issues are critical at the implementation stage and, in particular, during the development of policy recommendations.
15
• The period of analysis, including whether the replacement of “new” assets (smart meters/communications equipment) is to be considered and, in any case, the terminal value of these assets at the end of the modelling period, where a residual value of assets will be present.
• The time profile of costs and benefits, particularly in the period of the rollout. • The discount rate to be applied.
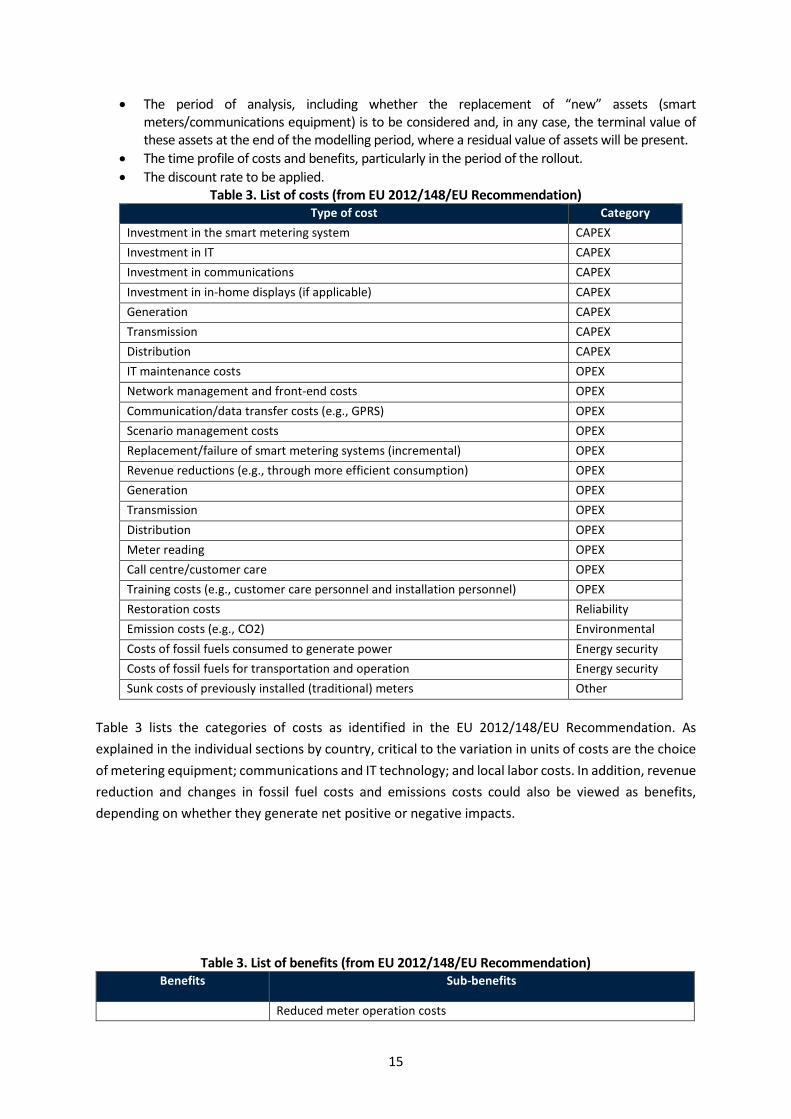
Table 3. List of costs (from EU 2012/148/EU Recommendation) Type of cost Category
Investment in the smart metering system CAPEX Investment in IT CAPEX Investment in communications CAPEX Investment in in-home displays (if applicable) CAPEX Generation CAPEX Transmission CAPEX Distribution CAPEX IT maintenance costs OPEX Network management and front-end costs OPEX Communication/data transfer costs (e.g., GPRS) OPEX Scenario management costs OPEX Replacement/failure of smart metering systems (incremental) OPEX Revenue reductions (e.g., through more efficient consumption) OPEX Generation OPEX Transmission OPEX Distribution OPEX Meter reading OPEX Call centre/customer care OPEX Training costs (e.g., customer care personnel and installation personnel) OPEX Restoration costs Reliability Emission costs (e.g., CO2) Environmental Costs of fossil fuels consumed to generate power Energy security Costs of fossil fuels for transportation and operation Energy security Sunk costs of previously installed (traditional) meters Other
Table 3 lists the categories of costs as identified in the EU 2012/148/EU Recommendation. As explained in the individual sections by country, critical to the variation in units of costs are the choice of metering equipment; communications and IT technology; and local labor costs. In addition, revenue reduction and changes in fossil fuel costs and emissions costs could also be viewed as benefits, depending on whether they generate net positive or negative impacts.
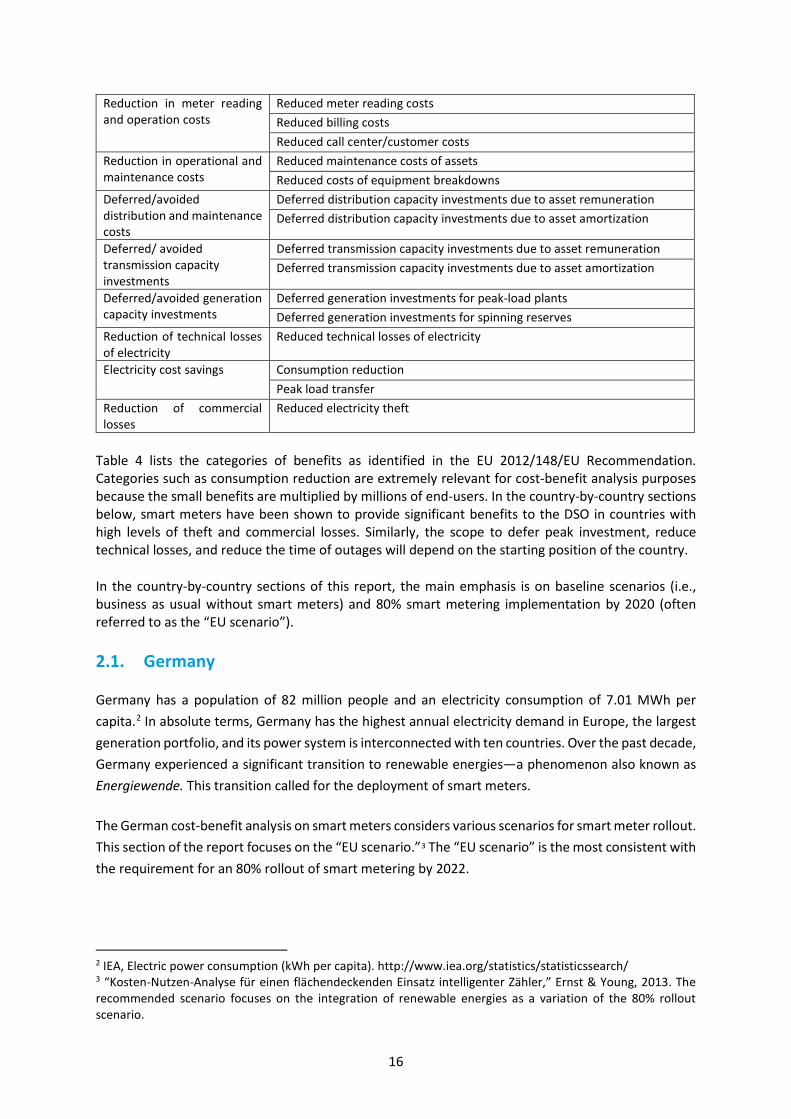
Table 3. List of benefits (from EU 2012/148/EU Recommendation) Benefits Sub-benefits
Reduced meter operation costs
16
Reduction in meter reading and operation costs
Reduced meter reading costs Reduced billing costs Reduced call center/customer costs
Reduction in operational and maintenance costs
Reduced maintenance costs of assets Reduced costs of equipment breakdowns
Deferred/avoided distribution and maintenance costs
Deferred distribution capacity investments due to asset remuneration Deferred distribution capacity investments due to asset amortization
Deferred/ avoided transmission capacity investments
Deferred transmission capacity investments due to asset remuneration Deferred transmission capacity investments due to asset amortization
Deferred/avoided generation capacity investments
Deferred generation investments for peak-load plants Deferred generation investments for spinning reserves
Reduction of technical losses of electricity
Reduced technical losses of electricity
Electricity cost savings Consumption reduction Peak load transfer
Reduction of commercial losses
Reduced electricity theft
Table 4 lists the categories of benefits as identified in the EU 2012/148/EU Recommendation. Categories such as consumption reduction are extremely relevant for cost-benefit analysis purposes because the small benefits are multiplied by millions of end-users. In the country-by-country sections below, smart meters have been shown to provide significant benefits to the DSO in countries with high levels of theft and commercial losses. Similarly, the scope to defer peak investment, reduce technical losses, and reduce the time of outages will depend on the starting position of the country.
In the country-by-country sections of this report, the main emphasis is on baseline scenarios (i.e., business as usual without smart meters) and 80% smart metering implementation by 2020 (often referred to as the “EU scenario”).
2.1. Germany
Germany has a population of 82 million people and an electricity consumption of 7.01 MWh per capita.2 In absolute terms, Germany has the highest annual electricity demand in Europe, the largest generation portfolio, and its power system is interconnected with ten countries. Over the past decade, Germany experienced a significant transition to renewable energies—a phenomenon also known as Energiewende. This transition called for the deployment of smart meters.
The German cost-benefit analysis on smart meters considers various scenarios for smart meter rollout. This section of the report focuses on the “EU scenario.”3 The “EU scenario” is the most consistent with the requirement for an 80% rollout of smart metering by 2022.
2 IEA, Electric power consumption (kWh per capita). http://www.iea.org/statistics/statisticssearch/ 3 “Kosten-Nutzen-Analyse für einen flächendeckenden Einsatz intelligenter Zähler,” Ernst & Young, 2013. The recommended scenario focuses on the integration of renewable energies as a variation of the 80% rollout scenario.

17
The technological choice of Germany consisted of a gateway located in the consumer premises that manages the transfer of data to necessary parties. It provides high levels of data protection (privacy and security) to the customer. There are two important considerations: (i) the gateway configuration involves higher costs than other approaches; and (ii) the benefit of allowing the connection of other utility services to the same infrastructure (e.g., gas and heating).
Table 4. Main assumptions underpinning German Cost-Benefit Analysis Key assumption Unit Value
Rollout period Years 2012-2022 Proportion of metering points covered % 80% by 2022 Modeling period Years 2012-2032 Discount rate % 5% commercial, 3.1% residential and industrial Asset life of meters Years 13 Number of avoided meter readings Number/meter 1 Reduction in consumption % Between 0.5% and 2.5% Peak load transfer GW 6.1 Reduction in non-supplied energy % 1% Reduction in theft % 20%
Table 5 shows the main assumptions in the cost-benefit analysis. The benefits and costs are assessed and discounted for a period of twenty years (from 2012 to 2032). The main assumption regards changes in consumption as associated with the presence of smart meters in end-users’ premises. These vary between 0.5% and 2.5%. This is a five-fold variation that can significantly distort the net impacts of smart meters in Germany.
Figure 1. Discounted costs (€/metering point)
Figure 1 shows the discounted costs of smart meters, IT, communications, in-home display, and training. Although the cost-benefit analysis does not provide a full breakdown of costs and benefits of the EU rollout scenario, there are assessments of costs and volumes. Hence, in Figure 1, the values are expressed in terms of Euro per smart meter. The average cost of communications is particularly high when compared with other cost-benefit analyses. This is because the communications configuration opted for includes an 80% use of GPRS technology and only a 20% use of PLC. Hence, the high proportion of GPRS is a key driver of overall communications costs. GPRS technology allows for the remote control of various devices (for instance, solar panels) rather than solely for remote meter reading. Overall, costs are broken down between capital and operating expenditure, with 38.5 million
190.34
86.34
171.15
33.36
10.93
0 20 40 60 80 100 120 140 160 180 200
Average cost of smart meters
Average cost of IT
Average cost of communications
Average cost of in-home displays
Training
18
electricity smart meters installed over 8 years. Subsequently, the installation of smart meters reflects a growth in customer numbers.
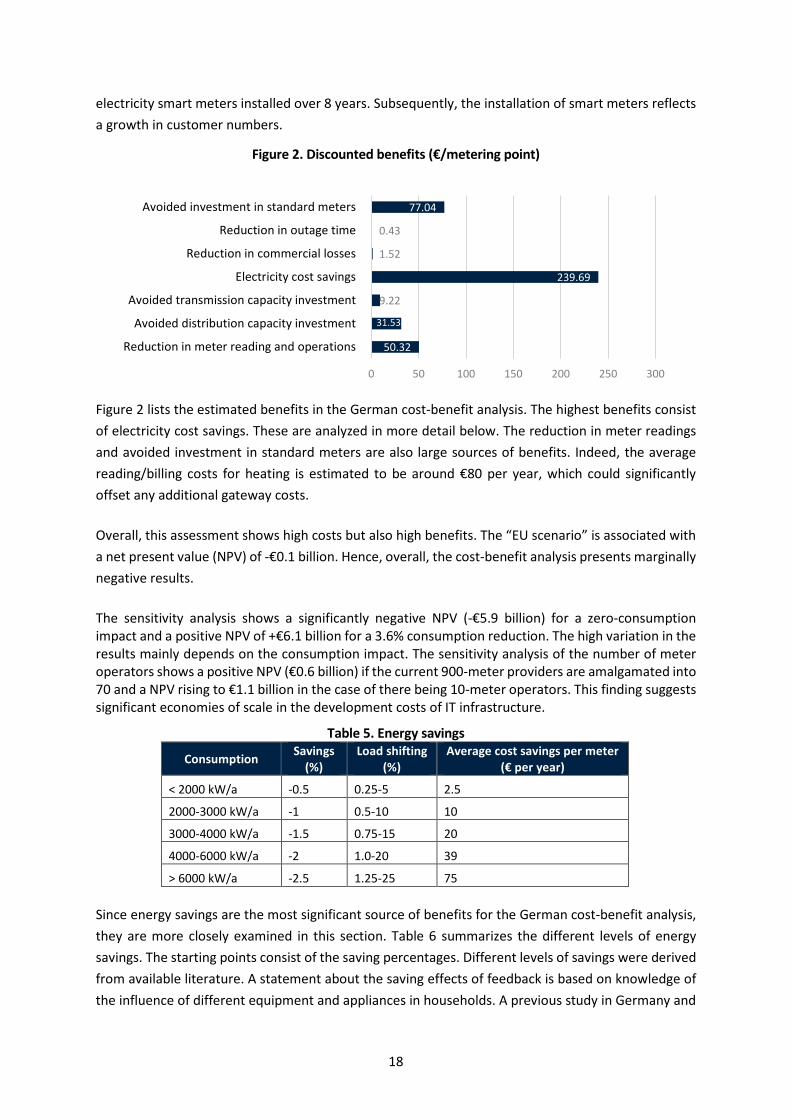
Figure 2. Discounted benefits (€/metering point)
Figure 2 lists the estimated benefits in the German cost-benefit analysis. The highest benefits consist of electricity cost savings. These are analyzed in more detail below. The reduction in meter readings and avoided investment in standard meters are also large sources of benefits. Indeed, the average reading/billing costs for heating is estimated to be around €80 per year, which could significantly offset any additional gateway costs.
Overall, this assessment shows high costs but also high benefits. The “EU scenario” is associated with a net present value (NPV) of -€0.1 billion. Hence, overall, the cost-benefit analysis presents marginally negative results.
The sensitivity analysis shows a significantly negative NPV (-€5.9 billion) for a zero-consumption impact and a positive NPV of +€6.1 billion for a 3.6% consumption reduction. The high variation in the results mainly depends on the consumption impact. The sensitivity analysis of the number of meter operators shows a positive NPV (€0.6 billion) if the current 900-meter providers are amalgamated into 70 and a NPV rising to €1.1 billion in the case of there being 10-meter operators. This finding suggests significant economies of scale in the development costs of IT infrastructure.
Table 5. Energy savings
Consumption Savings (%)
Load shifting (%)
Average cost savings per meter (€ per year)
< 2000 kW/a -0.5 0.25-5 2.5
2000-3000 kW/a -1 0.5-10 10
3000-4000 kW/a -1.5 0.75-15 20
4000-6000 kW/a -2 1.0-20 39
> 6000 kW/a -2.5 1.25-25 75
Since energy savings are the most significant source of benefits for the German cost-benefit analysis, they are more closely examined in this section. Table 6 summarizes the different levels of energy savings. The starting points consist of the saving percentages. Different levels of savings were derived from available literature. A statement about the saving effects of feedback is based on knowledge of the influence of different equipment and appliances in households. A previous study in Germany and
50.32
31.53
9.22
239.69
1.52
0.43
77.04
0 50 100 150 200 250 300
Reduction in meter reading and operations
Avoided distribution capacity investment
Avoided transmission capacity investment
Electricity cost savings
Reduction in commercial losses
Reduction in outage time
Avoided investment in standard meters

19
Austria by Fraunhofer4 showed that the group which received feedback on their electricity demand had a 3.7 % lower energy consumption than the reference group. This amounts to an average of 125 kWh per year. The difference between the groups with and without feedback is somewhat smaller than expected—older studies from other countries found savings of 7%, although the circumstances were very different in those cases. In Linz, the effect remained at the same level during the entire field trial, whereas in Germany no reliable statement about the stability of the effects can be made, as the data basis was too small there.
Table 6. Sensitivity analysis: changes that induce negative net present values Changes/sensitivities Variations in NPV (billions of €)
No energy savings -5.7 Shortfall of grid efficiency -2.9 Extension of the deadline to smart meters from 2018 to 2022 -0.7 Periodic replacement after 24 years -0.6 Shortfall of economies of scale of procurement -2.2
Table 7 illustrates the findings from the sensitivity analysis regarding those changes that induce a negative variation in NPV. The highest sensitivity is associated with energy savings. This means that a null effect of smart meters on end-users would reduce the societal benefits of smart meters to an extent that the NPV would decrease by €5.7 billion. A shortfall in terms of grid efficiency would also generate a substantial reduction in benefits (€2.9 billion). An extension of the deadline to smart meters from 2018 to 2022, periodic replacement after 24 years, and a shortfall of economies of scale of procurement were also considered as sensitivities that bring about negative changes to the overall profitability of smart metering implementation.
2.2. The United Kingdom
The UK has a population of 65 million people and an electricity consumption of 5.08 MWh per capita.5 The country has a rapidly evolving electricity system in which renewable energy sources account for around a quarter of electricity generation. In addition to smart meters, other technological innovations (electric vehicles and new types of storage) are also changing how the British market operates.
The UK government decided to mandate a rollout of meters in October 2009—a year and a half before the results of the pilot trials were published. The UK rollout is characterized by its voluntary (for consumers) nature and by the fact that it is supplier-led.
The UK government produced five cost-benefit analyses on smart meters. The first one was commissioned over ten years ago6, whereas t the Department of Energy and Climate Change (DECC) produced the most recent in 20167. The main reason for the multitude of cost-benefit analyses is that the UK government revised timetables under which suppliers are required to take all reasonable steps
4 Intellekion Project: Achieving Sustainable Energy Consumption with Smart Metering, Communication and Tariff Systems. https://www.intelliekon.de/ergebnisse/downloads/307_Ergebnisbericht_engl_klein.pdf 5 IEA, Electric power consumption (kWh per capita). http://www.iea.org/statistics/statisticssearch/ 6 MacDonald, M. (2007). Appraisal of Costs & Benefits of Smart Meter Roll Out Options. Final Report. Report for Department of Business Enterprise and Regulatory Reform, London. 7 BEIS (2016). Smart Meter Rollout Cost-Benefit Analysis, available at: https://www.gov.uk/government/uploads/system/uploads/attachment_data/file/567167/OFFSEN_2016_smart_meters_cost-benefit-update_Part_I_FINAL_VERSION.PDF
20
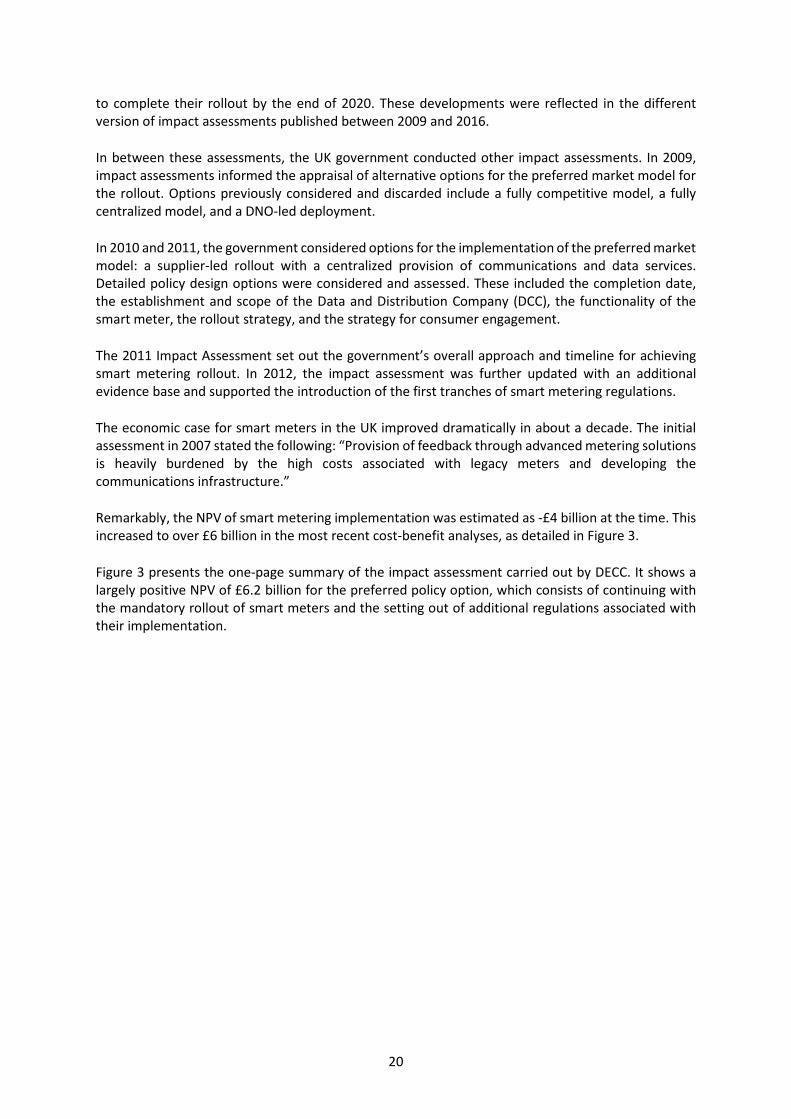
to complete their rollout by the end of 2020. These developments were reflected in the different version of impact assessments published between 2009 and 2016.
In between these assessments, the UK government conducted other impact assessments. In 2009, impact assessments informed the appraisal of alternative options for the preferred market model for the rollout. Options previously considered and discarded include a fully competitive model, a fully centralized model, and a DNO-led deployment.
In 2010 and 2011, the government considered options for the implementation of the preferred market model: a supplier-led rollout with a centralized provision of communications and data services. Detailed policy design options were considered and assessed. These included the completion date, the establishment and scope of the Data and Distribution Company (DCC), the functionality of the smart meter, the rollout strategy, and the strategy for consumer engagement.
The 2011 Impact Assessment set out the government’s overall approach and timeline for achieving smart metering rollout. In 2012, the impact assessment was further updated with an additional evidence base and supported the introduction of the first tranches of smart metering regulations.
The economic case for smart meters in the UK improved dramatically in about a decade. The initial assessment in 2007 stated the following: “Provision of feedback through advanced metering solutions is heavily burdened by the high costs associated with legacy meters and developing the communications infrastructure.”
Remarkably, the NPV of smart metering implementation was estimated as -£4 billion at the time. This increased to over £6 billion in the most recent cost-benefit analyses, as detailed in Figure 3.
Figure 3 presents the one-page summary of the impact assessment carried out by DECC. It shows a largely positive NPV of £6.2 billion for the preferred policy option, which consists of continuing with the mandatory rollout of smart meters and the setting out of additional regulations associated with their implementation.

21
Figure 3. One-page summary of the impact assessment by DECC (2014)
The overall findings of the cost-benefit analysis (i.e., the economic assessment underpinning the impact assessment) are as follows.
In regard to costs, in-home displays (IHDs) as well as meters and their installation and operation amount to £6.36 billion. Data and Communications Company (DCC) related costs, including a
22
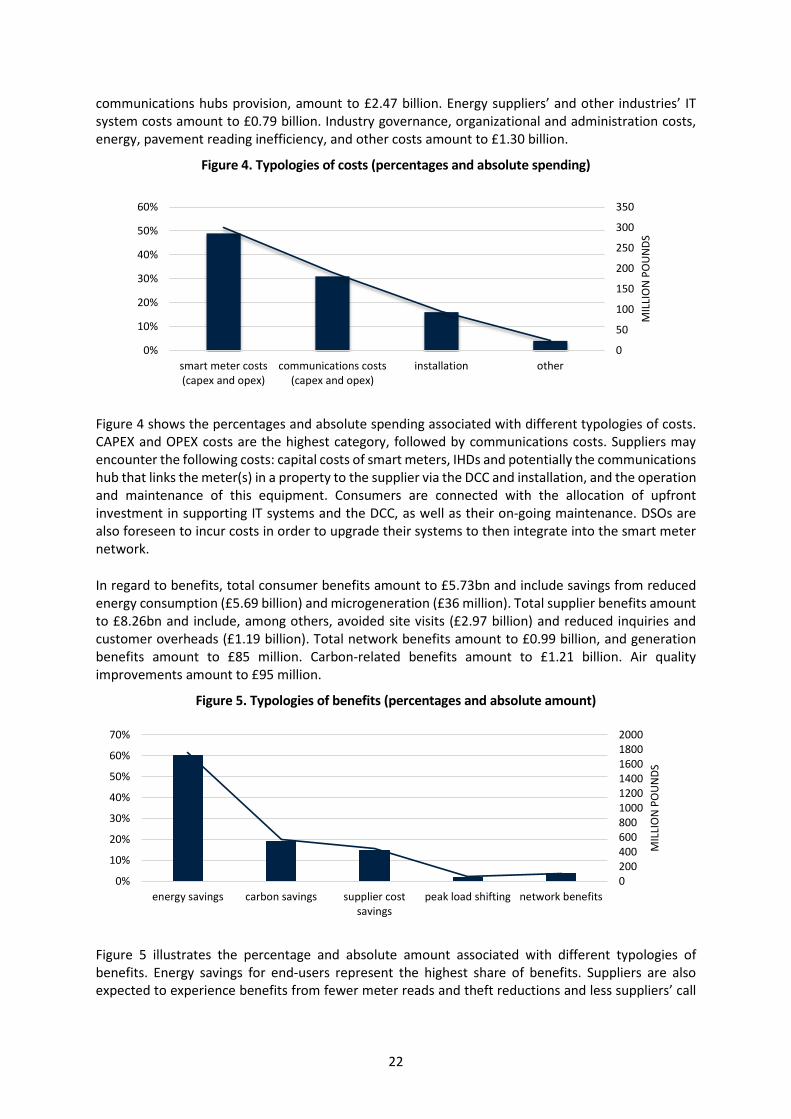
communications hubs provision, amount to £2.47 billion. Energy suppliers’ and other industries’ IT system costs amount to £0.79 billion. Industry governance, organizational and administration costs, energy, pavement reading inefficiency, and other costs amount to £1.30 billion.
Figure 4. Typologies of costs (percentages and absolute spending)
Figure 4 shows the percentages and absolute spending associated with different typologies of costs. CAPEX and OPEX costs are the highest category, followed by communications costs. Suppliers may encounter the following costs: capital costs of smart meters, IHDs and potentially the communications hub that links the meter(s) in a property to the supplier via the DCC and installation, and the operation and maintenance of this equipment. Consumers are connected with the allocation of upfront investment in supporting IT systems and the DCC, as well as their on-going maintenance. DSOs are also foreseen to incur costs in order to upgrade their systems to then integrate into the smart meter network.
In regard to benefits, total consumer benefits amount to £5.73bn and include savings from reduced energy consumption (£5.69 billion) and microgeneration (£36 million). Total supplier benefits amount to £8.26bn and include, among others, avoided site visits (£2.97 billion) and reduced inquiries and customer overheads (£1.19 billion). Total network benefits amount to £0.99 billion, and generation benefits amount to £85 million. Carbon-related benefits amount to £1.21 billion. Air quality improvements amount to £95 million.
Figure 5. Typologies of benefits (percentages and absolute amount)
Figure 5 illustrates the percentage and absolute amount associated with different typologies of benefits. Energy savings for end-users represent the highest share of benefits. Suppliers are also expected to experience benefits from fewer meter reads and theft reductions and less suppliers’ call
0
50
100
150
200
250
300
350
0%
10%
20%
30%
40%
50%
60%
smart meter costs(capex and opex)
communications costs(capex and opex)
installation other
MIL
LIO
N P
OU
NDS
0200400600800100012001400160018002000
0%
10%
20%
30%
40%
50%
60%
70%
energy savings carbon savings supplier costsavings
peak load shifting network benefits
MIL
LIO
N P
OU
NDS

23
center traffic. Network operators are expected to improve electricity outage management and more efficiently resolve any network failures. However, smart grid benefits were not quantified in the CBA.
The main unique aspect of cost-benefit analyses of smart meters in the UK is that the main stakeholders involved are not the DSOs8 but the suppliers.9 A key feature of the CBA in Great Britain is that it foreshadows a dual fuel electricity and gas smart meter rollout. A CBA of this nature reflects the fact that the metering market is de-regulated and that many customers use the same provider for gas and electricity supplies. Hence, in the British supplier-led model, there will be strong incentives to replace both electricity and gas meters with smart meters at the same time. This dynamic will not be applicable in all the other countries.
The different impact assessments (IAs) present dissimilar net present values (NPVs). In 2014, the NPV increased by £184m in comparison to the IA published in August 2011.
Table 7. Changes in results of cost-benefit analyses of smart metering carried out by UK governments between 2011 and 2014 (million pounds)
NPV Total Costs Total Benefits NPV difference
2011 CBA non-domestic £2,154 £604 £2,759 0
2012 CBA non-domestic £2,338 £608 £2,946 £187
2013 CBA (all end-users) £6,659 £12,115 £18,774 0
2014 CBA (all end-users) £6,214 £10,927 £17,141 £445
Table 8 presents the different findings of the CBAs performed between 2011 and 2014. Over the years, the CBA was updated to account for the changes in assumptions and projections on fossil fuel prices, carbon prices, carbon emission factors, energy consumption, and the number of meters in both domestic and non-domestic sectors. In regard to non-domestic CBAs, both total costs and benefit estimates increased. This is mainly a result of changes in carbon and energy prices as well as the move of the present value base year. The move of the PV base year results in an increase in both costs and benefits, but with the benefit increase having a stronger impact. Updated planning and rollout profiles as well as cost uplift to early meters slightly counteract this effect. Updated planning and rollout profiles resulted in fewer meters expected to be in place by the end of 2014 than previously modeled, with some benefits and costs from smart meters occurring slightly later in time.
2.3. The Netherlands
The Netherlands has a population of 17 million people and an electricity consumption of 6.71 MWh per capita.10 Historically, the main sources of electricity in the Netherlands have been fossil fuels (e.g., natural gas and coal). More recently, renewable energy sources (e.g., wind energy and solar energy) generated an increasing share of electricity.11 Consumption increased an average of 4.5% per year over the six decades.12
8 The UK electricity system does not comprise DSOs; instead, it consists of 14 DNOs (Distribution System Network Operators). 9 Details of the roll-out can be seen here: https://www.smartenergygb.org/en/smart-future/about-the-rollout/the-stages-of-the-rollout 10 IEA, Electric power consumption (kWh per capita). http://www.iea.org/statistics/statisticssearch/ 11 IEA, Netherlands - Energy System Overview. https://www.iea.org/media/countries/Netherlands.pdf 12 CBS, National Energy Outlook 2016, available at: https://www.cbs.nl/-/.../45/national%20energy%20outlook%202016_summary.pdf
24
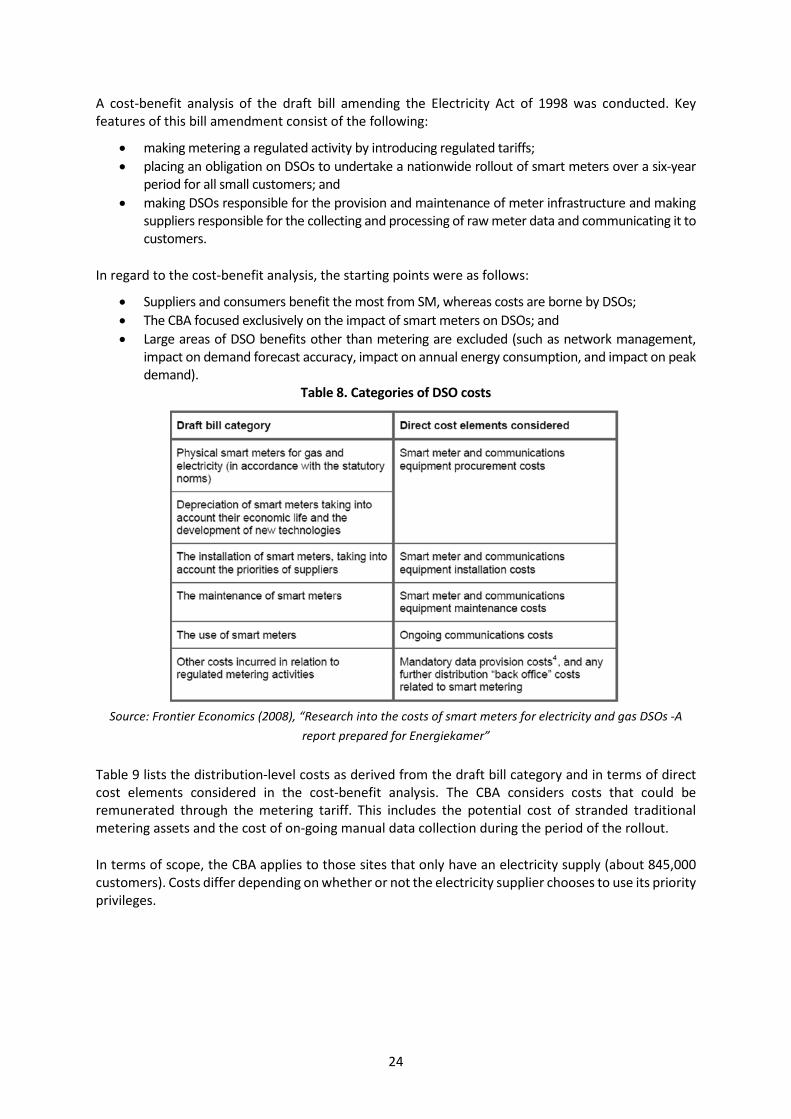
A cost-benefit analysis of the draft bill amending the Electricity Act of 1998 was conducted. Key features of this bill amendment consist of the following:
• making metering a regulated activity by introducing regulated tariffs; • placing an obligation on DSOs to undertake a nationwide rollout of smart meters over a six-year
period for all small customers; and • making DSOs responsible for the provision and maintenance of meter infrastructure and making
suppliers responsible for the collecting and processing of raw meter data and communicating it to customers.
In regard to the cost-benefit analysis, the starting points were as follows:
• Suppliers and consumers benefit the most from SM, whereas costs are borne by DSOs; • The CBA focused exclusively on the impact of smart meters on DSOs; and • Large areas of DSO benefits other than metering are excluded (such as network management,
impact on demand forecast accuracy, impact on annual energy consumption, and impact on peak demand).
Table 8. Categories of DSO costs
Source: Frontier Economics (2008), “Research into the costs of smart meters for electricity and gas DSOs -A report prepared for Energiekamer”
Table 9 lists the distribution-level costs as derived from the draft bill category and in terms of direct cost elements considered in the cost-benefit analysis. The CBA considers costs that could be remunerated through the metering tariff. This includes the potential cost of stranded traditional metering assets and the cost of on-going manual data collection during the period of the rollout.
In terms of scope, the CBA applies to those sites that only have an electricity supply (about 845,000 customers). Costs differ depending on whether or not the electricity supplier chooses to use its priority privileges.

25
Figure 6. Costs of smart meters (in € per meter, from international review)
Figure 6 shows site-specific and meter-specific costs in the Dutch cost-benefit analysis. The collection of input data on costs and benefits involved a review of published data sources as well as a bilateral discussion with Dutch market participants and meter manufacturers. Purchase costs, the installation of new meters, and GPRS communication costs are the highest costs.
Figure 7. DSO annual costs (in € per meter, from international review)
Figure 7 shows that DSOs are assumed to be able to save between EUR 4.40 and EUR 6.50 per meter per annum due to the combined impact of network management benefits and cost savings achieved as a result of the transfer of responsibility regarding data collection and validation.
The review of costs and benefits was used to generate a range for each element of costs and benefits. An economic model was developed to estimate the likely level of net cost relative to the tariffs. The model was used to assess the impacts of smart meter rollout on DSOs.
One of the most relevant features of this cost-benefit analysis is that direct feedback is not included as a category of benefits. It is instead assumed that bi-monthly readings are provided to end-users, with additional information on electricity consumption. In addition, several benefits in Recommendation 2012/148/EU are not included in the cost-benefit analysis. For instance, deferred investment, technical losses, CO2 emissions, and air pollution are not listed as benefits in the analysis. An additional benefit consists of increased competitiveness following smart metering installation. The benefit is accounted as an allowance associated with the ability for competitors to develop new market niches in a market with a full rollout of smart meters.
0 10 20 30 40 50 60 70 80 90
Purchase cost electricity meter
Maintanance cost
Data management cost
Communication costs-GPRS
Communication costs-PLC
Installation costs-separate
Installation costs-joint (new meters)
Maximum (€) Minimum (€)
0 1 2 3 4 5 6
Network Management benefits
Cost savings due to transfer ofresponsibility
Maximum (€) Minimum (€)
26
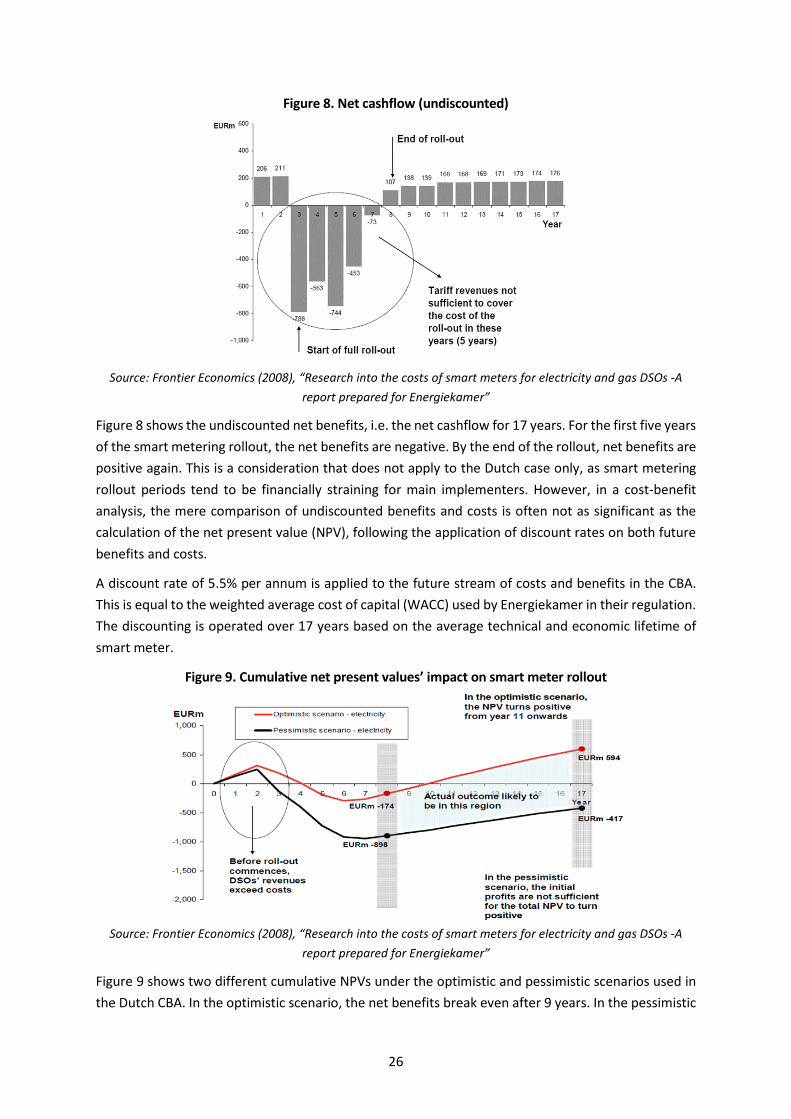
Figure 8. Net cashflow (undiscounted)
Source: Frontier Economics (2008), “Research into the costs of smart meters for electricity and gas DSOs -A report prepared for Energiekamer”
Figure 8 shows the undiscounted net benefits, i.e. the net cashflow for 17 years. For the first five years of the smart metering rollout, the net benefits are negative. By the end of the rollout, net benefits are positive again. This is a consideration that does not apply to the Dutch case only, as smart metering rollout periods tend to be financially straining for main implementers. However, in a cost-benefit analysis, the mere comparison of undiscounted benefits and costs is often not as significant as the calculation of the net present value (NPV), following the application of discount rates on both future benefits and costs.
A discount rate of 5.5% per annum is applied to the future stream of costs and benefits in the CBA. This is equal to the weighted average cost of capital (WACC) used by Energiekamer in their regulation. The discounting is operated over 17 years based on the average technical and economic lifetime of smart meter.
Figure 9. Cumulative net present values’ impact on smart meter rollout
Source: Frontier Economics (2008), “Research into the costs of smart meters for electricity and gas DSOs -A report prepared for Energiekamer”
Figure 9 shows two different cumulative NPVs under the optimistic and pessimistic scenarios used in the Dutch CBA. In the optimistic scenario, the net benefits break even after 9 years. In the pessimistic

27
scenario, the NPV remains negative for the entire duration of the assessment (i.e., 17 years). The figure can also be interpreted as the overall NPV for each year of the rollout as if the investment had been terminated in that specific year.
Figure 10. Sensitivity analysis of main categories of costs and benefits
Figure 10 shows the sensitivity analysis of main categories of costs and benefits. The sensitivity analysis emphasizes uncertainty about smart metering failure costs (higher failure rate than legacy meters). Similarly, the sensitivity analysis points to uncertainty especially about DSO communications costs (i.e. PLC vis-à-vis GPRS).
In the sensitivity analysis, a key item consists of competitiveness. Removing such item would trigger negative net benefits (i.e. -€19 per metering point, equivalent to -€127 million total).
2.4. Ireland
Ireland has a population of 5 million people and an electricity consumption of 5.81 MWh per capita.13 Overall Ireland is a net energy importer, which relies heavily on electricity imported through the interconnector with the UK.14 Electricity demand in Ireland has been decreasing since 2010, but in 2015 there was an increase by 2.9% in conjunction with economic growth. Ireland’s smart meter rollout involves about 2.2 million electricity consumers with an investment of up to €1 billion.
It is expected to yield a net benefit of around €229 million over 20 years.
13 IEA, Electric power consumption (kWh per capita), available at: http://www.iea.org/statistics/statisticssearch/ 14 SEAI (2015), Energy in Ireland 1990-2014, available at: http://www.seai.ie/resources/publications/Energy-in-Ireland-1990-2015.pdf
Smart meter failure costs
33%
Ongoing smart meters costs
32%
One-off costs 19%
Meter and communications purchase costs
16%
28
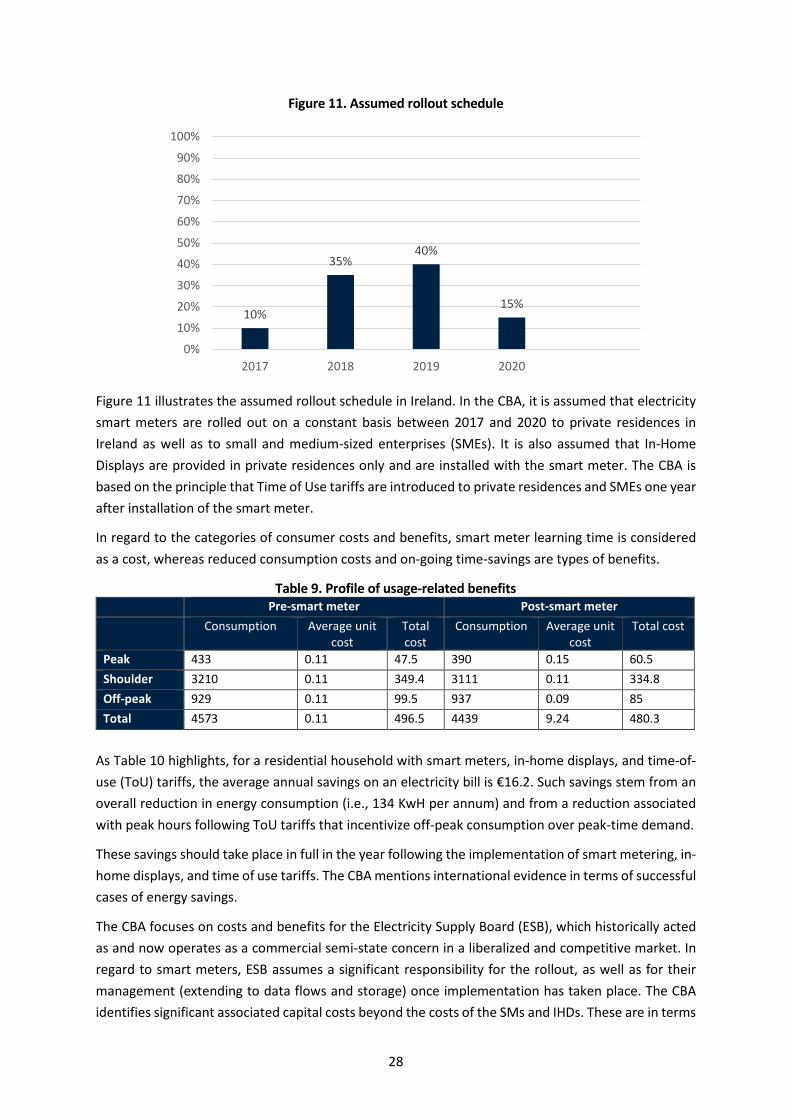
Figure 11. Assumed rollout schedule
Figure 11 illustrates the assumed rollout schedule in Ireland. In the CBA, it is assumed that electricity smart meters are rolled out on a constant basis between 2017 and 2020 to private residences in Ireland as well as to small and medium-sized enterprises (SMEs). It is also assumed that In-Home Displays are provided in private residences only and are installed with the smart meter. The CBA is based on the principle that Time of Use tariffs are introduced to private residences and SMEs one year after installation of the smart meter.
In regard to the categories of consumer costs and benefits, smart meter learning time is considered as a cost, whereas reduced consumption costs and on-going time-savings are types of benefits.
Table 9. Profile of usage-related benefits Pre-smart meter Post-smart meter
Consumption Average unit cost
Total cost
Consumption Average unit cost
Total cost
Peak 433 0.11 47.5 390 0.15 60.5 Shoulder 3210 0.11 349.4 3111 0.11 334.8 Off-peak 929 0.11 99.5 937 0.09 85 Total 4573 0.11 496.5 4439 9.24 480.3
As Table 10 highlights, for a residential household with smart meters, in-home displays, and time-of-use (ToU) tariffs, the average annual savings on an electricity bill is €16.2. Such savings stem from an overall reduction in energy consumption (i.e., 134 KwH per annum) and from a reduction associated with peak hours following ToU tariffs that incentivize off-peak consumption over peak-time demand.
These savings should take place in full in the year following the implementation of smart metering, in-home displays, and time of use tariffs. The CBA mentions international evidence in terms of successful cases of energy savings.
The CBA focuses on costs and benefits for the Electricity Supply Board (ESB), which historically acted as and now operates as a commercial semi-state concern in a liberalized and competitive market. In regard to smart meters, ESB assumes a significant responsibility for the rollout, as well as for their management (extending to data flows and storage) once implementation has taken place. The CBA identifies significant associated capital costs beyond the costs of the SMs and IHDs. These are in terms
10%
35%40%
15%
0%
10%
20%
30%
40%
50%
60%
70%
80%
90%
100%
2017 2018 2019 2020
29
of program management (i.e., the costs that ESB will incur for the management of the full national rollout of the program, including procurement); the head-end system (i.e., the software needed to ensure two-way communication between the smart meter and the ESBN meter data management system); meter data management system (i.e., the system needed for the storage, management, and distribution of consumption data from the smart meters); backend enhancement (i.e., the current system used by ESBN for meter management); deployment and materials management; investment in systems to ensure the effective management of the smart meter rollout program; and IT security (i.e., investment required in new applications to ensure that smart meter data are secure at all points of transit and processing). In addition, the CBA points to operating costs for ESBN associated with smart metering implementation, consisting of mobile operator charges (i.e., charges for on-going communication between smart meters and the meter data management system of the ESBN); telecom operation and maintenance (i.e., the costs associated with operating and maintaining the telecoms’ infrastructure required to support smart meter-to-meter data management system communications); head-end and meter data management system annual management and enhancement (i.e., the annual costs associated with the operation and maintenance of these systems, as well as their occasional enhancement); a network operations center (i.e., the costs of the team charged with ensuring that smart meter business processes are fit-for-purpose); data storage costs (i.e., the costs of storing the data from the smart meters as they are rolled out); the replacement of faulty meters (i.e., the costs associated with the replacement of faulty smart meters); and IHD-related costs (i.e., back-office and customer costs during the planning and rollout phases, communication costs during the two-year management period, and faulty IHD replacement).
The benefits for ESBN consist of the following: avoided manual meter roads; avoided costs of meter replacement; avoided costs of new connections, avoided costs of specialist pre-payment meters; avoided support costs for prepayment meters; avoided costs of microgeneration capability on traditional meters; avoided visits to traditional meters (e.g., disconnections or reconnections); avoided costs associated with investigation of voltage complaints; avoided costs of re-enforcing the network as a result of a reduction in peak demand and as a result of overall reduction in consumption; and avoided theft. Specifically, the demand-related benefits consist of €1.04 million for every 1% reduction in energy consumption and €0.73 million for every 1% reduction in peak energy consumption.
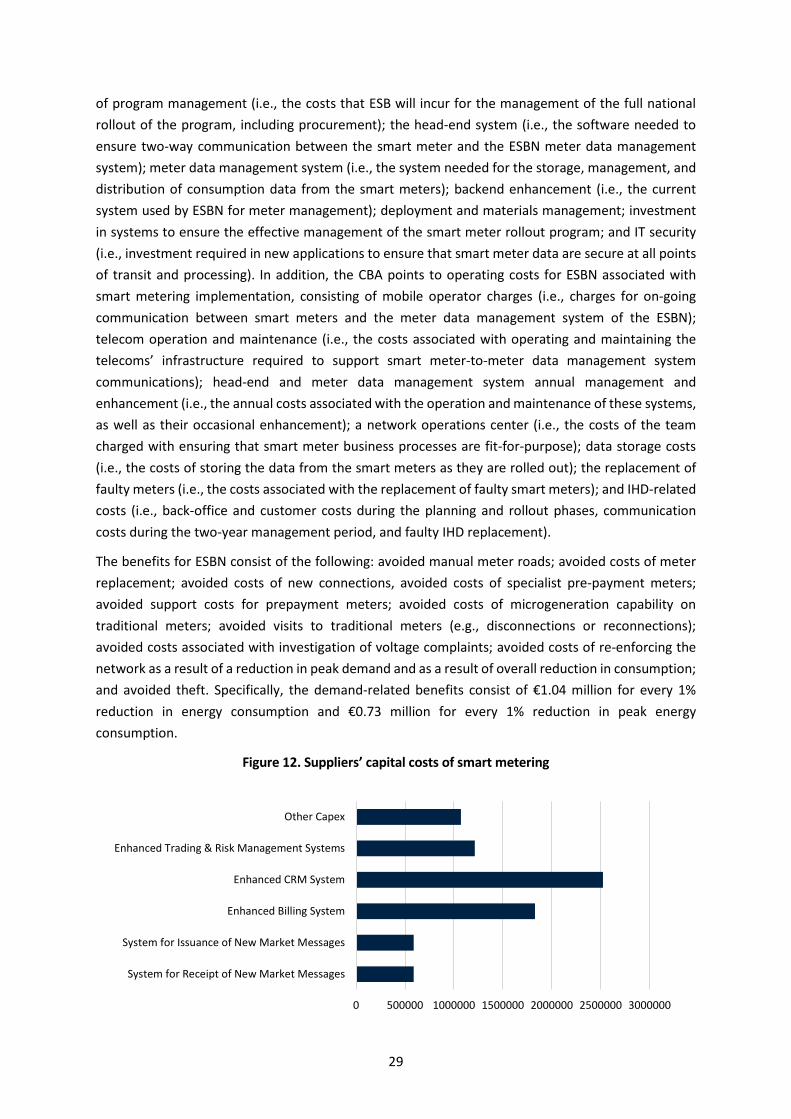
Figure 12. Suppliers’ capital costs of smart metering
0 500000 1000000 1500000 2000000 2500000 3000000
System for Receipt of New Market Messages
System for Issuance of New Market Messages
Enhanced Billing System
Enhanced CRM System
Enhanced Trading & Risk Management Systems
Other Capex

30
Figure 12 shows suppliers’ capital costs associated with smart metering. Enhancing the customer relationship management (CRM) system and the billing system represent the highest costs for suppliers. These estimates on capital costs are based on the fact that all suppliers were interviewed regarding the impacts of smart metering implementation on their financials. Only three suppliers provided comprehensive responses. In addition to the capital costs in Figure 12, OPEX cost categories consist of staff training, an IT OPEX, customer awareness raising, smart bill production and the printing of shadow statements, and additional communications costs.
In regard to suppliers’ benefits, the main categories consist of avoided ad hoc meter reads, bad debt reduction, and a reduction in dunning cycles.
Table 10. Electricity generation benefits and costs Type of change Benefit/cost Return on Investment residential capacity pot (in MW) 1,869 Average cost per MW € 78,730 Reduction in Peak Demand -9% Benefit deflation factor 32%
Table 11 shows the benefits and costs of changes brought about by smart meters in regard to electricity generation. Reductions in peak demand bring about cost saving due to avoided generation. The NPV of this benefit is €68 million.
Table 11. Benefits associated with lower system marginal prices Value of total, residential, ROI smart metering in 2011 €1,730,510,620
Percentage reduction achieved 0.40%
Table 12 shows the benefits associated with lower system marginal prices as a result of lower demand. This is caused by the assumption that a fall in residential demand brings about a fall in wholesale prices, which leads to lower system marginal prices.
Figure 13. NPVs for different stakeholders (in thousands of Euros)
-600000 -400000 -200000 0 200000 400000 600000
Residential consumers
Small Medium Enterprises
ESBN - Smart meter and In-Home Displays
ESBN - other Capex and Opex costs
ESBN - Benefits (avoided costs)
Suppliers
Generation
TOTAL
31
Figure 13 presents the full CBA findings with different NPVs for all stakeholders. ESBN and electricity suppliers face negative NPV values. The scale of the net cost in the case of networks is substantial and reflects, in large part, the assumed national use of a GPRS communications solution with a high attendant annual operating cost. In regard to consumers, residential households are associated with positive net present values in aggregate, while SMEs’ net present values are negative.
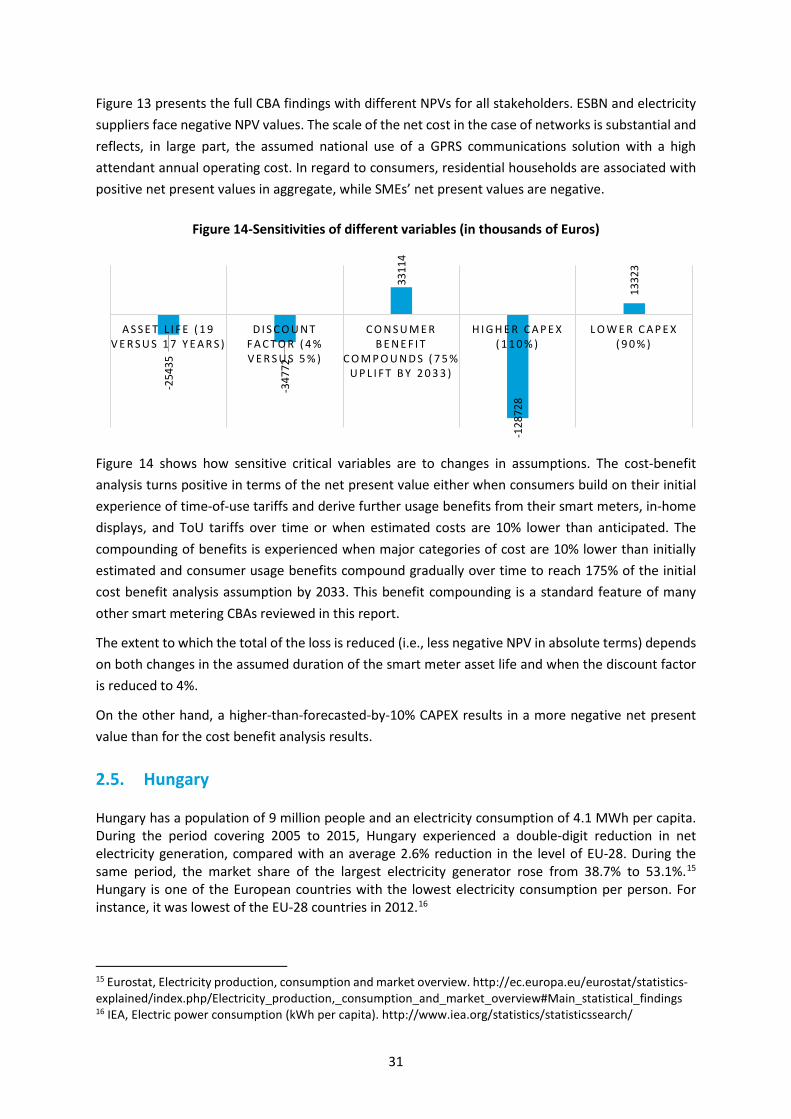
Figure 14-Sensitivities of different variables (in thousands of Euros)
Figure 14 shows how sensitive critical variables are to changes in assumptions. The cost-benefit analysis turns positive in terms of the net present value either when consumers build on their initial experience of time-of-use tariffs and derive further usage benefits from their smart meters, in-home displays, and ToU tariffs over time or when estimated costs are 10% lower than anticipated. The compounding of benefits is experienced when major categories of cost are 10% lower than initially estimated and consumer usage benefits compound gradually over time to reach 175% of the initial cost benefit analysis assumption by 2033. This benefit compounding is a standard feature of many other smart metering CBAs reviewed in this report.
The extent to which the total of the loss is reduced (i.e., less negative NPV in absolute terms) depends on both changes in the assumed duration of the smart meter asset life and when the discount factor is reduced to 4%.
On the other hand, a higher-than-forecasted-by-10% CAPEX results in a more negative net present value than for the cost benefit analysis results.
2.5. Hungary
Hungary has a population of 9 million people and an electricity consumption of 4.1 MWh per capita. During the period covering 2005 to 2015, Hungary experienced a double-digit reduction in net electricity generation, compared with an average 2.6% reduction in the level of EU-28. During the same period, the market share of the largest electricity generator rose from 38.7% to 53.1%.15 Hungary is one of the European countries with the lowest electricity consumption per person. For instance, it was lowest of the EU-28 countries in 2012.16
15 Eurostat, Electricity production, consumption and market overview. http://ec.europa.eu/eurostat/statistics-explained/index.php/Electricity_production,_consumption_and_market_overview#Main_statistical_findings 16 IEA, Electric power consumption (kWh per capita). http://www.iea.org/statistics/statisticssearch/
-254
35
-347
72
3311
4
-128
728
1332
3
A S S E T L I F E ( 1 9 V E R S U S 1 7 Y E A R S )
D I S C O U N T F A C T O R ( 4 % V E R S U S 5 % )
C O N S U M E R B E N E F I T
C O M P O U N D S ( 7 5 % U P L I F T B Y 2 0 3 3 )
H I G H E R C A P E X ( 1 1 0 % )
L O W E R C A P E X ( 9 0 % )

32
In the current legal framework, the DSOs are responsible for the installation and maintenance of the meters. The approach adopted in the Hungarian cost-benefit analysis is based on aggregate annual cost figures, with benefits estimated as proportional decreases from the revenue bases.
The rollout involves a DSO-based rollout of smart meters of 80% by 2021. The alternatives considered in the cost-benefit analysis involve (i) a joint rollout by all DSOs, in which the companies jointly develop the system that processes and stores the data provided by smart meters; and (ii) the transmission system operator taking over the functions of the smart meter operator.
As with other cost-benefit analyses, the demand management functions are not included as part of the benefits of the smart meter setup.
Table 12. Key assumptions in the Hungarian cost-benefit analysis Key assumption Value Discount rate 10.30% Asset life of meters 15 years Number of avoided meter readings 1 Reduction in consumption 1.50% Reduction in theft 50% Reduction in technical losses 1.50%
When estimating costs and benefits over time, a set of assumptions was considered. The number of manual meter readings saved per year is 1. The average billing cost per customer with smart meters is €0.50 per metering point per year. The customer care cost/customer/year baseline is €2 per metering point per year. Peak load transfer consists of 2%. The percentage of customers requesting incremental contracted power is 1%.
Figure 15. Cumulative penetration of smart meters and standard meters
Figure 15 shows the cumulative phasing-out of standard meters and increasing penetration figures for smart meters.
0
500000
1000000
1500000
2000000
2500000
3000000
3500000
4000000
4500000
2016
2017
2018
2019
2020
2021
2022
2023
2024
2025
2026
2027
2028
2029
2030
2031
2032
2033
2034
2035
Standard meters Smart meters

33
Figure 16. Benefits and costs in the Hungarian cost-benefit analysis (€ per metering point)
Figure 16 shows the overall findings of the Hungarian cost-benefit analysis. The net benefits are -78.20 Euros per metering point.
The most optimistic scenario comprises a 10% reduction in network losses; a 75% reduction in customer switchover costs; a 16% decrease in balancing power demand; and a 6% decrease in wholesale prices, relating to a 2% reduction in end-user prices due to more intense competition.
2.6. France
France has a population of 67 million people and an electricity consumption of 7.04 MWh per capita.17 Electricity is predominantly generated by nuclear power, which in 2016 accounted for about three quarters of the total generation.18 France has 35 million electricity meters in place and ambitious goals for the development of renewable energies and energy efficiency, together with a commitment to reduce the share of nuclear energy in the power mix. Electricity demand in France greatly depends on seasonality and is temperature-sensitivity.
Distribution system operators are legally responsible for all operations related to metering, including installation, maintenance, and meter readings. Before smart metering implementation, meters were manually read twice a year.
The Regulatory Commission of Energy conducted the first cost-benefit analysis in 2007. Successively, a large pilot study was conducted. The pilot study consisted of a 2-year project with 300,000 customers in two regions19. In regard to costs, the pilot project points to 60% from installation, 30% from purchase, and 10% from other. From the pilot, it was estimated that a national rollout would cost approx. €4.3 billion. With regards to the distribution of benefits, it was estimated that 55% of benefits would consist of reductions of non-technical losses; 40% would consists of performance of interventions; and 5% would consist of better asset management and network operation. Following
17 IEA, Electric power consumption (kWh per capita). http://www.iea.org/statistics/statisticssearch/ 18 RTE, Production nationale annuelle par filière (2012 à 2016) https://opendata.rte-france.com/explore/dataset/prod_par_filiere/table/?sort=-annee 19 Some of the key figures of the pilot project are as follows: 250,000 meters were replaced; 92% of the meters communicate; and less than 1% claims.
-100 -50 0 50 100 150 200 250 300
Average cost of smart metersAverage cost of IT
Average cost of communicationsAverage cost of In-home displays
Average cost of customer engagement…Sunk costs
Other costsTOTAL costs
Reduction in meter reading and operationsReduction in technical losses
Reduction in commercial lossesElectricity cost savings
Increase in competitiveness (retail price)Generation efficiency (wholesale price)
TOTAL benefitsBENEFITS - COSTS
Cost
sBe
nefit
s
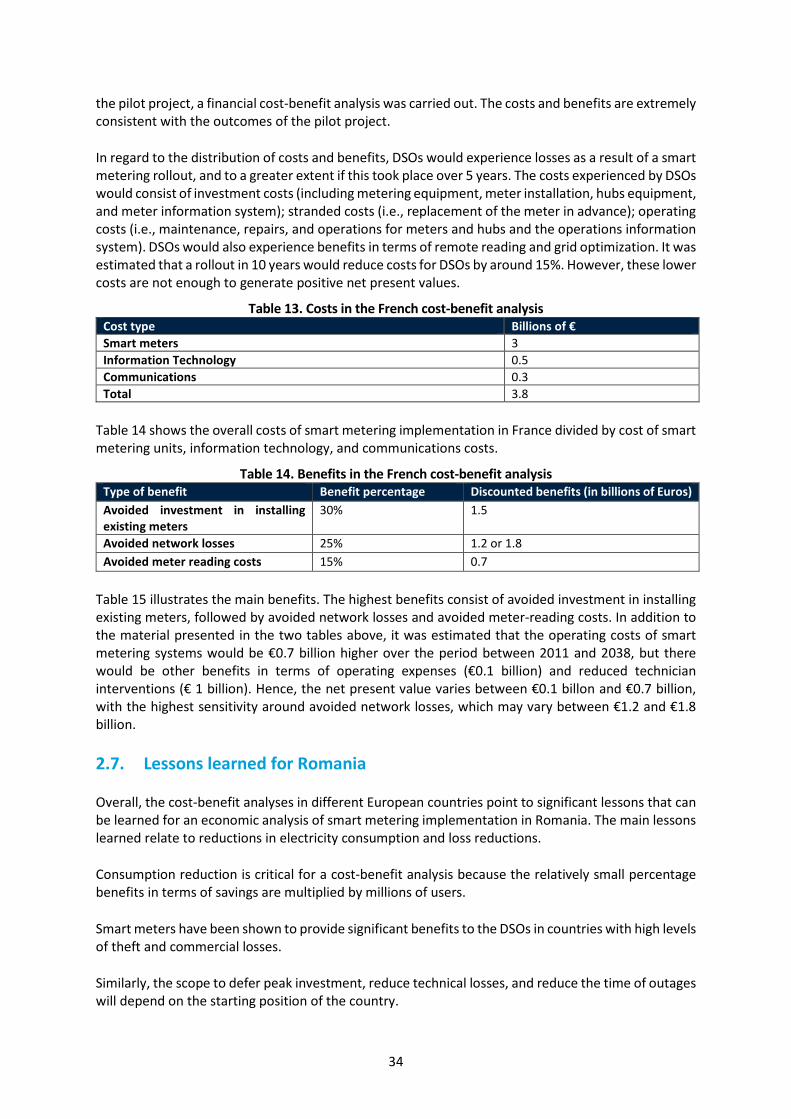
34
the pilot project, a financial cost-benefit analysis was carried out. The costs and benefits are extremely consistent with the outcomes of the pilot project.
In regard to the distribution of costs and benefits, DSOs would experience losses as a result of a smart metering rollout, and to a greater extent if this took place over 5 years. The costs experienced by DSOs would consist of investment costs (including metering equipment, meter installation, hubs equipment, and meter information system); stranded costs (i.e., replacement of the meter in advance); operating costs (i.e., maintenance, repairs, and operations for meters and hubs and the operations information system). DSOs would also experience benefits in terms of remote reading and grid optimization. It was estimated that a rollout in 10 years would reduce costs for DSOs by around 15%. However, these lower costs are not enough to generate positive net present values.
Table 13. Costs in the French cost-benefit analysis Cost type Billions of € Smart meters 3 Information Technology 0.5 Communications 0.3 Total 3.8
Table 14 shows the overall costs of smart metering implementation in France divided by cost of smart metering units, information technology, and communications costs.
Table 14. Benefits in the French cost-benefit analysis Type of benefit Benefit percentage Discounted benefits (in billions of Euros) Avoided investment in installing existing meters
30% 1.5
Avoided network losses 25% 1.2 or 1.8 Avoided meter reading costs 15% 0.7
Table 15 illustrates the main benefits. The highest benefits consist of avoided investment in installing existing meters, followed by avoided network losses and avoided meter-reading costs. In addition to the material presented in the two tables above, it was estimated that the operating costs of smart metering systems would be €0.7 billion higher over the period between 2011 and 2038, but there would be other benefits in terms of operating expenses (€0.1 billion) and reduced technician interventions (€ 1 billion). Hence, the net present value varies between €0.1 billon and €0.7 billion, with the highest sensitivity around avoided network losses, which may vary between €1.2 and €1.8 billion.
2.7. Lessons learned for Romania
Overall, the cost-benefit analyses in different European countries point to significant lessons that can be learned for an economic analysis of smart metering implementation in Romania. The main lessons learned relate to reductions in electricity consumption and loss reductions.
Consumption reduction is critical for a cost-benefit analysis because the relatively small percentage benefits in terms of savings are multiplied by millions of users.
Smart meters have been shown to provide significant benefits to the DSOs in countries with high levels of theft and commercial losses.
Similarly, the scope to defer peak investment, reduce technical losses, and reduce the time of outages will depend on the starting position of the country.

35
Figure 17. Costs in cost-benefit analyses of smart metering implementation
(in Euros per meter, discounted)
Figure 17 illustrates the discounted costs for the European countries reviewed in this section of the report. The final cost of smart meters includes installation. Different labor costs in each country will affect this unit of cost. For instance, the case of Italy and Spain—i.e., two countries that purchased high quantities of smart meters—seems to suggest that the costs of the meters in tenders are closer to the values provided by the Romanian AT Kearney study. A high variation in the units of costs in Figure 17 is due to IT and communications costs. There are no standard criteria for their cost allocation. In this regard, the graph below shows that the total cost of these two items is generally in a range between €50 and €100. In Germany, the cost for the entire system is estimated at over €233 per metering point. The most expensive communications technology (GPRS) is adopted in Germany. On the other hand, the cheapest communications technology (PLC) is principally applied in the countries with lowest report costs, including Romania and Hungary. About 93% of the costs are associated with communications, IT, and meters. Overall, the total discounted costs for UK, Germany, Netherlands, Ireland and Hungary are, respectively, €281.65, €492.12, €240.28, €260.49, and €242.42. These compare significantly high with the Romanian estimate of costs (€97.73) from the AT Kearney study.
Figure 18. Benefits in cost-benefit analyses on smart metering implementation
(in Euros per meter, discounted)
0
200
400
600
UK Germany Netherlands Ireland Hungary Romania
Reduction in meter reading and operation Reduction in O&M costs
Deferred distribution capacity investments Deferred transmission capacity investments
Deferred generation capacity investments Reduction in technical losses
Electricity cost savings Reductions in commmunication losses
Reduction of outage times Reduction of CO2 emissions
Reduction of pollution Avoided investment in standard meters
Competitiveness
0
100
200
300
400
500
600
UK Germany Netherlands Ireland Hungary Romania
Smart meters Information Technology Communications In-home display
Generation Transmission Distribution Training costs
Customer care Sunk costs Security

36
Figure 18 illustrates the discounted benefits per meter as estimated in the cost-benefit analyses reviewed in this section of the report. Reductions in meter reading operations vary from €14.5 (in Hungary) to €145.8 (in the UK). The discrepancies between reduction meter reading costs can be connected to divergent regulatory and operational arrangements with regard to the billing cycle and differences in labor costs (as explained above about installation costs). Reductions in technical losses of electricity are high only for the UK and Romania. Reductions in communication losses are significantly higher (€43.6) in the AT Kearney study for Romania than in any other country, with Hungary the second highest at €19.6. Overall, the total discounted costs for UK, Germany, Netherlands, Ireland and Hungary are, respectively, €308.9, €484.9, €287.3, €187.7, €164.6, and €129.4.

37
3. COSTS OF SMART METERS IN ROMANIA
Any assessment on the costs of smart metering in Romania will need to be based on up-to-date information about the market costs of the technologies involved, including the physical meters and ICT software and hardware. This section presents available data from the distribution system operators as part of the 2015-2016 pilot studies on smart metering implementation. It discusses issues with smart metering cost data that should be taken into account when carrying out a full cost-benefit analysis on smart metering implementation in Romania. It offers solutions to the issues with smart metering cost data, specifically in regard to capping the smart metering market price and depreciating smart meter costs. Hence, this section does not consist of a cost appraisal per se. Rather, it sets out the available data to date and provides advice on issues that should be considered when carrying out a cost-benefit analysis of smart meters in Romania.
3.1. Data from DSOs’ 2015-2016 pilot studies
The most up-to-date data on costs of smart meters derives from the 2015 and 2016 pilot projects. Specifically, non-sensitive commercial information is summarized in ANRE’s Annual Report for 2016 published in June 2017.
Based on the initial order for the pilots (Order 145/2014, amended), ANRE implemented smart meter pilot projects in 2015 and 2016, which covered a variety of areas and customer types. For instance, the pilots covered residential and non-residential users connected to distribution grids; new, newly upgraded, as well as old networks; and rural and urban areas. Throughout 2015 and 2016, ANRE prepared 5 internal reports on the actual implementation of the smart metering pilots in an attempt to assess the viability of smart meters in Romania and to gauge the investment needs for the full (80%) rollout, originally planned for 2017-2020.
To prepare for the rollout, in February 2016 (Order 6/2016), ANRE set out to collect information on a full data set from pilots in both new and upgraded networks in urban and rural areas (2015 pilots) and non-upgraded networks in urban and rural areas (2016 pilots). Based on the 2016 pilots in non-upgraded network areas, by 2017, ANRE should have had an assessment of the needs for investments in non-upgraded networks to integrate smart meters to ensure that the implementation of smart meters is feasible independent of the status of networks. However, the information collected was not finalized in a cost-benefit analysis in 2017 (as previously planned). Instead, ANRE updated the AT Kearney study based on the pilot data. This was never realized in full because of major data gaps, particularly on benefits, and substantial differences on costs across operators resulting from the pilot data. By early 2017, ANRE had collected plans for a rollout from operators, with the intention to prepare the rollout calendar in spring 2017, despite the missing data for the CBA. The pilots indicate that smart meters can also be implemented in areas with old and non-upgraded networks.
Figure 19 shows the variability of cost estimates from the pilots in terms of the average unit cost per consumer and compares these with the initial assessment of costs in the AT Kearney cost benefit analysis. Overall, the average cost per consumer varied significantly from the initial cost appraisal in the AT Kearney study. Actual costs in the 2015 pilots were 587 RON per consumer, and they were 280 RON per consumer in the 2016 pilots. The 3 DSOs that incurred the highest costs in the 2015 pilots (i.e., Transilvania Sud, 919 RON; Distributie Oltenia, 784 RON; and Muntenia Nord, 668 RON) chose not to participate in the 2016 pilots. Thus, the substantial reduction in total average costs of 52% is somewhat misleading. For DSOs participating in both the 2015 and 2016 pilots, the cost reduction ranged from 16-49%, as shown in Table 16. The initial costs per consumer in the pilot projects, which were submitted to ANRE for approval in 2016, were 434 RON. Initially, the AT Kearney study had

38
estimated the unit cost per consumer at 455 RON. The discrepancies are also due to differences across operators, as shown in Table 14.
Figure 19. Average unit cost per consumer (RON)
Figure 20 shows a comparison of the breakdown of costs per meter between the findings of the pilot studies and the previous cost-benefit analysis. Overall, the cost estimates of smart meter units decreased and so did the communications costs.
Figure 20. Breakdown of costs per meter
Table 16 shows the summary of costs from the 2015-2016 pilot studies. As mentioned above, CEZ (Distributie Energie Oltenia) and former state-owned Electrica subsidiaries (Transilvania Sud, Muntenia Nord) encountered difficulties in implementing pilot projects in 2015 and did not implement pilots in 2016. In 2015, their unit cost for smart meters was between 2 and 2.5 times higher than for the other operators, which may have been caused by differences in economies of scale and in prior experience with the implementation of smart metering.
Table 15. Summary of costs from pilots in 2015-2016
0
10
20
30
40
50
60
70
80
90
Smart meters Single-phase Two-phase Three-phase InformationTechnology
Communications
Data from pilots (EUR/meter) Data from AT Kearney (EUR/meter)
455
587
434
280
0 100 200 300 400 500 600 700
AT Kearney
Pilot 2015 actual
Pilot 2016 planned
Pilot 2016 actual
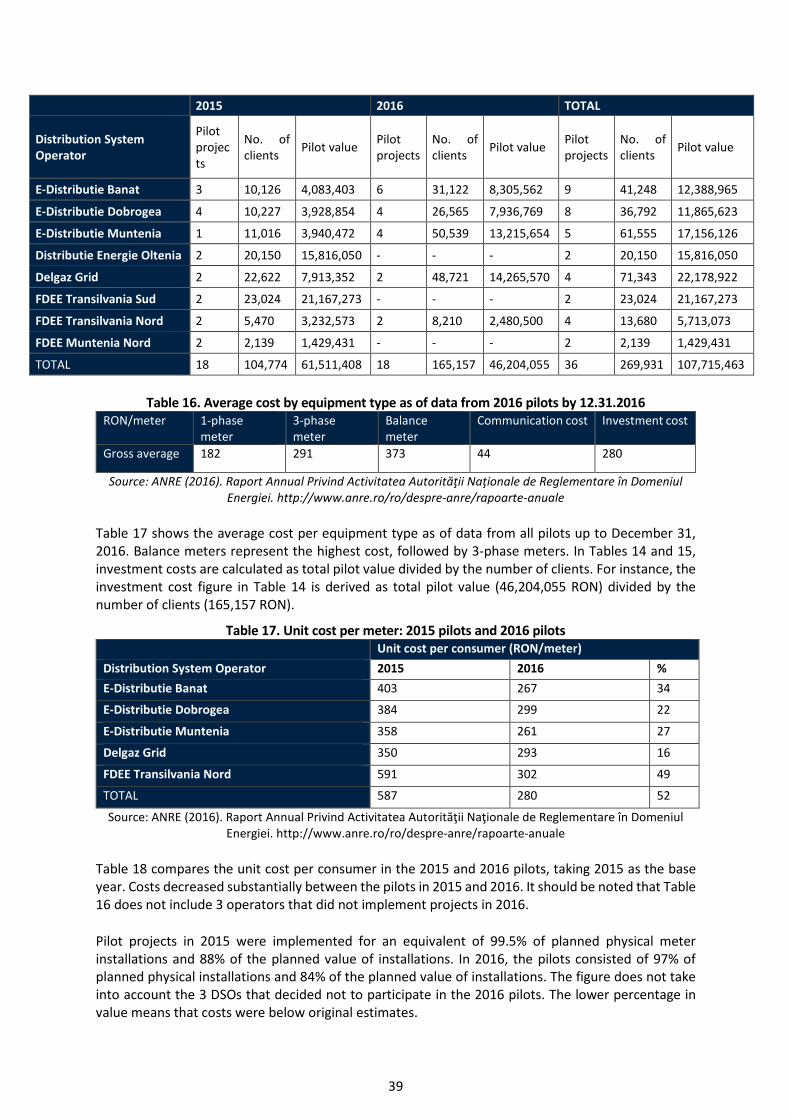
39
2015 2016 TOTAL
Distribution System Operator
Pilot projects
No. of clients Pilot value Pilot
projects No. of clients Pilot value Pilot
projects No. of clients Pilot value
E-Distributie Banat 3 10,126 4,083,403 6 31,122 8,305,562 9 41,248 12,388,965
E-Distributie Dobrogea 4 10,227 3,928,854 4 26,565 7,936,769 8 36,792 11,865,623
E-Distributie Muntenia 1 11,016 3,940,472 4 50,539 13,215,654 5 61,555 17,156,126
Distributie Energie Oltenia 2 20,150 15,816,050 - - - 2 20,150 15,816,050
Delgaz Grid 2 22,622 7,913,352 2 48,721 14,265,570 4 71,343 22,178,922
FDEE Transilvania Sud 2 23,024 21,167,273 - - - 2 23,024 21,167,273
FDEE Transilvania Nord 2 5,470 3,232,573 2 8,210 2,480,500 4 13,680 5,713,073
FDEE Muntenia Nord 2 2,139 1,429,431 - - - 2 2,139 1,429,431
TOTAL 18 104,774 61,511,408 18 165,157 46,204,055 36 269,931 107,715,463
Table 16. Average cost by equipment type as of data from 2016 pilots by 12.31.2016 RON/meter 1-phase
meter 3-phase meter
Balance meter
Communication cost Investment cost
Gross average 182 291 373 44 280
Source: ANRE (2016). Raport Annual Privind Activitatea Autorităţii Naţionale de Reglementare în Domeniul Energiei. http://www.anre.ro/ro/despre-anre/rapoarte-anuale
Table 17 shows the average cost per equipment type as of data from all pilots up to December 31, 2016. Balance meters represent the highest cost, followed by 3-phase meters. In Tables 14 and 15, investment costs are calculated as total pilot value divided by the number of clients. For instance, the investment cost figure in Table 14 is derived as total pilot value (46,204,055 RON) divided by the number of clients (165,157 RON).
Table 17. Unit cost per meter: 2015 pilots and 2016 pilots Unit cost per consumer (RON/meter) Distribution System Operator 2015 2016 % E-Distributie Banat 403 267 34
E-Distributie Dobrogea 384 299 22
E-Distributie Muntenia 358 261 27
Delgaz Grid 350 293 16
FDEE Transilvania Nord 591 302 49
TOTAL 587 280 52
Source: ANRE (2016). Raport Annual Privind Activitatea Autorităţii Naţionale de Reglementare în Domeniul Energiei. http://www.anre.ro/ro/despre-anre/rapoarte-anuale
Table 18 compares the unit cost per consumer in the 2015 and 2016 pilots, taking 2015 as the base year. Costs decreased substantially between the pilots in 2015 and 2016. It should be noted that Table 16 does not include 3 operators that did not implement projects in 2016.
Pilot projects in 2015 were implemented for an equivalent of 99.5% of planned physical meter installations and 88% of the planned value of installations. In 2016, the pilots consisted of 97% of planned physical installations and 84% of the planned value of installations. The figure does not take into account the 3 DSOs that decided not to participate in the 2016 pilots. The lower percentage in value means that costs were below original estimates.

40
The pilots collected data for the following typologies of costs:
• The unit cost of the investment = The investment total value, including the distribution network operations including electricity/Total number of end-customers managed throughout the project;
• The unit cost of the investment needed for the single-phase meter purchase = The investment for the single-phase meter purchase/Number of single-phase meters installed for the customers of the project;
• The unit cost of the investment needed for the three-phase meter purchase = The investment for the three-phase meter purchase/Number of three-phase meters installed for the customers of the project;
• The unit cost of the investment for the system purchase and installation (without the meters) = The value of the investment for the system purchase/Total number of end-customers managed through the project;
• The unit cost of the investment for the purchase and installation of the information management meter subsystems (server/s, modems, database management system application, other auxiliaries);
• The unit cost of the investment for the purchase and installation of subsystems transmitting information (concentrators, signal repeaters, controllers); and
• The unit cost of the investment for the works involving elements of the electricity network (without the meters) = The investment value needed to ensure smart metering operation, involving elements of the electricity distribution network/Total number of end-customers managed throughout the project.
The remainder of this section presents the main findings of the 2015 pilots on the costs of smart metering installation.
Figure 21 illustrates the unit investment costs for the implemented pilot projects. There are substantial differences between the minimum investment unit costs of 350 RON per customer and the maximum, which is 1,233 RON per customer. This means that the maximum in investment unit cost is 250% higher than the minimum. The 18 pilot projects are grouped into 5 technical solutions (DSOs and equipment types) as follows:
• ENEL: ENEL Muntenia, ENEL Banat, ENEL Dobrogea, E.ON Distribuție Romania • AEM: CEZ Distribuție, FDEE Transilvania Nord 2, Transilvania Sud 1 • NES: FDEE Muntenia Nord 2, FDEE Transilvania Nord 1 • ELECTROMAGNETICA: FDEE Muntenia Nord 1 • ELSTER: FDEE Transilvania Sud 2
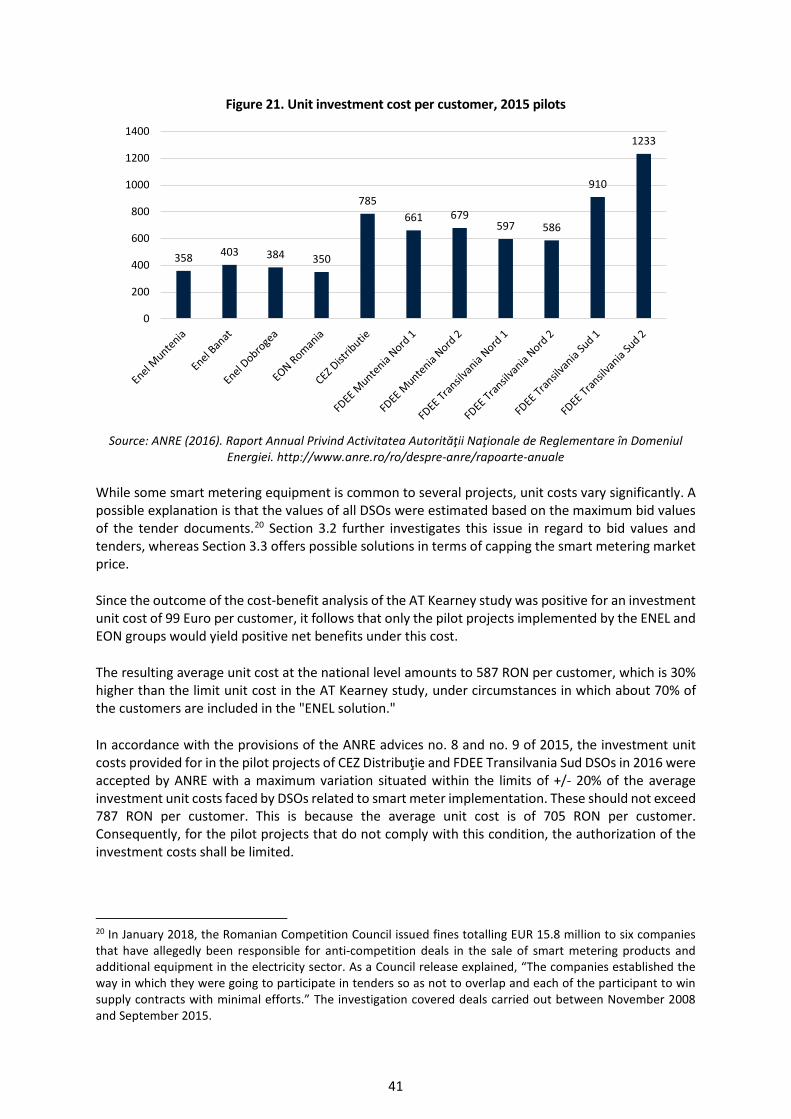
41
Figure 21. Unit investment cost per customer, 2015 pilots
Source: ANRE (2016). Raport Annual Privind Activitatea Autorităţii Naţionale de Reglementare în Domeniul Energiei. http://www.anre.ro/ro/despre-anre/rapoarte-anuale
While some smart metering equipment is common to several projects, unit costs vary significantly. A possible explanation is that the values of all DSOs were estimated based on the maximum bid values of the tender documents.20 Section 3.2 further investigates this issue in regard to bid values and tenders, whereas Section 3.3 offers possible solutions in terms of capping the smart metering market price.
Since the outcome of the cost-benefit analysis of the AT Kearney study was positive for an investment unit cost of 99 Euro per customer, it follows that only the pilot projects implemented by the ENEL and EON groups would yield positive net benefits under this cost.
The resulting average unit cost at the national level amounts to 587 RON per customer, which is 30% higher than the limit unit cost in the AT Kearney study, under circumstances in which about 70% of the customers are included in the "ENEL solution."
In accordance with the provisions of the ANRE advices no. 8 and no. 9 of 2015, the investment unit costs provided for in the pilot projects of CEZ Distribuţie and FDEE Transilvania Sud DSOs in 2016 were accepted by ANRE with a maximum variation situated within the limits of +/- 20% of the average investment unit costs faced by DSOs related to smart meter implementation. These should not exceed 787 RON per customer. This is because the average unit cost is of 705 RON per customer. Consequently, for the pilot projects that do not comply with this condition, the authorization of the investment costs shall be limited.
20 In January 2018, the Romanian Competition Council issued fines totalling EUR 15.8 million to six companies that have allegedly been responsible for anti-competition deals in the sale of smart metering products and additional equipment in the electricity sector. As a Council release explained, “The companies established the way in which they were going to participate in tenders so as not to overlap and each of the participant to win supply contracts with minimal efforts.” The investigation covered deals carried out between November 2008 and September 2015.
358 403 384 350
785661 679
597 586
910
1233
0
200
400
600
800
1000
1200
1400

42
Figure 22 shows the investment for per meter of single-phase meters. These vary between 166 RON per meter to 753 RON per meter. A single-phase supply is smaller than other meters and cannot use as much power. A typical house will need a single-phase supply.
Figure 22. Investment costs for the purchase of single-phase smart meters in 2015 pilots
Figure 23 shows the investment costs for the purchase of three-phase smart meters, which vary from 277 RON per meter and 1947 RON per meter. Three-phase meters are larger and can use more power than other meters. For example, a larger house, flats, or a commercial building needs three-phase meters.
Figure 23. Investment cost for the purchase of three-phase smart meters
Figure 24 shows the investment costs of balance meters. Balance meters combine distribution level information with energy demand and allow grid operators to better plan the integration of renewable energy into the grid and to balance their networks. Hence, balance meters provide the possibility for consumers who produce their own energy to respond to prices and sell excess to the grid. Overall, the pilot studies point to very significant differences between the investment costs for the purchase of meters. These costs do not include the man-power value. Substantial cost differences exist for the same supplier in different pilot projects.
166 166 166 168
420
279
426321
380437
753
0100200300400500600700800
277 277 277 279
821
1350
537 399
1161949
1947
0
500
1000
1500
2000
2500
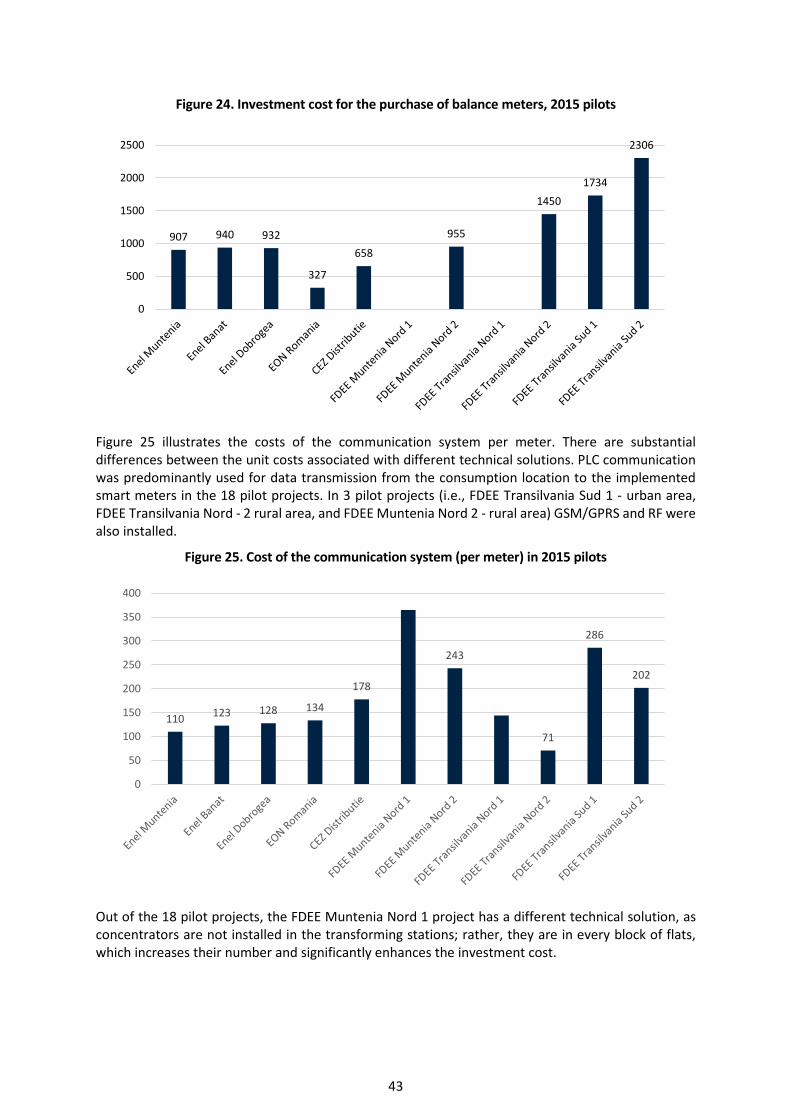
43
Figure 24. Investment cost for the purchase of balance meters, 2015 pilots
Figure 25 illustrates the costs of the communication system per meter. There are substantial differences between the unit costs associated with different technical solutions. PLC communication was predominantly used for data transmission from the consumption location to the implemented smart meters in the 18 pilot projects. In 3 pilot projects (i.e., FDEE Transilvania Sud 1 - urban area, FDEE Transilvania Nord - 2 rural area, and FDEE Muntenia Nord 2 - rural area) GSM/GPRS and RF were also installed.
Figure 25. Cost of the communication system (per meter) in 2015 pilots
Out of the 18 pilot projects, the FDEE Muntenia Nord 1 project has a different technical solution, as concentrators are not installed in the transforming stations; rather, they are in every block of flats, which increases their number and significantly enhances the investment cost.
907 940 932
327
658
955
14501734
2306
0
500
1000
1500
2000
2500
110 123 128 134
178
243
71
286
202
0
50
100
150
200
250
300
350
400
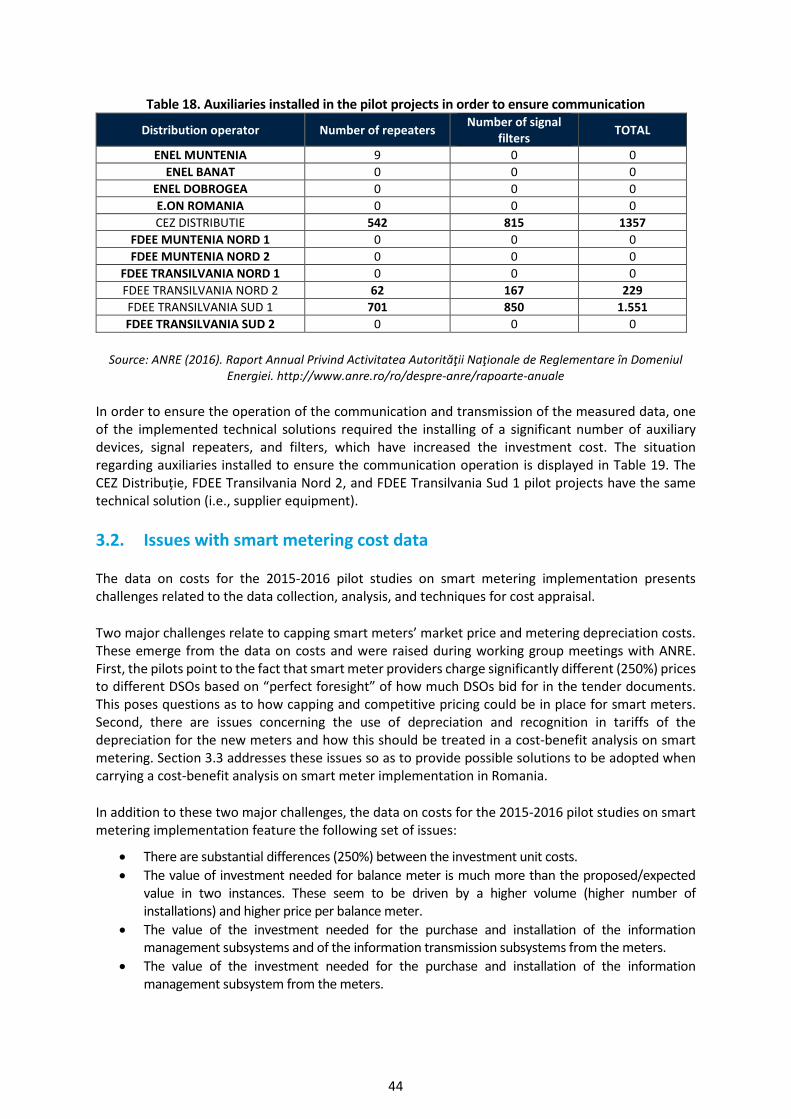
44
Table 18. Auxiliaries installed in the pilot projects in order to ensure communication
Distribution operator Number of repeaters Number of signal filters TOTAL
ENEL MUNTENIA 9 0 0 ENEL BANAT 0 0 0
ENEL DOBROGEA 0 0 0 E.ON ROMANIA 0 0 0 CEZ DISTRIBUTIE 542 815 1357
FDEE MUNTENIA NORD 1 0 0 0 FDEE MUNTENIA NORD 2 0 0 0
FDEE TRANSILVANIA NORD 1 0 0 0 FDEE TRANSILVANIA NORD 2 62 167 229 FDEE TRANSILVANIA SUD 1 701 850 1.551 FDEE TRANSILVANIA SUD 2 0 0 0
Source: ANRE (2016). Raport Annual Privind Activitatea Autorităţii Naţionale de Reglementare în Domeniul Energiei. http://www.anre.ro/ro/despre-anre/rapoarte-anuale
In order to ensure the operation of the communication and transmission of the measured data, one of the implemented technical solutions required the installing of a significant number of auxiliary devices, signal repeaters, and filters, which have increased the investment cost. The situation regarding auxiliaries installed to ensure the communication operation is displayed in Table 19. The CEZ Distribuție, FDEE Transilvania Nord 2, and FDEE Transilvania Sud 1 pilot projects have the same technical solution (i.e., supplier equipment).
3.2. Issues with smart metering cost data
The data on costs for the 2015-2016 pilot studies on smart metering implementation presents challenges related to the data collection, analysis, and techniques for cost appraisal.
Two major challenges relate to capping smart meters’ market price and metering depreciation costs. These emerge from the data on costs and were raised during working group meetings with ANRE. First, the pilots point to the fact that smart meter providers charge significantly different (250%) prices to different DSOs based on “perfect foresight” of how much DSOs bid for in the tender documents. This poses questions as to how capping and competitive pricing could be in place for smart meters. Second, there are issues concerning the use of depreciation and recognition in tariffs of the depreciation for the new meters and how this should be treated in a cost-benefit analysis on smart metering. Section 3.3 addresses these issues so as to provide possible solutions to be adopted when carrying a cost-benefit analysis on smart meter implementation in Romania.
In addition to these two major challenges, the data on costs for the 2015-2016 pilot studies on smart metering implementation feature the following set of issues:
• There are substantial differences (250%) between the investment unit costs. • The value of investment needed for balance meter is much more than the proposed/expected
value in two instances. These seem to be driven by a higher volume (higher number of installations) and higher price per balance meter.
• The value of the investment needed for the purchase and installation of the information management subsystems and of the information transmission subsystems from the meters.
• The value of the investment needed for the purchase and installation of the information management subsystem from the meters.
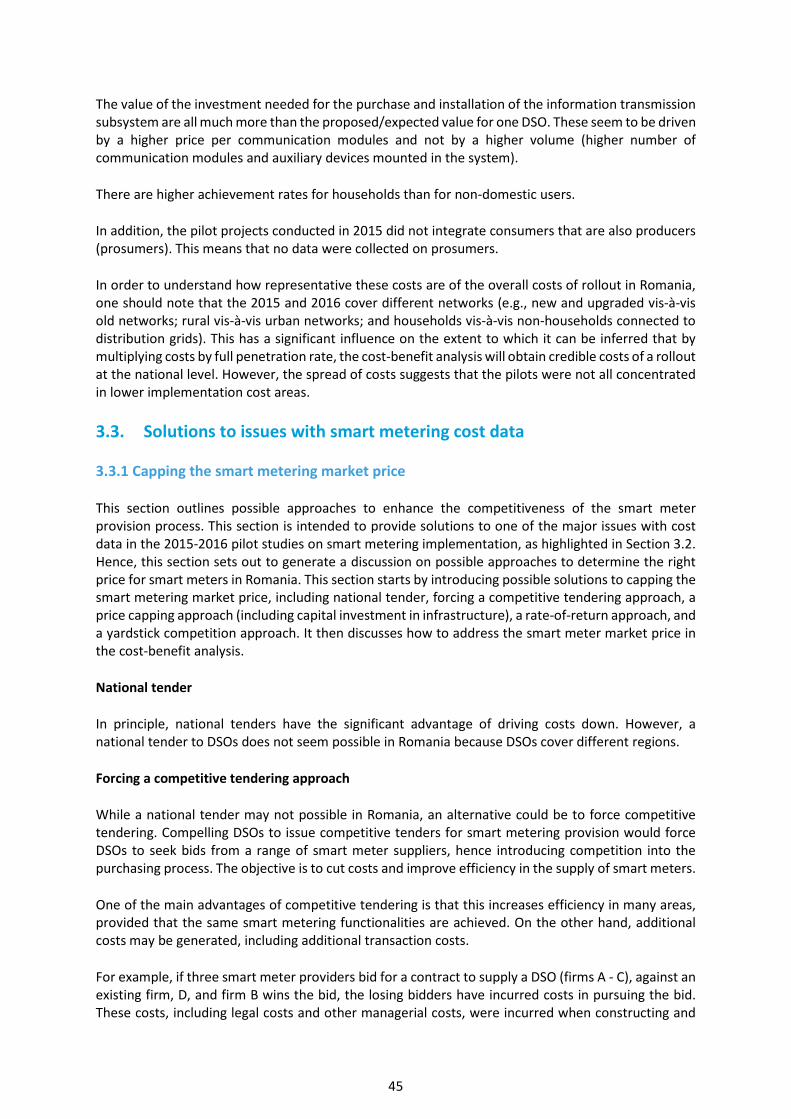
45
The value of the investment needed for the purchase and installation of the information transmission subsystem are all much more than the proposed/expected value for one DSO. These seem to be driven by a higher price per communication modules and not by a higher volume (higher number of communication modules and auxiliary devices mounted in the system).
There are higher achievement rates for households than for non-domestic users.
In addition, the pilot projects conducted in 2015 did not integrate consumers that are also producers (prosumers). This means that no data were collected on prosumers.
In order to understand how representative these costs are of the overall costs of rollout in Romania, one should note that the 2015 and 2016 cover different networks (e.g., new and upgraded vis-à-vis old networks; rural vis-à-vis urban networks; and households vis-à-vis non-households connected to distribution grids). This has a significant influence on the extent to which it can be inferred that by multiplying costs by full penetration rate, the cost-benefit analysis will obtain credible costs of a rollout at the national level. However, the spread of costs suggests that the pilots were not all concentrated in lower implementation cost areas.
3.3. Solutions to issues with smart metering cost data
3.3.1 Capping the smart metering market price
This section outlines possible approaches to enhance the competitiveness of the smart meter provision process. This section is intended to provide solutions to one of the major issues with cost data in the 2015-2016 pilot studies on smart metering implementation, as highlighted in Section 3.2. Hence, this section sets out to generate a discussion on possible approaches to determine the right price for smart meters in Romania. This section starts by introducing possible solutions to capping the smart metering market price, including national tender, forcing a competitive tendering approach, a price capping approach (including capital investment in infrastructure), a rate-of-return approach, and a yardstick competition approach. It then discusses how to address the smart meter market price in the cost-benefit analysis.
National tender
In principle, national tenders have the significant advantage of driving costs down. However, a national tender to DSOs does not seem possible in Romania because DSOs cover different regions.
Forcing a competitive tendering approach
While a national tender may not possible in Romania, an alternative could be to force competitive tendering. Compelling DSOs to issue competitive tenders for smart metering provision would force DSOs to seek bids from a range of smart meter suppliers, hence introducing competition into the purchasing process. The objective is to cut costs and improve efficiency in the supply of smart meters.
One of the main advantages of competitive tendering is that this increases efficiency in many areas, provided that the same smart metering functionalities are achieved. On the other hand, additional costs may be generated, including additional transaction costs.
For example, if three smart meter providers bid for a contract to supply a DSO (firms A - C), against an existing firm, D, and firm B wins the bid, the losing bidders have incurred costs in pursuing the bid. These costs, including legal costs and other managerial costs, were incurred when constructing and

46
submitting the bid. In addition, the 'losing' incumbent will incur exit costs, such as redundancy payments. It may be that the net cost savings in terms of supply costs are much smaller and possibly non-existent when all the transaction costs are included.
There are also concerns that firms may make very low bids in an attempt to pursue a predatory pricing strategy. Once rivals have been driven out of the market, the incumbent can raise prices and extract short-term super normal profits.
Price capping approach
ANRE could set price controls and formulae (price capping). This means forcing the smart meter providers to charge a price below the profit-maximizing price. For example, in the APSM – ‘X’ formula, the APSM (average price of smart meters) represents the average price, and ‘X’ is a figure set at the expected efficiency gain which ANRE believes would have existed had the firm operated in a competitive market.
The formula is straightforward and widely understood by utilities. Overall, price-capping results in lower prices, but lower prices also deter entry into the market.
Price capping approach (including capital investment in infrastructure)
An alternative to a standard price capping approach consists of a formula that considers the need for capital investment in infrastructure.
The alternative formula is APSM + K + U, where K is the price limit, and U is any unused 'credit' from previous years. For example, if K is 3% in 2017, but a DSO only 'uses' 2%, it can add on the unused 1% to K in 2018. ANRE may remove price caps if they judge that competition in the market has sufficiently increased.
This formula presents more flexibility than traditional price capping. On a less positive note, price limits only apply to variable charges.
Rate-of-return approach
An alternative to price-cap approaches is the rate-of-return approach. The rate of return approach is a method of establishing the average price of private or privatized cost items for public utilities (e.g., the cost of smart meters for DSOs). The system, which employs accounting rules for the calculation of operating costs and allows firms to cover these costs and earn a ‘fair’ rate of return on invested capital.
Regarding the main advantages of this approach, the ‘fair’ rate is based on typical rates of return that might be expected in a competitive market. Regarding drawback, the rate-of-return approach is often criticized because, unlike in an actual competitive market, a reduction in costs will not improve its situation, and hence there is little incentive to control costs. In fact, it will be to the advantage of DSOs to allow costs to inflate because prices will then be allowed to rise. This would not happen in a competitive market because the demand for smart meters would form a constraint against such price rises. A further general weakness is that regulators are unlikely to have perfect knowledge about the costs of production of the smart meters and cannot make an effective judgment concerning whether the costs are being controlled effectively.
Yardstick competition approach

47
Regulators can introduce yardstick competition, such as setting punctuality targets for DSOs for the smart meter rollout or based on the best-performing smart metering systems. It is also possible to split up a service into regional sections to compare the performance of one region to another. The DSOs then have the incentive to reduce the costs of the smart metering provision while ensuring a competitive rollout. For instance, yardstick competition is applied in the UK to both water and rail.
As a main advantage, this approach awards DSOs whose smart meters perform better. However, this approach may favor DSOs that are already performing well in smart meter implementation in the pilots and have access to lower price smart meters.
Table 19. Advantages and disadvantages of solutions to capping smart metering market prices Advantages Disadvantages
National tender Driving costs down Feasibility in Romania
Forcing competitive tendering
Increasing efficiency in several areas of smart metering implementation
Additional costs, including additional transaction costs
Price capping
Straightforward formula, widely understood by utilities Lower prices
Lower prices deter entry into the market
Price capping with capital investment in infrastructure
More flexibility than traditional price capping
Price limits only apply to variable charges
Rate-of-return approach
‘Fair’ rate based on typical rates of return that might be expected in a competitive market
Incentives to control costs are minimal. ANRE unlikely to make an effective judgement regarding whether costs are being controlled effectively
Yardstick competition Awarding DSOs whose smart meters perform better
May favor DSOs which are already performing well in smart meter implementation in the pilots and have access to lower price smart meters
Table 20 presents a list of advantages and disadvantages of solutions to capping smart metering market prices. ‘Price capping’ approaches seem to bring about higher potential benefits than other solutions.
A separate issue consists of which smart metering price to use for the cost-benefit analysis. A market price for smart meters should be a realistic account of how much society is going to pay for smart meters. In principle, an average value of those provided by DSOs is acceptable provided that this is the price DSOs will be able to charge for the provision of smart meters. However, ANRE may decide to use an adjusted value based, such as on the cap to smart meter price.
Table 20. Values per €/meter in other European countries Smart meters
Information technology
Communications
In-home display
Distribution
Training costs
Great Britain 147.28 30.13 90.09
Netherlands 81.99 5.78 117.45
Romania 77.35 1.55 18.83
Belgium (Brussels)
268.94 79.47 144.75
Belgium (Flanders)
387.49 83.33 22.73
Belgium (Walonia)
493.74 92.26 68.54
4.01
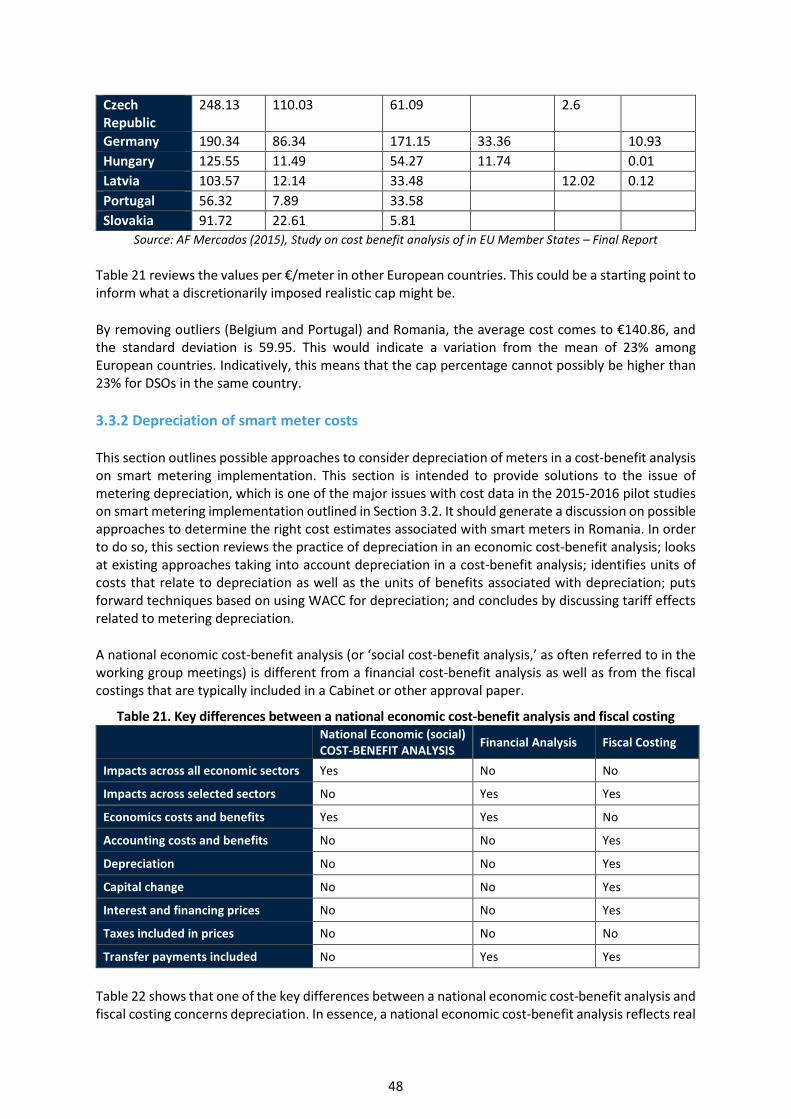
48
Czech Republic
248.13 110.03 61.09
2.6
Germany 190.34 86.34 171.15 33.36
10.93 Hungary 125.55 11.49 54.27 11.74
0.01
Latvia 103.57 12.14 33.48
12.02 0.12 Portugal 56.32 7.89 33.58
Slovakia 91.72 22.61 5.81
Source: AF Mercados (2015), Study on cost benefit analysis of in EU Member States – Final Report
Table 21 reviews the values per €/meter in other European countries. This could be a starting point to inform what a discretionarily imposed realistic cap might be.
By removing outliers (Belgium and Portugal) and Romania, the average cost comes to €140.86, and the standard deviation is 59.95. This would indicate a variation from the mean of 23% among European countries. Indicatively, this means that the cap percentage cannot possibly be higher than 23% for DSOs in the same country.
3.3.2 Depreciation of smart meter costs
This section outlines possible approaches to consider depreciation of meters in a cost-benefit analysis on smart metering implementation. This section is intended to provide solutions to the issue of metering depreciation, which is one of the major issues with cost data in the 2015-2016 pilot studies on smart metering implementation outlined in Section 3.2. It should generate a discussion on possible approaches to determine the right cost estimates associated with smart meters in Romania. In order to do so, this section reviews the practice of depreciation in an economic cost-benefit analysis; looks at existing approaches taking into account depreciation in a cost-benefit analysis; identifies units of costs that relate to depreciation as well as the units of benefits associated with depreciation; puts forward techniques based on using WACC for depreciation; and concludes by discussing tariff effects related to metering depreciation.
A national economic cost-benefit analysis (or ‘social cost-benefit analysis,’ as often referred to in the working group meetings) is different from a financial cost-benefit analysis as well as from the fiscal costings that are typically included in a Cabinet or other approval paper.
Table 21. Key differences between a national economic cost-benefit analysis and fiscal costing National Economic (social)
COST-BENEFIT ANALYSIS Financial Analysis Fiscal Costing
Impacts across all economic sectors Yes No No
Impacts across selected sectors No Yes Yes
Economics costs and benefits Yes Yes No
Accounting costs and benefits No No Yes
Depreciation No No Yes
Capital change No No Yes
Interest and financing prices No No Yes
Taxes included in prices No No No
Transfer payments included No Yes Yes
Table 22 shows that one of the key differences between a national economic cost-benefit analysis and fiscal costing concerns depreciation. In essence, a national economic cost-benefit analysis reflects real

49
resource use, while fiscal costings can include resource transfers and accounting items such as depreciation and capital charge.
As a general principle, only real costs and benefits, i.e. changes in real resources, should be taken into account. For instance, accounting depreciation expenses should not be taken into account, since this would double-count the capital investment that has already been taken into account as a cost. The risk of double-counting when considering depreciation charges is high (as it is with interest and cost of capital). For instance, a depreciation charge is intended to reflect the ‘consumption’ of capital, or the reduction in the value of the capital investment over a specified period, but would double-count the cost of an investment if the Cost-Benefit Analysis already included the smart metering cost. The accounting practice is to treat an asset cost as capital expenditure and to recognize depreciation as an operating cost. The usual practice in a cost-benefit analysis is to recognize capital expenditure when it is incurred, and depreciation is ignored. While the opposite would also be valid, doing it this way simplifies the task of ensuring that the time value of money (i.e., discounting) is properly taken account of.
In regard to approaches that take into account depreciation in a cost-benefit analysis, when almost the entirety of costs and benefits is borne by asset owners, the cost-benefit analysis has several features that normally characterize a private cost-benefit analysis. It then becomes possible to include the depreciation of assets. In the example of a cost-benefit analysis on smart meters, it is not uncommon to consider the depreciation levels of old and new meters (as noted in the section below, “Depreciation of meters in other cost-benefit analyses”).
As noted in the AT Kearney cost-benefit analysis, two CAPEX costs relate to the depreciation of meters:
• replacements of fully depreciated old meters. If old meters are not fully depreciated, then the difference between the value of new assets and the un-depreciated value of old assets should be considered.
• depreciation of new smart meters. The AT Kearney cost-benefit analysis assumes 10 years for new meters, 10 years for concentrators, and 5 years for hardware.
Depreciation can be seen as a type of stranding cost. Stranding costs are the costs incurred when a meter is taken out before the end of its expected economic life. This does not include the costs of removing old meters and installing new meters; rather, it includes the costs from an accelerated depreciation of the asset (i.e., reduced length of the meter’s life). In the Romanian cost-benefit analysis, this cost is likely to be dependent on the speed of the rollout option.
Benefits consist of avoided cost of old metering CAPEX via the approved smart metering charges, which incorporate all distributors’ metering costs. However, the smart metering charges also incorporate the costs associated with the accelerated depreciation of the old metering stock over the rollout period.
When using WACC for depreciation, the regulatory depreciation allowance is constant in each year so that the asset remains within the asset base (assuming straight-line depreciation). As a result, today’s customers and tomorrow’s customers pay an equal amount for the asset. This reflects the fact that both sets of customers derive benefits from the use of the smart meters.
However, this approach also has a disadvantage. It can mean that the way the company remunerates its investors differs from the way consumers remunerate the company. This difference can have significant policy implications. In a regulatory environment for smart meters in which there is already considerable concern regarding the financeability of the regulatory package, a regulatory policy that exacerbates the difference between costs being incurred and revenues for their remuneration provided—i.e., using WACC—might be problematic.
50
Regarding the depreciation of meters in other cost-benefit analyses, the Ernst & Young’s German cost-benefit analysis on smart metering makes use of a depreciation period of 8 to 13 years, with an average depreciation period of 10 years starting from the achievement of the 80% rollout target in 2022. One of the regulatory changes pertains to the adjustment of depreciation period of intelligent meters and smart metering systems. The cost-benefit analysis states that a replacement of devices that are not fully depreciated before the end of their useful life/calibration period would not be economically reasonable.
Table 22. Depreciation of CAPEX in the Irish cost-benefit analysis
Source: PWC (2011), “NSMP (Electricity& Gas) Cost Benefit Analysis”
Table 23 illustrates the Irish cost-benefit analysis on smart metering by PWC. It shows how the depreciation of CAPEX is considered as a cost before discounting is operated in a given year. This is a good example of how the depreciation of smart metering is considered as a unit of cost before discounting is applied.
In the UK cost-benefit analysis, it is assumed that depreciation costs would be largely avoided in a replacement scenario, but costs would occur in a 10-year or shorter rollout option (the basic meter life span is 20 years). In order to assess the impact of the different options, the UK cost-benefit analysis makes the following assumptions with respect to depreciation:
• meter asset value is based on the replacement cost of a basic meter; • for assets provided by commercial meter operators, the stranding costs include a profit
margin and annuitized installation costs since these are included in the annual meter charge; • stranding costs for National Grid-provided meters include 50% of annuitized installation costs
to reflect the fact that, prior to 2000, installation costs were annuitized in the meter charges, whereas after 2000, installation was paid up-front; and
• meter recertification continues during the deployment period.

51
All the options considered in the UK cost-benefit analysis involve significant stranding costs. Stranding costs are not reflected in other parts of the analysis because they are considered to be a form of sunk costs, i.e. costs already incurred, but for the purposes of the analysis, it is assumed that the costs of stranding will be passed on to consumers. The cost is therefore reflected in price and bill impacts.
The total stranding costs over the period of a specific smart meter rollout profile should be the same regardless of the order of meter replacement. While specific contractual relationships between suppliers and meter operators may influence behaviors to an extent, the UK cost-benefit analysis assumes that there is no attempt to minimize stranding costs in the early years of the rollout by replacing older meters first. Hence, we assume that the age of the meters replaced is the average age of legacy meters remaining in each year. Other things being equal (e.g., annual new meter installation numbers, rental arrangements, discount rates), suppliers (as a reminder, in the UK the smart metering rollout is led by suppliers) are not expected to prioritize replacement based on the age of a meter.
The Dutch cost-benefit analysis assesses the depreciation of smart meters, considering their economic life and the development of new technologies. Information on the depreciation of old meters, lifetime assumptions, and current average age were used to determine the economic stranding cost that will be incurred by DSOs when replacing legacy meters that have not yet exhausted their useful economic life. By comparing actual meter age data with the assumed (rather than actual) old meters’ life, the 7.5 to 10 years were derived. This is consistent with DSOs’ approaches to calculate meter depreciation.
In regard to tariff effects, any costs to DSOs are likely to be recovered through higher electricity prices. The cost-benefit analysis may estimate the average impact on Romanian average tariffs. Variation is expected between end-users depending on the level of electricity they save and how the costs are passed through to the end-user.
In the long term, the results may show long term reductions in energy bills for customers once the rollout is complete. In the short term, transitional and stranding costs from the rollout will be passed down to consumers, and energy savings will only be realized by those consumers who have already participated in pilots. In other words, the price impact per unit of energy (i.e., the impact before energy savings are accounted for) is expected to be positive during the rollout period.
From an economic assessment perspective, the most important point is that the same costs are not counted for twice in the cost-benefit analysis.
The main mistakes in a cost-benefit analysis consist of double-counting and money transfers:
• Double-counting of certain costs and benefits by including the same economic impact more than once, in what erroneously seem to be different measures.
• Including as benefits or costs monetary exchanges which are transfer payments, i.e., transactions where money moves around without anything of economic value being created or consumed.
When money is merely moved around among members of society on whose behalf a project is proposed or from their government, these movements are usually just transfer payments.
Example: A study of a proposed downtown transit improvement includes, as a benefit, the downtown parking fees avoided by former auto users. This may be a mistake since parking fees may also just be transfer payments. On the other hand, if reduced demand for downtown parking actually frees up land or structures for other uses, the value of those released resources would properly count as a benefit. (To the extent that parking fees reflect the value of the resources thus freed up, parking fees could indeed be a reasonable surrogate measure of that benefit.)

52
The most important step to avoid double-counting and money transfers is to establish a viewpoint of the cost-benefit analysis. If the purpose of the cost-benefit analysis is to evaluate a private sector investment, its viewpoint would be that of the individual firm, where revenues and expenditures on taxes are properly counted as costs and benefits. In this narrow viewpoint, anything that affects company profitability matters.
The bill impact analysis should not add stranding costs for traditional metering equipment into the energy industry cost in order to avoid double-counting. The cost-benefit analysis may assume that all costs and cost savings are passed on to customers given competitive pressures or regulated outcomes (where parts of the energy industry do not operate under competitive markets). Bill impacts on different household types and income groups may not explicitly be considered in the cost-benefit analysis given that there may be a lack of evidence on distributional impacts on Romanian consumers when carrying out the cost-benefit analysis.
53
4. BENEFITS OF SMART METERS IN ROMANIA
4.1. Data from Distribution System Operators’ 2015-2016 pilot studies
The most up-to-date data on the benefits of smart meters derive from the pilot projects in 2015 and 2016. This is highlighted in ANRE’s Annual Report for 2016 published on December 31, 2016.
The pilots collected data for the following typologies of benefits: • Cost reduction per customer for meter reading; • Cost reduction with interventions at the consumption locations; • Specific costs of the investments with the SM implementation; • Reduction of the commercial CPT; and • Reduction of the technical CPT.
Table 24 lists smart metering benefits from the findings of the 2015 pilot studies. As mentioned above, the 2015 pilots were carried out over sections of the network that were either new or recently upgraded. This means that any generalization on benefits should take this into account. In addition, regarding the reported data on benefits from the pilots, the following observations should be taken into account:
• some of the information regarding the monitoring of the benefits is missing from several operators, which proves the lack of experience in managing such projects and a poor organization of the monitoring activity;
• there is no consistency in the reported data: for instance, in 2 pilot projects, there were recorded increases in the commercial CPT, contrary to the original estimations;
• there was no correlation between the information in Table 18 on the benefits obtained subsequent to smart metering implementation
• there are significant value differences between operators, which leads to the conclusion that the assumptions or estimates made are based on different principles; and
• the estimation and calculation of the benefits obtained after the implementation are an issue of the SM implementation process.
Additional typologies of benefits partly captured in the pilot studies consist of the following: • The reduction of the interruption duration in the electricity supply (to the consumer); • The reduction of the number of complaints about the measurement errors; • The number of identifications of the excess of the contracted registered power by the system after
having installed smart meters; • The number of identifications of voltage variation beyond the accepted limits; • Variations in the monthly average consumption of electricity for households; consumers included
in the smart meter implementation project; • Variations in the monthly average consumption of electricity for non-household consumers
included in the smart meter implementation project; • Variations in the consumption during peak hours for household consumers for whom smart
meters were installed; and • Variations in the consumption during peak hours for non-household consumers for whom smart
meters were installed.

54
Table 23. The main benefits of smart meters (from 2015 pilot studies) Pilots P1 P2 P3 P4 P5 P6 P7 P8 P9 P10 P11 P12 P13 P14 P15 P16 P17 P18
Reduction of costs for
meter reading per customer
RCcc
Costs with meter reading after SMS
2.26 2.26 0.22 0.22 0.22 0.14 0.14 0.14 0.14 0.52 2.04 2.04 1 1.74 0.12 0.11 0 0
Costs with meter reading before SMS (RON/year)
9.02 15.28 7.25 7.25 7.25 7.65 7.65 7.65 7.65 10.38 4.56 4.56 4.77 7.08 1.19 1.77 0 0
75% 85% 97% 97% 97% 98% 98% 98% 98% 95% 55% 55% 79% 75% 90% 94%
Reduction of intervention
costs at consumption
points RCintc
Costs of intervention at consumption points after SMS installation
2.26 2.26 0.09 0.09 0.09 0.08 0.08 0.08 0.08 0.33 8.32 8.32 0.14 0 0 0 0 0
Costs of intervention at consumption points before SMS installation
149.67 149.67 3.01 3.01 3.01 4.33 4.33 4.33 4.33 6.73 12.36 12.36 0.57 0 0 0 0 0
98% 98% 97% 97% 97% 98% 98% 98% 98% 95% 33% 33% 75%
Reduction of commercial
losses RCPTcom
Commercial losses after implementation of SMS
20.93% 15.35% 3.15 13.92 2.91 12.59 6.6 11.55 12.46 4.79 6% 11% 0.2 1.08 0 0.5 0 0
Commercial losses before implementation of SMS
15.52% 27.24% 3.72 16.92 2.45 13 9 12 13 5.45 17% 27% 1.33 5.4 2.93 1 0 0
-35% 44% 15% 18% -19% 3% 27% 4% 4% 12% 65% 59% 85% 80% 100% 50%
Reduction of technical
losses RCPTth
Technical losses after implementation of SMS
12.40% 12.40% 8.28 9.09 7.96 7 5 7 9 10 13% 18% 9.53 7.6 7.02 7 0 0
Technical losses before implementation of SMS
15.70% 15.20% 8.28 9.09 7.96 7 5 7 9 10 15% 18% 10.99 14.3 7.02 7 0 0
21% 18% 0% 0% 0% 0% 0% 0% 0% 2% 13% 0% 13% 47% 0% 0%

55
Table 24. Smart meter additional benefits (from 2015 pilot studies)
Pilots P1 P2 P3 P4 P5 P6 P7 P8 P9 P10 P11 P12 P13 P14 Reduction of average
interruptions in energy supply for consumers Redd_nealim
Index average interruption in network (system) after implementation of SMS
0 0 27.4 20.72 23.93 2.72 68.37 26.5 20.52 38.8 28 112 0 65
Index average interruption in network (system) before implementation of SMS
0 0 35.57 26.59 37.97 51.88 230.25 15.91 83.43 53.47 27 104 0 69
23% 22% 37% 95% 70% -67% 75% 27% -4% -8%
6%
Reduction of complaints concerning metering errors
Red_reder_mas
Average yearly complaints concerning meter reading errors after implementation of SMS
16 67 3 0 4 2 1 1 0 3 29 31 259 0
Average yearly complaints concerning meter reading errors before implementation of SMS
23 73 2 9 16 3 2 2 0 51 58 56 187 2
30% 8% -50% 100% 75% 33% 50% 50%
94% 50% 45% -39% 100%
Number of times that actual power exceeded contracted
power after implementation of SMS -Nr_deppcontr
n/a n/a 10 9 58 304 236 371 39 178 492 450 0 0
Number of times of voltage variations went beyond
acceptable limits Nr.idvar_Un
n/a n/a 0 0 0 0 0 0 0 0 597 572 0 0

56
Table 25 highlights the findings from the 2015 pilot studies on the additional benefits of smart metering. There are no data and information for all the set indicators because, at this stage of the SM implementation, the distribution operators have not implemented the available IT applications of information processing, or some projects were not completed in 2016, with the monitoring period being insignificant.
In summary, the pilot project presents the following findings on benefits:
• Meter reading costs reduction: 55-97% • Reduction of operating costs for activities requiring the physical presence of specialized teams: 27-
97% • CPT reduction: extreme variance, from an increase of 38% in CEZ – Distributie Oltenia to a
reduction of 100% - total reduction of CPT in pilots from Transilvania Nord. It should be noted that CPT in AT Kearney was calculated based on a formula and coefficients and not on actual figures.
• Reduction of complaints regarding metering errors: 4-100%. In one of the pilots for Transilvania Sud, there was an increase of complaints based on the higher accuracy of metering.
Given the lack of data, ANRE considers the following benefits categories as non-measurable: preparation for the smart grids, flexibility of the networks, demand response, the integration of prosumers and distributed generation; and CPT reduction.
The distribution system operators, with ANRE’s supervision, prepared a study on the status of the distribution and low voltage networks. However, the findings of that study are rather general and, in general, indicate that without data from smart meters, it is impossible to gather sufficient information regarding the performance of distribution networks at the low voltage level. In other words, a decision on the implementation of smart meters would not be based on a CBA, as most of the benefits (except for the ones noted during the pilots, as identified above) cannot currently be estimated with more precision than at the time of the AT Kearney study.21
Figure 26. Share of benefits (data from pilot studies)
21 Poyry and Ciga Energy (2017). Evaluarea şi monitorizarea retelelor de distributie din Romania - Raport pentru ACUE. The ACUE report contains a chapter about the preparedness of the networks for the implementation of smart metering. The main information in relation to this consists of (i) the share of IT network integrated in SCADA by DSO; (ii) the overall level of automatization and remote control of the DSO networks is 22-83% among DSOs (for HV networks, this is in the range of 29-89%, for MV networks, it is 0-80%, and for transformer stations, it is 35-97%). The report also presents some proposals for measuring the performance of introducing smart metering—i.e., penetration; integrating meters in MDM and SCADA etc., and a fine-tuned definition of SAIDI/SAIFI to register improvements, etc. In other words, it offers a narrative description of how to measure the performance of smart metering implementation, when it would be the case.
Reduction in meter reading and operation 4%
Reduction in O&M costs 16%
Reduction in technical losses
78%
Reduction of outage times 2%

57
Figure 26 illustrates the share of benefits as percentages of estimates associated with data from pilot studies. The largest benefits consist of reductions in technical losses, which are followed by reductions in O&M costs. A reduction in meter readings and operations as well as reductions in outage times present limited benefits. The most significant missing benefit (also in comparison with the previous cost-benefit analysis) is a reduction in communication losses. Indicatively, if adequately quantified and monetized, this benefit could be the second largest in the pie chart above and could push the total benefits percentage much closer to the cost figure. The benefits estimates relate to individual meters.
Table 25. Calculations for deriving reductions in technical losses Category Value Unit Source
Baseline CPT 10.88% Electric power transmission and distribution losses (% of output)
IEA Statistics © OECD/IEA 2014 (iea.org/stats/index.asp)
Impact of electrical losses
34.59 EUR/MWh 2015 ANRE report (Market of regulated contracts @ 140.56 RON/MWh)
Impact of electrical losses
0.03459 EUR/kWh 2015 ANRE report (Market of regulated contracts @ 140.56 RON/MWh)
Table 24 shows the calculations for deriving reductions in technical losses. The methodology consists of obtaining figures for baseline CPT and average yearly electricity demand (per meter) from IEA statistics; the impact of electrical losses from the 2015 ANRE report; the expected reduction in losses from smart metering implementation; and the expected reduction in losses from smart metering implementation from the 2015 pilot studies. Finally, current CPT, CPT reduction per meter, and the value of CPT reduction were derived from our own calculations.
Figure 27. Reductions in meter reading costs and O&M costs (RON per meter)
Figure 27 illustrates reductions in meter reading costs and O&M costs per meter based on data from 17 pilot studies. The average net reduction in meter reading costs was 7.15 RON per meter, whereas the net reduction in O&M costs was 26.94 RON per meter.
0
20
40
60
80
100
120
140
160
1 2 3 4 5 6 7 8 9 10 11 12 13 14 15 16 17Meter reading costs (after smart metering implementation)Meter reading costs (before smart metering implementation)O&M costs (after smart metering implementation)O&M costs (before smart metering implementation)
58
4.2. Identification of affected stakeholders
Identifying winners and losers from regulatory change is an important step in any cost-benefit analysis. Smart meter implementation affects the vast majority (if not the totality) of consumers, all actors in the electricity market as well as manufacturers of smart metering technologies. Overall, nine main groups of stakeholders were identified during technical discussions with ANRE, They are listed below along with key metrics that could be used in a RIA to assess and possibly quantify the impacts on each category of stakeholders.
1. DSOs
Implementing smart metering would allow DSOs to obtain better data on the status of the grids. However, pacing is critical to ensure that preparation, feasibility, design, procurement, contracting, and actual installation follow the requirements of the new public procurement law and that the labor and equipment markets have time to adapt to the new policy. In addition, DSOs would have to optimize an investment strategy given the investment plans approved by ANRE and requirements for interoperability. SMS implementation will also lead to better grid management, including safety (remote (dis)connection) and lower losses (CPT), but only in conjunction with other measures (commercial - policing; technical - other investments in the grid).
Key metrics: changes in manual meter reads, changes in costs of meter replacement, and theft reduction.
2. Consumers (industrial, commercial, residential)
In addition, one may consider "smart clients": demand response and the optimization of consumption based on adequate information on consumption. Better information to decide to switch suppliers. New technologies (e.g., electrical vehicles). Better management of industrial electricity consumption, including aggregation of demand, demand response, etc.
Key metrics: energy demand reduction and levels of prosumption through microgeneration.
3. Regulator
Smart meters are essential to prepare the distribution infrastructure for the smart grids, better functioning of the balancing market, and development of the market for renewables and energy produced by prosumers. ANRE will have to amend regulations and identify the best means to recognize SMS costs in tariffs, e.g. setting caps (trade-off between tariff affordability and modernization of network); prepare regulations for distributed generation and small renewables; and prepare regulations for electric vehicles and other consumers that would have more flexible access to electricity with the introduction of a better energy management at distribution level. All these regulations have to be properly correlated. They should also be correlated with the market liberalization and expected demand response gains.
Key metrics: avoidance of multiple regulatory interventions (for instance, measured as number of ‘one-in one-out’).
4. Distributed and renewable energy generators
Key metrics: enablement of smart grid and greater use of renewables.
Distributed generators, renewables, prosumers gain access to a new market once the distribution grids can take over the electricity produced by them.
59
5. Energy retailers
Better management of clients; optimized billing, disconnections of non-payers; optimization of energy procurement. SMS allows better forecasting, which also means the optimization of purchases of electricity from the balancing market.
Key metrics: more accurate billing, bad debt reduction, better forecasting.
6. Smart meter equipment manufacturer, communication/ICT companies
New market, change in business strategy once the regulatory approach on the implementation of SMS becomes clearer.
Key metrics: changes in turnover and changes in demand.
7. Government
The main benefits for the government include broad societal gains on energy efficiency and energy market development. (Smart meters are part of the climate change strategy and energy strategy currently under preparation.)
Higher employment (smart metering installation) and higher tax revenues generated by SMS investments could also be considered.
Key metrics: energy efficiency gains and CO2 emission reductions.
8. Generation (traditional) companies
The Romanian generation mix is well placed for balancing. Most of the energy it uses is derived from petroleum products (27.6%) and gas (27.1%), followed by solid fuels (17.9%), renewables (18.1%), and nuclear (9.1%). Some expensive (thermal - coal, gas) capacities that are currently providing energy for balancing would no longer be in demand.
Key metrics: lower system marginal price because of lower demand and avoided costs of investments in new generation.
9. Transmission system operator
The effects in terms of demand and supply balancing would become more visible later, with the introduction of smart meters.
Key metrics: Avoided costs associated with the investigation of voltage complaints, avoided costs of re-enforcing the network as a result of a reduction in peak demand.
4.3. Key societal benefits
Other cost-benefit analyses on smart metering implementation (Section 2) point to energy savings as the most sizeable area of benefits in other European countries. This section highlights available evidence and examples of benefits associated with energy savings.
60
4.3.1. Energy savings
A premise to smart meters is that people have traditionally been unaware of their energy consumption because utility bills provide too little information too long after the consumption decision to influence decisions regarding the timing of energy demand. In several places, by law, it is only required that traditional meter reading takes place on an annual or semi-annual basis. As a result, most of the bills received by customers consist of estimates, which makes it even more difficult to derive any useful information from them. The analogy “a supermarket with no price labels” is often used to describe such a lack of information by the demand side.
In principle, frequent and accurate bills can enable comparisons to historical consumption or to other peer groups. However, the literature is mixed on the effectiveness of such an approach22.
Smart meters per se do not deliver any change in energy demand—neither in absolute energy conservation nor in load shifting. However, smart meters generate information (also known as direct feedback) that is otherwise not available to end-users. When combined with human intervention, smart meters have been shown to trigger some level of change in energy demand. The effectiveness of smart meters in regard to modifying energy consumption heavily depends on the type and medium of the feedback. Feedback can be provided indirectly through measures such as more detailed, frequent and accurate billing. Feedback can also be provided directly through a web portal, through directly reading the meter, or through a dedicated display device.
At an empirical level, over a hundred empirical studies of energy feedback have been conducted over the past 40 years, and over 200 articles have been published about energy feedback during that time (Karlin et al., 2014). What transpires from the behavioral approach on smart meters is that the literature is mixed on the conservation effect associated with smart meters, but the most widely cited range is between 3-15%. The meta-analysis by Fischer (2008) found usual savings are between 5% and 12%. The Faruqui et al. (2009) meta-analysis found a range of 3-13% and concluded that consumers who actively use a smart meter can reduce their consumption of electricity by an average of 7%. Darby (2006) reached a similar conclusion for smart meters and claimed that savings are typically of the order of 10% for relatively simple displays. The ACEEE finds an average conservation effect of 8.6%. Therefore, for smart meters’ specific feedback, the literature suggests a figure of 6-10% with some acknowledgement that larger-scale, newer studies come in toward the lower end of this range. A significant outlier to this trend is the AECOM trial results released in June 2011, which found only a 3% conservation effect from smart meters and warrants further examination. Even before this study, the ACEEE review concluded that future research should direct more attention toward understanding the significant variation in energy savings that has resulted from the application of real-time feedback technologies. Appendix E provides a list of smart metering trials, net conservation effects, and sample sizes of the trials.
22 Fischer (2008) found no conservation effect from normative feedback and attributes this to people with lower than average consumption seeing it as a reason to do nothing. Historical presentations of data are also argued to be more effective than normative comparisons because people often resent the household comparison group to which they are applied (Darby, 2008). Egan (1999) discovered contradictory evidence, stating that people did appreciate normative comparisons, though groups varied widely in what they thought was a good way of presenting this. Finally, the AECOM study found that historic and normative comparisons could provide up to a 1% reduction in consumption but that they were highly context dependent and were most effective in conjunction with direct feedback.

61
4.4. Issues with missing data
The data on benefits for the 2015-2016 pilot studies on smart metering implementation present challenges related to the data collection, analysis, and techniques for benefits assessment.
• There are areas of benefits that are not covered by the smart metering pilots. • There are significant discrepancies in benefits estimates. For instance, the reduction of commercial
CPT (RCPTcom) varies between -35% (a cost) and 100% (a very significant benefit). • DSOs' assumptions about benefits seem to vary significantly. For a national cost-benefit analysis,
introducing weights to the uncertainty of data may be required in cases where (i) information regarding the monitoring of the benefits is missing; (ii) there is no consistency in the reported data; and (iii) there is evidence of no correlation between the information on obtained benefits and the smart meter implementation.
• There are emerging areas of costs and benefits associated with the digitalization of metering infrastructure that have not yet been considered. These include cybersecurity and the standardization of interoperability. Appendix F sets out the problem definition, potential options, issues concerning the comparison of options, and methods associated with a RIA on different interoperability options. In addition, recent evidence from the rollout process in other European countries suggests that the non-acceptance of meters at the end-user level may increase the costs of meter replacement and reduce benefits.
4.5. Recommendations on carrying out a full cost benefit analysis on smart meters
This report summarized data on costs and benefits available to date in Romania and other European countries and provided guidance for a cost-benefit analysis of smart metering in Romania. The review of smart metering cost-benefit analyses in other European countries points to common challenges, particularly concerning the measurement of key areas of benefits, such as reductions in ‘behavioral’ consumption and commercial and technical losses. The same challenges apply to any cost-benefit analysis on smart metering rollout in Romania. It was pointed out in the report that while the pilots have represented a significant effort toward understanding the costs and benefits of smart meters, the following three points remain unaddressed: (i) pilots’ findings are not necessarily representative of the whole Romanian grid and end-users; (ii) the focus thus far has mainly been at the DSO level; and (iii) key benefits in terms of commercial and technical losses were not quantified. The first two points are extremely important for the methodological accuracy of any net present value calculation that is performed in association with different policy options (e.g., those presented in Section 4 of Report 1). The third point is particularly important when considering that any cost-benefit analysis needs to cover not only costs and returns for market stakeholders but also be representative of the net societal benefits (i.e., total societal benefits minus total societal costs).
Hence, this report issues the following recommendations:
1. Embedding findings from pilot studies in decisions on smart metering rollout
2. Focusing on societal costs and benefits
3. Quantifying electricity cost savings for consumers
This section provides guidance on how these three recommendations can be addressed in future cost-benefit analysis work. It also offers recommendations in regard to the next steps required in terms of an evidence-base for making effective decisions on smart metering in Romania.

62
Recommendation 1: Embedding findings from pilot studies in decisions on smart metering rollout
Findings from pilot studies are not necessarily representative of the whole Romanian grid and end-users because the 2016 pilots do not include 3 DSOs that abandoned the implementation of smart meters because they were too expensive. The 2016 pilots were also developed based on different criteria than the 2015 pilots. The former consists mainly of old distribution networks, whereas the latter included new or newly upgraded distribution networks. Indeed, experience from other trials in other countries shows that having a nationally representative approach to pilots is almost impossible. This is also applicable to Romania, where there are many potentially relevant variables (e.g., rural and urban; mountainous and flat areas). The older vis-à-vis newer distribution network sampling adopted by ANRE can capture some of these variables. Moreover, with some degree of optimism, one might conclude that by design, the 2015 and 2016 pilots together would be more representative of a full rollout. Section 3 of this report revealed that 5 DSOs that implemented pilots in both 2015 and 2016 had total cost reductions of between 16% and 49%. As a result, costs were significantly higher in the 2015 pilots compared to the AT Kearney cost-benefit analysis.
The alternative to the pragmatic approach of conforming to the 2015 and 2016 pilots would involve more pilots in more representative areas. This is a lengthy and costly option, which would expand uncertainty and potentially lead to inconclusive results. The only scenario in which this option might be recommended is if, as part of the policy option design (see Section 4 of Report 1), ANRE opted for a geographically specific rollout and the findings from the pilots did not satisfy such criteria.
Recommendation 2: Focusing on societal costs and benefits
Relying on DSO data from pilot studies as the single input source for cost-benefit analysis may overlook broader societal costs and benefits.
Section 4.1 provides a list of stakeholders that may benefit and/or pay because of smart metering implementation. In a general cost-benefit analysis, the benefits and costs of the most directly affected stakeholders should be included, whereas indirect impacts should not be taken into account. How is it possible to include different stakeholders’ benefits and costs, and how could data be collected? Several options exist,23 but two are presented here for simplicity.
23 The working group identified 9 possible options for studies filling gaps in terms of data and analysis needs for the cost-benefit analysis on smart metering implementation in Romania: GATHERING NEW DATA 1) Doing a study on prosumers (volume and potential benefits) 2) Doing a study on behavior change (i.e., consumption change following smart meter)? Important but feasible? Will it generate data that makes any difference? 3) Doing a study on behaviour change from the introduction of ToU tariffs: what effects 4) Doing a study on behaviour change from the introduction of ToU tariffs: what effects on consumption and peak demand 5) Forecast of end-users by suppliers: a study on this? 6) Appraising improvements to LV networks related to areas where smart meters have been installed 7) Assessing environmental benefits of smart metering implementation. ANALYSING EXISTING DATA 8) Consultant to be handed the data and asked to perform a CBA on the different options (given a final set of categories of costs and benefits) 9) Consultant to be asked to consolidate specific items of costs and benefits for which we already have data, but these are problematic (e.g., consumer energy savings, primarily CPT but also avoided generation and CO2 emissions).
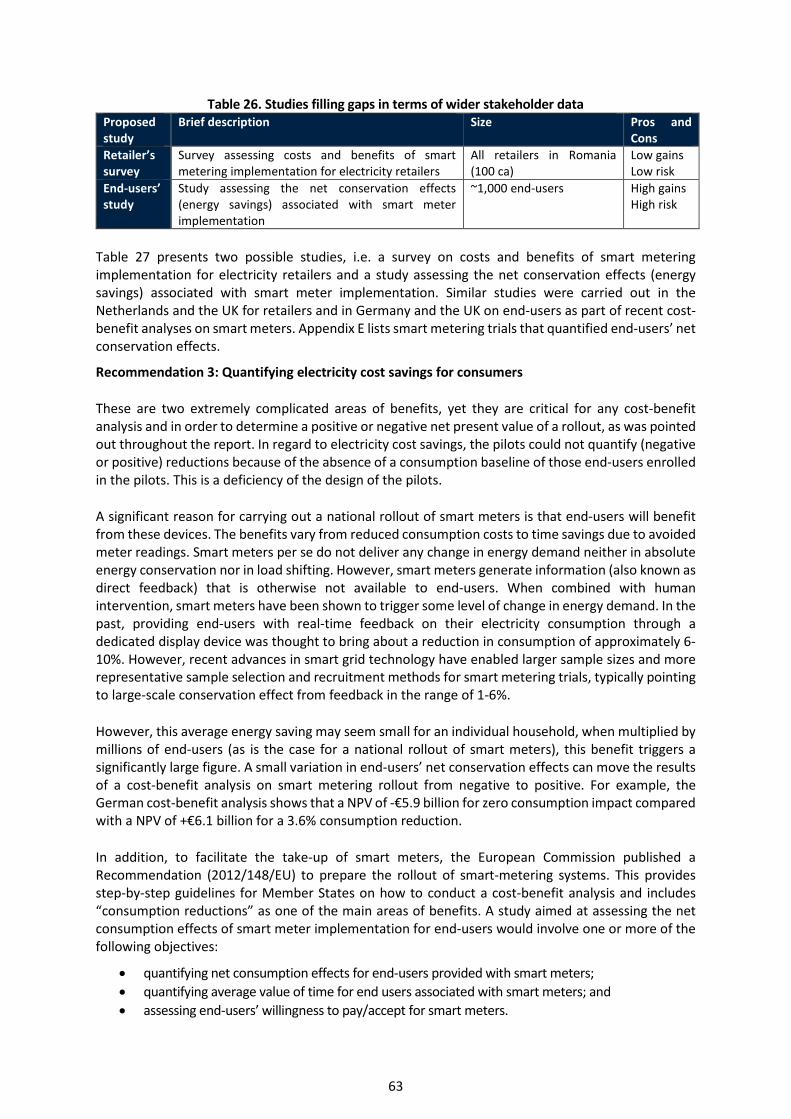
63
Table 26. Studies filling gaps in terms of wider stakeholder data Proposed study
Brief description Size Pros and Cons
Retailer’s survey
Survey assessing costs and benefits of smart metering implementation for electricity retailers
All retailers in Romania (100 ca)
Low gains Low risk
End-users’ study
Study assessing the net conservation effects (energy savings) associated with smart meter implementation
~1,000 end-users High gains High risk
Table 27 presents two possible studies, i.e. a survey on costs and benefits of smart metering implementation for electricity retailers and a study assessing the net conservation effects (energy savings) associated with smart meter implementation. Similar studies were carried out in the Netherlands and the UK for retailers and in Germany and the UK on end-users as part of recent cost-benefit analyses on smart meters. Appendix E lists smart metering trials that quantified end-users’ net conservation effects.
Recommendation 3: Quantifying electricity cost savings for consumers
These are two extremely complicated areas of benefits, yet they are critical for any cost-benefit analysis and in order to determine a positive or negative net present value of a rollout, as was pointed out throughout the report. In regard to electricity cost savings, the pilots could not quantify (negative or positive) reductions because of the absence of a consumption baseline of those end-users enrolled in the pilots. This is a deficiency of the design of the pilots.
A significant reason for carrying out a national rollout of smart meters is that end-users will benefit from these devices. The benefits vary from reduced consumption costs to time savings due to avoided meter readings. Smart meters per se do not deliver any change in energy demand neither in absolute energy conservation nor in load shifting. However, smart meters generate information (also known as direct feedback) that is otherwise not available to end-users. When combined with human intervention, smart meters have been shown to trigger some level of change in energy demand. In the past, providing end-users with real-time feedback on their electricity consumption through a dedicated display device was thought to bring about a reduction in consumption of approximately 6-10%. However, recent advances in smart grid technology have enabled larger sample sizes and more representative sample selection and recruitment methods for smart metering trials, typically pointing to large-scale conservation effect from feedback in the range of 1-6%.
However, this average energy saving may seem small for an individual household, when multiplied by millions of end-users (as is the case for a national rollout of smart meters), this benefit triggers a significantly large figure. A small variation in end-users’ net conservation effects can move the results of a cost-benefit analysis on smart metering rollout from negative to positive. For example, the German cost-benefit analysis shows that a NPV of -€5.9 billion for zero consumption impact compared with a NPV of +€6.1 billion for a 3.6% consumption reduction.
In addition, to facilitate the take-up of smart meters, the European Commission published a Recommendation (2012/148/EU) to prepare the rollout of smart-metering systems. This provides step-by-step guidelines for Member States on how to conduct a cost-benefit analysis and includes “consumption reductions” as one of the main areas of benefits. A study aimed at assessing the net consumption effects of smart meter implementation for end-users would involve one or more of the following objectives:
• quantifying net consumption effects for end-users provided with smart meters; • quantifying average value of time for end users associated with smart meters; and • assessing end-users’ willingness to pay/accept for smart meters.

64
Approach #1: Difference-in-difference using billed (baseline) data and smart meter data for those who participated in pilots
This approach would entail an analysis of secondary data based on consumption figures provided by the DSOs. Specifically, the consultant will have to access the following sources of data:
• historical billed data for a period (minimum 6 months, maximum 1 year) prior to smart meter installation;
• data on metered consumption for a period (minimum 6 months, maximum 1 year) following the installation of smart meters.
PROS of Approach #1:
• This approach would provide exactly the data on end-users’ changes to consumption volumes needed for the CBA.
CONS of Approach #1:
• DSOs may not provide billed data (even if ANRE issues a request for the data). • DSOs may not provide individual household metered data (possibly because they did not store it
or because the only data available are at the sub-station/LV network level). • A substantial number of bills may be relying on consumption estimates, hence significantly
increasing the measurement error for the baseline. • In the longitudinal comparison across time, it might be difficult to control for statistically significant
variables, such as the following: o changes in ownership/tenancy of the household; o changes in the physical structure of the dwelling due to renovation/extension works; o changes to the composition of the household (e.g., more or less tenant); and o other variables.
Approach #2: Difference-in-difference between the control group (to be identified) and the treatment group (those who participated in pilots)
This approach will involve a comparison between those who already have smart meters installed (treatment group) and those who do not (control group). The treatment group should be (randomly) sampled from the pilots, whereas the control group should be sampled among end-users who are not currently provided with a smart meter. The comparison would occur for the same time period (for instance, 6-12 months in 2016).
Control and treatment groups will be differentiated depending on the stratification of the sample by customer type. Control groups may be combined, in different ways, to provide the best demographic match between controls and trial groups.
PROS of Approach #2:
• This approach would provide exactly the data on end-users’ changes to consumption volumes needed for the CBA.
CONS of Approach #2:
• DSOs may not provide billed data for the control group (even if ANRE issues a request for the data). • DSOs may not provide individual household metered data (possibly because they did not store it
or because the only data available is at the sub-station/LV network level).
65
• A substantial number of bills may be relying on consumption estimates, hence significantly increasing the measurement error for the control group.
• In the comparison between control and treatment groups, it might be difficult to get the same timescales. For instance, if the comparison between the control group and treatment groups is carried out over a 6 month-period and the 6 months do not coincide, then the analysis might be skewed.
Approach #3: End-users’ survey measuring value of time and/or interest in smart meters
This alternative approach consists of an end-user’s survey, which would not measure net conservation effects but does measure other benefits/costs for end-users associated with smart metering implementation. The survey could assess some of the following:
• value of time – how much time do consumers spend in getting acquainted with the new technology and how much time do they save in end-users’ readings?
• interest in smart meters – measuring perceptions of smart meters uptake from different types of end-users.
• willingness to accept/willingness to pay – assessing how much end-users are willing to pay to have higher information about consumption.
PROS of Approach #3:
• Data on perceptions and expected costs and benefits of smart meters are currently missing in Romania – this is important to understand the societal expectations of smart metering rollouts.
• By producing a survey, there might be indirect benefits in terms of (a portion of) end-users understanding the device before its installation.
CONS of Approach #3:
• People’s views on smart meters are unlikely to change decisions on rollout penetration. • The willingness to pay/accept figures may not be reliable unless participants are fully informed
about the costs and operational aspects of smart meters.
Approach #4: Adopting a conservation effect figure from existing studies
This approach will consist of adopting an existing figure on conservation effects of smart meters from existing cost-benefit analyses (e.g., in other countries in Section 2 of this report). Benefits and costs transfer is not best practice in cost-benefit analyses but occurs frequently where some figure is considered to be better than no figure at all. In borrowing a figure on net conservation effects (see Section 4.3.1 for a detailed discussion on available figures), two factors that should be considered include (i) the small volume of electricity demand (particularly residential) in Romania compared with other countries; and (ii) the absence of in-home displays in the pilots and how this reduces the reduction figure given the lack of a ‘direct feedback’ effect. Appendix E provides a list of smart metering trials, net conservation effects, and sample sizes of the trials. This could be used as a starting point for Approach #4.
PROS of Approach #4:
• This would be a quick exercise that would require no further data collection.
CONS of Approach #4:
• Picking a conservation figure from other studies could be arbitrary.

66
• The small volume of electricity in Romania and the absence of in-home displays would play a significant role in diminishing the conservation figure, but this would be difficult to quantify.
Table 27. Comparison between four approaches Approach Brief description Duration Gain Risk
Difference-in-difference using baseline data and metered data
Comparison between historical billed data prior to smart meter installation and metered consumption data post smart meter installation.
5-6 months? High High
Difference-in-difference between control group and treatment group
Comparison between those who have smart meters already installed (treatment group) and those who do not (control group).
5-6 months? High High
End-users’ survey Survey measuring other benefits/costs for end-users associated with smart metering implementation value of time; interest in smart meters; and willingness to accept/willingness to pay.
3 months? Low Low
Taking a conservation effect figure from existing studies
Modifying an existing figure on conservation effects of smart meters from existing cost-benefit analyses
1 month High High
Table 28 summarizes the recommended approaches and their duration, gains, and risks. Overall, the gains of the difference-in-difference approach using baseline data and metered data are high because it would produce data on changes to end-users’ demand. However, there are also high risks in terms of access to data and measurement error. The approach based on difference-in-difference between the control group and the treatment group would have high gains because it would also generate the data on the changes to volumes of consumption by end-users needed for the cost-benefit analysis. The high risks of this approach are represented by data access and complex issues associated with the temporality of such study. The end-users’ survey measuring value of time and/or interest in smart meters would have lower gains because of its focus on perception figures and the indirect benefits the study itself might generate. This approach is associated with low risks as there should not be any major issues with collecting reliable data when following standard survey methodologies. The approach of adopting a conservation effect figure from existing studies (such as those listed in Appendix E) would yield high gains at a low cost because it would provide the figure required for the cost-benefit analysis without any further data collection. However, this approach is associated with significant issues of accuracy regarding benefits transfers.
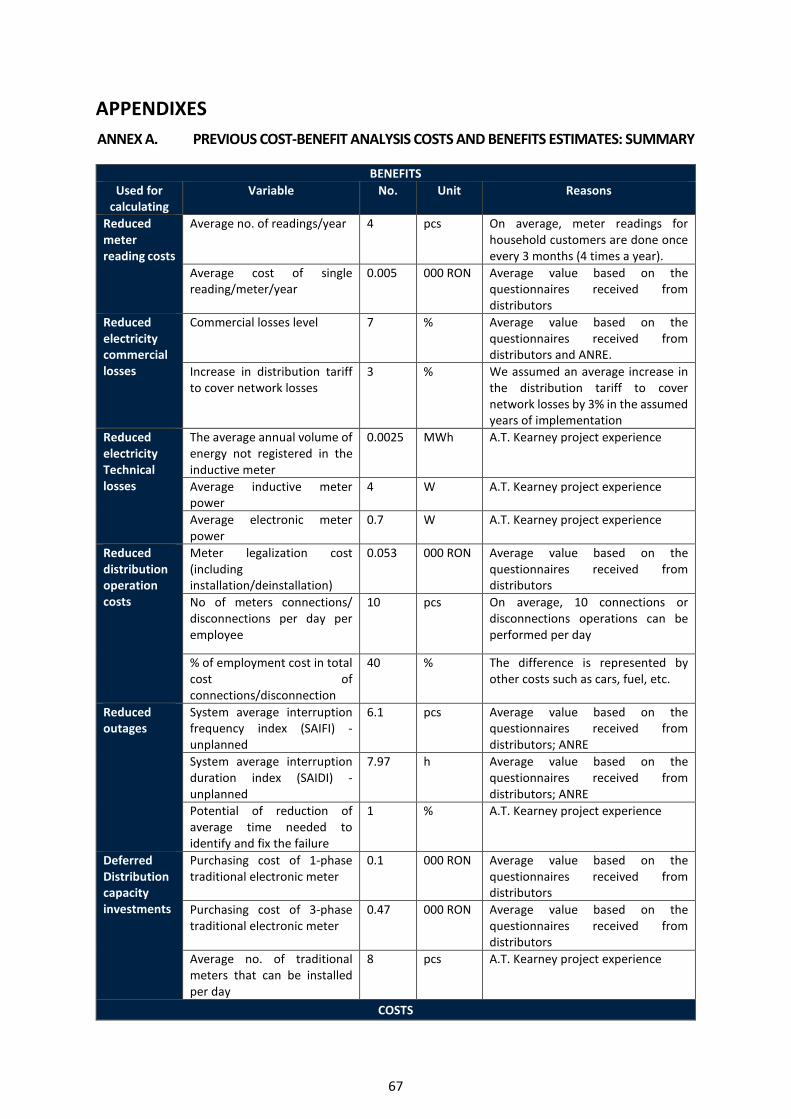
67
APPENDIXES ANNEX A. PREVIOUS COST-BENEFIT ANALYSIS COSTS AND BENEFITS ESTIMATES: SUMMARY
BENEFITS Used for
calculating Variable No. Unit Reasons
Reduced meter reading costs
Average no. of readings/year 4 pcs On average, meter readings for household customers are done once every 3 months (4 times a year).
Average cost of single reading/meter/year
0.005 000 RON Average value based on the questionnaires received from distributors
Reduced electricity commercial losses
Commercial losses level 7 % Average value based on the questionnaires received from distributors and ANRE.
Increase in distribution tariff to cover network losses
3 % We assumed an average increase in the distribution tariff to cover network losses by 3% in the assumed years of implementation
Reduced electricity Technical losses
The average annual volume of energy not registered in the inductive meter
0.0025 MWh A.T. Kearney project experience
Average inductive meter power
4 W A.T. Kearney project experience
Average electronic meter power
0.7 W A.T. Kearney project experience
Reduced distribution operation costs
Meter legalization cost (including installation/deinstallation)
0.053 000 RON Average value based on the questionnaires received from distributors
No of meters connections/ disconnections per day per employee
10 pcs On average, 10 connections or disconnections operations can be performed per day
% of employment cost in total cost of connections/disconnection
40 % The difference is represented by other costs such as cars, fuel, etc.
Reduced outages
System average interruption frequency index (SAIFI) - unplanned
6.1 pcs Average value based on the questionnaires received from distributors; ANRE
System average interruption duration index (SAIDI) - unplanned
7.97 h Average value based on the questionnaires received from distributors; ANRE
Potential of reduction of average time needed to identify and fix the failure
1 % A.T. Kearney project experience
Deferred Distribution capacity investments
Purchasing cost of 1-phase traditional electronic meter
0.1 000 RON Average value based on the questionnaires received from distributors
Purchasing cost of 3-phase traditional electronic meter
0.47 000 RON Average value based on the questionnaires received from distributors
Average no. of traditional meters that can be installed per day
8 pcs A.T. Kearney project experience
COSTS
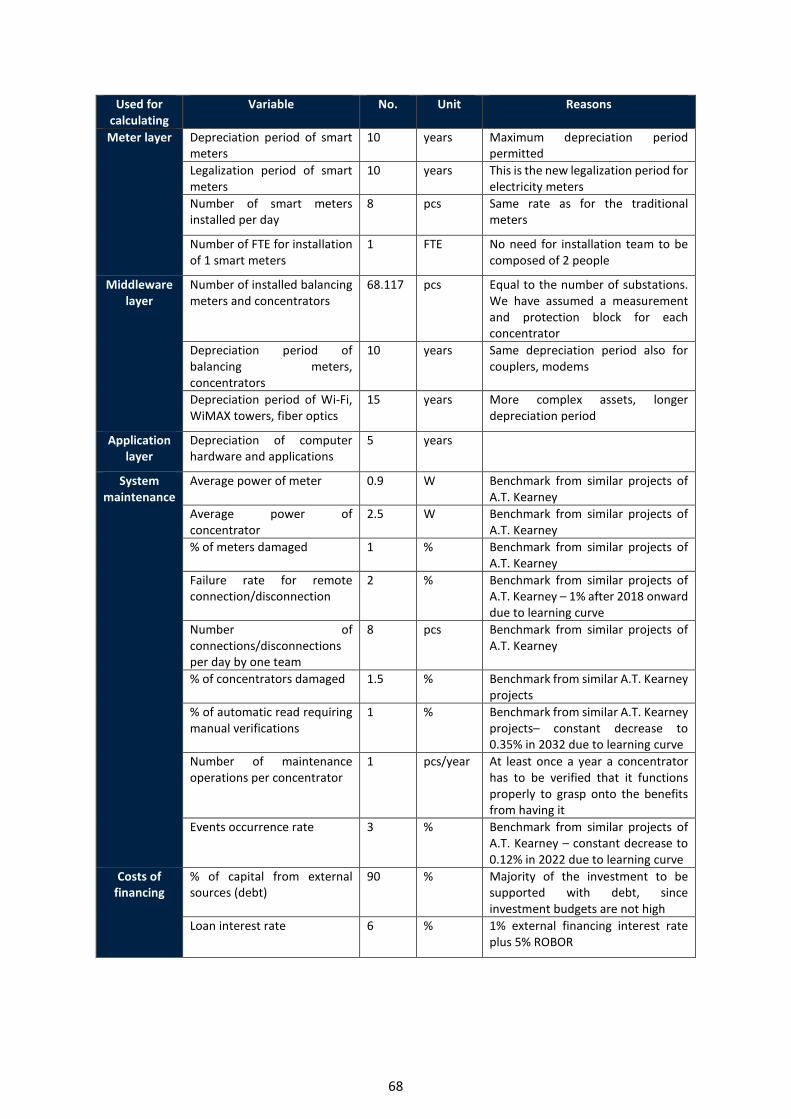
68
Used for calculating
Variable No. Unit Reasons
Meter layer Depreciation period of smart meters
10 years Maximum depreciation period permitted
Legalization period of smart meters
10 years This is the new legalization period for electricity meters
Number of smart meters installed per day
8 pcs Same rate as for the traditional meters
Number of FTE for installation of 1 smart meters
1 FTE No need for installation team to be composed of 2 people
Middleware layer
Number of installed balancing meters and concentrators
68.117 pcs Equal to the number of substations. We have assumed a measurement and protection block for each concentrator
Depreciation period of balancing meters, concentrators
10 years Same depreciation period also for couplers, modems
Depreciation period of Wi-Fi, WiMAX towers, fiber optics
15 years More complex assets, longer depreciation period
Application layer
Depreciation of computer hardware and applications
5 years
System maintenance
Average power of meter 0.9 W Benchmark from similar projects of A.T. Kearney
Average power of concentrator
2.5 W Benchmark from similar projects of A.T. Kearney
% of meters damaged 1 % Benchmark from similar projects of A.T. Kearney
Failure rate for remote connection/disconnection
2 % Benchmark from similar projects of A.T. Kearney – 1% after 2018 onward due to learning curve
Number of connections/disconnections per day by one team
8 pcs Benchmark from similar projects of A.T. Kearney
% of concentrators damaged 1.5 % Benchmark from similar A.T. Kearney projects
% of automatic read requiring manual verifications
1 % Benchmark from similar A.T. Kearney projects– constant decrease to 0.35% in 2032 due to learning curve
Number of maintenance operations per concentrator
1 pcs/year At least once a year a concentrator has to be verified that it functions properly to grasp onto the benefits from having it
Events occurrence rate 3 % Benchmark from similar projects of A.T. Kearney – constant decrease to 0.12% in 2022 due to learning curve
Costs of financing
% of capital from external sources (debt)
90 % Majority of the investment to be supported with debt, since investment budgets are not high
Loan interest rate 6 % 1% external financing interest rate plus 5% ROBOR

69
ANNEX B. PREVIOUS COST-BENEFIT ANALYSIS BENEFITS ESTIMATES – DETAILED
Benefits Remarks Assumption Unit
Amount of energy delivered Consolidated questionnaire answers 19,226,013
Amount of energy delivered - HV MWh
Consolidated questionnaire answers 25,597,284
Amount of energy delivered - MV MWh Consolidated questionnaire answers 18,849,284
Amount of energy delivered - LV MWh
Forecasts tariffs and consumption evolution Calculation
Cost - benefits to be included in tariff 000 RON
Calculation Result = 3%
Impact on tariff - increase due to smart metering
000 RON/MWh
Research
Distribution tariff 1 RON/MWh Research
Distribution tariff evolution without smart metering
2 RON/MWh
Calculation
Distribution tariff evolution - final, after smart metering
3 RON/MWh
Calculation
Consumption increase forecast baseline (LV)
MWh
AT Kearney project experience
Consumption decrease based on smart meters installation (due to red in theft)
MWh
Calculation
New consumption expected evolution MWh
Length of network power lines Calculation
HV km
Consolidated questionnaire answers 326
cable km Consolidated questionnaire answers 23,556
overhead power lines km
Calculation
MV km Consolidated questionnaire answers 28,041
cable km
Consolidated questionnaire answers 91,257
overhead power lines km Calculation
LV km
Consolidated questionnaire answers 61,491
cable km Consolidated questionnaire answers 216,958
overhead power lines km
Number of meters Calculation
Total number of meters pcs
Consolidated questionnaire answers 8,248,264 0.50% Number of 1-phase meters pcs Consolidated questionnaire answers 850,757 0.50% Number of 3-phase meters pcs Calculation
Number of induction meters replaced by traditional electronic meters in current year
pcs
Assumption
50% Number of induction meters pcs Calculation
Number of electronic meters pcs
Network losses and forecasts Consolidated questionnaire answers 7% Commercial network losses % Consolidated questionnaire answers 12% Network technical losses % Calculation
Commercial network losses MWh
Calculation
Network technical losses MWh Reduction in commercial losses MWh
OPCOM
Electricity price in the wholesale market (bilateral contracts)
000 RON/MWh

70
OPCOM
Electricity price on the next day (spot market)
000 RON/MWh
Calculation
Distribution tariff evolution
Calculation
Energy price to cover network technical loss (approved by regulator)
000 RON/MWh
Calculation
10% Energy price to cover network technical loss (real)
000 RON/MWh
Electrical substations and transformers Consolidated questionnaire answers 715
Number of HV electrical substations pcs
Consolidated questionnaire answers 68,117
Number of MV electrical substations pcs Consolidated questionnaire answers 1,687
Number of transformers HV/MV pcs
Consolidated questionnaire answers 41,265
Number of transformers MV/LV pcs Consolidated questionnaire answers 30,317
Distribution transformers pcs
Consolidated questionnaire answers 545,909 10.00 Number of connections/disconnections pcs Network failures and quality of energy
? Ask ANRE
Number of LV lines' failures pcs ? Ask ANRE
Number of MV/LV transformers' failures
pcs
Consolidated questionnaire answers 8
Average powercut time - LV lines h Assumption 16
Average powercut time - MV/LV transformers
h
? Ask ANRE
Unsupplied energy - LV network MWh ? Ask ANRE
Average time needed to identify location of failure
h
? Ask ANRE
Average time needed to identify location of failure
h
Reading costs Consolidated questionnaire answers 0.0047
Average cost of single reading 000 RON
4
Average number of readings per meter per year
pcs
Number of mandatory manual reads per year (imposed by regulator)
pcs
Communication failure rate %
Meter purchasing & certification costs Consolidated questionnaire answers 0.0530
Meter certification cost (including installation & deinstallation)
000 RON/pc
Calculation
Traditional meter installation cost 000 RON/pc Consolidated questionnaire answers 0.1000
Purchasing cost of 1-phase electronic meter
000 RON/pc
Consolidated questionnaire answers 0.4700
Purchasing cost of 3-phase electronic meter
000 RON/pc
Data to be obtained Benchmarks
Percentage of meters not suitable for re-certification
%
Employment costs 000 RON

71
Assumptions on benefits
Energy not recorded by the inductive meters AT Kearney project experience 0.0250
The average annual energy consumption not recorded on the connection
MWh
Influence of implementation on acceleration of the identification of failure location Assumption
Target potential reduction of average low-voltage line fault identification time
%
Assumption
Target potential reduction of identification of failure of a MV/LV transformer average time
%
Reduction of network losses Calculation
Net amount of distributed energy (w/o commercial and technical losses)
MWh
Calculation
Net amount of commercial losses (after decrease)
MWh
Calculation
Amount of technical losses following the reduction in commercial losses
MWh
Reduced technical losses % Based on reduction of commercial losses
Reduced technical losses MWh
Assumption
60% Reduced commercial losses % Assumptions regarding expenses
Input
Measurement layer
The rate of meters exchange % Percentage of meters for which in-house displays are installed
%
Middle layer Number of meters for which one concentrator is installed
pcs
Average cost of a coupler 000 RON
Application layer The number of CPUs of databases’ host servers
pcs
Total number of CPUs of middleware host servers
pcs
Number of licenses for the operating system
pcs
Percent of purchased database licenses in a given year
%
Percent of purchased middleware licenses in a given year
%
Percent of purchased operating system's licenses in a given year
%
Installation costs of computer equipment as a percentage of price
%
Unit cost of operating system license 000 RON Unit price of license maintenance - database
000 RON
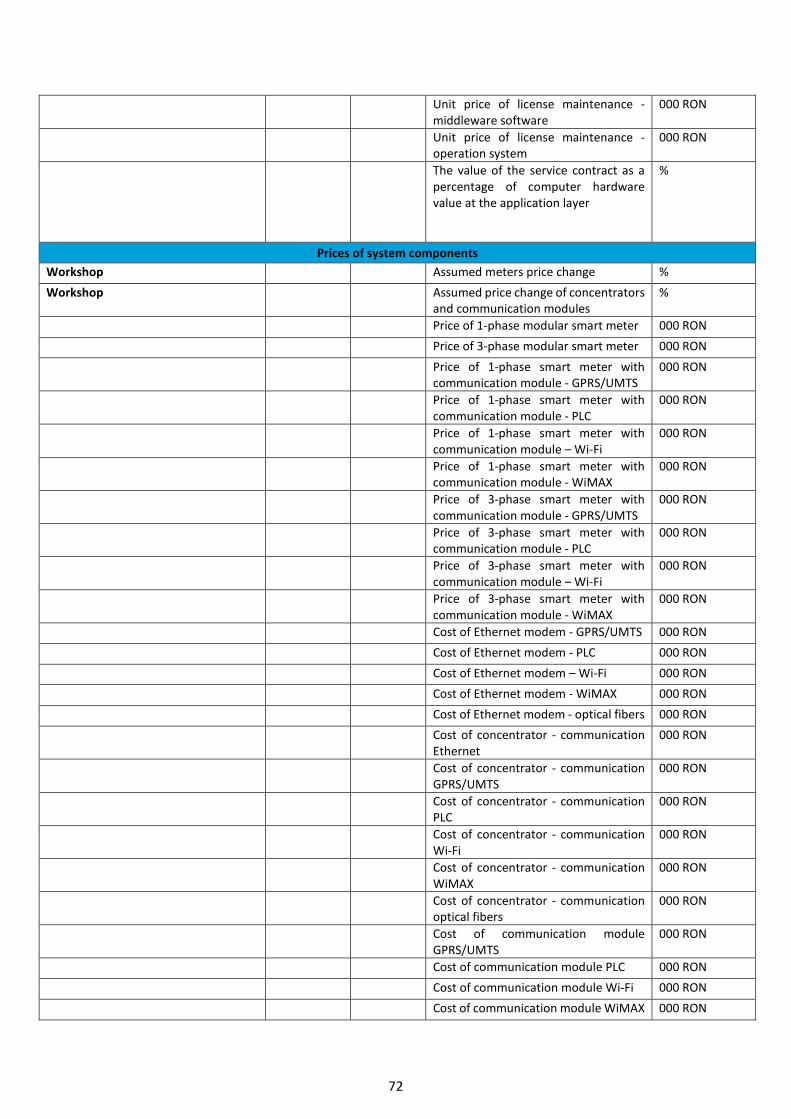
72
Unit price of license maintenance - middleware software
000 RON
Unit price of license maintenance - operation system
000 RON
The value of the service contract as a percentage of computer hardware value at the application layer
%
Prices of system components Workshop
Assumed meters price change %
Workshop
Assumed price change of concentrators and communication modules
%
Price of 1-phase modular smart meter 000 RON Price of 3-phase modular smart meter 000 RON Price of 1-phase smart meter with communication module - GPRS/UMTS
000 RON
Price of 1-phase smart meter with communication module - PLC
000 RON
Price of 1-phase smart meter with communication module – Wi-Fi
000 RON
Price of 1-phase smart meter with communication module - WiMAX
000 RON
Price of 3-phase smart meter with communication module - GPRS/UMTS
000 RON
Price of 3-phase smart meter with communication module - PLC
000 RON
Price of 3-phase smart meter with communication module – Wi-Fi
000 RON
Price of 3-phase smart meter with communication module - WiMAX
000 RON
Cost of Ethernet modem - GPRS/UMTS 000 RON Cost of Ethernet modem - PLC 000 RON Cost of Ethernet modem – Wi-Fi 000 RON Cost of Ethernet modem - WiMAX 000 RON Cost of Ethernet modem - optical fibers 000 RON Cost of concentrator - communication Ethernet
000 RON
Cost of concentrator - communication GPRS/UMTS
000 RON
Cost of concentrator - communication PLC
000 RON
Cost of concentrator - communication Wi-Fi
000 RON
Cost of concentrator - communication WiMAX
000 RON
Cost of concentrator - communication optical fibers
000 RON
Cost of communication module GPRS/UMTS
000 RON
Cost of communication module PLC 000 RON Cost of communication module Wi-Fi 000 RON Cost of communication module WiMAX 000 RON

73
Cost of balancing smart meter 000 RON Unit cost of a measurement and protection block for the concentrator
000 RON
Unit cost of a database license 000 RON Unit cost of Enterprise class server - quad core
000 RON
Unit cost of Enterprise class server - dual core
000 RON
Unit cost of disk space 000 RON Unit cost of tape library 000 RON Unit cost of switch 000 RON Cost of in home display 000 RON
Prices of data transfer - meters layer Assumption AT
Kearney benchmark
Expected period of renegotiation of contracts - data transfer
years
Assumption AT Kearney benchmark
Assumed change rate of data transfer prices
%
Calculation
Assumed change rate of data transfer prices as a percentage of last year's prices
%
Data transfer price GPRS/UMTS 000 RON Data transfer price PLC S-FSK 000 RON Data transfer price Wi-Fi 000 RON Data transfer price WiMAX 000 RON
Prices of data transfer - concentrator layer Data transfer price GPRS 000 RON Data transfer price PLC 000 RON Data transfer price UMTS 000 RON Data transfer price WiMAX 000 RON Data transfer price sDSL 000 RON
The costs of maintenance contracts The value of the application maintenance as a percentage of applications
%
The value of the service contract as a percentage of computer equipment
%
Energy used by measurement system AT Kearney project experience
4 The average power of the traditional
inductive meter W
AT Kearney project experience
0.7 Average power of the traditional electronic meter
W
AT Kearney project experience
0.9 Average power of smart meter with communications module
W
AT Kearney project experience
2.5 Average power of concentrator W Employment costs
AT Kearney research
10% Percentage of readings requiring manual readings/verifications
%

74
Project management costs Assumption 75% of
wage level Non-wage project costs per every job (e.g., travel costs)
000 RON
Professional services 000 RON Costs of construction and maintenance of telecommunications infrastructure
Construction of 1 km of fiber optic line on HV line
Construction of 1 km of fiber optic line on MV line
Cost of maintenance of 1 km of fiber optic line
Construction of the tower and base station WiMAX
Maintenance of the tower and base station WiMAX
Reservation WiMAX frequency (average for one tower)
Cost of construction of Wi-Fi access point
Unreliability of meters AT Kearney
Percentage of modular smart meters undergoing failures
%
AT Kearney
Percentage of concentrators undergoing failures
%
Warranties of meters years of concentrators years
1.0552 Assumptions about depreciation
Info to be obtained
Depreciation methods years 10 Meters and metering equipment -
depreciation method years
10 Communication modules - depreciation
method years
10 Concentrators - depreciation method years
5 Application depreciation method years 5 Computer hardware - depreciation
method years
10 Server room - depreciation method years 15 Fiber optics - depreciation method years 15 Tower and base stations WiMAX -
depreciation method years
10 Adaptation of MV/LV years 15 Constructing a telecommunications
infrastructure – Wi-Fi years
10 Balancing meters years
Learning curve (logistic) 73%

75
ANNEX C. BENEFITS TYPES AND METRICS USED AS PART OF THE PILOT STUDIES
Benefit types Metrics Reduction of costs of meter reading per customer - RCcc
Meter reading costs after installing smart meters
Meter reading costs before installing smart meters [lei/client/year]
Reduction of costs with interventions at consumption places - RCintlc
Intervention costs [lei/client] at consumption places after installing smart meters – for disconnections /reconnections
Intervention costs [lei/client] at consumption places before installing smart meters - for disconnections/reconnections
Reduction of commercial CPT – RCPTcom Value of commercial CPT after installing smart meters [%] Value of commercial CPT before installing smart meters [%] Reduction of technical CPT – RCPTth Value of technical CPT before installing smart meters [%] Value of technical CPT before installing smart meters [%] Reduction of the duration of interruptions in electricity supply (to the consumer) - Redd_nealim
Average Network (System) Disruption Duration Index after the implementation of SM [min/year]
Average Network (System) Disruption Duration Index before the implementation of SM [min/year]
Reduction of the number of complaints regarding measurement errors - Redrecler_mas
The annual average number of complaints regarding measurement errors registered after installing SM
The annual average number of complaints regarding measurement errors registered before installing SM
Number of identifications of contracted system wattage exceeding recorded measurement(s) after installing SMS - NR_depPcontr
Number of identifications of voltage variations beyond the accepted limits - NR.idvar_Un

76
ANNEX D. SOURCES FOR COST-BENEFIT ANALYSIS IN OTHER EUROPEAN COUNTRIES
Country Section in this report
Year Source
Germany 2.1 2013 Ernst & Young, “Cost-benefit analysis for the comprehensive use of smart metering. On behalf of the Federal Ministry of Economics and Technology”
UK 2.2 2014 Department of Environment and Climate Change, “Smart meter rollout for the domestic and small and medium non-domestic sectors
(GB): Impact Assessment”
Netherlands 2.3 2010
2008
KEMA, “Smart meters in the Netherlands: Revised financial analysis and policy advice”
Frontier Economics, “Research into the costs of smart meters for electricity and gas DSOs -
A report prepared for Energiekamer”
Ireland 2.4 2011 PWC, “NSMP (Electricity & Gas) Cost Benefit Analysis”
Hungary 2.5 2015 AF Mercados, “Study on cost benefit analysis of smart metering systems in EU Member States”
France 2.6 2011 Commission de Régulation de l’Energie, “Délibération de la Commission de régulation de l’énergie du 7 juillet 2011 portant communication sur les résultats de
l’expérimentation d’Electricité Réseau Distribution France (ERDF) relative au dispositif de comptage évolué Linky”
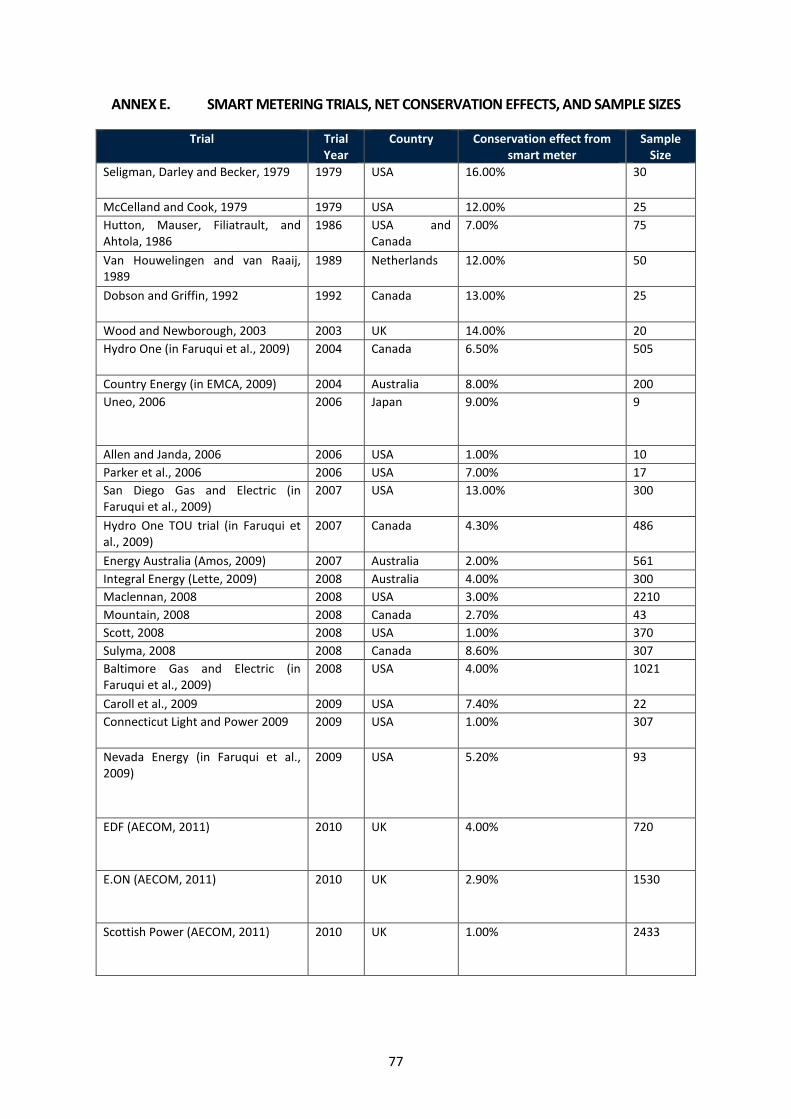
77
ANNEX E. SMART METERING TRIALS, NET CONSERVATION EFFECTS, AND SAMPLE SIZES
Trial Trial Year
Country Conservation effect from smart meter
Sample Size
Seligman, Darley and Becker, 1979 1979 USA 16.00% 30
McCelland and Cook, 1979 1979 USA 12.00% 25 Hutton, Mauser, Filiatrault, and Ahtola, 1986
1986 USA and Canada
7.00% 75
Van Houwelingen and van Raaij, 1989
1989 Netherlands 12.00% 50
Dobson and Griffin, 1992 1992 Canada 13.00% 25
Wood and Newborough, 2003 2003 UK 14.00% 20 Hydro One (in Faruqui et al., 2009) 2004 Canada 6.50% 505
Country Energy (in EMCA, 2009) 2004 Australia 8.00% 200 Uneo, 2006 2006 Japan 9.00% 9
Allen and Janda, 2006 2006 USA 1.00% 10 Parker et al., 2006 2006 USA 7.00% 17 San Diego Gas and Electric (in Faruqui et al., 2009)
2007 USA 13.00% 300
Hydro One TOU trial (in Faruqui et al., 2009)
2007 Canada 4.30% 486
Energy Australia (Amos, 2009) 2007 Australia 2.00% 561 Integral Energy (Lette, 2009) 2008 Australia 4.00% 300 Maclennan, 2008 2008 USA 3.00% 2210 Mountain, 2008 2008 Canada 2.70% 43 Scott, 2008 2008 USA 1.00% 370 Sulyma, 2008 2008 Canada 8.60% 307 Baltimore Gas and Electric (in Faruqui et al., 2009)
2008 USA 4.00% 1021
Caroll et al., 2009 2009 USA 7.40% 22 Connecticut Light and Power 2009 2009 USA 1.00% 307
Nevada Energy (in Faruqui et al., 2009)
2009 USA 5.20% 93
EDF (AECOM, 2011) 2010 UK 4.00% 720
E.ON (AECOM, 2011) 2010 UK 2.90% 1530
Scottish Power (AECOM, 2011) 2010 UK 1.00% 2433

78
SSE (AECOM, 2011) 2010 UK 3.60% 1701
Western Power/Synergy 2011 Australia 2200
Memphis Light, Gas and Water (Peacock, 2011)
2011 USA 500
SP Ausnet (EMCA, 2009) 2011 Australia 1000 Minnesota Power (US Department of Energy, 2011)
2012 USA 4000
Origin Energy (De Bortoli, 2009) 2012 Australia 5000 Nevada Energy (Greentech Media, 2011)
2015 USA 20000
Source: Torriti, J. (2015). Peak Energy Demand and Demand Side Response, Routledge

79
ANNEX F. INTEROPERABILITY: ISSUES FOR RIA
Background
One issue that emerges as extremely relevant to the successful implementation of smart meters in Romania consists of the interoperability of smart meters. Interoperability can be defined as the ability of a system to exchange data with other systems of different types. In other EU countries, RIAs on the implementation of a smart meter rollout (i.e., calendar) have often been coupled with or followed by RIAs on the impacts of different information communication technologies (ICT).
This appendix sets out the problem definition, potential options, issues related to the comparison of options and methods associated with a RIA on different interoperability options.
Problem definition
The current plans for smart metering rollout in Romania do not envisage how core smart metering functionalities will be achieved and do not set targets for interoperability. However, different interoperability levels associated with smart metering technology will trigger different impacts in terms of costs and benefits for a variety of stakeholders including distribution system operators (DSOs), electricity retailers, smart metering manufacturers, ICT companies, and end-users. The interoperability of systems and devices will be a driving factor in determining the success of the Romanian smart metering rollout program.
From a regulator perspective, the national rollout of smart meters lends itself to questions of how interoperability will be achieved. In regard to interoperability, the EC Recommendation 2012/148/EU defines three core smart metering functionalities: (i) provide readings directly to the customer and any third party designated by the consumer; (ii) update the readings frequently enough to allow the information to be used to achieve energy savings; and (iii) support advanced tariff systems. Member States will need to consider which interfaces enable the achievement of these interoperability functionalities, as suits the relevant market arrangements and associated costs and benefits. In principle, the functionalities might be achieved through interface standards defined by regulation, but also without the need for regulatory intervention (e.g., through self-regulation).
The problem facing ANRE is how to achieve functionalities for interoperability in an effective and sustainable manner for the Romanian electricity market.
In order to ensure sustainable levels of interoperability, ANRE needs to (i) identify available options for interoperability; (ii) review technologies and applications associated with standards for interoperability; (iii) assess the impacts of different options; (iv) consider market and non-market stakeholder opinions on different standards; and (v) decide whether or not to intervene through regulation, self-regulation, or other means.
A separate RIA on different options for interoperability as part of the national rollout of smart meters in Romania would seek to assess the costs, benefits, and risks associated with each interoperability option.
Causes
The EU Third Package underlines the importance of ensuring the interoperability of the intelligent metering systems by defining functionalities. However, it is up to Member States to define which interfaces should support the delivery of these functionalities. The European Commission suggests
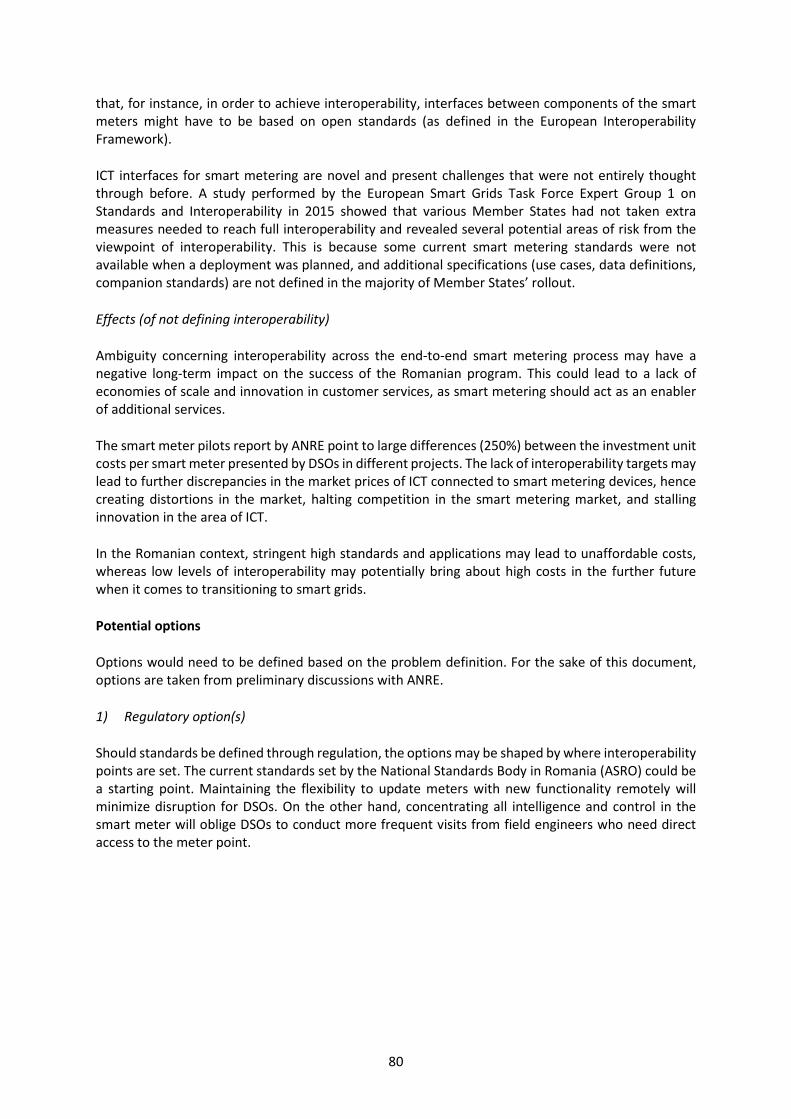
80
that, for instance, in order to achieve interoperability, interfaces between components of the smart meters might have to be based on open standards (as defined in the European Interoperability Framework).
ICT interfaces for smart metering are novel and present challenges that were not entirely thought through before. A study performed by the European Smart Grids Task Force Expert Group 1 on Standards and Interoperability in 2015 showed that various Member States had not taken extra measures needed to reach full interoperability and revealed several potential areas of risk from the viewpoint of interoperability. This is because some current smart metering standards were not available when a deployment was planned, and additional specifications (use cases, data definitions, companion standards) are not defined in the majority of Member States’ rollout.
Effects (of not defining interoperability)
Ambiguity concerning interoperability across the end-to-end smart metering process may have a negative long-term impact on the success of the Romanian program. This could lead to a lack of economies of scale and innovation in customer services, as smart metering should act as an enabler of additional services.
The smart meter pilots report by ANRE point to large differences (250%) between the investment unit costs per smart meter presented by DSOs in different projects. The lack of interoperability targets may lead to further discrepancies in the market prices of ICT connected to smart metering devices, hence creating distortions in the market, halting competition in the smart metering market, and stalling innovation in the area of ICT.
In the Romanian context, stringent high standards and applications may lead to unaffordable costs, whereas low levels of interoperability may potentially bring about high costs in the further future when it comes to transitioning to smart grids.
Potential options
Options would need to be defined based on the problem definition. For the sake of this document, options are taken from preliminary discussions with ANRE.
1) Regulatory option(s)
Should standards be defined through regulation, the options may be shaped by where interoperability points are set. The current standards set by the National Standards Body in Romania (ASRO) could be a starting point. Maintaining the flexibility to update meters with new functionality remotely will minimize disruption for DSOs. On the other hand, concentrating all intelligence and control in the smart meter will oblige DSOs to conduct more frequent visits from field engineers who need direct access to the meter point.
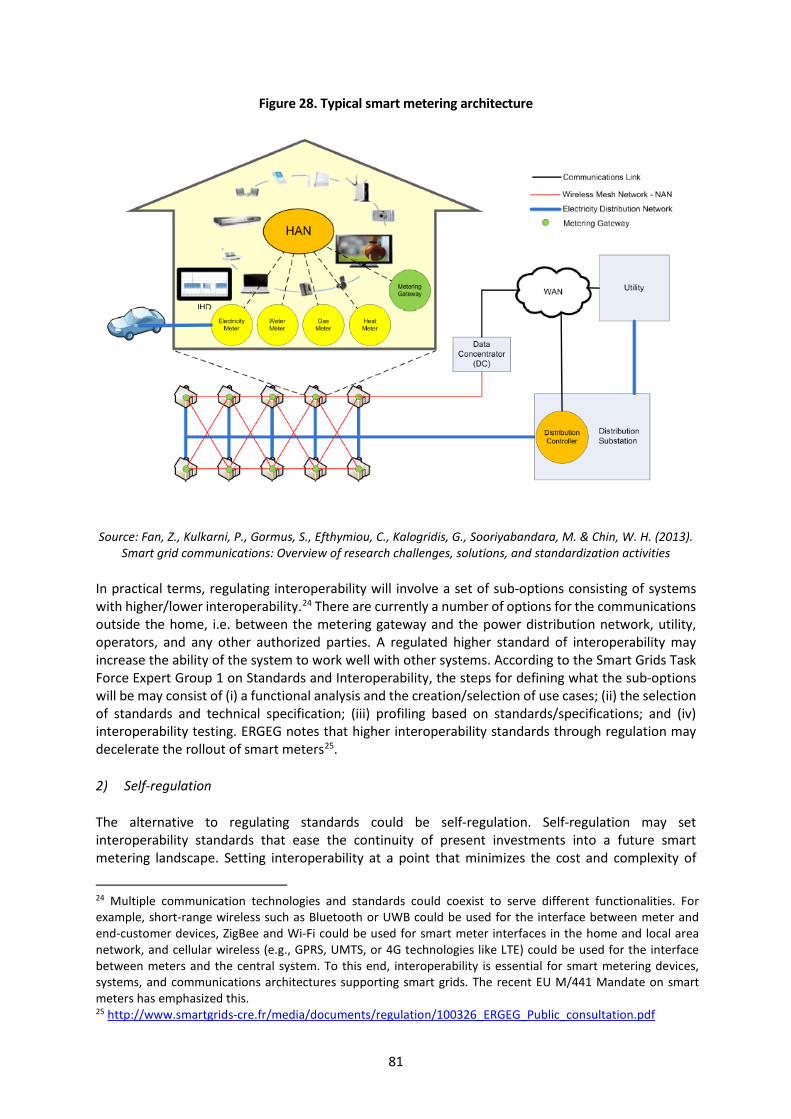
81
Figure 28. Typical smart metering architecture
Source: Fan, Z., Kulkarni, P., Gormus, S., Efthymiou, C., Kalogridis, G., Sooriyabandara, M. & Chin, W. H. (2013). Smart grid communications: Overview of research challenges, solutions, and standardization activities
In practical terms, regulating interoperability will involve a set of sub-options consisting of systems with higher/lower interoperability.24 There are currently a number of options for the communications outside the home, i.e. between the metering gateway and the power distribution network, utility, operators, and any other authorized parties. A regulated higher standard of interoperability may increase the ability of the system to work well with other systems. According to the Smart Grids Task Force Expert Group 1 on Standards and Interoperability, the steps for defining what the sub-options will be may consist of (i) a functional analysis and the creation/selection of use cases; (ii) the selection of standards and technical specification; (iii) profiling based on standards/specifications; and (iv) interoperability testing. ERGEG notes that higher interoperability standards through regulation may decelerate the rollout of smart meters25.
2) Self-regulation
The alternative to regulating standards could be self-regulation. Self-regulation may set interoperability standards that ease the continuity of present investments into a future smart metering landscape. Setting interoperability at a point that minimizes the cost and complexity of
24 Multiple communication technologies and standards could coexist to serve different functionalities. For example, short-range wireless such as Bluetooth or UWB could be used for the interface between meter and end-customer devices, ZigBee and Wi-Fi could be used for smart meter interfaces in the home and local area network, and cellular wireless (e.g., GPRS, UMTS, or 4G technologies like LTE) could be used for the interface between meters and the central system. To this end, interoperability is essential for smart metering devices, systems, and communications architectures supporting smart grids. The recent EU M/441 Mandate on smart meters has emphasized this. 25 http://www.smartgrids-cre.fr/media/documents/regulation/100326_ERGEG_Public_consultation.pdf
82
compliance with the final framework may become the main criterion. Under self-regulation, it is likely that every DSO will aspire to see the knowledge and capital it invested in the pilots carried over into its national rollout plans. In the search for a compromise through self-regulation, however, DSOs will need to come together to recognize that definitions of interoperability standards should not solely address short-term cost protection. They will also need to safeguard the industry against the longer-term costs of upgrading the smart meter network to incorporate smart grid capability.
3) Do nothing
Under the ‘do nothing’ option, smart meters will be rolled out in Romania according to the three common minimum functionalities of interoperability for smart metering systems recommended by the EC (Recommendation 2012/148/EU) and defined in principal for electricity metering. These are generally in line with available and coming standards and target the empowerment of the final customer. However, the Smart Grid Task Force encouraged the use of additional or companion specifications that describe how standards or technical specifications are applied to support the requirements of national infrastructure.
Comparison of the options
Cost-benefit analysis
Carrying out a full societal cost-benefit analysis of the options will be challenging for three reasons. First, the self-regulation option may require strong assumptions concerning which standards will be agreed upon among DSOs and which volumes of smart metering implementation will occur. Second, for options regulating standards, the costs may be highly uncertain, especially in relation to untested application profiles. Third, the benefits of different application profiles will be difficult to quantify and monetize unless some key benefits (e.g., more flexibility) are operationalized and strong assumptions are made around how these benefits materialize in the future (e.g., value of peak load shift in a smart grid).
Multicriteria analysis
A multicriteria analysis may be used in combination with a cost-benefit analysis as a way to take into account key criteria. Indicatively, criteria related to interoperability could consist of flexibility, innovation, competition, and cost-effectiveness.

83
Competența face diferența!/Competence makes a difference!
Proiect selectat în cadrul Programului Operațional Capacitate Administrativă cofinanțat de Uniunea Europeană, din Fondul Social European Project selected under the Administrative Capacity Operational Program, co-financed by European Union from the European Social Fund