impact 2011 2899 - designing high performance straight through processes using ibm business process...
TRANSCRIPT

1
Jeff Brent, Senior Technical Product Manager Brian M. Petrini, Senior IT Architect
Session Number: TBI-2899 - Designing High Performance Straight through Processes using IBM BPM

IBM Software Group
© 2008 IBM Corporation 2 4/18/11 Performance
Contributors
Kim Clark Andy Garratt Weiming Gu Gary Hunt Chris Richardson Torsten Wilms
IBM Software Group
© 2008 IBM Corporation 3 4/18/11 Performance
Contents
Designing for Performance Parallelism Threads CPU Synchronous vs. Asynchronous Module granularity and placement Other common anti-patterns Key performance design points
IBM Software Group
© 2008 IBM Corporation
What is a Straight Through Process?
Business Processes that are completely automated and don’t require human intervention on the normal processing path
“An initiative used by companies in the financial world to optimize the speed at which transactions are processed. This is performed by allowing information that has been electronically entered to be transferred from one party to another in the settlement process without manually re-entering the same pieces of information repeatedly over the entire sequence of events.” – Investopedia
Applies to all industries
4 4/18/11 Performance
IBM Software Group
© 2008 IBM Corporation 5 4/18/11 Performance
What do we mean by “Performance”? What’s the measure?
Response time – How long do requests take to provide a response – It’s statistically impossible to guarantee a “maximum” response
– Requirement must express a typical response time, and/or a standard deviation, often expressed in “2SD” style – e.g. 95% of requests are within a particular range.
– Need to be clear whether inclusive of the availability figure. Throughput rate
– How many events can be completed in a given period of time
– Important to know the time window. e.g. per second, per hour
– If time window is large, may be open to batch optimisation (see next point) Batch end to end time
– We don’t care about the rate, or the response time, only the total throughput within a large window of time.
– Opportunities for staged processing. e.g. pre-processing of data, pre-caching, innovative parallelism, grid computing and more.

IBM Software Group
© 2008 IBM Corporation 6 4/18/11 Performance
“Designing” for performance. When and how much to optimise?
“Optimise last!” – "We should forget about small efficiencies, say about 97% of the time: premature optimization is
the root of all evil." (Knuth, Donald. Structured Programming with go to Statements, ACM Journal Computing Surveys, Vol 6, No. 4, Dec. 1974. p.268.)
– More recent reference: http://www.extremeprogramming.org/rules/optimize.html
Most performance recommendations will be in opposition to the idealised design
“Designing for performance” often compromises clarity Design with just a handful of key performance rules in your head. Change your design only when you’re sure there will be a problem. Compare cost of software maintenance against benefits in CPU/RAM cost.
How much do YOU cost compared to a CPU? Where is the bottleneck? Optimise that, and that alone, then look at the next
bottleneck. Don’t guess – work out the numbers. Anti-patterns lurk behind all the
obvious solutions.
IBM Software Group
© 2008 IBM Corporation 7 4/18/11 Performance
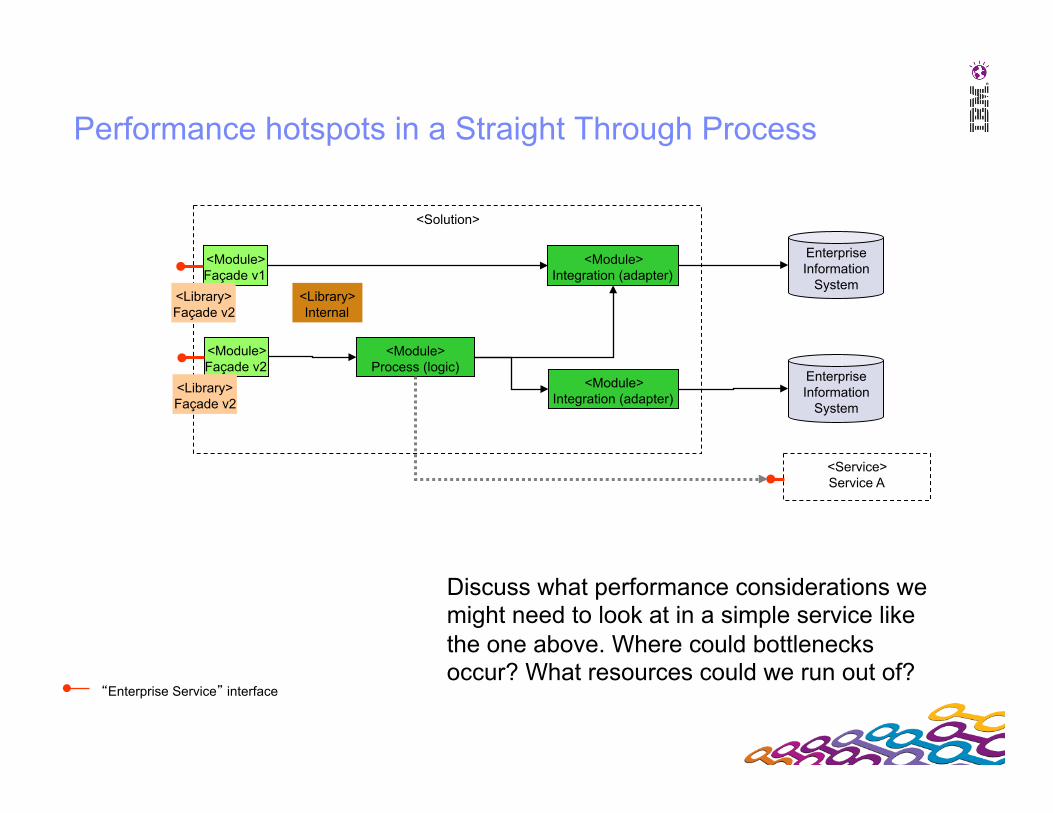
<Solution>
Performance hotspots in a Straight Through Process
Enterprise Information
System
<Module> Façade v1
<Library> Façade v2
<Library> Internal
“Enterprise Service” interface
<Module> Process (logic)
<Module> Integration (adapter)
Enterprise Information
System
<Module> Integration (adapter)
<Module> Façade v2
<Library> Façade v2
<Service> Service A
Discuss what performance considerations we might need to look at in a simple service like the one above. Where could bottlenecks occur? What resources could we run out of?

IBM Software Group
© 2008 IBM Corporation 8 4/18/11 Performance
Performance – What are the underlying constraints?
Lowest level constraints – CPU (number of cores, utilisation)
– Memory (physical RAM, paging)
– Threads (memory per thread, size of thread pools)
– Network (bandwidth, utilisation, shared resource with other systems)
– Disk read/write (IO speed, contention)
– Disk space (fragmentation, queue depths)
Dependant systems – Database (query performance, optimisation, low level constraints)
– Back-end system performance
IBM Software Group
© 2008 IBM Corporation 9 4/18/11 Performance
Slow target systems The most common “apparent” middleware performance issue
Generally, solution performance issues are caused by slow targets.
– Response times for the consumer are usually blamed on the middleware, but infact are as a result of slow response times in the target system.
– If middleware CPU is low, check the backend response times before anything else.
Slow targets have other effects too. – They put pressure on system resources in the middleware layer:
memory, threads, disk space (queues).
– Low CPU in middleware might not be something to celebrate if your queues are filling up or you’re running out of threads/memory.
IBM Software Group
© 2008 IBM Corporation 10
4/18/11 Performance
Design the performance test Any performance test must be representative of the final solution. It has to be “designed”, not just hacked together
Things to look out for: – Volumes – Peak concurrency of requests – Events arriving in batches rather than trickle fed – Object sizes
What do we test with? – Rational Test Suite
– Opensource/shareware/freeware etc. – JMeter: Good, simple, and free tool for seting up high volume on web service tests – SOAPGUI – Slightly more sophisticated than JMeter, especially around input data. – SOAPUI (http://www.soapui.org)
– Common IBM competitors – HP (was Mercury Interactive) – Loadrunner, Winrunner, Quicktest Pro
IBM Software Group
© 2008 IBM Corporation 11
4/18/11 Performance
Contents
Designing for Performance Parallelism Threads CPU Synchronous vs. Asynchronous Module granularity and placement Other common anti-patterns Key performance design points

IBM Software Group
© 2008 IBM Corporation 12
4/18/11 Performance
What’s so good about parallelism?
Advantages – If slow things are done in parallel, they finish faster as a whole.
Disadvantages – To do things in parallel, you need lots of workers (threads)
– Workers need a base salary (non-work related CPU), office space (memory), and basic amenities (disk space, network i/o)
– Each time they start or end work, they take time to get organised (thread creation, initial class loading, serialistation/deserialisation, process re-activation).
– When they’re working, they compete with one another over resources (CPU, network, memory, disk, connections). They aren’t necessarily considerate!
Summary – When parallel running, the slow things take even longer individually, and use more
resources, but they may as a whole finish slightly faster.
– Only go parallel when there is a definite need. Don’t do it “just because you can”.
IBM Software Group
© 2008 IBM Corporation 13
4/18/11 Performance
Parallelism in WebSphere Process Server
BPEL long running - when does a process itself go parallel? – Parallel scope - only goes parallel on long running processes – ForEach. Explicit choice of parallel or serial
– Can be configured to wait for less than all responses. e.g. a condition. – What happens to the terminated branches?
If the process was previously short running… – Huge hit in performance from serialisation – Consider implications of lost transactional participation – Understand risks if you have implicitly introduced sync/async switching
Short running processes – Parallel scopes do not actually run in parallel in short running processes.
One way invocations from short running BPEL – Should we configure the invoke with “Call” or “Commit”? How does that effect
reliability? What if there’s a combination of one and (synchronous) two-way calls?
Mediation Flow Component – Fan-In and Fan-Out
IBM Software Group
© 2008 IBM Corporation 14
4/18/11 Performance
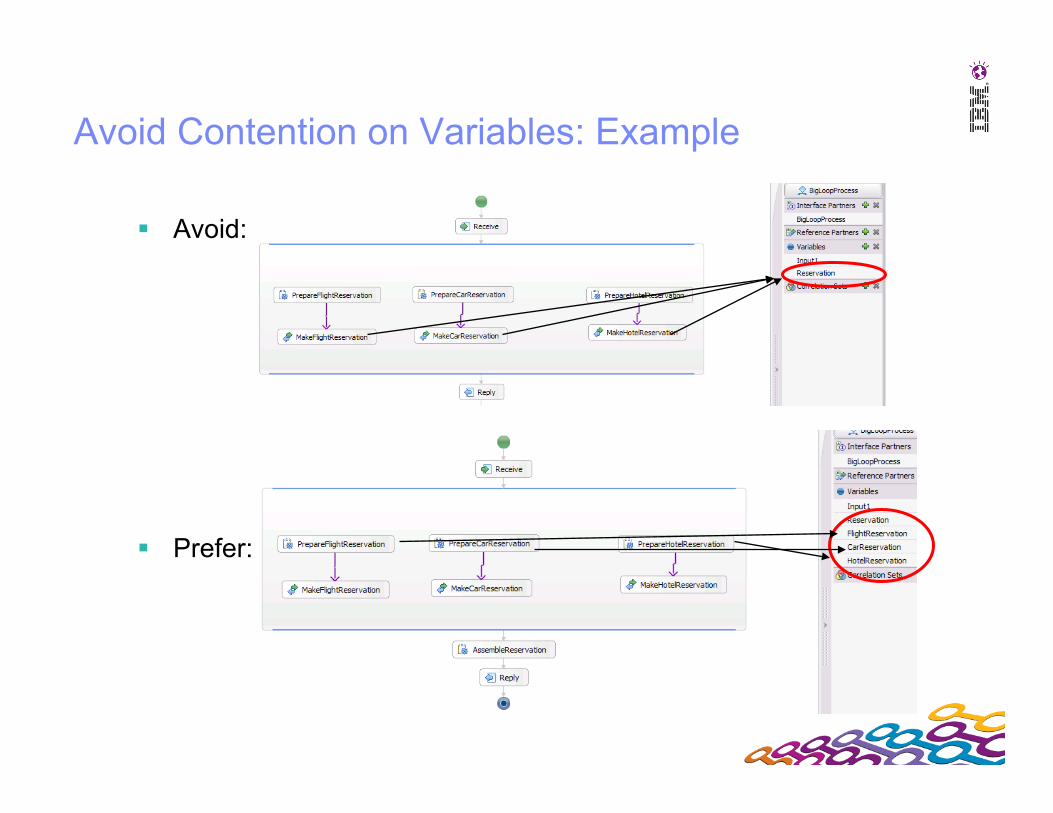
Avoid Contention on Variables: Example
Avoid:
Prefer:

IBM Software Group
© 2008 IBM Corporation 15
4/18/11 Performance
Parallel/serial assessment for read-only requests
Serial Synchronous Invocations
Service calls dependant upon one another
Backend response times <100
milliseconds (ms)
Start here
Backend response times >10 seconds
Backend response
times 100ms –
10 seconds
Aggregate serial
response time would be <SLA
Aggregate serial
response time would be >SLA
Parallel Synchronous Invocations
Parallel Asynchronous
Invocations
Service calls not dependant
upon one another
Note: This would need to be a long running process and asynchronously exposed if the aggregate time is > 10 seconds. Otherwise could be short running.
Note: These would always have to be long running processes as short running processes cannot perform parallelism. If the aggregate time is >10 seconds, they should be asynchronously exposed.
Please note that this ONLY applies to the simpler case of READ-ONLY requests Also, please see caveats on next slide

IBM Software Group
© 2008 IBM Corporation 16
4/18/11 Performance
Parallel/serial assessment for read-only requests diagram Caveats
Durations used are illustrative and will vary depending on factors affecting the overall profile of the implementation
– Threads: High request rates will result in greater concurrency and therefore require a higher number of threads. The 10 second duration has been chosen as the maximum amount of time we would want threads to be blocked, and therefore above this figure we are suggesting that the overall service, and/or the requests to the back ends should be made asynchronous in order to free up threads. At high requests rates this figure might need to be considerably lower.
– CPU: For parallelism to have any overall beneficial effect the time spent waiting for back end systems needs to be orders of magnitude longer than the time spent in WPS, or the bottleneck will become the WPS CPU. As an example, message size will affect the amount of CPU used in WPS/WESB due to serialisation to and from external data formats, and also serialisation to the message layer and BPC database. The 100 millisecond (ms) duration is meant to represent the amount of time that might be spend in serialisation for a medium sized message. For particularly large message sizes network bandwidth and disk speeds might also become limiting factors.
– Distribution curve: The 10 second and 100 ms are assumed to be the average. Clearly if the distribution curve is broad, we may need to increase/reduce these values accordingly.
IBM Software Group
© 2008 IBM Corporation 17
4/18/11 Performance
Contents
Designing for Performance Parallelism Threads CPU Synchronous vs. Asynchronous Module granularity and placement Other common anti-patterns Key performance design points
IBM Software Group
© 2008 IBM Corporation 18
4/18/11 Performance
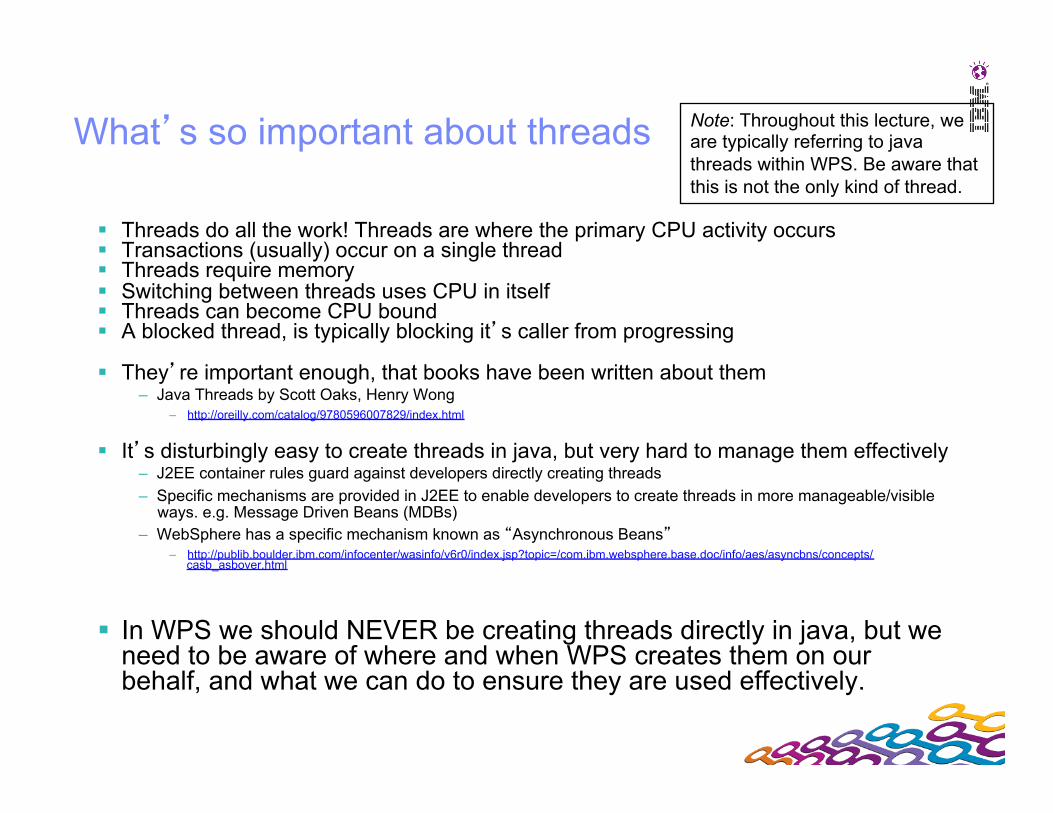
What’s so important about threads
Threads do all the work! Threads are where the primary CPU activity occurs Transactions (usually) occur on a single thread Threads require memory Switching between threads uses CPU in itself Threads can become CPU bound A blocked thread, is typically blocking it’s caller from progressing
They’re important enough, that books have been written about them – Java Threads by Scott Oaks, Henry Wong
– http://oreilly.com/catalog/9780596007829/index.html
It’s disturbingly easy to create threads in java, but very hard to manage them effectively – J2EE container rules guard against developers directly creating threads – Specific mechanisms are provided in J2EE to enable developers to create threads in more manageable/visible
ways. e.g. Message Driven Beans (MDBs) – WebSphere has a specific mechanism known as “Asynchronous Beans”
– http://publib.boulder.ibm.com/infocenter/wasinfo/v6r0/index.jsp?topic=/com.ibm.websphere.base.doc/info/aes/asyncbns/concepts/casb_asbover.html
In WPS we should NEVER be creating threads directly in java, but we need to be aware of where and when WPS creates them on our behalf, and what we can do to ensure they are used effectively.
Note: Throughout this lecture, we are typically referring to java threads within WPS. Be aware that this is not the only kind of thread.
IBM Software Group
© 2008 IBM Corporation 19
4/18/11 Performance
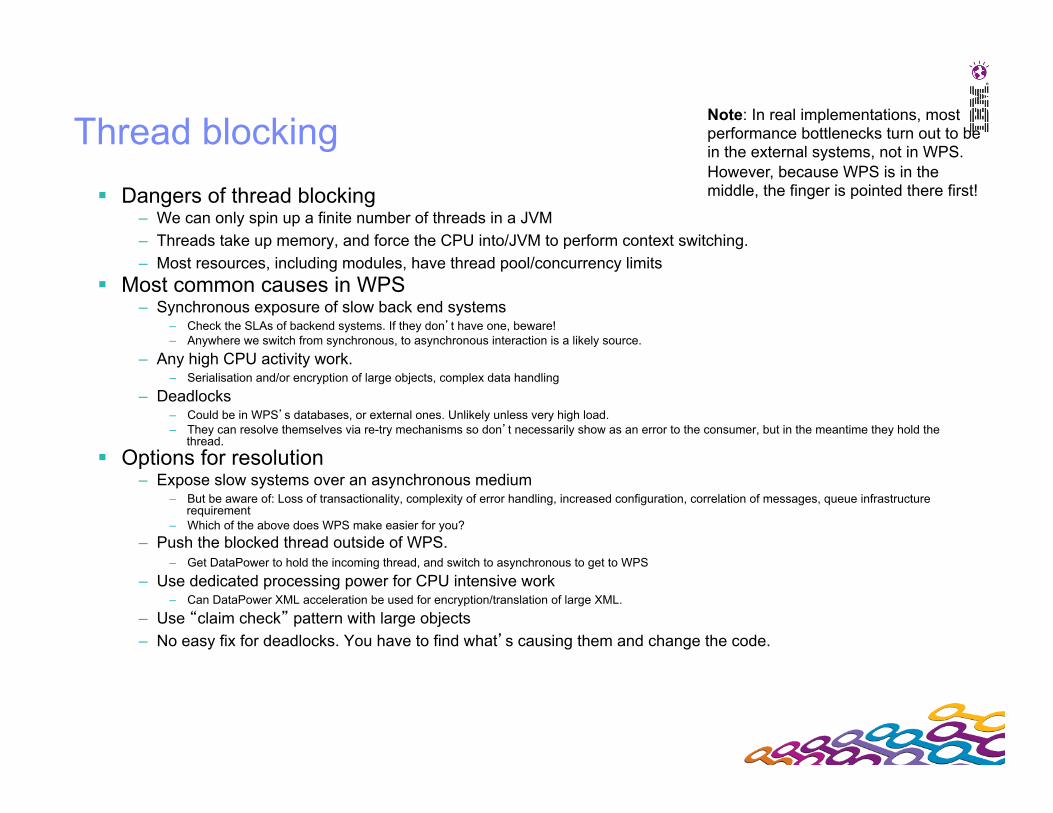
Thread blocking Dangers of thread blocking
– We can only spin up a finite number of threads in a JVM – Threads take up memory, and force the CPU into/JVM to perform context switching. – Most resources, including modules, have thread pool/concurrency limits
Most common causes in WPS – Synchronous exposure of slow back end systems
– Check the SLAs of backend systems. If they don’t have one, beware! – Anywhere we switch from synchronous, to asynchronous interaction is a likely source.
– Any high CPU activity work. – Serialisation and/or encryption of large objects, complex data handling
– Deadlocks – Could be in WPS’s databases, or external ones. Unlikely unless very high load. – They can resolve themselves via re-try mechanisms so don’t necessarily show as an error to the consumer, but in the meantime they hold the
thread. Options for resolution
– Expose slow systems over an asynchronous medium – But be aware of: Loss of transactionality, complexity of error handling, increased configuration, correlation of messages, queue infrastructure
requirement – Which of the above does WPS make easier for you?
– Push the blocked thread outside of WPS. – Get DataPower to hold the incoming thread, and switch to asynchronous to get to WPS
– Use dedicated processing power for CPU intensive work – Can DataPower XML acceleration be used for encryption/translation of large XML.
– Use “claim check” pattern with large objects – No easy fix for deadlocks. You have to find what’s causing them and change the code.
Note: In real implementations, most performance bottlenecks turn out to be in the external systems, not in WPS. However, because WPS is in the middle, the finger is pointed there first!

IBM Software Group
© 2008 IBM Corporation 20
4/18/11 Performance
Where do threads come from in WPS?
Web Container thread pool – For all incoming external HTTP requests
Orb thread pool – For all incoming external RMI requests
Default thread pool – A pool used by many aspects of WPS for SIBus message initiated work
Message Listener Service thread pool – A pool used by external message initiated work such as MQ.
IBM Software Group
© 2008 IBM Corporation 21
4/18/11 Performance
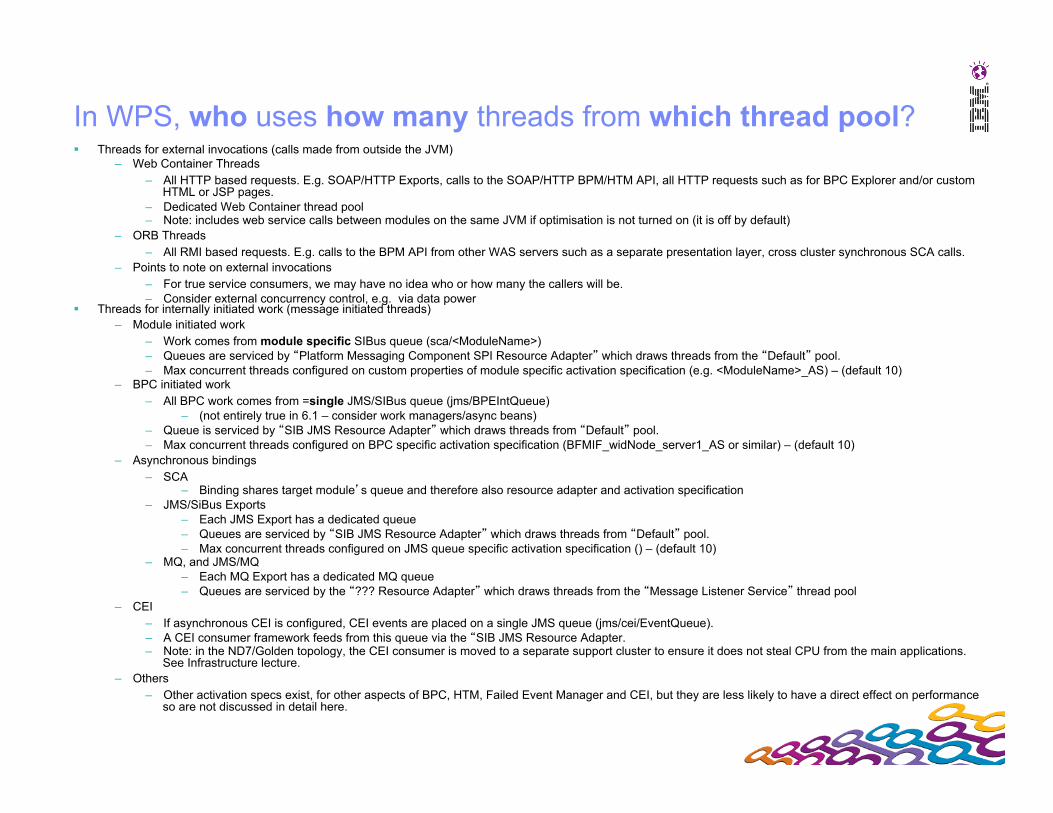
In WPS, who uses how many threads from which thread pool? Threads for external invocations (calls made from outside the JVM)
– Web Container Threads – All HTTP based requests. E.g. SOAP/HTTP Exports, calls to the SOAP/HTTP BPM/HTM API, all HTTP requests such as for BPC Explorer and/or custom
HTML or JSP pages. – Dedicated Web Container thread pool – Note: includes web service calls between modules on the same JVM if optimisation is not turned on (it is off by default)
– ORB Threads – All RMI based requests. E.g. calls to the BPM API from other WAS servers such as a separate presentation layer, cross cluster synchronous SCA calls.
– Points to note on external invocations – For true service consumers, we may have no idea who or how many the callers will be. – Consider external concurrency control, e.g. via data power
Threads for internally initiated work (message initiated threads) – Module initiated work
– Work comes from module specific SIBus queue (sca/<ModuleName>) – Queues are serviced by “Platform Messaging Component SPI Resource Adapter” which draws threads from the “Default” pool. – Max concurrent threads configured on custom properties of module specific activation specification (e.g. <ModuleName>_AS) – (default 10)
– BPC initiated work – All BPC work comes from =single JMS/SIBus queue (jms/BPEIntQueue)
– (not entirely true in 6.1 – consider work managers/async beans) – Queue is serviced by “SIB JMS Resource Adapter” which draws threads from “Default” pool. – Max concurrent threads configured on BPC specific activation specification (BFMIF_widNode_server1_AS or similar) – (default 10)
– Asynchronous bindings – SCA
– Binding shares target module’s queue and therefore also resource adapter and activation specification – JMS/SiBus Exports
– Each JMS Export has a dedicated queue – Queues are serviced by “SIB JMS Resource Adapter” which draws threads from “Default” pool. – Max concurrent threads configured on JMS queue specific activation specification () – (default 10)
– MQ, and JMS/MQ – Each MQ Export has a dedicated MQ queue – Queues are serviced by the “??? Resource Adapter” which draws threads from the “Message Listener Service” thread pool
– CEI – If asynchronous CEI is configured, CEI events are placed on a single JMS queue (jms/cei/EventQueue). – A CEI consumer framework feeds from this queue via the “SIB JMS Resource Adapter. – Note: in the ND7/Golden topology, the CEI consumer is moved to a separate support cluster to ensure it does not steal CPU from the main applications.
See Infrastructure lecture. – Others
– Other activation specs exist, for other aspects of BPC, HTM, Failed Event Manager and CEI, but they are less likely to have a direct effect on performance so are not discussed in detail here.

IBM Software Group
© 2008 IBM Corporation 22
4/18/11 Performance
Thread Anti-pattern: Contention on the “default” thread pool
Business Process Engine (BPE) max concurrency too high – If the max concurrency on the MDB for the BPE is set too high, it may take
all threads in the default thread pool, potentially starving threads from other asynchronous resources, such as asynchronous SCA requests and callbacks.
Resolution – Reduce the number of concurrent threads allowed for the BPE
– Create a dedicated thread pool for the BPE

IBM Software Group
© 2008 IBM Corporation 23
4/18/11 Performance
Anti-pattern: Slow synchronous invocations hogging asynchronous threads
Scenario Asynchronously initiated requests from a single pool of threads Requests call various back end systems synchronously Some of the systems are significantly slower than others OR one of the systems is
intermittently slow
What happens…? The slow requests hog all threads most of the time, and hence block the faster
calls from being processed. Requests that should have completed quickly are throttled to the speed of the slowest calls.
The simplest thread blocking anti-pattern in the world!
Slow System Th
Th
Th Fast System
Thread Pool
Queue
Solution: Increase the number of threads, and/or assign a dedicated thread pool for the slow requests

IBM Software Group
© 2008 IBM Corporation 24
4/18/11 Performance
Anti-pattern: Slow synchronous invocations hogging asynchronous threads (continued)
That’d never happen to me! …Just how easily can this happen in WPS?
Examples when exposing services:
– An asynchronous export (e.g. JMS or MQ) exposing synchronous back end system with highly variable response times.
– This results in messages that could have completed quickly being held behind those that do not. Very problematic if the caller’s SLA is response time based as ALL queued requests will appear slow rather than those that are occasionally held by the backend system.
– An asynchronous export (e.g. JMS or MQ) exposing more than one operation, each operation wired to a different synchronous back end system.
– The slow backend system results in unrelated operations calling other back end systems being held up
Examples with processes: – BPEL process templates making synchronous requests to occasionally slow back end systems
– All threads in the BPC may end up awaiting slow responses, with none available to do other work. Results in poor CPU utilisation, and disproportionately slow process progression.
– A long running BPEL process template making optional synchronous calls to a slow back end system.
– Can result in all instances waiting for threads to free up from the slow back end, even if they do not call. – Effects not just the current template, but all templates in the BPC – as discussed in the previous example.
Watch out… – …when reducing the number of modules for performance reasons – you might give yourself a performance problem! – …when an asynchronous export exposes more than one operation – do the operations go to differently performing synchronous systems – …when asynchronously exposing a synchronously called back end system with an unreliable SLA – all requests may suffer – …when long running BPEL calls back end systems synchronously – may hog threads from other templates in the container
IBM Software Group
© 2008 IBM Corporation 25
4/18/11 Performance
Anti-pattern: Slow synchronous invocations hogging asynchronous threads (continued)
Solution Options for WPS: Change the way the backend system exposes itself from synchronous to asynchronous
– e. g. provide an MQ interface – This way no thread is held awaiting a response. – Be aware, this could introduce a new problem – see “Anti-Pattern: CPU Starvation with asynchronous activity” – Rare that you have the luxury of changing the back end system, especially since this way you push complex
asynchronous error handling to the backend – Typically customers look to WPS to perform such an asynchronous->synchronous switch, pushing the problem
back to us! Do the asynchronous to synchronous conversion in a runtime where threads are cheap,
– Like DataPower perhaps? Split by function or by backend into separate thread pools
– Have the functions go through different modules since each of these has separately controllable concurrency on the MDB.
– At least the fast calls will now get some thread time. The slow ones will of course still be slow, but on their own dedicated thread pool.
– Only works if you are able to predict based on the operation or data which calls will be slow. Split by requestor identity or request data to different thread sets
– If only some types of requests to a given back end system are slow, then this trick may mean that less unrelated requests get held behind the slow one. You need some way to set up multiple thread sets however.
– A refreshingly simple patented algorithm for spreading requests across multiple back end systems has been recorded by Richard Whyte et al. This can be used in some part toward resolution of this anti-pattern.
– http://www.wipo.org/pctdb/en/wo.jsp?wo=2005091134

IBM Software Group
© 2008 IBM Corporation 26
4/18/11 Performance
Thread Anti-pattern: Don’t forget to save some threads for responses! Problem
– Asynchronously initiated two way asynchronous requests use up all the threads in the module’s thread pool.
– The module hangs since there are no threads available to process the response messages.
– This specifically relates to the “deferred response” style of asynchronous interaction, especially when done from custom java code.
Solution – Increase the number of threads in the activation specification of the
module. But what if we want to limit the throughput? – Aim to code using the “callback” rather than “deferred response” type of
asynchronous interaction.
IBM Software Group
© 2008 IBM Corporation 27
4/18/11 Performance
Contents
Designing for Performance Parallelism Threads CPU Synchronous vs. Asynchronous Module granularity and placement Other common anti-patterns Key performance design points
IBM Software Group
© 2008 IBM Corporation 28
4/18/11 Performance
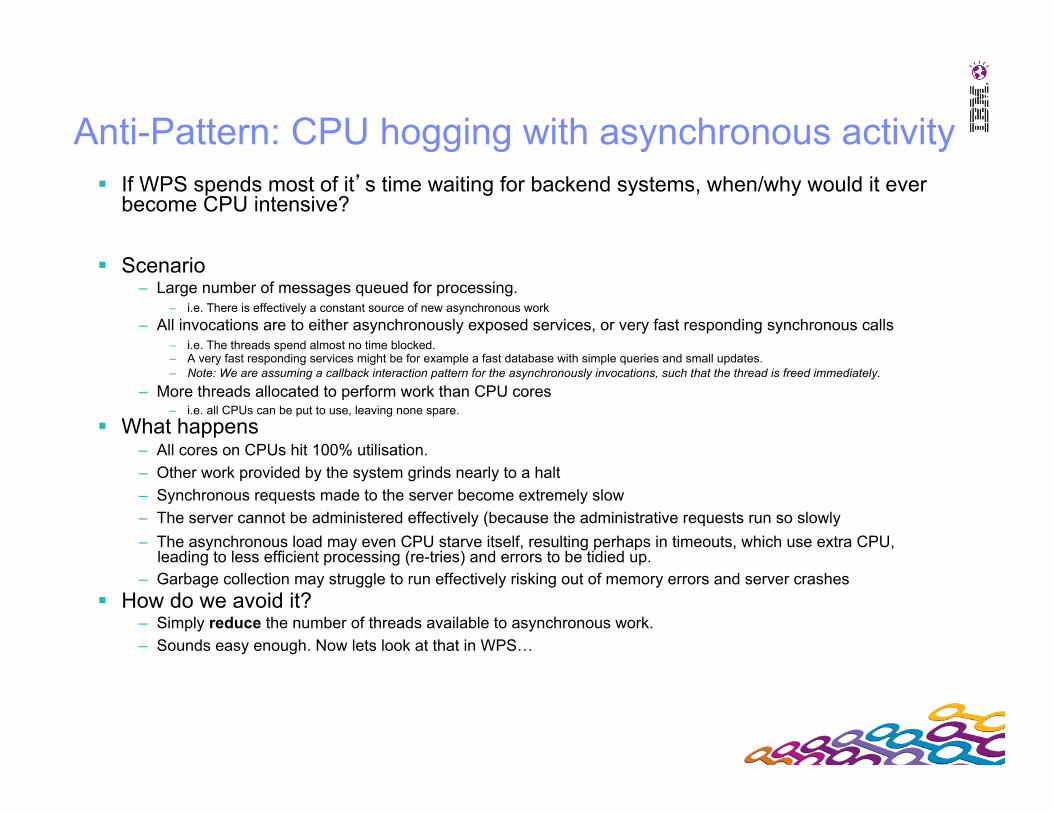
Anti-Pattern: CPU hogging with asynchronous activity If WPS spends most of it’s time waiting for backend systems, when/why would it ever
become CPU intensive?
Scenario – Large number of messages queued for processing.
– i.e. There is effectively a constant source of new asynchronous work – All invocations are to either asynchronously exposed services, or very fast responding synchronous calls
– i.e. The threads spend almost no time blocked. – A very fast responding services might be for example a fast database with simple queries and small updates. – Note: We are assuming a callback interaction pattern for the asynchronously invocations, such that the thread is freed immediately.
– More threads allocated to perform work than CPU cores – i.e. all CPUs can be put to use, leaving none spare.
What happens – All cores on CPUs hit 100% utilisation. – Other work provided by the system grinds nearly to a halt – Synchronous requests made to the server become extremely slow – The server cannot be administered effectively (because the administrative requests run so slowly – The asynchronous load may even CPU starve itself, resulting perhaps in timeouts, which use extra CPU,
leading to less efficient processing (re-tries) and errors to be tidied up. – Garbage collection may struggle to run effectively risking out of memory errors and server crashes
How do we avoid it? – Simply reduce the number of threads available to asynchronous work. – Sounds easy enough. Now lets look at that in WPS…
IBM Software Group
© 2008 IBM Corporation 29
4/18/11 Performance
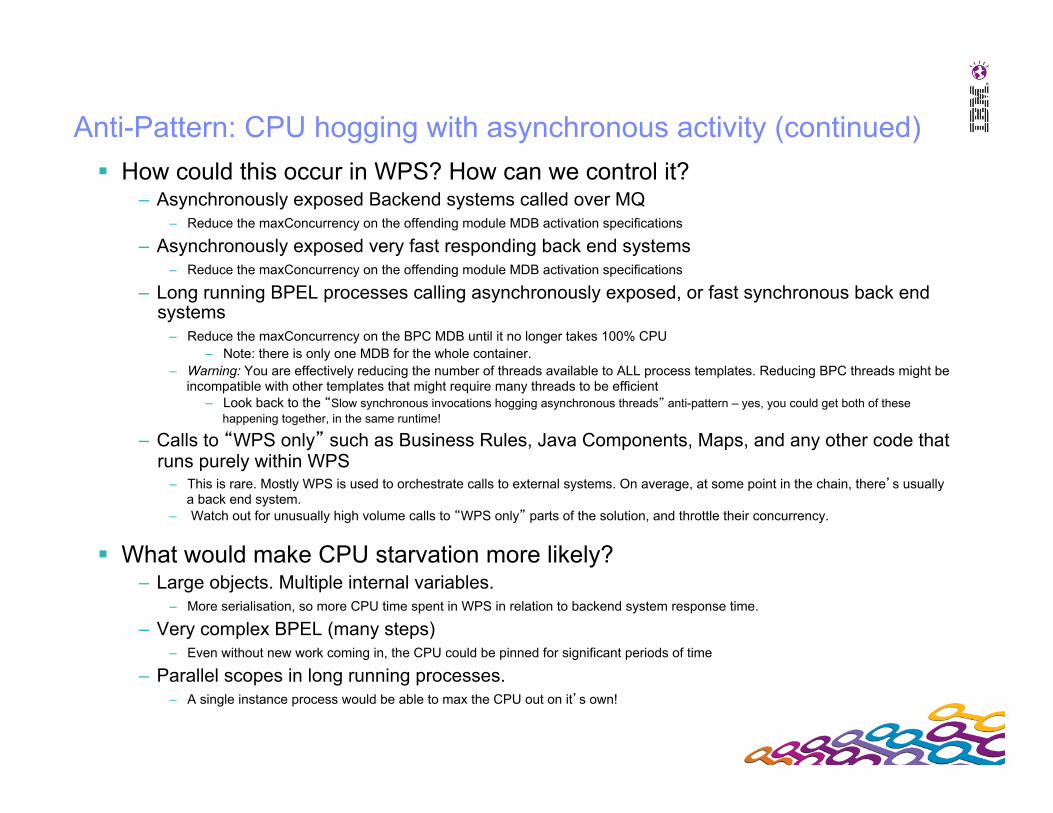
Anti-Pattern: CPU hogging with asynchronous activity (continued) How could this occur in WPS? How can we control it?
– Asynchronously exposed Backend systems called over MQ – Reduce the maxConcurrency on the offending module MDB activation specifications
– Asynchronously exposed very fast responding back end systems – Reduce the maxConcurrency on the offending module MDB activation specifications
– Long running BPEL processes calling asynchronously exposed, or fast synchronous back end systems
– Reduce the maxConcurrency on the BPC MDB until it no longer takes 100% CPU – Note: there is only one MDB for the whole container.
– Warning: You are effectively reducing the number of threads available to ALL process templates. Reducing BPC threads might be incompatible with other templates that might require many threads to be efficient
– Look back to the “Slow synchronous invocations hogging asynchronous threads” anti-pattern – yes, you could get both of these happening together, in the same runtime!
– Calls to “WPS only” such as Business Rules, Java Components, Maps, and any other code that runs purely within WPS
– This is rare. Mostly WPS is used to orchestrate calls to external systems. On average, at some point in the chain, there’s usually a back end system.
– Watch out for unusually high volume calls to “WPS only” parts of the solution, and throttle their concurrency.
What would make CPU starvation more likely? – Large objects. Multiple internal variables.
– More serialisation, so more CPU time spent in WPS in relation to backend system response time.
– Very complex BPEL (many steps) – Even without new work coming in, the CPU could be pinned for significant periods of time
– Parallel scopes in long running processes. – A single instance process would be able to max the CPU out on it’s own!

IBM Software Group
© 2008 IBM Corporation 30
4/18/11 Performance
What is/are the “Hungry Hippos” problem(s)?! For those who don’t know, hungry hippos is a kids game
– http://uk.youtube.com/watch?v=65fhH_Uzfp8 – You could think of Message Driven Beans as “hippos”, the centre play area is the “queue”, the marbles as the
messages arriving on the queue, and the kids as the CPUs!
Asynchronous process load takes all available CPU – Symptoms: All servers become CPU bound. All synchronous activity has very slow response times. – Cause: There is a continuous supply of asynchronous process based work, and there are more than enough of
threads available for that work – Result: BPC container MDB steals all available CPU. Other resources such as synchronous invocations have no CPU
priority. All synchronous response times are affected. Note: this includes not just servicing of synchronous service invocations, but also usage of HTM/BPC APIs for BPC Explorer, Business Space, admin console etc.
– Solution: Reduce the number of threads available to the BPC container MDB. Note that this is at the expense of the throughput rate of the process work.
– Other References: This is on instance of the “Anti-Pattern: CPU hogging with asynchronous activity” described in this (“Performance”) lecture.
– Hungry hippos analogy: When there’s a surplus of marbles, you can’t talk to the kids (make synchronous requests) because they’re constantly busy (with asynchronous work for the BPC container).
Unbalanced CPU load due to message engine placement – Symptoms: The cluster member with the co-located active messaging engine burns much more CPU than the other
cluster members – Cause: BPC Container co-located (same box) with the Messaging Engine. – Result: Asymmetric CPU usage. One server in the cluster becomes CPU bound (CPU=100%), other server’s CPUs
are idling. This results in poor response times to synchronous requests to one member of the cluster. – Solution: Ensure messaging engines are located in an independent tier (cluster) of physically separate servers.
See “Infrastructure Topologies” lecture for more. – Hungry hippos analogy: If someone tilts the table, then one kid gets really busy with all the marbles and the others sit
around yawning.
IBM Software Group
© 2008 IBM Corporation 31
4/18/11 Performance
Contents
Designing for Performance Parallelism Threads CPU Synchronous vs. Asynchronous Module granularity and placement Other common anti-patterns Key performance design points
IBM Software Group
© 2008 IBM Corporation 32
4/18/11 Performance
Synchronous/asynchronous comparisons - It’s all about the serialisation
Between JVMs, SCA asynchronous is just as fast as synchronous, since they both require serialisation.
The performance of asynchronous traffic isn’t affected by module, or JVM boundaries
– Serialisation is the bulk of the CPU.
If serialisation is involved, the differences between transport types are not a primary performance consideration
– SCA, JMS, JMS/MQ, MQ all take a similar hit on serialisation and persistence.

IBM Software Group
© 2008 IBM Corporation 33
4/18/11 Performance
How does serialisation affect the choice of component? Is a Mediation Flow Component (MFC) faster than short running
BPEL? Is an XSLT Transformation faster than a BO Map?
– Template instantiation has a slightly higher premium than a mediation – BPEL, and BO Maps always work with Business Objects so the XML is always has to
be parsed for it to enter the component. MFCs sometimes don’t parse the XML, so from that perspective can be faster if the data can arrive in XML form.
– SMOs within MFCs are “lazy parsed”, meaning they remain as XML for as long as possible, and not all parts are necessarily parsed. In general, if you don’t touch the body of the message in an MFC, it won’t be parsed. It’s a little subtle to know whether you have or not.

IBM Software Group
© 2008 IBM Corporation 34
4/18/11 Performance
Contents
Designing for Performance Parallelism Threads CPU Synchronous vs. Asynchronous Module granularity and placement Other common anti-patterns Key performance design points
IBM Software Group
© 2008 IBM Corporation 35
4/18/11 Performance
How many modules? Common reasons for multi-module solutions
– Code control is easiest with developers assigned to a whole module – Long running BPEL versioning patterns require module separation for dynamicity – More granular modules mean independent maintainability (stopping/replacing modules) – Unit of re-use is often seen to be at module level.
Issues with large numbers of modules – You can only fit so many in the finite JVMs memory – >100 EARs would be considered a large amount for J2EE implementations – Increases in the number of queues, resulting in slower server start-up – Inter-module communications are slower for synchronous. Even slower if inter-JVM.

IBM Software Group
© 2008 IBM Corporation 36
4/18/11 Performance
Performance impact of splitting a module Splitting on synchronous communication boundary
– Same JVM/cluster: x10 performance impact, and greater than doubling of memory – due to creating a reference in another class loader
– Different JVM/cluster: x100 performance impact and greater than doubling of memory – due to serialisation
Co-locate synchronously connected modules wherever possible
Splitting modules on asynchronous communication boundaries doesn’t have a CPU based performance effect. It does have a memory doubling effect.
– Serialisation was already present
– An additional module is created. The original class reference is dispensed when the call passed to the new module, so no net gain in classes loaded.
Split down asynchronous boundaries wherever possible
Please note: We are talking about x10 and x100 increases in the communication between components. Remember that the communication may only be a tiny proportion of the overall request time, so the overall performance degradation may be nowhere near as serious as these numbers may imply

IBM Software Group
© 2008 IBM Corporation 37
4/18/11 Performance
Cluster boundaries
Split across functional concern/domain. – Calls between functional domains should be rarer.
What about the separation of “business logic” and “integration logic” – This logical layer split is important to clarity in the design, re-use, maintainability and
many other key design reasons. However, that doesn’t mean it must be enforced physically with separate clusters. It can simply be enforced by good design standards.

IBM Software Group
© 2008 IBM Corporation 38
4/18/11 Performance
Contents
Designing for Performance Parallelism Threads CPU Synchronous vs. Asynchronous Module granularity and placement Other common anti-patterns Key performance design points
IBM Software Group
© 2008 IBM Corporation 39
4/18/11 Performance
Anti-pattern: Large objects – the issues Issues with large objects
– Memory – Multiple copies are made of an object as it passes through WPS. Not only would large objects take up memory, but they are also harder/slower to garbage collect.
– CPU – Serialisation is the biggest performance killer is serialisation. With large objects this is significantly exacerbated. Most of the data in a large object is most probably not required for the process or even integration logic. It is most probably being parsed/serialised for nothing. Available CPU pauses for long periods during garbage collection
– Data storage – Databases (persistent queues and BPC DB) require special tuning to be able to manage large objects, and to span large overall volumes. Increase query response time
– Network – Persistence of large objects takes network bandwidth
Common example – delivery of a PDF as an attachment in the response – why not publish it on a URL,
and just send the URL back to the caller.
Avoid sending data through WPS that it will never look at

IBM Software Group
© 2008 IBM Corporation 40
4/18/11 Performance
Anti-Pattern: Large Objects (Continued) – Recommendations
General points – WPS Performance Report suggests 5Mb as a limit, but even 1Mb would be ill advised. – XML tags expand the size of raw data by anything from 10 to 100 times. Factor that into your
calculation of object size. – Only sending the minimum data to a service call. e.g. don’t send whole customer, just the bits
needed – e.g. remove the contact history. – Making invocations synchronous will result in less serialisation points. – If you have a copy of the object, consider nulling out unnecessary parts of the object prior to the call. – Claim check pattern. Pass the large data to a data-store and retain only a key to the data. Pass only
the key through WPS. Pick up the data only when required – http://www.ibm.com/developerworks/websphere/library/techarticles/1006_kharlamov/1006_kharlamov.html
Product options – Break up large file (batch) outside of WPS
– Use custom data handler in FlatFile Adapter to split/aggregate file – Use simple operating system commands/scripts to split file prior to WPS (unix: grep, sed, awk,
etc.) – Database-database Extract Transform Load (ETL) is a different product space
– Consider WebSphere DataStage
IBM Software Group
© 2008 IBM Corporation 41
4/18/11 Performance
Anti-pattern: Single threading/synchronised methods
Problem – Multiple components/threads accessing a synchronised (single threaded) method,
or a single threaded backend resource.
Common examples – Shared logging/auditing routine, where slow string concatenation is performed as
part of the synchronised method, even though it doesn’t need to be single threaded.
– Shared database function e.g. Doing sequence numbering yourself rather than using the database’s native sequence number capabilities.
Solutions – Does it all have to happen immediately? Push what work you can to a queue and
handle it asynchronously.
– Minimise code in the shared method
– Push the work to be done, closer to the data. e.g. do multiple database calls in a stored procedure rather than as separate JDBC calls.
IBM Software Group
© 2008 IBM Corporation 42
4/18/11 Performance
Anti-pattern: Not using the “Batch Window” opportunity 60 per hour is not the same design problem as 1 per minute
Check the requirement for “batch window” opportunities – Just because the expressed it as a response time in seconds or throughput rate in events per minute, doesn’t
mean that’s the actual requirement. It may simply be that they need to get it all done between 1am and 6am. – For example, it might be acceptable to do 57 mins of data preparation then do the final calculations with clean
cached data in the last 3 minutes! Push large data manipulations as close to the data as possible.
– Don’t transform 1000 records from one table to another using WPS, write a database stored procedure to do it, and call that from WPS.
Parallelise the right thing – e.g. a slow external call. – Parallelism of the wrong activities may actually slow things down and the harder error handling is harder to
write. The performance of some of the systems involved may vary over time.
– Use them at their most efficient time if possible. Perhaps you can simulate it
– If you have WebSphere Business Modeller available, you could try simulating different approaches to the batch processing before you go anywhere near the detailed design or implementation
Don’t do ETL in WPS – If most of the requirements on the system are batch based, consider an Extract Transform Load (ETL) solution
such as WebSphere DataStage. See Redbook - Patterns: Building Serial and Parallel Processes for IBM WebSphere
Process Server V6 – http://www.redbooks.ibm.com/abstracts/sg247205.html – Specifically sections such as “12.2.3 Analysis of the design options [for parallel processes]”
IBM Software Group
© 2008 IBM Corporation 43
4/18/11 Performance
Anti-pattern: Exceptions on the normal path
Exceptions cost considerable CPU, and generation and propagation of stack traces uses an enormous amount of memory.
Exceptions must never be on the expected path, – If possible, errors should be “caught and reported” even on error paths
rather than propagated back up the call chain. – May be appropriate to turn them into a business fault.
Key example would be correlation exceptions in BPEL. – Ensure there is a “Receive” or “Event Handler” to receive any expected
events, even if they are not needed by the process.
– Look out for situations where an event might be deliver after it is expected, once we are no longer listening for it.
IBM Software Group
© 2008 IBM Corporation 44
4/18/11 Performance
Contents
Designing for Performance Parallelism Threads CPU Synchronous vs. Asynchronous Module granularity and placement Other common anti-patterns Key performance design points

IBM Software Group
© 2008 IBM Corporation 45
4/18/11 Performance
So what is the “handful” of key performance design points Application
Prefer short over long running BPEL – Can be order of magnitude difference
Avoid large objects – Consider “claim check” pattern
Prefer Synchronous over asynchronous – Can be order of magnitude difference – Always set preferred interaction type to sync if possible.
Design carefully around slow backend systems
– Insist on SLAs – Expose back end asynchronously
Module granularity – Group modules and components as coarse grained as
possible. – Inter-component, Inter-module, inter-JVM, inter-cell. Know
the differences between each – Mainly important for synchronous
Use coarse grained transactions – Provide code guidelines – BPEL – “Participates” , SCA – JoinTransaction=true,
SuspendTransaction=false – Reduce unnecessary async hops.
Infrastructure Use enterprise scale database
– Not Derby Use fast disk sub-system
– Fast databases need fast file systems Separate ME cluster
– Ensures even workload distribution Perform standard tunings
– Plan to make the standard tunings to the database, operating system, JVM, ORB etc.
– Don’t waste testing time on known issues. Plan to test with real volumes and re-tune
– Quiz the business for volumes early, it takes a long time to work them out.
– Test with real volumes – Plan to tune again as a result.
Yes, there’s a thousand more things we could put on the list, but remember: “Premature optimization is the root of all evil”!
If you want to do more, design and implement a representative sample application, and test it. Don’t guess! You WILL be wrong.
IBM Software Group
© 2008 IBM Corporation 46
4/18/11 Performance
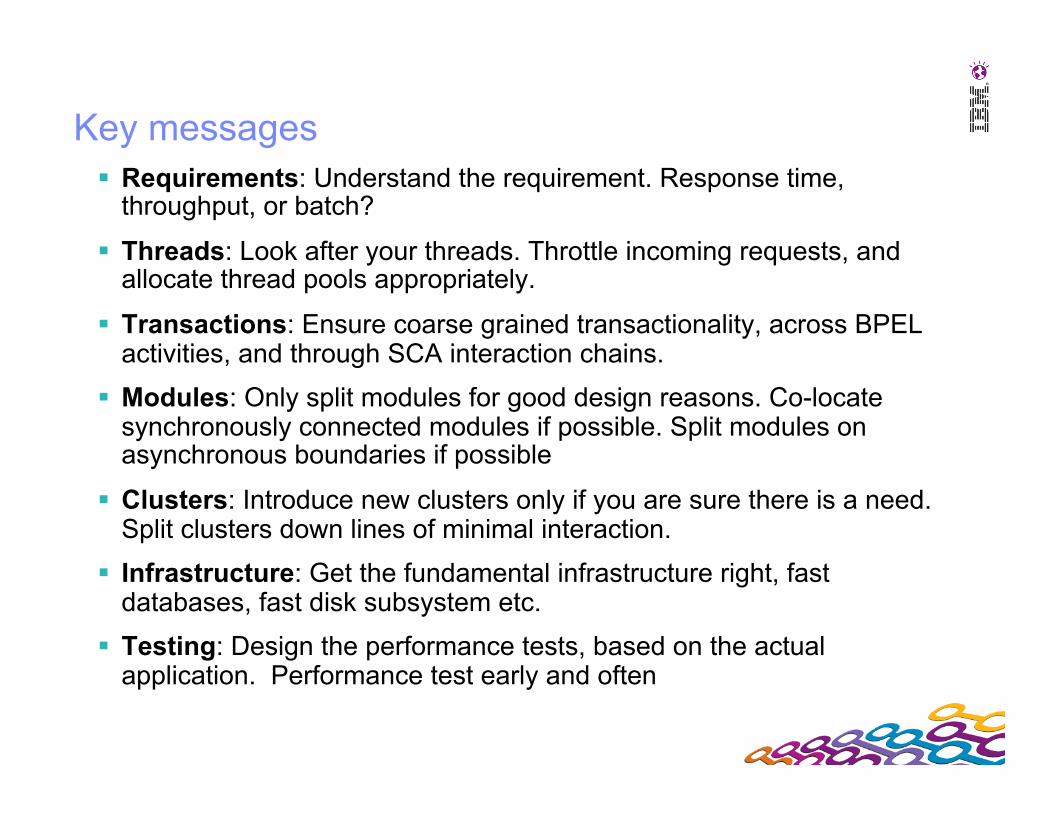
Key messages Requirements: Understand the requirement. Response time,
throughput, or batch?
Threads: Look after your threads. Throttle incoming requests, and allocate thread pools appropriately.
Transactions: Ensure coarse grained transactionality, across BPEL activities, and through SCA interaction chains.
Modules: Only split modules for good design reasons. Co-locate synchronously connected modules if possible. Split modules on asynchronous boundaries if possible
Clusters: Introduce new clusters only if you are sure there is a need. Split clusters down lines of minimal interaction.
Infrastructure: Get the fundamental infrastructure right, fast databases, fast disk subsystem etc.
Testing: Design the performance tests, based on the actual application. Performance test early and often

IBM Software Group
© 2008 IBM Corporation Performance
References IBM Redbooks/Redpapers
– WebSphere Business Process Management V6.1 Performance Tuning – http://www.redbooks.ibm.com/abstracts/redp4431.html
– Patterns: Building Serial and Parallel Processes for IBM WebSphere Process Server V6 – http://www.redbooks.ibm.com/abstracts/sg247205.html
– WPS Topology for tuning notes IBM DeveloperWorks
– SCA Caching within the IBM SOA Foundation – https://w3.tap.ibm.com/com.ibm.ram/assetDetail/generalDetails.faces?guid={60B254E1-
DB21-8F45-801C-6ACA9BA40E29}&v=1.0 Books
– Java Threads by Scott Oaks, Henry Wong – http://oreilly.com/catalog/9780596007829/index.html
InfoCenter: http://publib.boulder.ibm.com/infocenter/dmndhelp/v7r0mx/index.jsp
Best practices for BPM and SOA performance http://www.ibm.com/developerworks/websphere/library/techarticles/1008_metzger/1008_metzger.html
Support Sites: http://www-01.ibm.com/software/integration/wps/support/ http://www-01.ibm.com/software/integration/wsesb/support/
DeveloperWorks: http://www.ibm.com/developerworks/websphere/zones/businessintegration/wesb.html http://www.ibm.com/developerworks/websphere/zones/businessintegration/wps/wps.html
WPS Public Knowledge Compendium (41 pages of links): http://www-01.ibm.com/support/docview.wss?uid=swg21469876

© 2010 IBM Corporation 48
IBM Software Services Zone for WebSphere ibm.com/websphere/serviceszone
BPM-specific resources including proven, prescribed, and repeatable assets and offerings to accelerate BPM adoption
Visibility across the worldwide skills & capabilities that only IBM Software Services for WebSphere can bring to your project
Access to WebSphere practitioners’ insight on project trends, best practices & emerging technologies through personal videos, blogs, articles & more
Discover defined offerings to get your project started quickly
What’s New?
The destination for WebSphere services-related resources, offerings, & technical skills to help you on your path to business agility
Visit us in the Solution Center! • Ped SE2: IBM Software Services for WebSphere • Ped BD1: IBM BPM & BRM Services
© 2010 IBM Corporation 49
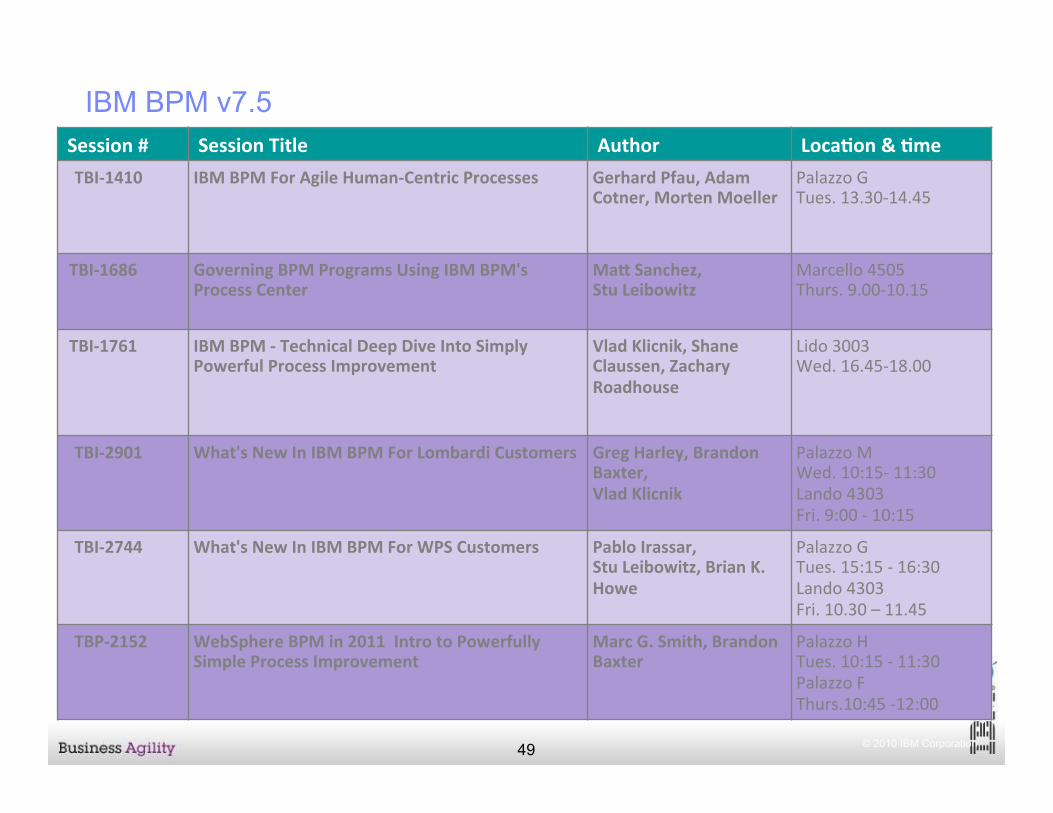
IBM BPM v7.5 Session # Session Title Author Loca3on & 3me TBI-‐1410 IBM BPM For Agile Human-‐Centric Processes Gerhard Pfau, Adam
Cotner, Morten Moeller Palazzo G Tues. 13.30-‐14.45
TBI-‐1686 Governing BPM Programs Using IBM BPM's Process Center
MaK Sanchez, Stu Leibowitz
Marcello 4505 Thurs. 9.00-‐10.15
TBI-‐1761 IBM BPM -‐ Technical Deep Dive Into Simply Powerful Process Improvement
Vlad Klicnik, Shane Claussen, Zachary Roadhouse
Lido 3003 Wed. 16.45-‐18.00
TBI-‐2901 What's New In IBM BPM For Lombardi Customers Greg Harley, Brandon Baxter, Vlad Klicnik
Palazzo M Wed. 10:15-‐ 11:30 Lando 4303 Fri. 9:00 -‐ 10:15
TBI-‐2744 What's New In IBM BPM For WPS Customers Pablo Irassar, Stu Leibowitz, Brian K. Howe
Palazzo G Tues. 15:15 -‐ 16:30 Lando 4303 Fri. 10.30 – 11.45
TBP-‐2152 WebSphere BPM in 2011 Intro to Powerfully Simple Process Improvement
Marc G. Smith, Brandon Baxter
Palazzo H Tues. 10:15 -‐ 11:30 Palazzo F Thurs.10:45 -‐12:00
© 2010 IBM Corporation 50
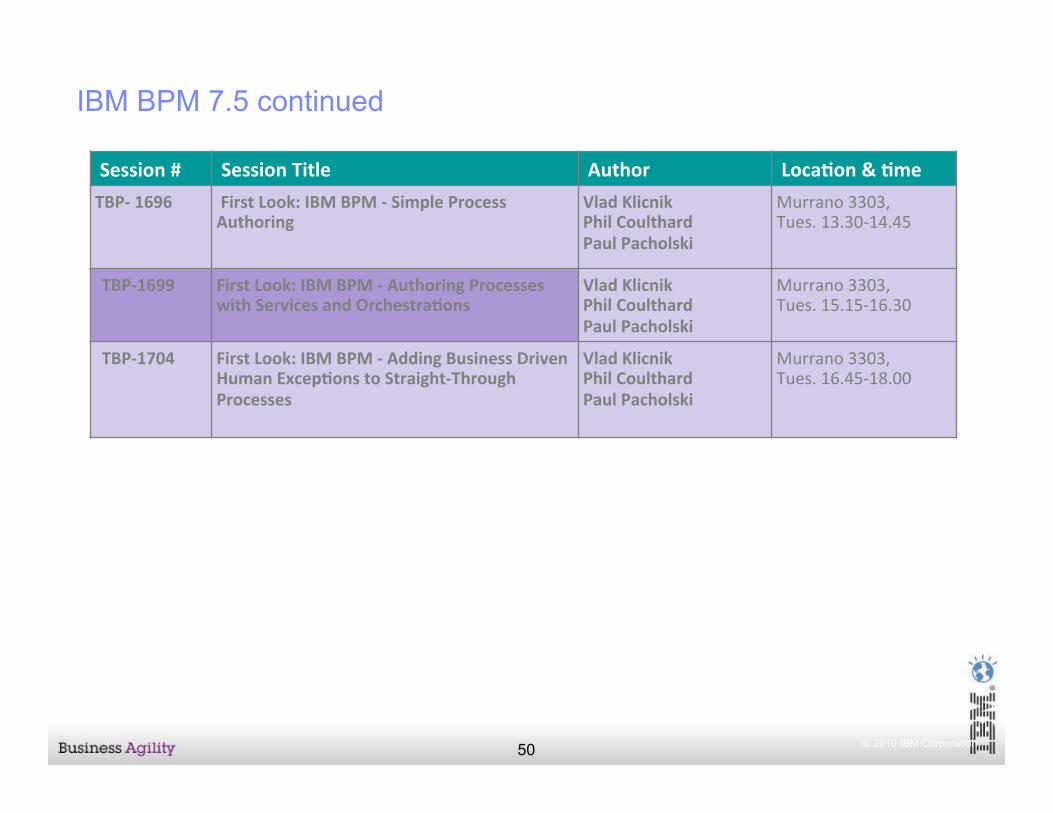
IBM BPM 7.5 continued
Session # Session Title Author Loca3on & 3me TBP-‐ 1696 First Look: IBM BPM -‐ Simple Process
Authoring Vlad Klicnik Phil Coulthard Paul Pacholski
Murrano 3303, Tues. 13.30-‐14.45
TBP-‐1699 First Look: IBM BPM -‐ Authoring Processes with Services and Orchestra3ons
Vlad Klicnik Phil Coulthard Paul Pacholski
Murrano 3303, Tues. 15.15-‐16.30
TBP-‐1704 First Look: IBM BPM -‐ Adding Business Driven Human Excep3ons to Straight-‐Through Processes
Vlad Klicnik Phil Coulthard Paul Pacholski
Murrano 3303, Tues. 16.45-‐18.00
51
We love your Feedback!
Don’t forget to submit your Impact session and speaker feedback! Your feedback is very important to us, we use it to improve our conference for you next year.
Go to impactsmartsite.com from your mobile device From the Impact 2011 Online Conference Guide;
– Select Agenda
– Navigate to the session you want to give feedback on
– Select the session or speaker feedback links – Submit your feedback

IBM Software Group
© 2008 IBM Corporation 52
4/18/11 Performance
Thank You Merci
Grazie
Gracias
Obrigado
Danke
Japanese
English
French
Russian
German Italian
Spanish
Brazilian Portuguese Arabic
Traditional Chinese
Simplified Chinese
Thai
52
53
© IBM Corporation 2011. All Rights Reserved. IBM, the IBM logo, and ibm.com are trademarks or registered trademarks of International Business Machines Corp., registered in many jurisdictions worldwide. Other product and service names might be trademarks of IBM or other companies. A current list of IBM trademarks is available on the Web at “Copyright and trademark information” at www.ibm.com/legal/copytrade.shtml.
Copyright and Trademarks

IBM Software Group
© 2008 IBM Corporation
Appendix and Back up
54
4/18/11 Performance
IBM Software Group
© 2008 IBM Corporation 55
4/18/11 Performance
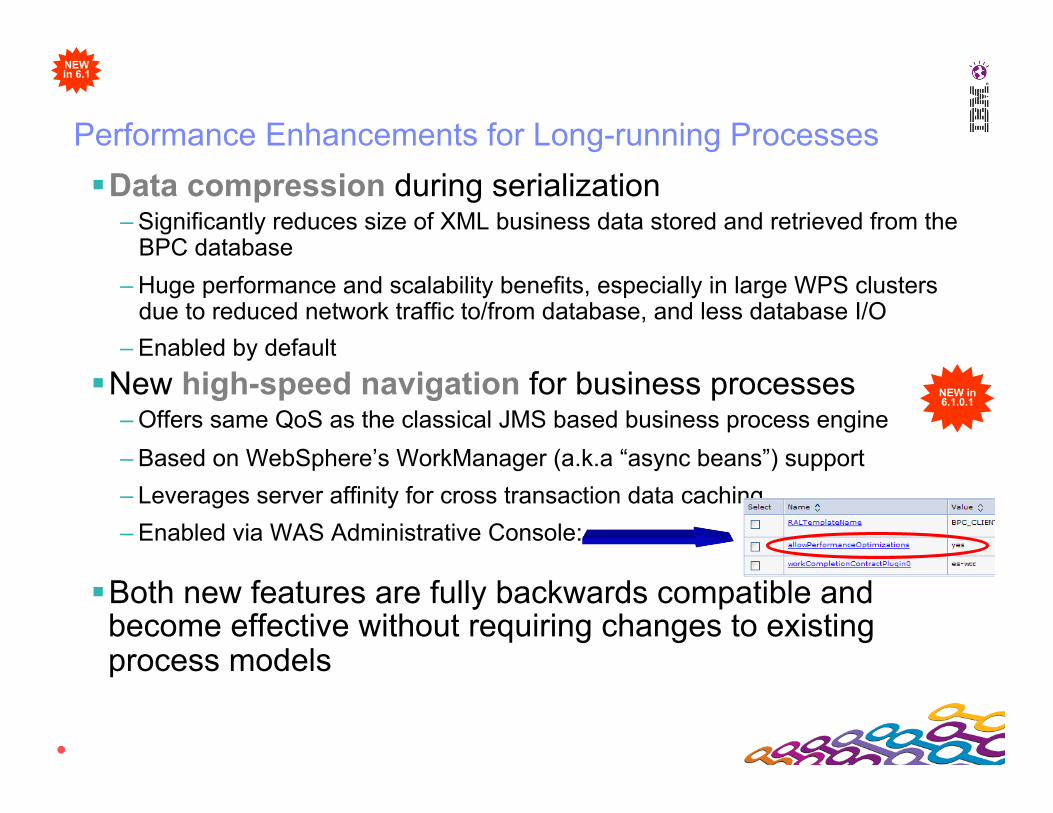
Performance Enhancements for Long-running Processes
Data compression during serialization – Significantly reduces size of XML business data stored and retrieved from the
BPC database – Huge performance and scalability benefits, especially in large WPS clusters
due to reduced network traffic to/from database, and less database I/O – Enabled by default
New high-speed navigation for business processes – Offers same QoS as the classical JMS based business process engine – Based on WebSphere’s WorkManager (a.k.a “async beans”) support – Leverages server affinity for cross transaction data caching – Enabled via WAS Administrative Console:
Both new features are fully backwards compatible and become effective without requiring changes to existing process models
NEW in 6.1
NEW in 6.1.0.1

IBM Software Group
© 2008 IBM Corporation 56
4/18/11 Performance
How do we typically measure throughput?
What we typically measure – Transactions per second (per CPU)
How do we typically measure it? – Fire continuous test requests at the server, increasing the number of calling
request threads until the server’s CPU plateaus near 100%. Note the number of transactions per second at this point.
– Testing tool examples: Rational Tester, SOAPUI, JMeter
How else can this same measurement be represented? – TPS / CPU = transactions / (seconds * CPUs) = transactions / (CPU
second)

IBM Software Group
© 2008 IBM Corporation 57
4/18/11 Performance
Common reasons for inconsistent performance tests results
Use a separate machine to fire the test so the requestor doesn’t use any of the server’s CPU
Is the network bandwidth high enough? Are you competing with other usage of the network?
Is the CPU is low/negligible when no transactions running through it. The server CPU on the server may be being used up by background work not directly related to processing the transactions.
Inability to get anywhere near the 100% as the calling threads increase suggests a bottleneck around a shared resource and the TPS value obtained is meaningless until the bottleneck is resolved. External bottlenecks could be a slow external system call or network. Internal bottlenecks often result from a synchronised (single threaded) java method.

IBM Software Group
© 2008 IBM Corporation 58
4/18/11 Performance
How else could we measure throughput?
What would be the ideal measurement – CPU instructions per transaction – but it is exceedingly hard to measure individual
CPU instructions – CPU seconds per transaction – This is a reasonable approximation to CPU
instructions per transaction as CPUs run at a constant clock speed How could we measure it?
– 1. By time spent in WPS – Measure the response time for the request to WPS – Measure the time taken for each of the calls WPS makes to externals systems – Subtract the time taken for the external calls from the overall response time. – This mechanism is relatively hard to use as it requires monitoring of external call times and calculations on
the results.
– 2. By reverse engineer from the TPS – CPU seconds per transaction = (CPU * seconds ) / transactions = CPU * (seconds/transaction) = CPU/TPS – So if use a machine with a single CPU for our tests, then the CPU seconds per transaction = 1/TPS at
saturation*
* Note: We perform the tests at saturation. i.e. at 100% CPU. So our results don't tell us anything about how linear the progression was to the saturation point. Specifically, we can not necessarily interpolate our 100% TPS figure to tell us how many CPUs we would need if we prefer to run at 35%.

IBM Software Group
© 2008 IBM Corporation 59
4/18/11 Performance
Why is “CPU Seconds” a better measure?
Lets assume we have a function that uses 100 CPU milliseconds. 10 TPS. (per CPU) We improve an algorithm within the function such that is uses 75 less CPU
milliseconds. So it now uses 25 CPU milliseconds, and runs at 40 TPS. We then do a further change that removes 15 CPU milliseconds. It now uses 10 CPU
milliseconds, and runs at 100 TPS. Which change was the bigger "improvement"? If we look at TPS, we might say that the second one is better since it gave us an extra
100-40= 60TPS against the first change's 40-10= 30TPS. This is meaningless because the TPS is a measure relative to whatever TPS we currently have.
The CPU milliseconds is an absolute judge of the improvement, and is directly proportional to the number of actual machine code instructions performed by the CPU. A change that results in saving 75 CPU milliseconds, will always result in a saving of 75 CPU milliseconds regardless of what other changes have been done *
* This assumes that the changes are not correlated. An example of correlated changes would be where one change affects the amount of CPU used in each iteration of a loop and another change affects the number of iterations of the same loop.
IBM Software Group
© 2008 IBM Corporation 60
4/18/11 Performance
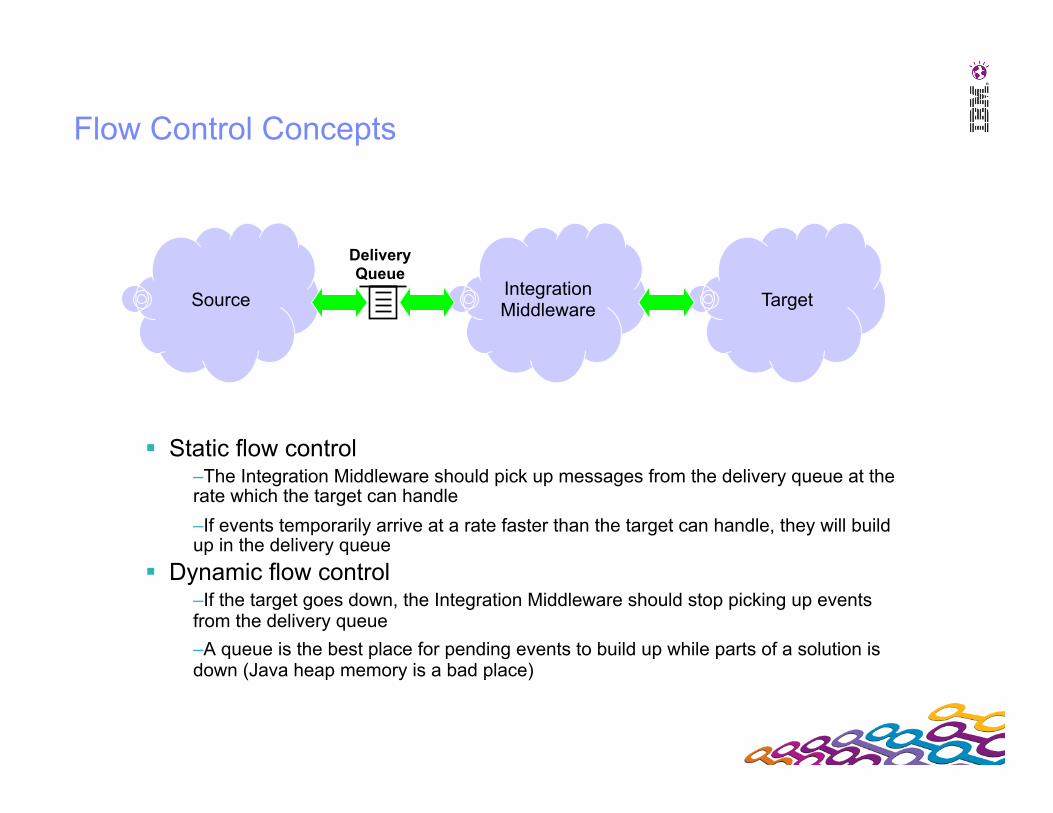
Flow Control Concepts
Static flow control – The Integration Middleware should pick up messages from the delivery queue at the rate which the target can handle – If events temporarily arrive at a rate faster than the target can handle, they will build up in the delivery queue
Dynamic flow control – If the target goes down, the Integration Middleware should stop picking up events from the delivery queue – A queue is the best place for pending events to build up while parts of a solution is down (Java heap memory is a bad place)
Source Integration Middleware Target
Delivery Queue

Summary Key v7 Technology Improvements Top Implementation Recommendations SCA Implementing for Performance General Implementation Recommendations

62
Thread Anti-pattern: Two-way synchronous calls to long running processes Scenario
– A synchronous caller makes a two way request to a long running process – The long running process by definition is tuned for throughput, not response time. It may well take a
long time to respond.
What happens? – Synchronous callers are often users (people) rather than systems. They don’t like waiting! – Calling threads are held, making less threads available to perform other work. – Calling threads will likely time-out within 120 seconds or less. If so, what’s the state of the
transaction? What will happen if/when a response is received?
Resolution – Long running processes should be called with a one-way synchronous operation, or two way
asynchronous (callback). – Note: One way calls are implicitly made asynchronous by the SCA runtime.
So what about our standard process type “Briefly Persisted Process”? – Call them asynchronously if you possibly can. – Use alternative process types first (e.g. “Synchronous Transactional Process”) implemented with
short running BPEL, WESB mediations etc. – If you can’t, follow the design rules of briefly persisted processes – no HTM, no calls to slow
systems. Make sure the BPE container never hits it’s thread limit

63
4/18/11 Performance
Thread Anti-pattern: Scatter then “gather some” Scenario Make requests to a large number of different backend systems (for example
30). A business example might be requesting a selection of quotes. Show the user only the first 5 fastest responses – hence the name “gather
some”
The result To get parallelism/multi-threading, you’d have to do this with asynchronous
requests within WPS When we reach our 5 responses, and reply to the caller, the other
asynchronously initiated calls may still be blocking on threads, even though we’re not listening for their responses.
Ultimately, all the available threads will end up waiting on slow responses that we no longer require!
Options It makes no (technical) sense to waste system resource awaiting a backend
system when the response is no longer required. Push back on the requirement! Choose the 5 fastest SLAs and always get
answers just from them. Profile the back end systems over time, and use that information to (perhaps
dynamically) guide which set of 5 you call.