immunization graphs - farm...
TRANSCRIPT

Immunization Graphs
Prepared by: Raymond Obomsawin M.Sc., Ph.D.
December, 2009

Source: Adapted from: Public Health Agency of Canada, Figure 8 – Measles Reported
Incidence Canada. http://www.phac-aspc.gc.ca/publicat/cig-gci/p04-meas-roug-eng.php
0.00
100.00
200.00
300.00
400.00
500.00
600.00
700.00
800.00
1935 1947 1959 1971 1983
Measles Vaccines
Introduced
Live 1963 / Inactivated 1964
Canada
Measles Incidence
Reported Cases (1935-1983)

Source: McKeown, T., The Role of Medicine: Dream, Mirage or Nemesis?; Basil
Blackwell; Oxford, UK; 1979; p. 105; & Waltzkin, H., in The Relevance of Social Science
for Medicine; Springer; 1st edition, Dec. 31, 1980
0.00
200.00
400.00
600.00
800.00
1,000.00
1,200.00
1850 1875 1900 1925 1950 1965
England & Wales
Mean Annual Measles Mortality
Cases Children under 15 (1850-1965)
Measles
Vaccination Begins
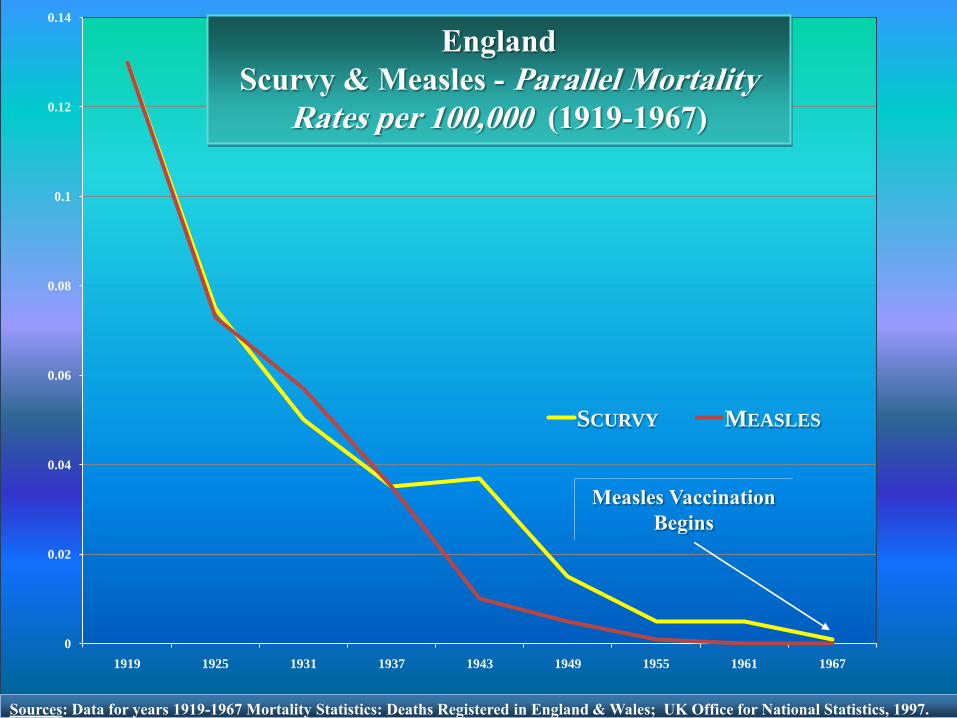
0
0.02
0.04
0.06
0.08
0.1
0.12
0.14
1919 1925 1931 1937 1943 1949 1955 1961 1967
SCURVY MEASLES
Measles Vaccination
Begins
Sources: Data for years 1919-1967 Mortality Statistics: Deaths Registered in England & Wales; UK Office for National Statistics, 1997.
England
Scurvy & Measles - Parallel Mortality
Rates per 100,000 (1919-1967)

Source: based on data at: Timeline of TB in Canada http://www.lung.ca/tb/tbhistory/timeline/;
http://www.thecanadianencyclopedia.com/index.cfm?PgNm=TCE&Params=A1ARTA0008151
Public Health Agency of Canada: http://www.phac-aspc.gc.ca/publicat/cig-gci/p04-bcg-eng.php; &
PHAC on BCG usage in Canada: http://www.phac-aspc.gc.ca/tbpc-latb/bcgvac_1206-eng.php
0.00
20.00
40.00
60.00
80.00
100.00
120.00
140.00
160.00
180.00
200.00
1880 1900 1924 1930 1936 1942 1948 1954 1960
Canada
Tuberculosis Mortality
Rates per 100,000 (1880-1960)
BCG Vaccination
Introduced Between 1948-
1954 (Depending on Prov.
or Terr.)
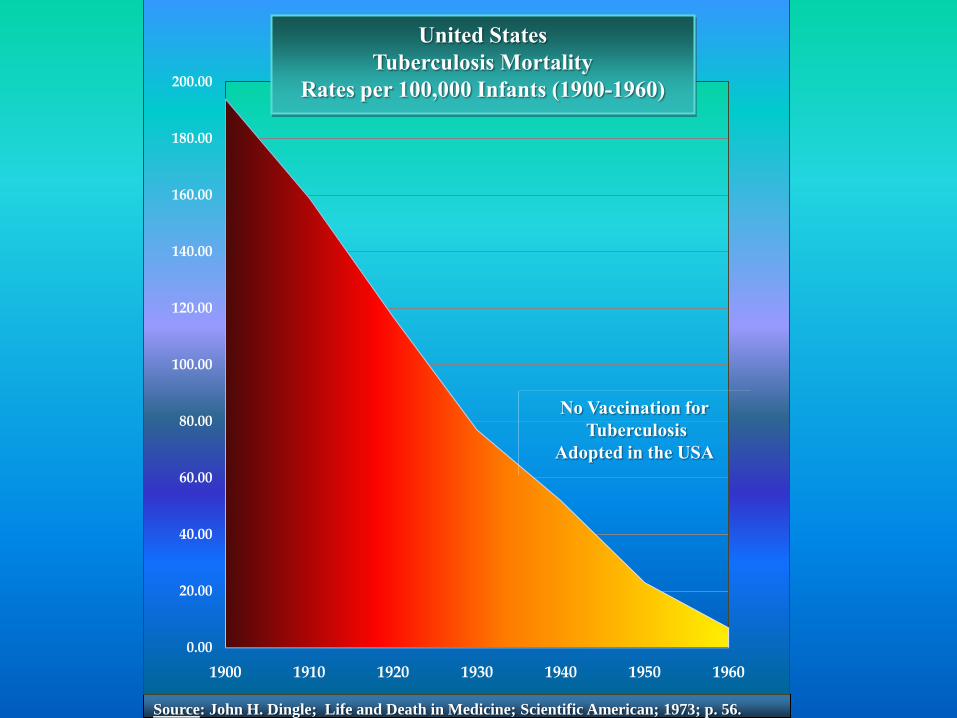
Source: John H. Dingle; Life and Death in Medicine; Scientific American; 1973; p. 56.
0.00
20.00
40.00
60.00
80.00
100.00
120.00
140.00
160.00
180.00
200.00
1900 1910 1920 1930 1940 1950 1960
United States
Tuberculosis Mortality
Rates per 100,000 Infants (1900-1960)
No Vaccination for
Tuberculosis
Adopted in the USA
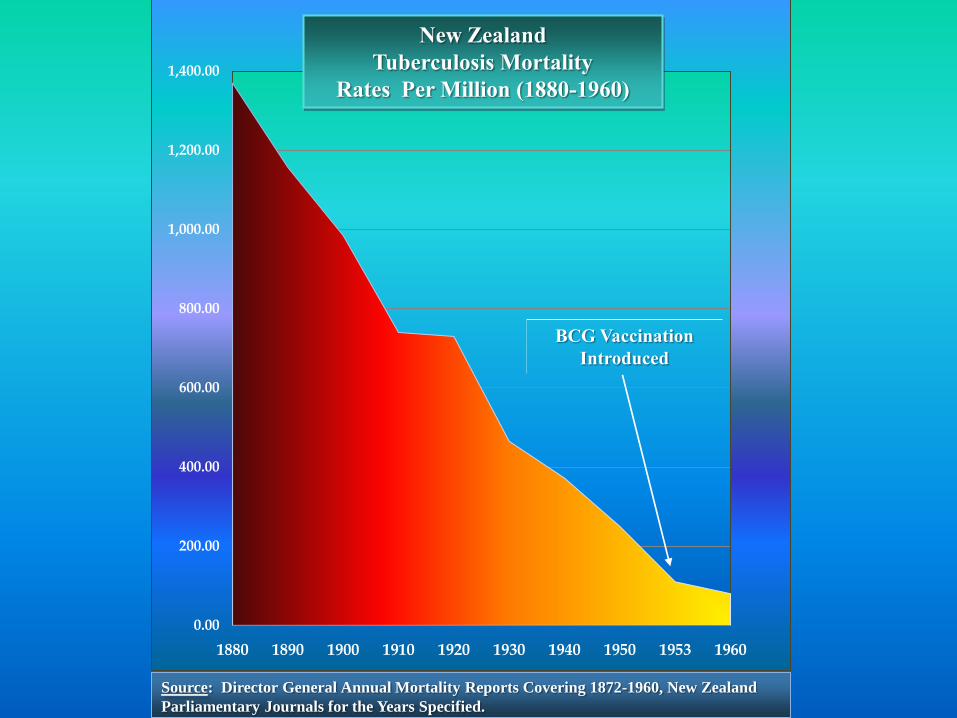
Source: Director General Annual Mortality Reports Covering 1872-1960, New Zealand
Parliamentary Journals for the Years Specified.
0.00
200.00
400.00
600.00
800.00
1,000.00
1,200.00
1,400.00
1880 1890 1900 1910 1920 1930 1940 1950 1953 1960
New Zealand
Tuberculosis Mortality
Rates Per Million (1880-1960)
BCG Vaccination
Introduced

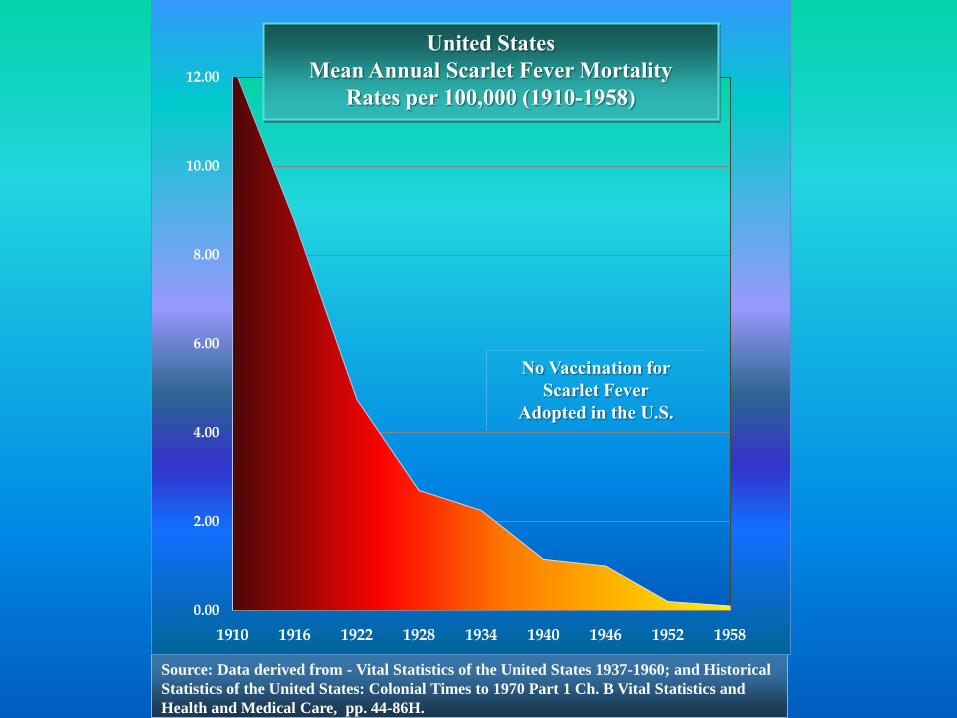
Source: Data derived from: Vital Statistics of the United States 1937-1960; and
Historical Statistics of the United States: Colonial Times to 1970 Part 1 Ch. B Vital
Statistics and Health and Medical Care, pp. 44-86H.
0.00
2.00
4.00
6.00
8.00
10.00
12.00
14.00
16.00
1918 1924 1930 1936 1942 1948 1954 1960
United States
Mean Annual Pertussis Mortality
Rates Per 100,000 (1918-1960)
Pertussis
Vaccination Introduced

Source: Thomas McKeown, The Role of Medicine: Dream, Mirage or Nemesis?; Basil Blackwell;
Oxford, UK; 1979; p. 103
0.00
200.00
400.00
600.00
800.00
1,000.00
1,200.00
1,400.00
1850 1875 1900 1925 1950 1965
England & Wales
Mean Annual Pertussis Mortality
Cases Children under 15 (1850-1965)
Pertussis
Vaccination Introduced

0
0.02
0.04
0.06
0.08
0.1
0.12
0.14
0.16
0.18
1919 1925 1931 1937 1943 1949 1955 1961 1967
SCURVY PERTUSSIS
England
Scurvy & Pertussis - Parallel Mortality
Rates per 100,000 (1919-1967)
Pertussis Vaccination
Begins
Sources: Data for years 1919-1967 Mortality Statistics: Deaths Registered in England & Wales; UK Office for National Statistics, 1997.
Source: Data derived from - Vital Statistics of the United States 1937-1960; and Historical
Statistics of the United States: Colonial Times to 1970 Part 1 Ch. B Vital Statistics and
Health and Medical Care, pp. 44-86H.
0.00
2.00
4.00
6.00
8.00
10.00
12.00
1910 1916 1922 1928 1934 1940 1946 1952 1958
United States
Mean Annual Scarlet Fever Mortality
Rates per 100,000 (1910-1958)
No Vaccination for
Scarlet Fever
Adopted in the U.S.
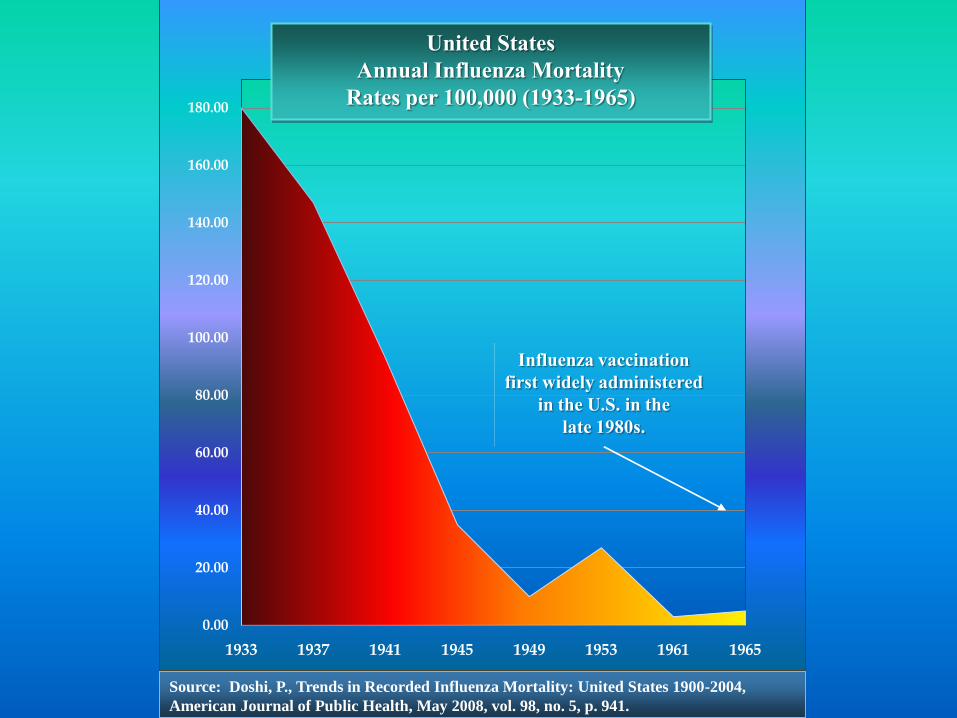
Source: Doshi, P., Trends in Recorded Influenza Mortality: United States 1900-2004,
American Journal of Public Health, May 2008, vol. 98, no. 5, p. 941.
0.00
20.00
40.00
60.00
80.00
100.00
120.00
140.00
160.00
180.00
1933 1937 1941 1945 1949 1953 1961 1965
United States
Annual Influenza Mortality
Rates per 100,000 (1933-1965)
Influenza vaccination
first widely administered
in the U.S. in the
late 1980s.
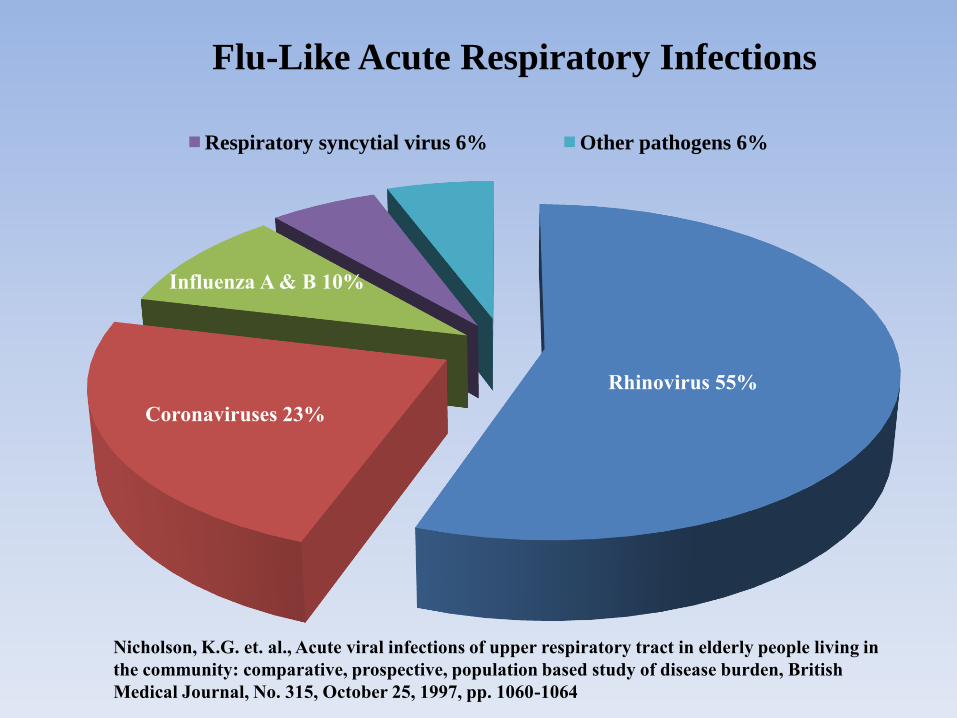
Flu-Like Acute Respiratory Infections
Respiratory syncytial virus 6% Other pathogens 6%
Rhinovirus 55%
Coronaviruses 23%
Influenza A & B 10%
Nicholson, K.G. et. al., Acute viral infections of upper respiratory tract in elderly people living in
the community: comparative, prospective, population based study of disease burden, British
Medical Journal, No. 315, October 25, 1997, pp. 1060-1064

0% Effective
Children Under 2 Yrs of Age
Inactivated Influenza Vaccine
Source: Cochrane Collaboration Database of Systematic Reviews, (John Wiley & Sons,
Ltd.) 2006 (1) Article No. CD004879 – Covers 51 Studies on 260,000 children
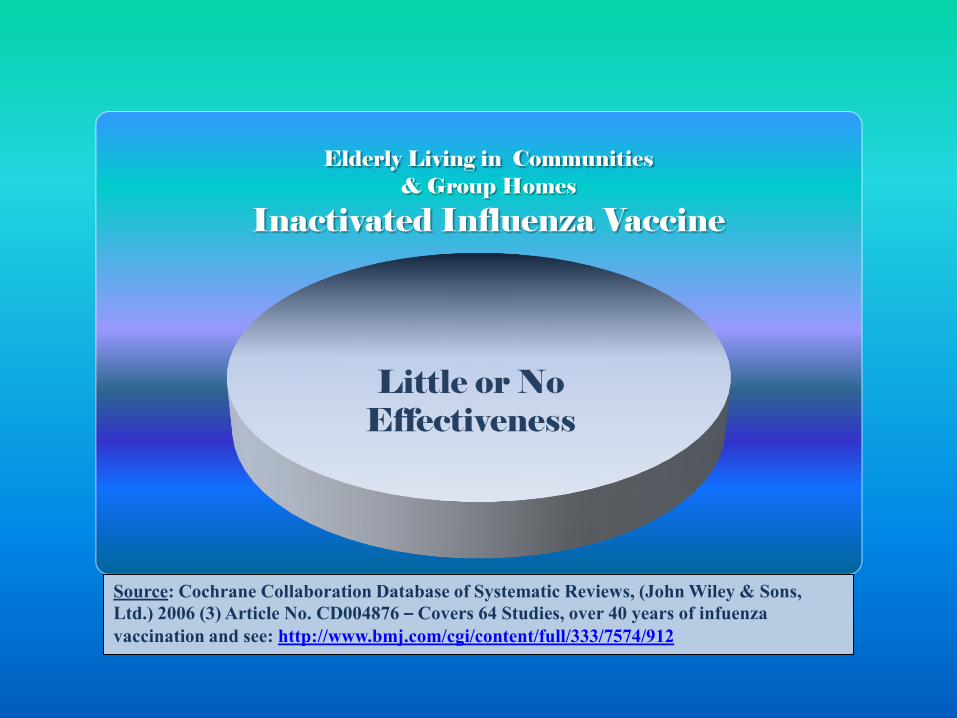
Elderly Living in Communities& Group Homes
Inactivated Influenza Vaccine
Little or No Effectiveness
Source: Cochrane Collaboration Database of Systematic Reviews, (John Wiley & Sons,
Ltd.) 2006 (3) Article No. CD004876 – Covers 64 Studies, over 40 years of infuenza
vaccination and see: http://www.bmj.com/cgi/content/full/333/7574/912

0% Effective
Source: Randomised controlled trial of single BCG, repeated BCG, or combined BCG and
killed Mycobacterium leprae vaccine for prevention of leprosy and tuberculosis in Malawi;
The Lancet, Volume 348, Issue 9019, Pages 17 - 24, July 6, 1996.
BCG for Tuberculosis
Note: Tuberculosis higher among
two (2) dose Vaccinated versus
Placebo Group

0% Effective
BCG for Tuberculosis
Note: In years 0-2.5 the vaccinated
had double the incidence of
Tuberculosis versus Placebo Group
Source: Double blind randomized controlled trial of BCG’s effectiveness on 250,000
subjects Tuberculosis Research Centre (ICMR), Chennai, India: Indian Journal of Medical
Research, 110, August 1999, pp. 56-69.

92%
8%
92% Vaccinated
8% Unvaccinated
2006 Iowa
Mumps Outbreak in Highly Vaccinated
Population
Source: Center for Disease Control , MMWR 55 (20); May 26, 2006; pp. 559-63.

86%
14%
86% Vaccinated
14% Unvaccinated
Chickenpox Outbreak in Highly Vaccinated
Population
Source: Pediatrics - Vol. 113; No. 3; pp. 455-459; (2004)

90%
10%
90% Vaccinated
10% Unvaccinated
1993 Ohio
Source: N.Z. Miller; Vaccine Safety Manual; N.A. Press, Sante Fe, New Mexico; p. 140; (2008) (Refers to CDC & Official Surveillance data)
Pertussis Outbreak in Highly Vaccinated
Population

99%
1%
99% Vaccinated
1% Unvaccinated
Measles Outbreak in Highly Vaccinated
Population
Source: New England Journal of Medicine -Vol. 316; No. 13; pp. 771-774; (1987)
1985 Texas

0.00
200.00
400.00
600.00
800.00
1,000.00
1973 1974 1975 1976 1977 1978 1979 1980 1981 1982
NIGERIA
DIPHTHERIA REPORTED CASES
(1973-1982)
Source: E. Ekanem; A 10-Year Review of Morbidity from Childhood Preventable
Diseases in Nigeria: How Successful is the Expanded Programme of Immunization
(EPI)?; Journal of Tropical Pediatrics, Vol. 34; No. 6; UK; 1988; pp. 323-328.
EPI Begins
Diphtheria Vaccine
0.00
20.00
40.00
60.00
80.00
100.00
120.00
140.00
160.00
180.00
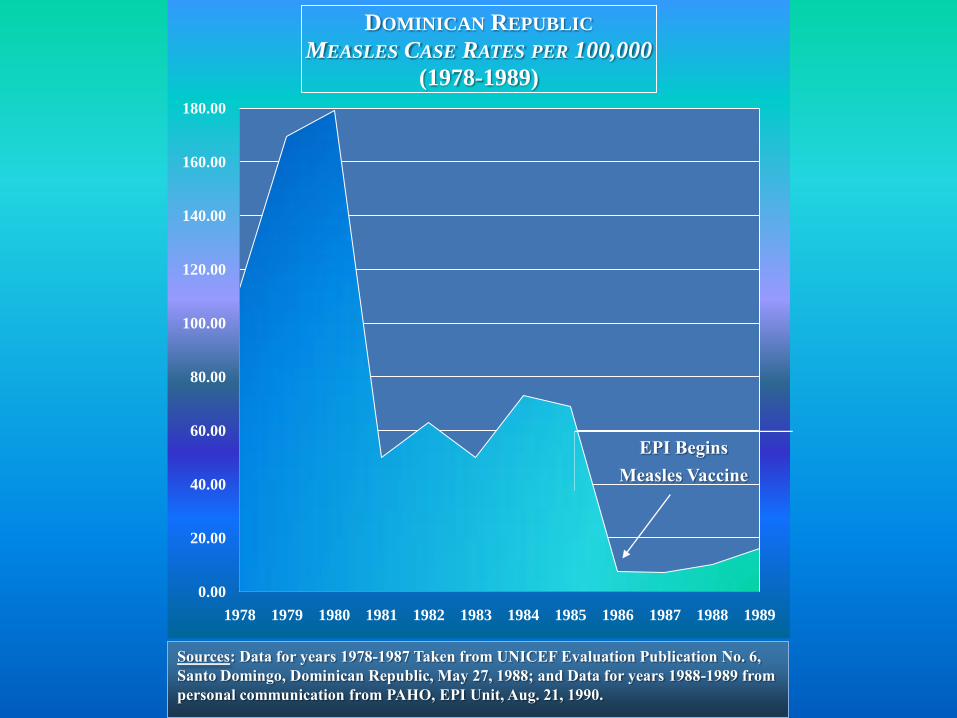
1978 1979 1980 1981 1982 1983 1984 1985 1986 1987 1988 1989
DOMINICAN REPUBLIC
MEASLES CASE RATES PER 100,000
(1978-1989)
Sources: Data for years 1978-1987 Taken from UNICEF Evaluation Publication No. 6,
Santo Domingo, Dominican Republic, May 27, 1988; and Data for years 1988-1989 from
personal communication from PAHO, EPI Unit, Aug. 21, 1990.
EPI Begins
Measles Vaccine

0.00
1.00
2.00
3.00
4.00
5.00
6.00
7.00
1978 1979 1980 1981 1982 1983 1984 1985 1986 1987
DOMINICAN REPUBLIC
DIPHTHERIA CASE RATES PER 100,000
(1978-1987)
EPI Begins
Diphtheria Vaccine
Source: Data for years 1978-1987 Taken from UNICEF Evaluation Publication No. 6,
Santo Domingo, Dominican Republic, May 27, 1988.

0.00
2.00
4.00
6.00
8.00
10.00
12.00
14.00
16.00
18.00
20.00
1978 1979 1980 1981 1982 1983 1984 1985 1986 1987 1988 1989
DOMINICAN REPUBLIC
PERTUSSIS CASE RATES PER 100,000
(1978-1989)
Sources: Data for years 1978-1987 Taken from UNICEF Evaluation Publication No. 6,
Santo Domingo, Dominican Republic, May 27, 1988; and Data for years 1988-1989 from
personal communication from PAHO, EPI Unit, Aug. 21, 1990.
EPI Begins
Pertussis Vaccine
0
1
2
3
4
5
6
7
8
9
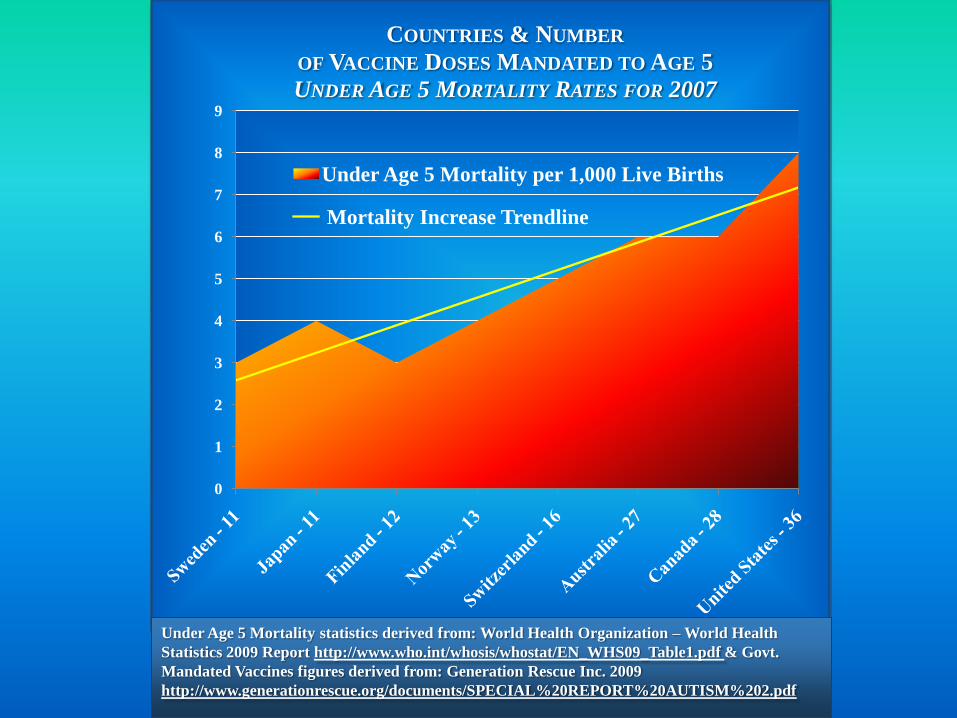
COUNTRIES & NUMBER
OF VACCINE DOSES MANDATED TO AGE 5
UNDER AGE 5 MORTALITY RATES FOR 2007
Under Age 5 Mortality per 1,000 Live Births
Mortality Increase Trendline
Under Age 5 Mortality statistics derived from: World Health Organization – World Health
Statistics 2009 Report http://www.who.int/whosis/whostat/EN_WHS09_Table1.pdf & Govt.
Mandated Vaccines figures derived from: Generation Rescue Inc. 2009
http://www.generationrescue.org/documents/SPECIAL%20REPORT%20AUTISM%202.pdf

0
10
20
30
40
50
60
70
80
90
1999 2000 2001 2002 2003
UNDER AGE 5 INFLUENZA DEATHS
BEFORE & AFTER U.S. CDC MANDATES
FLU VACCINES IN EARLY CHILDHOOD
Influenza Deaths Children Under Age 5
Under Age 5 Influenza Mortality statistics derived from: Center for Disease Control Vital Statistics
Reports covering Years 1999-2003 reported in Miller, N.Z., Vaccine Safety Manual, New Atlantean
Press, Sante Fe, New Mexico, 2008, p. 97.
Latter half of 2002
C DC Mandates
Early Childhood
Flu Vaccines in
USA
0%
10%
20%
30%
40%
50%
60%
70%
80%
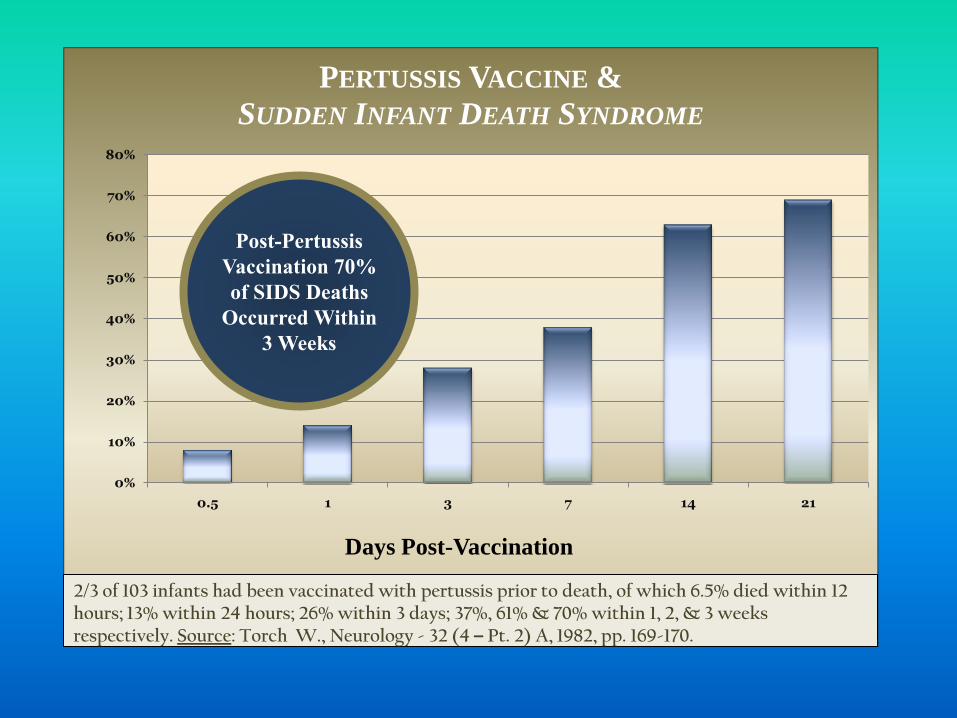
0.5 1 3 7 14 21
PERTUSSIS VACCINE &
SUDDEN INFANT DEATH SYNDROME
Post-Pertussis
Vaccination 70%
of SIDS Deaths
Occurred Within
3 Weeks
2/3 of 103 infants had been vaccinated with pertussis prior to death, of which 6.5% died within 12 hours; 13% within 24 hours; 26% within 3 days; 37%, 61% & 70% within 1, 2, & 3 weeks respectively. Source: Torch W., Neurology - 32 (4 – Pt. 2) A, 1982, pp. 169-170.
Days Post-Vaccination

0
0.5
1
1.5
2
2.5
3
3.5
4
Ulcerative Colitis Crohn's Disease
Unvaccinated
Vaccinated
Measles Vaccine &
Inflammatory Bowel Diseases
Source:The Lancet - Vol. 345; 8957; 1995, pp. 1062-1063.

0 0.5 1 1.5 2 2.5
Fever >40°
Ear Infections
Inflammationof the Throat
Aggressive Behaviour
Events
Convulsions/Collapse
Antibiotics Administered
Average Incidence First Five (5) years of LifeNederlands Vereniging Kritisch Prikken 2004 Survey Findings
Fully Vaccinated
No Vaccinations
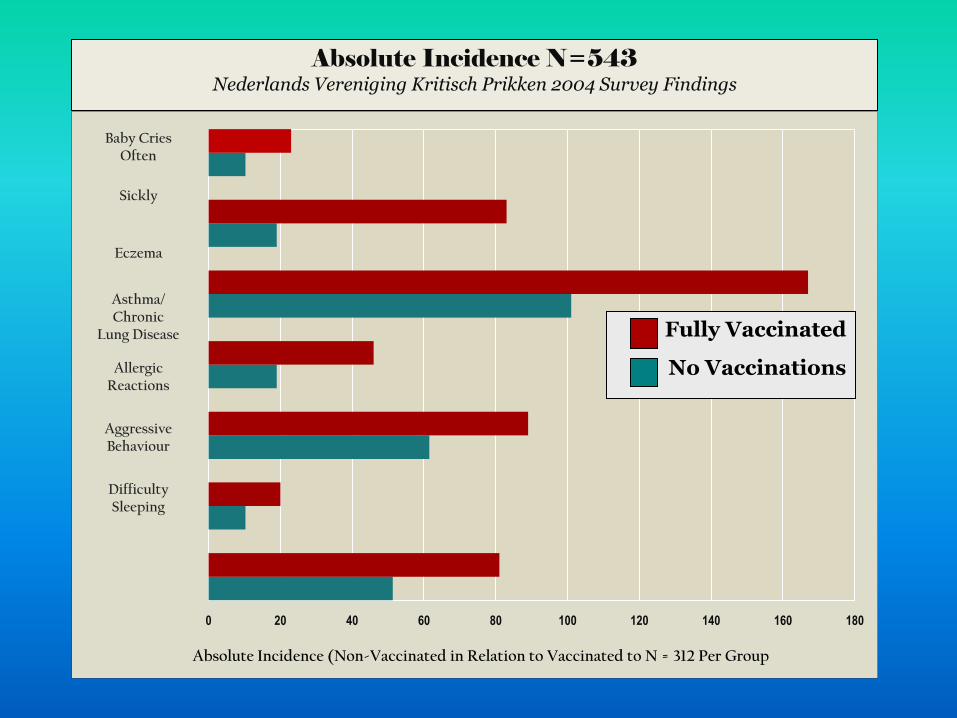
0 20 40 60 80 100 120 140 160 180
Absolute Incidence (Non-Vaccinated in Relation to Vaccinated to N = 312 Per Group
Baby CriesOften
Sickly
Eczema
Asthma/Chronic
Lung Disease
AllergicReactions
Aggressive Behaviour
DifficultySleeping
Fully Vaccinated
No Vaccinations
Absolute Incidence N=543Nederlands Vereniging Kritisch Prikken 2004 Survey Findings
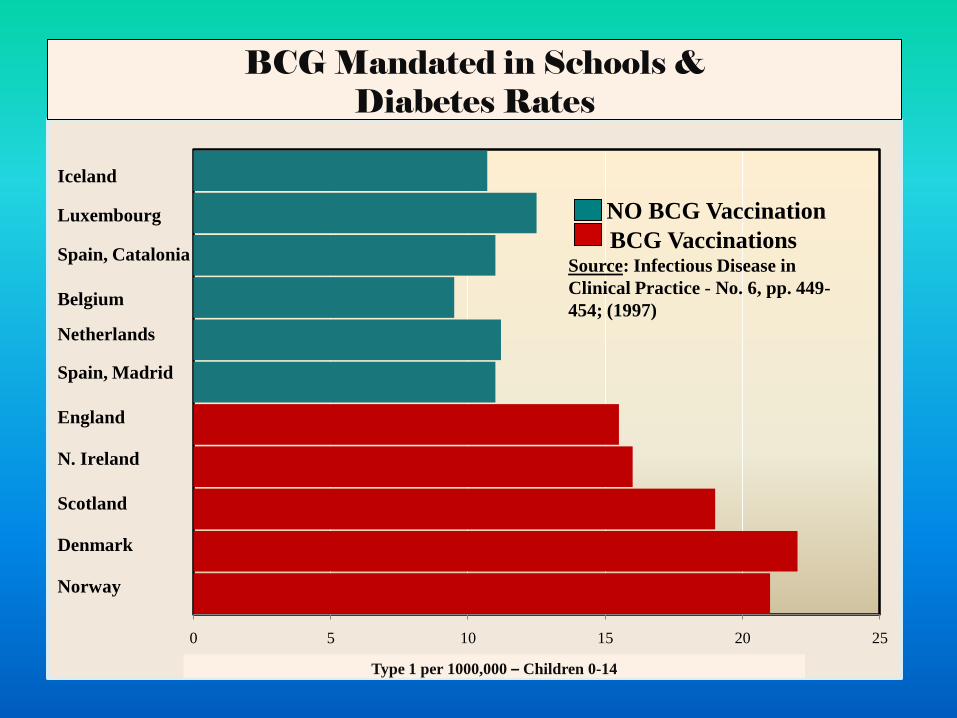
0 5 10 15 20 25
Iceland
Luxembourg
Spain, Catalonia
Belgium
Netherlands
Spain, Madrid
England
N. Ireland
Scotland
Denmark
Norway
BCG Mandated in Schools & Diabetes Rates
Type 1 per 1000,000 – Children 0-14
NO BCG Vaccination
BCG VaccinationsSource: Infectious Disease in
Clinical Practice - No. 6, pp. 449-
454; (1997)
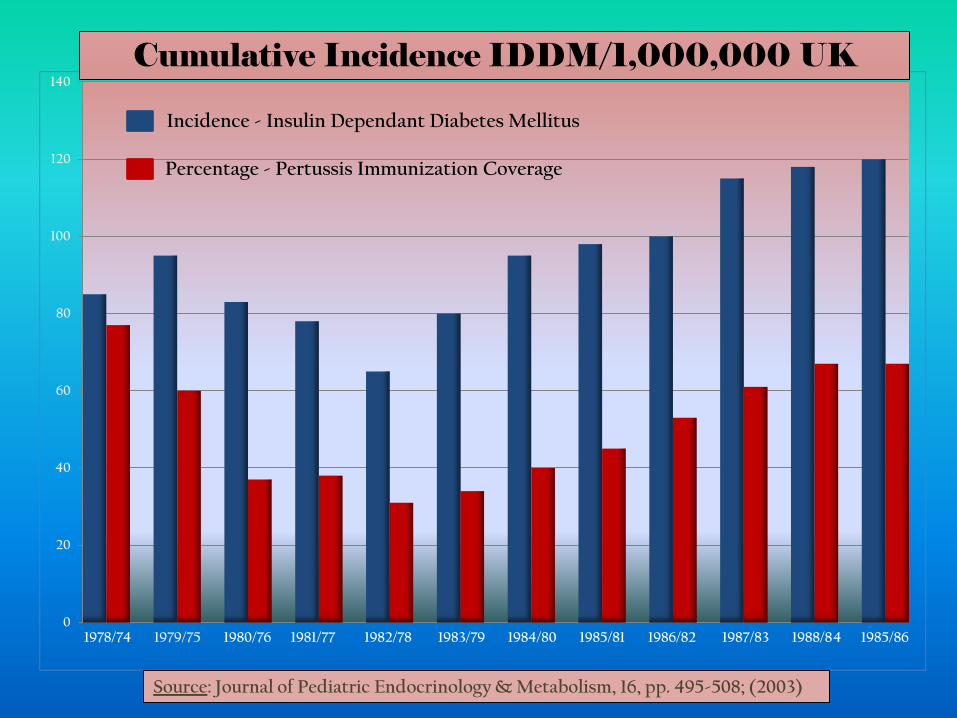
0
20
40
60
80
100
120
140
Incidence - Insulin Dependant Diabetes Mellitus
Percentage - Pertussis Immunization Coverage
1978/74 1979/75 1980/76 1981/77 1982/78 1983/79 1984/80 1985/81 1986/82 1987/83 1988/84 1985/86
Cumulative Incidence IDDM/1,000,000 UK
Source: Journal of Pediatric Endocrinology & Metabolism, 16, pp. 495-508; (2003)
0
2
4
6
8
10
12
14
16
18
20
0
5
10
15
20
25
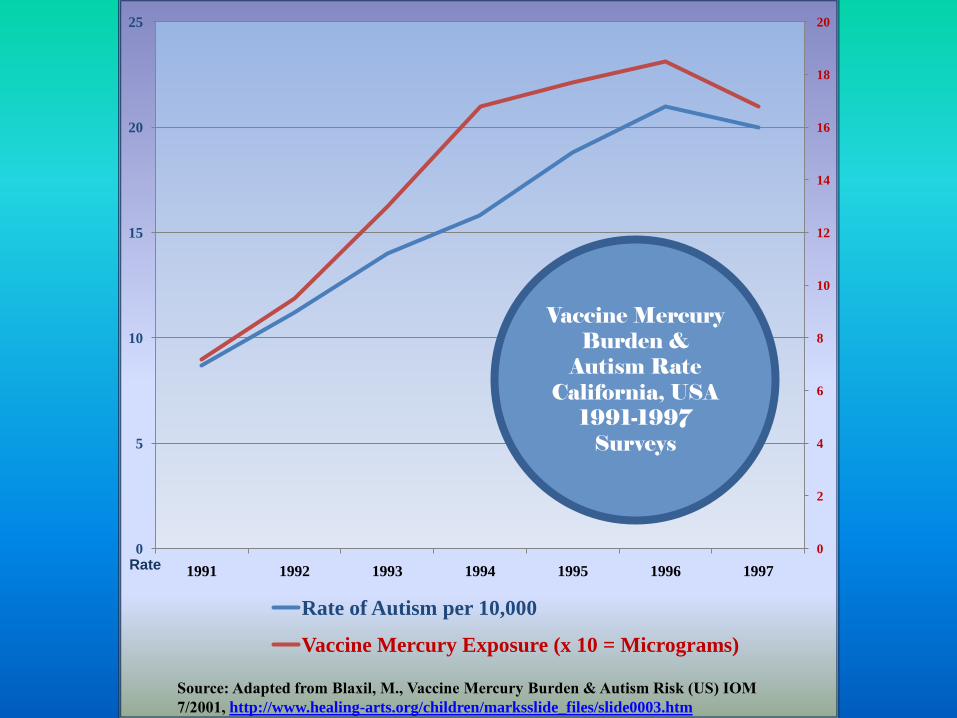
1991 1992 1993 1994 1995 1996 1997
Rate of Autism per 10,000
Vaccine Mercury Exposure (x 10 = Micrograms)
Vaccine Mercury Burden &
Autism Rate California, USA
1991-1997 Surveys
Rate
Source: Adapted from Blaxil, M., Vaccine Mercury Burden & Autism Risk (US) IOM
7/2001, http://www.healing-arts.org/children/marksslide_files/slide0003.htm
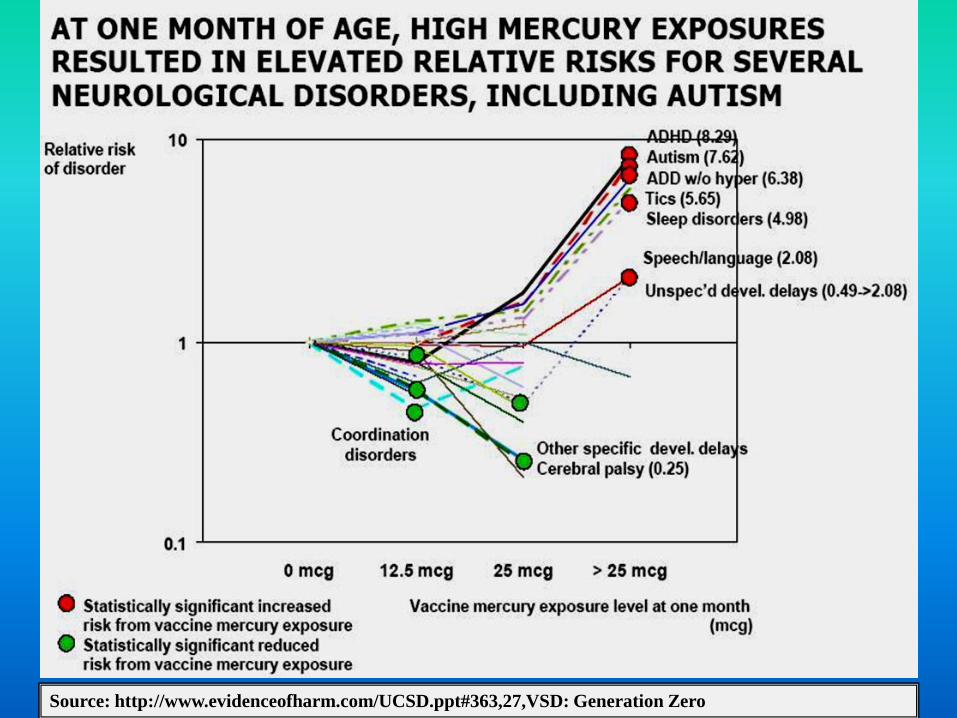
Source: http://www.evidenceofharm.com/UCSD.ppt#363,27,VSD: Generation Zero