immune changes in the anterior kidney of spawning sockeye
TRANSCRIPT

W&M ScholarWorks W&M ScholarWorks
Dissertations, Theses, and Masters Projects Theses, Dissertations, & Master Projects
2018
Immune Changes in the Anterior Kidney of Spawning Sockeye Immune Changes in the Anterior Kidney of Spawning Sockeye
Salmon Salmon
Meaghan K. Smith College of William and Mary - Arts & Sciences, [email protected]
Follow this and additional works at: https://scholarworks.wm.edu/etd
Part of the Biology Commons
Recommended Citation Recommended Citation Smith, Meaghan K., "Immune Changes in the Anterior Kidney of Spawning Sockeye Salmon" (2018). Dissertations, Theses, and Masters Projects. Paper 1550154011. http://dx.doi.org/10.21220/s2-txz9-3e06
This Thesis is brought to you for free and open access by the Theses, Dissertations, & Master Projects at W&M ScholarWorks. It has been accepted for inclusion in Dissertations, Theses, and Masters Projects by an authorized administrator of W&M ScholarWorks. For more information, please contact [email protected].

Immune Changes in the Anterior Kidney of Spawning Sockeye Salmon
Meaghan Kathleen Smith
Chesapeake, Virginia
Bachelor of Science, College of William and Mary, 2016
A Thesis presented to the Graduate Faculty
of The College of William and Mary in Candidacy for the Degree of
Master of Science
Department of Biology
College of William and Mary
January 2019

© Copyright by Meaghan K. Smith 2019

COMPLIANCE PAGE
Research approved by
Institutional Animal Care and Use Committee
Protocol number(s): IACUC-2017-03-10-11913-pxzwol
Date(s) of approval: 04/16/2017-04/18/2018

ABSTRACT PAGE
During the return journey to their spawning grounds, sockeye salmon are
exposed to various pathogens and undergo major endocrine changes. Little is
known about how these changes affect their immune system. The immune
system of salmon is similar to mammals; myeloid lineage cells provide the first
response to infection and B lineage cells protect against specific pathogens.
After activation by pathogen, B cells may differentiate into long-lived plasma cells
(LLPCs) in the anterior kidney, where they can survive for years, continuously
secreting protective antibody. This research focused on salmon from two rivers,
the Kenai and the Copper River, and characterized changes in anterior kidney
immune cell abundance during their journey and at various spawning sites.
Additionally, possible correlations with relative spleen size, distance traveled,
water temperature, and infections with Infectious Hematopoietic Necrosis Virus
were investigated. Flow cytometry was used to analyze the abundance of B
cells, LLPCs, and myeloid lineage cells in the anterior kidney. Quantitative PCR
was used to determine IHNV load in the spleen. During the Kenai River Run,
myeloid cells and activated B cells transiently decreased while (im)mature B
cells, IgM+ B cells, and LLPCs transiently increased. The changes in myeloid
cells, IgM+ B cells, and LLPCs were conserved at the Kenai and Copper River
Runs. Analysis indicated that a larger spleen index correlated with immune
system activation and a lower prevalence of IHNV. These findings provide a
better understanding of immune changes during spawning in sockeye salmon.

i
TABLE OF CONTENTS
Acknowledgements ii
Dedications iii
List of Tables iv
List of Figures v
Introduction 1
Methods 9
Results 19
Discussion 44
Appendix 54
Bibliography 59

ii
ACKNOWLEDGEMENTS
I would like to thank everyone who helped make this possible. I would like to thank Dr. Patty Zwollo for her mentorship during this project. Dr. Zwollo has been patient, kind, and an excellent advisor. I have learned a lot from her and I am grateful for the time I was able to work with her as both an undergraduate and graduate student.
I would like to thank the members of my committee, Dr. Lizabeth A. Allison and Dr. Matthew Wawersik, for their guidance and support. Their input has been extremely useful and my thesis is better because of them. I would also like to thank Lidia Epp for her help in this project. She has been an excellent teacher and I am thankful that I was able to learn from her.
I would like to thank the former members of Dr. Zwollo’s lab, whose work was critical in developing my thesis. I would also like to thank those who helped with the collection of samples in Alaska. Without their help, the project would not have been possible.
Finally, I would like to thank my family and friends for their love and support. They have been essential throughout this journey and I am extremely grateful to have people in my life that I can rely on.

iii
I would like to dedicate this thesis to my family.

iv
LIST OF TABLES
1. Kenai and Copper Run abbreviations 10
2. List of antibodies used in flow cytometry 13
3. Cell staining signatures for each cell type 14
4. Results of a t-test performed on non-binary variables against IHNV prevalence 38
5. Results of a t-test performed on non-binary variables against worm presence 39
6. Results of a t-test performed on all variables against spleen index 40
7. Results of a t-test performed on all variables against distance 42
8. Results of a t-test performed on all variables against water temperature 44

v
LIST OF FIGURES
1. Myeloid cell development 2
2. B cell development 3
3. Map of Alaska with sites from Kenai and Copper Run 10
4. Comparison of rainbow trout and sockeye salmon staining patterns 16
5. Strip charts of significantly different variables when looking at the Kenai Run 25
6. IHNV prevalence for all sites 26
7. Strip charts of significantly different variables for the Copper Run 31
8. Strip charts generated for variables showing significant differences among the spawning sites 35
9. Graphical representation of a correlation matrix using all variables except water temperature and distance 36
10. Graphical representation of a correlation matrix for the Kenai Run, including distance 41
11. Graphical representation of a correlation matrix including water temperature 43
1
Immune Changes in Anterior Kidney of Spawning Sockeye Salmon
1.Introduction
1.1 Life Cycle of Pacific Salmon
Oncorhynchus nerka, or sockeye salmon, are anadromous fish, hatching in
freshwater, maturing in the ocean, and returning to spawn in fresh water. Upon
hatching, fish usually migrate upstream or downstream to a nearby lake where they
reside one to two years (Quinn and Meyers 2004; Rounsefell 1958). They then migrate
to the ocean, where they spend from one to four years. (Rounsefell 1958; Quinn and
Meyers 2004). After maturing in the ocean, adults migrate upriver to their natal
spawning site to spawn, and then die (Quinn and Meyers 2004; Rounsefell 1958). The
freshwater stage of this journey is guided by olfactory senses, where the fish can sense
odors that they imprinted upon during their original journey to the ocean (Dittman and
Quinn, 1996). During this stage, they undergo various endocrine changes as they make
the transition from salt to freshwater and become sexually mature (Flores et al, 2012;
Sandblom et al. 2009; Carruth et al. 2000). They are also exposed to various pathogens
during the journey (Meyers et al. 2008). This project aimed to characterize the changes
in the immune system during the spawning journey of Oncorhyncus nerka in Alaska.
1.2 The Immune System in Fish
Hematopoiesis in mammals takes place in the bone marrow. In salmonids,
which lack bone marrow, immune cell development occurs in their Anterior Kidney
(K1)(Hansen and Zapata, 1998; Zwollo et al. 2005). Hematopoietic stem cells(HSCs)
differentiate into myeloid progenitors and lymphoid progenitors. Myeloid progenitors will
differentiate into granulocyte/ monocyte progenitors and ultimately to monocytes,

2
macrophages, and granulocytes (Figure 1). Myeloid cells are part of the innate immune
response, meaning they are the body’s first response to an infection. These cells
migrate to the site of infection and then activate the adaptive immune system, which is
derived from lymphoid progenitors. The lymphoid progenitors differentiate into
lymphocytes, including B lymphocytes and T lymphocytes. These cells are part of the
adaptive immune response and are highly specific to the antigens on a pathogen (Owen
et al. 2013).
During B cell development, progenitor B cells differentiate into precursor B (pre
B) cells. After the precursor B cell stage, the cell becomes an immature B cell and
begins expressing membrane immunoglobulin, in this case either IgT or IgM for sockeye
Figure 1
Myeloid Cell Development
Visualization of myeloid cell development with relevant markers added to indicate cell staining
patterns. Markers are described in Table 2. Development occurs in the anterior kidney.

3
salmon. Once the cells become mature B cells, they can be activated by binding to an
antigen. After activation, the B cells can become plasmablasts which will differentiate
into plasma cells (Figure 2) (Owen et al. 2013). These plasma cells constantly secrete
antibody to a specific pathogen (Hansen et al. 1998). There is evidence that some of
these plasma cells may survive for long periods of time in the anterior kidney, coining the
term long-lived plasma cells (LLPCs) (Bromage et al. 2004). In the present study, the
majority of plasma cells are believed to be LLPCs given their location in the anterior
kidney.
Figure 2
B cell Development
Visualization of B cell development with relevant markers added to indicate cell staining
patterns. Markers are described in Table 2.

4
After development, immune cells can travel through the blood stream to mucosal
membranes and other parts of the body. In fish, cells can migrate to the gills, peritoneal
cavity, posterior kidney, or spleen among other organs. Some immune cells may reside
in the spleen, a secondary immune organ, until activation (Owen et al. 2013).
The antibodies used in this project were able to detect resting B cells, activated
B cells, plasmablasts, LLPCs, and myeloid lineage cells. Therefore, these were the
primary cell types the project focused on. Q4E, a monoclonal antibody, was used for
identification of myeloid lineage cells (Kuroda et al., 2000). Additionally, the transcription
factor Pu1 was used. Pu1 is responsible for determination of cell lineage; high levels of
Pu1 promote myeloid lineage development and low levels of Pu1 promote lymphoid
lineage development (Mercer et al., 2011). The antagonist of Pu1, Pax5, was used to
identify the B lineage cells. Specifically, the polyclonal antibody Pax5.PD was used to
identify the paired domain of Pax5 (Zwollo et al., 2008). Pax5 is a transcription factor
that promotes B lineage development (Mercer et al., 2011) and is present in developing
B cells, (im)mature B cells, activated B cells, and plasmablasts (MacMurray et al., 2013).
Finally, monoclonal mouse anti-trout Immunoglobulin heavy chain mu antibody was used
to detect IgM+ B lineage cells (DeLuca et al., 1983).
1.3 Pacific Salmon Immune System and Endocrine System
A previous study from our lab found that the abundance of LLPCs in spawning
Oncorhynchus nerka was the same for fish at the site where they entered the river, and
at the spawning site. Additionally, the abundance of immature and mature B cells
decreased between the entrance and spawning site (Schouten et al, 2013). It is known
that levels of the stress hormone cortisol increase during the spawning journey (Baker et

5
al, 2014). Evidence shows that cortisol is used in the transition from fresh to salt water
in teleosts. Specifically, an increase in cortisol provides ion regulation as the salinity
decreases (McCormick 2011). Interestingly, in spawning kokanee salmon, a member of
the species Oncorhynchus nerka that does not participate in a spawning journey, cortisol
levels increased during spanwing, indicating that cortisol is also induced by sexual
maturation. (Carruth et al. 2000). This finding may be a potential factor to explain some
of the observed changes in the immune system. While short term stress can enhance
the immune response, chronic stress can lead to dysregulation and suppression of the
immune system (Dhabhar and Firbaus, 2014). As sockeye salmon have high levels of
cortisol throughout the journey, this is a prime example of both acute stress at the
beginning of the journey and chronic stress later in the journey. A previous study found
that acute stress suppresses the expression of the genes IL-6 and IL-8, which are
involved in the inflammatory response of rainbow trout (Oncorhynchus mykiss), a
salmonid in the same genus as sockeye salmon (Castro et al, 2010). This decreased
gene expression would lead to a weaker response to infection in the fish. In mice, acute
stress decreased lymphocyte abundance while increasing the abundance of myeloid
cells (Maruyama et al, 1999).
Salmon encounter various other endocrine changes during the spawning journey
in addition to upregulated cortisol. There is an increase in sex hormone levels as the
fish are sexually maturing, which suppresses the immune system (Truscott et al. 1986).
Sexual maturity will also lead to an increase in growth hormones, which can promote the
innate immune response (Franz et al., 2016). Additionally, thyroid hormone increases
early during sexual maturation, but decreases before spawning in sockeye salmon
(Biddiscombe and Idler 1983). In masu salmon (Oncorhynchus masou), increases in

6
thyroxine enhance synthesis of IgM (Nagae et al. 1994). Although the effects of each
endocrine change individually is not yet fully understood, these changes may lead to
observed changes in the immune system during spawning. The present study did not
focus on endocrine changes during the spawning journey.
1.4 Pathogens
Freshwater is a superb habitat for numerous parasites, bacteria, and viruses that
infect sockeye salmon. Exposure to these pathogens should stimulate the immune
system. This means that while their immune system is suppressed with stress
hormones, it is stimulated by pathogens. This, in turn, may alter the abundance of
different immune cell types. Since little is known about these alterations, this research
aims to characterize the changes in the immune system to better understand the
spawning journey. Specifically, this project focused on Infectious Hematopoietic
Necrosis Virus (IHNV).
IHNV is a pathogen that is both relevant in the wild and in hatcheries. Although
the disease is generally asymptomatic in adults, juveniles infected with IHNV have a
mortality rate of almost 100% (Kibenge et al. 2012). In hatcheries, this could lead to the
loss of all or most of the fish. In the wild, this would decrease the number of viable
offspring produced by spawning salmon. Additionally, IHNV can infect various other
salmonids exposed to water containing the disease (Meyers et al. 2008). After infection
with IHNV, rainbow trout showed an increase in myeloperoxidase (MPO) RNA, which
indicates the presence of neutrophils and monocytes, in the anterior kidney 24 hours
after infection (MacKenzie et al. 2008). Interestingly, MPO was inhibited in the anterior
kidney 72 hours post infection, suggesting a decrease in monocytes and neutrophils in

7
the anterior kidney (MacKenzie et al. 2008). The same group found that IgM+ B lineage
cells were induced with prolonged infection with IHNV (MacKenzie et al., 2008).
1.5 Research Aims
Sockeye salmon have various obstacles to overcome during the spawning
journey. They have high levels of cortisol in addition to other endocrine changes,
encounter numerous pathogens, and travel potentially long distances. This leads to the
overarching question: how do they survive this journey? This research examined the
immune system to characterize changes and determine how the immune system may
have a role in helping sockeye salmon survive the spawning journey. More specifically,
the research examined changes in abundance of B cells, myeloid cells, and LLPCs. In
addition, the project looked at other variables including spleen size, sex, water
temperature, and IHNV to identify potential correlations with the immune cell types. The
specific aims are as follows:
Aim 1: How does the immune system of Sockeye Salmon change throughout the
spawning journey?
Specifically, this research looked at the abundance of myeloid lineage cells,
resting B cells, activated B cells, plasmablasts, and LLPCs using flow cytometry.
Additionally, the research looked at spleen index, or relative spleen size, as well as
IHNV using Taqman RT-qPCR. Based on previous findings, it was hypothesized that
LLPCs should be unaffected, B cells should decrease in abundance, myeloid cells
should increase in abundance, and IHNV should increase in prevalence (Schouten et al.
2012; Maruyama et al. 1999; Chappell et al. 2017).

8
Aim 2: What are the differences in the immune system of Sockeye Salmon at
different spawning sites?
Flow cytometry and Taqman RT-qPCR were used to examine immune cell
abundance and IHNV prevalence, respectively. Since fish are exposed to different
pathogens, water temperatures, and endocrine changes on the journeys to these
spawning sites, there could be differences in abundance of immune cell types, spleen
index, and prevalence of IHNV among the different sites. Not much research has been
done to compare spawning sites. Based on previous findings, it was expected that Bear
Lake would have a higher prevalence of IHNV than both Moose Creek and Quartz Creek
(Chappell et al. 2017).
Aim 3: How does immune cell type correlate with sex, distance, water
temperature, IHNV, and spleen index?
A correlation analysis was done on data from flow cytometry and Taqman RT-
qPCR. Based on previous findings, it was expected that myeloid lineage cells would
negatively correlate with IHNV infection and IgM+ B lineage cells would positively
correlate with IHNV infection (MacKenzie et al. 2008). It was also expected that IHNV
presence would correlate positively with distance traveled along the spawning journey
(Chappell et al. 2017).

9
2. Methods
2.1 Collection and Processing of Immune Cells from tissues of Salmon during Spawning
Run
Fish were collected from two main spawning runs in southern Alaska: the Kenai
run and the Copper run. Sampling at the Kenai run included the Mouth of the Kenai
(MoK)( Latitude/Longitude: 60.55168/-151.27418), Riverbend Resort
(RBR)(Latitude/Longitude: 60.514304/-151.100113), Bing’s Landing
(BNG)(Latitude/Longitude: 60.515912/-150.701042), Skilak
Lake(SKL)(Latitude/Longtitude: 60.420394/ -150.371685), Russian River(RuR)
(Latitude/Longitude: 60.484252/-149.977788 ), and two spawning sites: Quartz Creek
(QC)(Latitude/Longitude: 60.49562/-149.69714) and Moose Creek
(MC)(Latitude/Longitude: 60.510744/-149.460858)(Figure 3A). The distance in
kilometers from the mouth of the river was measured for the Kenai Run using Google
Maps (Table1). Samples from the Copper run included Million Dollar Bridge
(MDB)(Latitude/Longitude: 60.671030/ -144.747665), East Fork Gulkana
(EFG)(Latitude/Longitude: 63.12460/-145.49274), and the spawning site Mentasta Lake
(ML)( Latitude/Longitude: 63.12460/-143.75423 )(Figure 3B). Distances were also
measures using Google Maps for the Copper Run. Salmon were collected from an
additional spawning site, Bear Lake (BL)(Latitude/Longitude: 60.1985/-149.35525), that
is part of the Resurrection Peninsula Run (Figure 3). Fish were donated by fisherman at
all sites except QC, ML, EFG, and MC, where they were captured by snagging and
immediately euthanized using cerebral concussion. Research permits were obtained by
the Alaska Department of Fish and Game.

10
A B
Run Site Abbreviation Distance (km)
Kenai Mouth of the Kenai MoK 0.01
Kenai Riverbend Resort RBR 25
Kenai Bing’s Landing BNG 64
Kenai Skilak Lake SKL 81
Kenai Russian River RuR 126
Kenai Quartz Creek QC 149
Kenai Moose Creek MC 186
Copper Million Dollar Bridge MDB 44
Copper East Fork Gulkana EFG 457
Copper Mentasta Lake ML 459
Figure 3
Map of Alaska with Sites from Kenai and Copper Run
A. Sites from the Kenai run are numbered 1. Mouth of the Kenai (MoK), 2. Riverbend
Resort (RBR), 3. Bing’s Landing (BNG), 4. Skilak Lake (SKL), 5. Russian River
(RuR), 6. Quartz Creek (spawning site 1), and 7. Moose Creek (spawning site 2).
The additional spawning site, Bear Lake , is labeled 8.
B. Sites at the Copper Run are labelled 1. Lower Copper Sonar (not used), 2. Million Dollar Bridge (MDB), 3. East Fork Gulkana (EFG), and 4. Mentasta Lake (ML)
Table 1
Kenai and Copper Run
Abbreviations
Relative distances from
the mouth of the river
(ocean) to each site
along the journey in
kilometers.

11
Presence of worms was recorded for each fish during collection. After collection,
the anterior kidney was immediately dissected, and the tissue was placed in RPMI 1640.
The tissue was cut up with scissors to release white blood cells and the mixture was
resuspended into a one-millimeter syringe to help release cells from the tissue. The
samples were then put through a 40 nm nylon cell strainer (Falcon/BD Biosciences) and
washed with RPMI 1640 with 10% FBS using centrifugation (250 G for 5 minutes at
4°C). The cells were then layered onto Histopaque 1077 (Sigma Aldrich) and
centrifuged at 500G for 30 minutes at 4°C to separate the white blood cells from the red
blood cells. White blood cells were then fixed using 1% ice cold paraformaldehyde (10%
stock, EM-grade; Electron Microscopy Sciences) and stored in 80% methanol in a -20°C
freezer. Within a week, the cells were refixed in 1% ice cold paraformaldehyde and
stored in fetal bovine serum (FBS) + 10% dimethyl sulfide (DMSO) and immediately
shipped to the College of William and Mary on dry ice for long term storage at -80°C.
Before processing, the spleen was removed from the fish at the field site and the
mass was recorded. This data was used to calculate spleen index by determining the
ratio between spleen mass and fish mass. For PCR experiments, approximately 100mg
of spleen was removed and immediately placed in 700µl of RNAlater® Stabilization
Solution (Ambion # AM7020) in a 1.5 ml Eppendorf tube. Samples were kept at 4°C for
up to 24 hours or until they could be stored at -20°C. All tissue and RNAlater® samples
were shipped to the College of William and Mary using dry ice and stored at -80°C. To
minimize the effect on the environment, fish carcasses were placed back in the water
after tissues were collected.

12
2.2 Staining of Cells for Flow Cytometry
Cells were stained with combinations of the antibodies shown in Table 2.
Approximately 1x10⁶ cells were used per sample. The combinations used were Q4E~B
+ Warrs.555 + Pax5.D.647 and Warrs~B + Pu1.555 + Pax5.PD.647. The antibodies
were diluted as per Table 2 and mixed in the appropriate combinations in Perm + 5%
Fetal Bovine Serum (FBS). These solutions were then added to the cells in a 96-well
polystyrene round bottom plate (Thermo Fisher). The cells were first stained with the
biotinylated antibody, either B~Warrs or B~Q4E. The cells were incubated on a nutator
in a 4°C refrigerator for 30 minutes to allow the antibodies to bind to the cells. The cells
were then washed with Perm + 2% FBS twice and stained with Streptavidin
(SA~APC.750). Cells were incubated on a nutator for 30 minutes before being washed
twice in Perm + 2% FBS. Finally, the cells were stained with the antibodies at 555 and
647 and put on a nutator for 90 minutes at 4°C. The cells were washed twice with Perm
+ 2% FBS to remove any excess antibody and nutated in the dark room for 10 minutes
between washes.

13
Antibody Description Reference Concentration
Pax5.PD.647 Transcription factor; present in developing B cells, (im)mature B cells, activated B cells, plasmablasts
Zwollo et al 1998
0.015mg/ml
Warrs.555 and Warrs~B
Detects IgM DeLuca et al 1983
.0025mg/ml and .015mg/ml
Q4E~B Detects myeloid lineage cells
Kuroda et al 2000
.015mg/ml
Pu1.555 Transcription factor; detects myeloid lineage cells
Santa Cruz Inc .021mg/ml
Streptavidin (SA) APC.750
Binds to biotin on B~Warrs or B~Q4E
Thermo Fisher 0.00075 mg/ml
2.3 Flow Cytometry
Flow cytometry was used to measure the abundance of different immune cell
types. A maximum of 30,000 cells were acquired. A BD FACSArray (BD Biosciences)
was used for experiments. Lasers detected cell size (Forward Scatter or FSC), cell
complexity (Side Scatter or SSC), and fluorescence. This information was transmitted to
graphs that show the FSC, SSC, and fluorescence. By adding a gate or a quadrant,
percentages were obtained to determine the relative abundance of each immune cell
type. To determine the percentage of cells staining positive for each antibody, the
software WinMDI 2-8 was used. Contour graphs were created and the same quadrant
was used for all graphs from one combination of antibodies. During collection, not all
sites had the white and red blood cells removed with Histopaque. Therefore, a gate was
created in the bottom left quadrant of all contours to exclude any red blood cells in the
Table 2
List of antibodies used in flow cytometry.
14
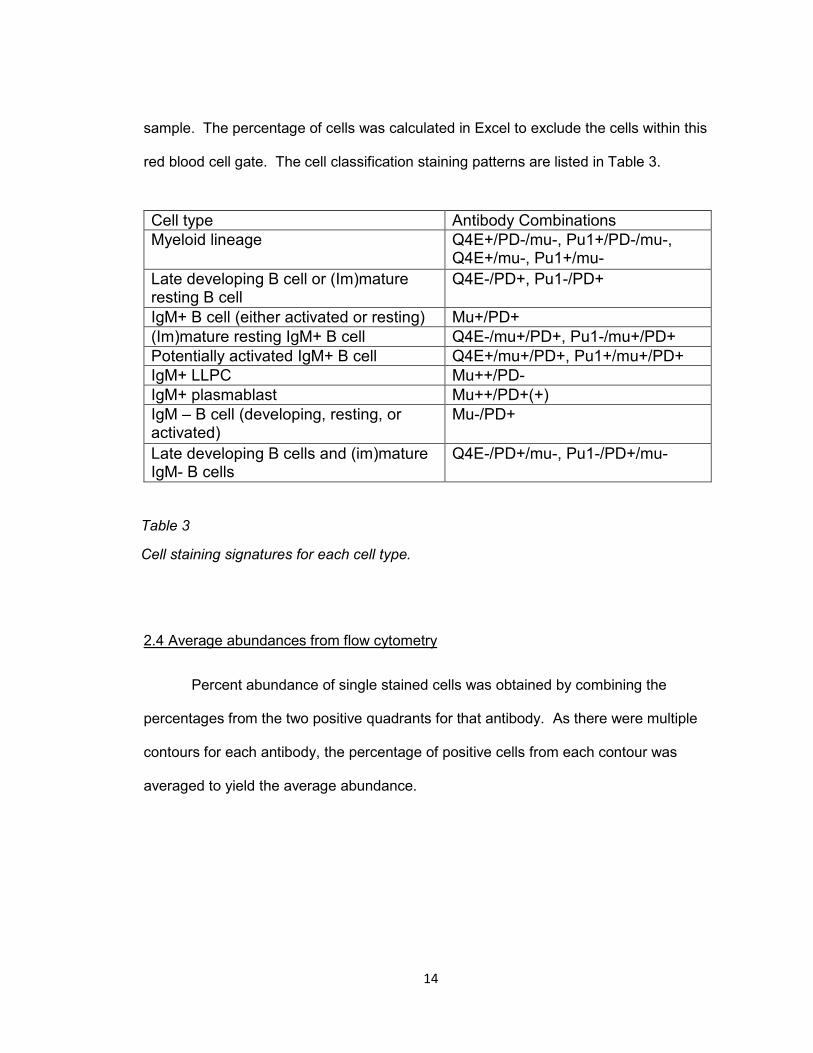
sample. The percentage of cells was calculated in Excel to exclude the cells within this
red blood cell gate. The cell classification staining patterns are listed in Table 3.
2.4 Average abundances from flow cytometry
Percent abundance of single stained cells was obtained by combining the
percentages from the two positive quadrants for that antibody. As there were multiple
contours for each antibody, the percentage of positive cells from each contour was
averaged to yield the average abundance.
Cell type Antibody Combinations
Myeloid lineage Q4E+/PD-/mu-, Pu1+/PD-/mu-, Q4E+/mu-, Pu1+/mu-
Late developing B cell or (Im)mature resting B cell
Q4E-/PD+, Pu1-/PD+
IgM+ B cell (either activated or resting) Mu+/PD+
(Im)mature resting IgM+ B cell Q4E-/mu+/PD+, Pu1-/mu+/PD+
Potentially activated IgM+ B cell Q4E+/mu+/PD+, Pu1+/mu+/PD+
IgM+ LLPC Mu++/PD-
IgM+ plasmablast Mu++/PD+(+)
IgM – B cell (developing, resting, or activated)
Mu-/PD+
Late developing B cells and (im)mature IgM- B cells
Q4E-/PD+/mu-, Pu1-/PD+/mu-
Table 3
Cell staining signatures for each cell type.

15
2.5 Contour Comparison Between Rainbow Trout and Sockeye Salmon in Anterior
Kidney
To determine the relative abundance of different cell types, WinMDI was used to
make contour graphs. To compare our sockeye salmon samples to known patterns,
rainbow trout AK was used. The sockeye salmon samples had a higher abundance of
myeloid lineage cells than rainbow trout, which is reflected in the percentage of
Q4E+/PD- (Figure 4A) and Pu+/PD- (Figure 4B) cells. Additionally, sockeye salmon had
a lower abundance of PD+ cells than rainbow trout. This is evident in the percentages of
Q4E+/PD+ and Q4E-/PD+ cells (Figure 4A), Pu+/PD+ and Pu-/PD+ cells (Figure 4B),
and mu+/PD+ and mu-/PD+ cells (Figure 4E). Sockeye salmon also had a higher
abundance of mu++ cells, reflected in the percentage of Pu-/mu++ cells(Figure 4C),
Q4E+/mu++ and Q4E-/mu++ cells (Figure 4D), and mu++/PD+ cells (Figure 4E).
Finally, sockeye salmon had a lower abundance of IgM+ B lineage cells. This is
reflected in the percentage of Pu+/mu+ and Pu-/mu+ cells (Figure 4C) and Q4E-/mu+
cells (Figure 4D).

16
Figure 4
Comparison of rainbow trout and
sockeye salmon flow cytometry
staining patterns. Combinations are
(A) Q4E and PD, (B) Pu1 and PD,
(C) Pu1 and mu, (D) Q4E and mu,
and (E) mu and PD.

17
2.6 RNA Isolation
Spleen samples were stored in RNAlater at -80°C. Samples were thawed and
approximately 50mg was put in 1 ml RNAzol RT (Molecular Research Centers, Inc) in a
lysing tube without beads. Samples were placed in the Omni Beadruptor 24 (Omni
International) for 30 seconds at speed 5. Next, 400µl of UltraPure™ DNase/RNase-Free
Distilled Water (Invitrogen, Inc.) was added and tubes were shaken by hand for 15-20
seconds. After, the spleen samples were incubated at room temperature for 10 minutes
before being centrifuged for 15 minutes at 12000 G at room temperature. The
supernatant was transferred to a new 1.5ml Eppendorf tube with 500µl of 75% ethanol
mixture from Absolute 200 Proof Ethyl Alcohol (Pharmco-AAPER, #111000200). The
samples were shaken for 15-20 seconds and incubated at room temperature for 10
minutes. Then, the samples were centrifuged at room temperature for 10 minutes at
10000 G. Next, the supernatant was poured off carefully so the pellet would remain on
the bottom. 1ml of 75% ethanol mixture was added, the samples were shaken and then
centrifuged for 2 minutes at 10000 G at room temperature. The supernatant was poured
off gently and the wash with ethanol was repeated once. The tubes were allowed to dry
for 15-20 minutes. After samples were completely dry, 50-100µl of molecular grade
water was added. RNA concentration was measured using a Nanodrop ND-1000
Spectrophotometer (Thermo Fisher Scientific Inc.) and samples were stored at -80°C.
2.7 TaqMan RT-qPCR
To determine IHNV load, Taqman RT-qPCR was used to target the N-gene, a
conserved gene in the virus (Chappell et al 2017). A TaqMan® RNA-to-CT™ 1-Step Kit
(Applied Biosystems #4392653), was used to perform Taqman RT-qPCR. RNA

18
samples were thawed and placed on ice. Samples were diluted to 50ng/µl and kept on
ice. In the AirClean 600 PCR Work Station (AirClean® Systems, Inc.), the master mix
was made according to the manufacturers protocol and 19µl was placed in each well of
a MicroAmp® Fast Optical 48 or 96 Well Reaction Plate (Thermo Fisher Scientific, Inc.).
The plate was transferred back to the bench where 1µl of sample, standard, or control
RNA was added to each well. Each plate had standards, a positive control, and a
negative template control. The standards ranged by a factor of 10 from 10 copies to
1,000,000 copies (Chapell et al 2017). Using a MicroAmp® Adhesive Film Applicator
(Applied Biosystems), MicroAmp® Optical Adhesive Film (Thermo Fisher Scientific, Inc.)
was added and the plate was centrifuged for 10-20 seconds in the plate centrifuge. The
N gene target was detected using a 48 or 96 well StepOnePlus™ Real-Time PCR
System Instrument (Applied Biosystems). The plates were run at 48°C for 15 minutes
and then 95°C for 10 minutes. After, the plates were run for 40 cycles of 95°C for 15
seconds and 60°C for 1 minute. Copy number of N gene was determined by the
StepOne software based on the standards. All samples were run in triplicate.
2.8 Statistical Analysis
Strip charts were made using the package “ggplot” (“ggplot2 Stripchart (Jitter) :
Quick Start Guide - R Software and Data Visualization - Documentation - STHDA”
2016), (“Plotting Means and Error Bars (ggplot2)” 2016), (“Summarizing Data” 2016),
(Wickham, Chang, and RStudio 2016) in the environment R (R Core Team 2015) to
visualize the mean, standard error, and range of data from each site. An ANOVA was
done followed by a Tukey-Kramer multiple comparisons of means test to determine if
sites were significantly different from one another (Lau 2013). This test controls for Type

19
I error, or the act of falsely obtaining significance when comparing multiple means. P-
values of less than or equal to 0.05 were used to assign significance.
A correlation test was performed using the environment R (R Core team 2015).
To generate numerical data, sex was coded binary where “0” indicated female and “1”
indicated male. In addition, IHNV was converted to binary where “0” had 0 copy
numbers and “1” had a copy number not equal to zero. This binary system checks to
see if just the presence of virus effected the other variables. For the correlation, IHNV
load was also included, or the number of copies per 50ng of cDNA. Fish with missing
data were omitted to perform the analysis, which accounted for 13 samples total and
brought the total fish number down to 111. A plot of the correlation was created using
the package “corrplot.” Variables with useful correlations were explored using a
student’s t-test in the environment R. When performing these t-tests, the flow cytometry
data remained unscaled. To perform a t-test using non-binary variables, the median
value of the variables was used. Values below or equal to the median were grouped
and values above the median were grouped. This allowed a t-test to be performed
between two groups to determine if correlation were significant. To assign significance,
a p-value of less than or equal to 0.05 was used.
The environment R was used to perform a principal component analysis (R Core
team 2015). Non-binary variables were scaled to have a normal distribution. A biplot
was generated using R to visualize the variables in relation to principal component 1 and
principal component 2. Additionally, a graph was generated to show the proportion of
variance explained by each principal component using R.

20
3. Results
To determine whether there were changes in the immune system during the
spawning journey in sockeye salmon, fish were collected from two different spawning
runs in Alaska: the Kenai Run and the Copper Run. Using flow cytometry, the relative
abundance of myeloid lineage cells, (im)mature B cells, activated B cells/ plasmablasts,
and LLPCs in the anterior kidney was determined. Additionally, the abundance of cells
staining for each antibody in Table 2 was calculated using flow cytometry. Spleen index
and worm presence was also determined for each fish. Additionally, IHNV load was
determined using RT-qPCR. Statistical significance was determined using an ANOVA
followed by a Tukey Multiple Comparison of Means test.
3.1 Kenai Run
Myeloid lineage cells
For the Kenai Run, the distance from the mouth of the river for each site was
used for analysis (Table 1). Cells that stained Q4E+/PD-/mu-, Pu1+/PD-/mu-, Q4E+/mu-
, and Pu1+/mu- were classified as myeloid lineage cells (Table 3). Site D149 (149km
upstream from the mouth of the Kenai River) had a significantly higher abundance of
Q4E+/PD-/mu- myeloid lineage cells than site D64 (Figure 5A). Site D64 had a
significantly lower abundance of Q4E+/mu- myeloid lineage cells than fish at sites D0.01,
D25, D81, D149, and D186. (Figure 5B). There were no significant differences in
Pu1+/PD-/mu- or Pu1+/mu- myeloid lineage cells among the sites and average
abundance was 22.6% and 41.6%, respectively. In general, there was a slight decrease
in Q4E+ myeloid cell abundance early in the journey followed by an immediate increase.

21
B lineage cells
(Im)mature resting B cells were classified as cells that stained Q4E-/PD+ or Pu1-
/PD+ (Table 3). Fish at site D126 had a significantly higher abundance of Q4E-/PD+
(im)mature resting B cells than fish at sites D0.01, D25, D64, D149, and D186
(Supplemental Figure 1A). Similarly, site D126 had a significantly higher abundance of
Pu1-/PD+ (im)mature resting B cells than the sites D0.01, D64, and D149 (Supplemental
Figure 1B). The general trend was that (im)mature resting B cells increase in
abundance late in the journey and decrease before reaching the spawning sites.
(Im)mature resting IgM- B cells were classified as cells that stained Q4E-
/PD+/mu- or Pu1-/PD+/mu- (Table 3). Fish at site D186 had a significantly higher
abundance of Pu1-/PD+/mu- (im)mature resting B cells than sites D64, D81, D126 and
D149 (Supplemental Figure 1C). There were no significant differences in Q4E-/PD+/mu-
cells and average abundance was 2.2%. The overall trend was that abundance of
resting IgM- B cells increases at the second spawning site and is constant throughout
the journey.
To determine the relative abundance of IgM+ (im)mature resting B cells, I used
cells that stained either Q4E-/mu+/PD+ or Pu1-/mu+/PD+ (Table 3). Site D64 had a
significantly higher abundance of Q4E-/mu+/PD+ (im)mature resting B cells than sites
D0.01, D25, D149 and D186 (Figure 5C). Additionally, site D126 had a significantly
higher abundance of Q4E-/mu+/PD+ (im)mature resting B cells than site D186 (Figure
5C). Fish at site D126 also had a significantly higher abundance of Pu1-/mu+/PD+
(im)mature resting B cells than sites D0.01, D25, D64, D149, and D186 (Figure 5D).
Site D81 had a significantly higher abundance of Pu1-/mu+/PD+ (im)mature resting B

22
cells than sites D0.01, D25, D64, D149, and D186(Figure 5D). In general, there was an
increase in abundance of IgM+ (Im)mature resting B cells towards the end of the journey
followed by a decrease just before the spawning sites. Additionally, IgM+ (im)mature B
cells increase in the middle of the journey and may decrease immediately after
depending on the marker used.
Then, the relative abundance of IgM+ B lineage cells(mu+/PD+) and IgM- B
lineage cells (mu-/PD+) was determined. Site D186 had a significantly higher
abundance of mu-/PD+ B lineage cells than all other sites (Supplemental Figure 1D).
There were no significant differences in mu+/PD+ cells and average abundance was
4.6%.
Next, the relative abundance of Q4E+/mu+/PD+, Pu1+/mu+/PD+, Q4E+/PD+, or
Pu1+/PD+ cells was determined. These cells are of unknown identity, but were named
activated B cells for this study (Table 3). Fish at site D64 had a significantly higher
abundance of Q4E+/mu+/PD+ activated B cells than fish at the spawning sites D149 and
D185 (Supplemental Figure 1E). Sites D64 and D81 had a significantly lower
abundance of Q4E+/PD+ cells than the spawning sites D149 and D186 (Figure 5E).
Additionally, fish at site D186 had a significantly higher abundance of Pu1+/PD+
activated B cells than sites D64, D81, D126 and D149 (Figure 5F). There were no
significant differences between sites in Pu1+/mu+/PD+ activated B cells and average
abundance was 5.9%. Overall, the abundance of activated B cells increased at the
spawning sites.
The relative abundance of LLPCs in the AK was determined for fish at each site
using cells that stained mu++/PD-. Fish at site D126 had a significantly higher

23
abundance of LLPCs than fish at all other sites (Figure 5G). Fish at site D81 had a
significantly higher abundance LLPCs than fish at site D186 (Figure 5G). The general
trend is that LLPC abundance increases towards the end of the journey and decreases
at the spawning sites.
The abundance of plasmablasts was determined using cells that stained
mu++/PD+(+). Fish at site D126 had a significantly higher abundance of plasmablasts
than fish at the sites D0.01, D64, D81, D149, and D186 (Supplemental Figure 1F). Fish
at site D25 had a significantly higher abundance of plasmablasts than fish at the sites
D0.01, D64, D81, D149, and D186 (Supplemental Figure 1F). Plasmablasts abundance
peaked twice during the journey, once early in the journey and once late in the journey.
Single Stains
Finally, the relative abundance of all single stain cells among sites at the Kenai
Run was determined. The two spawning sites, D149 and D186, had a significantly
higher abundance of Q4E+ cells than site D64 (Supplemental Figure 1G). Fish at site
D186 had a significantly higher abundance of PD+ cells than fish at sites D64 and D81
(Supplemental Figure 1H). The first two sites, D0.01 and D25, had a significantly higher
abundance of PD++ cells than sites D64, D81, and D186 (Supplemental Figure 1I). Site
D126 had a significantly higher abundance of mu+ cells than the entrance site, D0.01,
and the two spawning sites, D149 and D186 (Supplemental Figure 1J). The average
abundance of mu++ cells at site D126 was significantly higher than fish at all other sites
along the journey (Supplemental Figure 1K). Additionally, fish at site D25 had a
significantly higher abundance of mu++ cells than fish at the spawning sites, D149 and

24
D186 (Supplemental Figure 1L). There were no significant differences in average Pu1+
cells among sites in the Kenai Run and average abundance was 39.18%.
Spleen Index
Spleen mass was recorded for each fish to determine the spleen index. Site
D186 had a significantly lower spleen index than sites D0.01, D25, D64, D81 and D126.
Site D149 had a significantly lower spleen index than site D126 (Figure 5H). In general,
spleen index was lower at the spawning sites.
IHNV
IHNV prevalence and load was determined using RT-qPCR. Prevalence
indicates if the virus is present and load indicated amount of virus present. The
spawning sites D149 and D186 had a higher prevalence of IHNV infection than all other
sites (Figure 6). There were no significant differences in IHNV load (data not shown).

25

26
Figure 6
IHNV prevalence for all sites. Sites are grouped by spawning run. Spawning sites are
outlined with a black box.
Figure 5
Strip charts of significantly different variables when looking at the Kenai Run. Sites without a
common letter are significantly different. Sites are replaced with the distance from the mouth
of the river and a curve of best fit was applied. (A) and (B) are myeloid lineage cells, (C) and
(D) are IgM+ (im)mature B cells, (E) and (F) are activated B cells, (G) is LLPCS, and (H) is
Spleen Index. Significance values are: (A) D64 and D149 (p=0.04), (B) D64 and D0.01
(p=0.007), D64 and D25 (p=0.007), D64 and D81 (p=0.001), D64 and D149 (p=0.000004),
and D64 and D186 (p=0.00004). (C) D64 and D0.01 (p=0.02), D64 and D25 (p=0.05), D64
and D149 (p=0.003), D64 and D186 (p=0.0008), D126 and D186 (p=0.02). (D) D126 and
D0.01 (p=0.0005), D126 and D25 (p=0.00005), D126 and D64 (p=0.0003), D126 and D149
(p=0.0005), D126 and D186 (p=0.002), D81 and D0.01 (p=0.02), D81 and D25 (p=0.002), D81
and D64 (p=0.01), D81 and D149 (p=0.02), and D81 and D186 (p=0.05). (E) D64 and D149
(p=0.004), D64 and D186 (p=0.003), D81 and D149 (p=0.01), and D81 and D186 (p=0.007).
(F) D186 and D64 (p=0.00008), D186 and D81 (p=0.00004), D186 and D126 (p=0.04), and
D186 and D149 (p=0.01). (G) D126 and D0.01 (p=0.00000000005), D126 and D25
(p=0.00000002), D126 and D64 (p=0.000000001), D126 and D81 (p=0.00003), D126 and
D149 (p=0.000000003), D126 and D186 (p=0.0000000001), and D81 and D186 (p=0.03). (H)
D186 and D0.01 (p=0.04), D186 and D25 (p=0.04), D186 and D64 (p=0.0002), D186 and D81
(p=0.02), D186 and D126 (p=0.0004), and D149 and D126 (p=0.02).

27
3.2 Copper Run
Myeloid lineage cells
First, the relative abundance of myeloid lineage cells was determined using cells
that stained Q4E+/PD-/mu-, Pu1+/PD-/mu-, Q4E+/mu-, and Pu1+/mu- (Table 3). Fish
caught at the MDB site had a significantly lower abundance of Q4E+/PD-/mu- myeloid
lineage cells than those from EFG and ML (Figure 7A). There were no significant
differences in Pu1+/PD-/mu-, Q4E+/mu- cells, and Pu1+/mu- myeloid lineage cells and
average abundance was 32.7%, 59.6%, and 38.1%, respectively. In general, myeloid
cell abundance was lowest at the beginning of the journey.
B lineage cells
Next, the relative abundance of (im)mature resting B cells was determined, which
were classified as cells that stained Q4E-/PD+ or Pu1-/PD+ (Table 3). Fish at ML had a
significantly lower abundance of Q4E-/PD+ (im)mature resting B cells than fish at EFG
and MDB (Figure 7B). Similarly, fish ML had a significantly lower abundance of Pu1-
/PD+ (im)mature resting B cells than those at EFG and MDB (Figure 7C). In general,
(im)mature B cell abundance remained constant during the journey and decreased at the
spawning site.
(Im)mature IgM- resting B cells were classified as cells that stained Q4E-
/PD+/mu- or Pu1-/PD+/mu- (Table 3). Fish at MDB had a significantly higher abundance
of Q4E-/PD+/mu – cells than fish at ML (Figure 7D). Fish at MDB had a significantly
higher abundance of Pu1-/PD+/mu- cells than fish at EFG and ML (Figure 7E).
Additionally, EFG had a significantly higher abundance of Pu1-/PD+/mu- cells than those
28
at ML (Figure 7E). The overall trend was that IgM- (im)mature B cell abundance
decreased throughout the journey.
Cells that stained Q4E-/mu+/PD+ or Pu1-/mu+/PD+ were used to determine the
relative abundance of IgM+ (im)mature resting B cells (Table 3). Fish caught at EFG
had a significantly higher abundance of Q4E-/mu+/PD+ B cells than fish at MDB and ML
(Figure 7F). Fish at the MDB and EFG sites had significantly more Pu1-/mu+/PD+ B
cells than fish at ML (Figure 7G). In general, IgM+ (im)mature B cell abundance
decreases before the spawning site.
The relative abundance of IgM+ B cells (either resting or activated) and IgM- B
lineage cells (either resting or activated) was determined using cells that stained
mu+/PD+ and mu-/PD+, respectively. Fish at EFG had a significantly higher abundance
of mu+/PD+ cells than those at MDB and ML (Supplemental Figure 2A). Fish collected
at MDB had a significantly higher abundance of mu-/PD+ cells than those at EFG and
ML (Supplemental Figure 2B). IgM+ B cells increased late in the journey but decreased
before the spawning site and IgM- B cell abundance was highest early in the journey.
Then, the relative abundance of Q4E+ or Pu1+ B cells was determined using
cells that stained Q4E+/mu+/PD+, Pu1+/mu+/PD+, Q4E+/PD+, or Pu1+/PD+. These
were classified as activated B cells (Table 3). There were no significant differences in
activated B cells among fish at the Copper Run. The average abundances were 8.0%,
7.98%, 18.4%, and 9.7%, respectively.
The relative abundance of LLPCs was determined using cells that stained
mu++/PD- (Table 3). Fish caught at EFG had a significantly higher abundance of LLPCs
29
than fish at MDB and ML (Figure 7H). The general trend was that LLPCs increased late
in the journey and then decreased before the spawning site.
Additionally, the relative abundance of plasmablasts was determined. Cells that
were mu++/PD+ were classified as plasmablasts (Table 3). There were no significant
differences in abundance of plasmablasts among sites at the Copper Run and the
average abundance was 0.5%.
Single Stains
The relative abundance of all single stained cells was determined. Fish at EFG
had a significantly lower abundance of Q4E+ cells than those at MDB and ML
(Supplemental Figure 2C). Fish at MDB had a significantly higher abundance of PD+
cells than fish at EFG and ML (Supplemental Figure 2D). Fish caught at EFG had
significantly more mu+ cells than fish at MDB and ML (Supplemental Figure 2E).
Additionally, fish at EFG had a higher abundance of mu++ cells than those at MDB and
ML (Supplemental Figure 2F). There were no significant differences in Pu1+ or PD++
cells among sites at the Copper Run and the average abundances were 45.9% and
0.9%, respectively.
Spleen Index
Spleen Index was determined for all fish. EFG had a significantly larger spleen
index than both MDB and ML (Figure 7I).4

30
IHNV
IHNV prevalence and load were determined using RT-qPCR (Figure 6). MDB
and ML had fish infected with IHNV, while all fish at EFG were not infected with IHNV.
There were no significant differences in IHNV load (data not shown).

31

32
3.3 Comparison of Spawning Sites
Myeloid lineage cells
The relative abundance of myeloid lineage cells was compared between
spawning sites using cells that stained Q4E+/PD-/mu-, Pu1+/PD-/mu-, Q4E+/mu-, or
Pu1+/mu- (Table 3). Fish ML had a significantly higher abundance of Pu1+/PD-/mu-
myeloid lineage cells than MC and BL (Figure 8A). BL had the lowest abundance of
Pu1+/mu- myeloid cells (Figure 8B). There were no significant differences in Q4E+/PD-
Figure 7
Strip charts with significant differences between variables for the Copper River Run. Sites
without a common letter are significantly different. (A) is myeloid lineage cells, (B) and (C)
are (im)mature B cells, (D) and (E) are IgM- (im)mature B cells, (F) and (G) are IgM+
(im)mature B cells, (H) is LLPCs, and (I) is Spleen Index. Significance values are: (A) MDB
and EFG (p=0.007), and MDB and ML (p=0.0007). (B) ML and MDB (p=0.00007) and ML
and EFG (p=0.0002). (C) ML and MDB (p=0.001) and ML and EFG (p=0.002). (D) MDB and
ML (p=0.04). (E) MDB and EFG (p=0.05), MDB and ML (p=0.00004), and EFG and ML
(0.006). (F) EFG and MDB (p=0.04) and EFG and ML (p=0.000007). (G) ML and MDB
(p=0.002) and ML and EFG (p=0.00004). (H) EFG and MDB (0.01) and EFG and ML
(p=0.01). (I) EFG and MDB (p=0.04) and EFG and ML (p=0.006).

33
/mu- or Q4E+/mu- cells and average abundances were 54.2% and 59.0%. In general,
BL had a lower abundance of Pu+ myeloid cells than the other sites.
B lineage cells
The abundance of (im)mature resting B cells was determined using cells that
were Q4E-/PD+ or Pu1-/PD+. MC had the highest abundance of Pu1-/PD+ (im)mature
B cells. (Figure 8C). There were no significant differences in Q4E-/PD+ (im)mature B
cells among the spawning sites and average abundance was 3.4%.
To determine the abundance of IgM- (im)mature B cells, I used cells that stained
either Q4E-/PD+/mu- or Pu1-/PD+/mu-. Fish MC had a significantly higher abundance
of Q4E-/PD+/mu- cells than ML and BL (Figure 8D). Similarly, MC had the highest
abundance of Pu1-/PD+/mu- cells (Figure 8E). In general, fish at MC had the highest
abundance of IgM- (im)mature B cells.
IgM+ resting (im)mature B cell abundance was also determined using cells that
stained Q4E-/mu+/PD+ or Pu1-/mu+/PD+ (Table 3). Fish at BL had a significantly
higher abundance of Pu1-/mu+/PD+ B cells than those at QC and ML (Figure 8F).
There were no significant differences in Q4E-/mu+/PD+ B cells among the spawning
sites and average abundance was 2.5%.
There were no significant differences in the relative abundance of resting or
activated IgM+ B cells (mu+/PD+) or IgM- B lineage cells (mu-/PD+)(Table 3). The
average abundances were 4.8% and 14.4%, respectively. Also, there were no
significant differences in abundance of activated B cells (Q4E+/mu+/PD+,
Pu1+/mu+/PD+, Q4E+/PD+, or Pu1+/PD+)(Table 3). The average abundances were
7.5%, 6.7%, 12.2%, and 10.7%, respectively. Finally, there were no significant

34
differences in abundance of LLPCs (mu++/PD-) or plasmablasts (mu++/PD+(+)) at the
spawning sites (Table 3). The average abundance of LLPCs was 1.2% and the average
abundance of plasmablasts was 0.5%.
Single Stains
Finally, I determined the relative abundance of single stain cells. Fish at BL had
a significantly lower abundance of Pu1+ cells than those at ML and QC (Supplemental
Figure 3A). Fish at MC had a significantly higher abundance of PD+ cells than fish at
ML (Supplemental Figure 3B). There were no significant differences in Q4E+, PD++,
mu+, or mu++ cells. The average abundances were 66.5%, 1.0%, 9.0%, and 1.7%,
respectively.
Spleen Index
To determine spleen index, spleen mass was collected for all fish. There were no
significant differences in Spleen Index among the spawning sites. The average Spleen
Index was 0.9.
IHNV
RT-qPCR on N-gene was used to determined IHNV prevalence and load. IHNV
was detected at all four spawning sites. BL had the most with 100% infection
prevalence, followed by MC, QC and then ML (Figure 5). There were no significant
differences in IHNV load (data not shown).

35
Figure 8
Strip charts generated for variables with significant difference at the spawning sites. Sites
without a common letter were significantly different. (A) and (B) are myeloid lineage cells, (C) is
(im)mature B cells, (D) and (E) are IgM- (im)mature B cells, and (F) is IgM+ (im)mature B cells.
The significance values are (A) ML and MC (p=0.0006) and ML and BL (p=0.008). (B) BL and
MC (p=0.004), BL and QC (p=0.00002), and BL and ML (p=0.001). (C) MC and QC (p=0.005),
MC and ML (p=0.000007), and MC and BL (p=0.005). (D) MC and ML (p=0.04) and MC and
BL (p=0.04). (E) MC and QC (p=0.0009), MC and ML (p=0.000002), and MC and BL
(p=0.00002). (F) BL and QC (p=0.03) and BL and ML (p=0.006).

36
3.4 Correlation Analysis
Using R, a correlation matrix was generated to determine which variables had
correlations (Figure 9). For variables with correlations, a student’s t-test was used to
determine significance. Although correlations appear in Figure 9, a t test was not used
to determine significance within flow cytometry data as the abundances are dependent
on each other. However, the notable flow cytometry correlations are addressed below.
For the flow cytometry data, it is interesting to note that Pu+ and mu+ cells had a
strong positive correlation, as Pu1 is a myeloid marker and mu is a marker for IgM+ B
Figure 9
Graphical representation of a correlation matrix of all variables made in R using ‘corrplot’.
Blue dots represent a positive correlation, red dots indicate a negative correlation.
Darker and larger dots represent a stronger correlation.

37
lineage cells. Interestingly, Q4E+ and Pu+ cells were expected to have a strong positive
correlation, however they had a weak positive correlation. This held true for all Q4E+
and Pu+ myeloid lineage cells, and Q4E+/mu- cells negatively correlated with Pu+/mu-
cells.
To determine if the correlations on the chart were significant, a t-test was
performed between IHNV presence and all other non-binary variables in the data. There
were significant negative correlations between IHNV presence and Spleen Index, Q4E-
/PD+ B cells, Pu1+/PD-/mu- myeloid cells, Q4E+/mu+/PD+ activated B cells, Q4E-
/mu+/PD+ B cells, mu+/PD- cells, pu+/mu- myeloid cells, average pu+ cells, and
average mu+ cells (Table 4B). There were significant positive correlations between
IHNV presence and Q4E+/mu- myeloid cells and mu-PD+ (im)mature or developing B
cells (Table 4A).

38
A
B
t-test using presence of IHNV (negative correlations)
Name Mean where IHNV is absent
Mean where IHNV is present P-value
Spleen Index 1.45 0.98 0.0086
Q4E-/PD+ (%) 6.25 4.03 0.0048
Pu+/PD-/mu- (%) 27.41 15.36 0.000023
Q4E+/mu+/PD+ (%) 12.09 8.25 0.0080
Q4E-/mu+/PD+ (%) 6.96 2.88 0.000057
mu+/PD- (%) 3.61 1.48 0.0016
Pu+/mu- (%) 42.47 31.94 0.0017
Pu+ (%) 42.49 33.00 0.0034
mu+ (%) 13.16 9.85 0.0059
Next, a t-test was performed between sex and the other non-binary variables in
the data to determine which correlations may be significant. Males had a higher spleen
index than females. The average male spleen index was 1.564, while the average
female spleen index was 1.154. The t-test yielded a p-value of 0.043.
A t-test was then used to determine significant correlations between the non-
binary variables in the data set and presence of worms in the fish. There was a
t-test using presence of IHNV (positive correlations)
Name Mean where IHNV is absent
Mean where IHNV is present P value
Q4E+/mu- (%) 49.32 58.28 0.015
mu- /PD+ cells (%) 11.06 18.65 0.041
Table 4
Results of a t-test performed on non-binary variables against IHNV prevalence. A. Positive
correlations, B. Negative correlations.
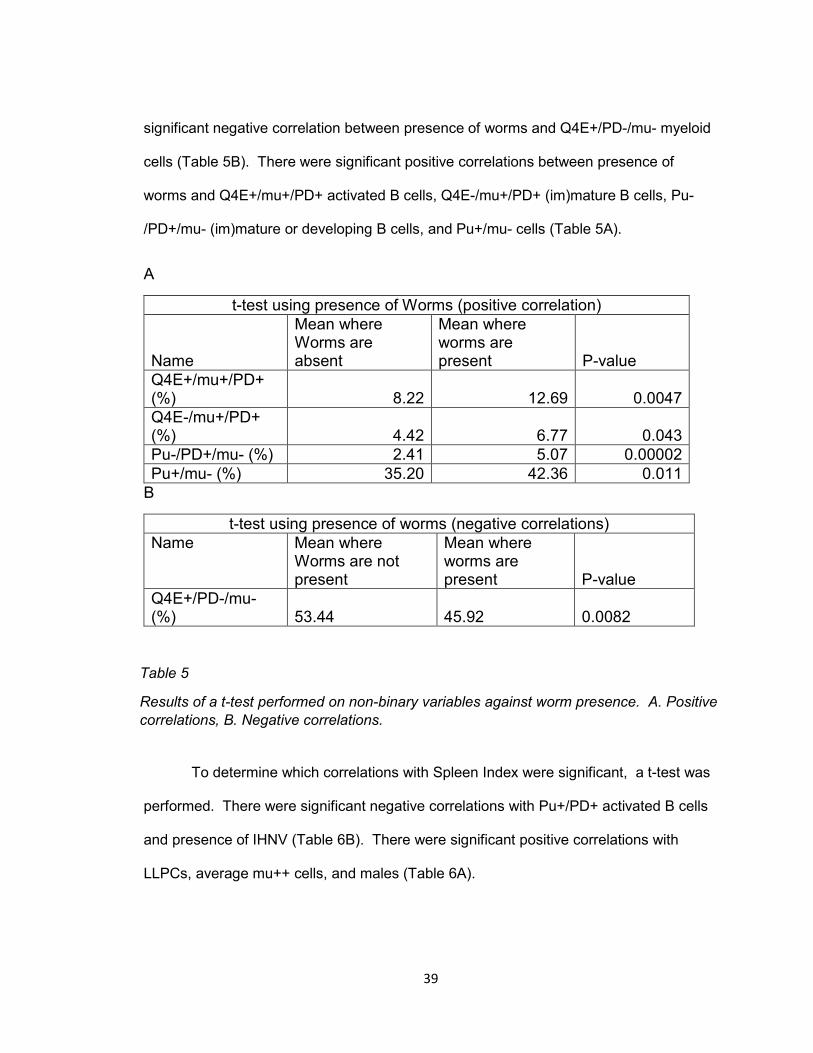
39
significant negative correlation between presence of worms and Q4E+/PD-/mu- myeloid
cells (Table 5B). There were significant positive correlations between presence of
worms and Q4E+/mu+/PD+ activated B cells, Q4E-/mu+/PD+ (im)mature B cells, Pu-
/PD+/mu- (im)mature or developing B cells, and Pu+/mu- cells (Table 5A).
A
t-test using presence of Worms (positive correlation)
Name
Mean where Worms are absent
Mean where worms are present P-value
Q4E+/mu+/PD+ (%) 8.22 12.69 0.0047
Q4E-/mu+/PD+ (%) 4.42 6.77 0.043
Pu-/PD+/mu- (%) 2.41 5.07 0.00002
Pu+/mu- (%) 35.20 42.36 0.011
B
t-test using presence of worms (negative correlations)
Name Mean where Worms are not present
Mean where worms are present P-value
Q4E+/PD-/mu- (%) 53.44 45.92 0.0082
To determine which correlations with Spleen Index were significant, a t-test was
performed. There were significant negative correlations with Pu+/PD+ activated B cells
and presence of IHNV (Table 6B). There were significant positive correlations with
LLPCs, average mu++ cells, and males (Table 6A).
Table 5
Results of a t-test performed on non-binary variables against worm presence. A. Positive
correlations, B. Negative correlations.

40
A
t-test using Spleen Index (positive correlations)
Name
Mean when SI is below or equal to median
Mean when SI is above median P-value
LLPCs (%) 1.24 1.75 0.0073
mu++ (%) 1.95 2.81 0.0022
SexBinary (females)
0.36 (males)
0.55 0.047
B
t-test using Spleen Index (negative correlations)
Name Mean when SI is below or equal to median
Mean when SI is above median P-value
Pu+/PD+ (%) 11.84 8.30 0.028
IHNVBinary (absence)
0.39
(presence)
0.09 0.00016
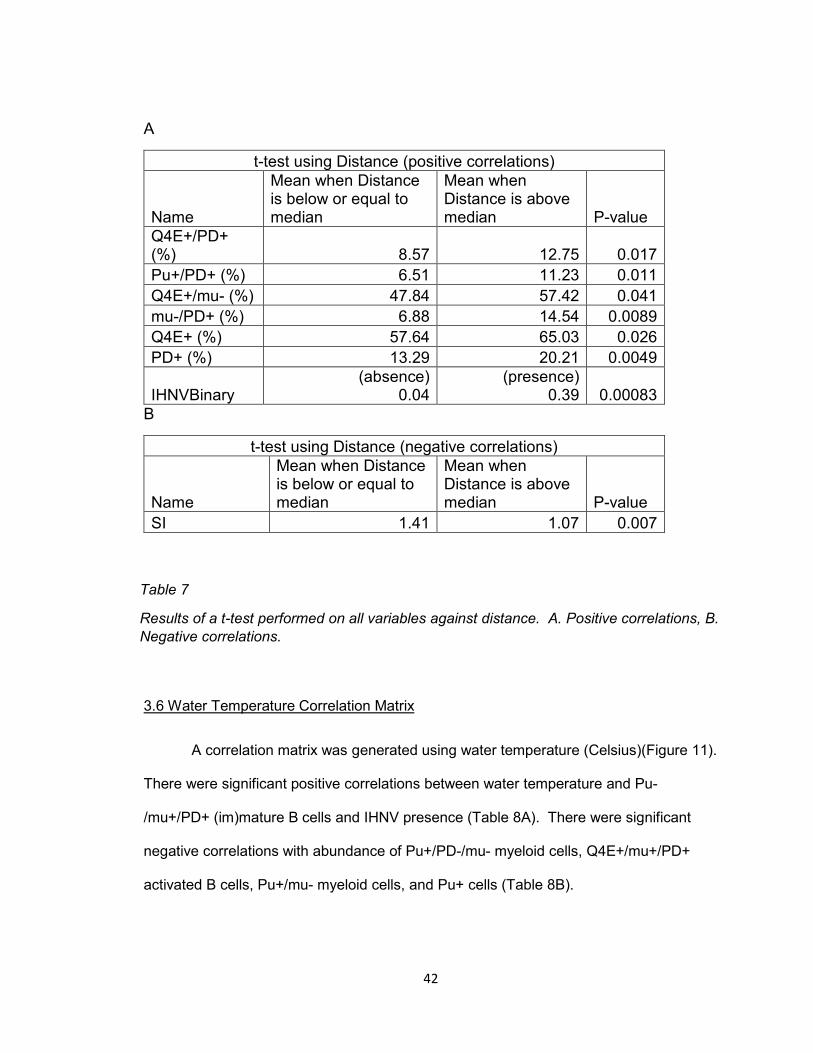
3.5 Kenai Correlation Matrix
For the Kenai run, a correlation matrix was used with the distance of each site
from the start of the spawning journey (Figure 10). There were significant positive
correlations between distance and abundance of Q4E+/PD+ activated B cells, Pu+/PD+
activated B cells, Q4E+/mu- myeloid cells, mu-/PD+ (im)mature or developing B cells,
Q4E+ cells, PD+ cells, and presence of IHNV (Table 7A). There was a significant
negative correlation between distance and spleen index (Table 7B).
Table 6
Results of a t-test performed on variables against Spleen Index. A. Positive correlations, B.
Negative correlations.

41
Figure 10
Graphical representation of a correlation matrix for the Kenai run, which includes
distance. Positive correlations are blue and negative correlations are red. Stronger
correlations are indicated by darker and larger circles.
42
A
t-test using Distance (positive correlations)
Name
Mean when Distance is below or equal to median
Mean when Distance is above median P-value
Q4E+/PD+ (%) 8.57 12.75 0.017
Pu+/PD+ (%) 6.51 11.23 0.011
Q4E+/mu- (%) 47.84 57.42 0.041
mu-/PD+ (%) 6.88 14.54 0.0089
Q4E+ (%) 57.64 65.03 0.026
PD+ (%) 13.29 20.21 0.0049
IHNVBinary (absence)
0.04 (presence)
0.39 0.00083
B
t-test using Distance (negative correlations)
Name
Mean when Distance is below or equal to median
Mean when Distance is above median P-value
SI 1.41 1.07 0.007
3.6 Water Temperature Correlation Matrix
A correlation matrix was generated using water temperature (Celsius)(Figure 11).
There were significant positive correlations between water temperature and Pu-
/mu+/PD+ (im)mature B cells and IHNV presence (Table 8A). There were significant
negative correlations with abundance of Pu+/PD-/mu- myeloid cells, Q4E+/mu+/PD+
activated B cells, Pu+/mu- myeloid cells, and Pu+ cells (Table 8B).
Table 7
Results of a t-test performed on all variables against distance. A. Positive correlations, B.
Negative correlations.
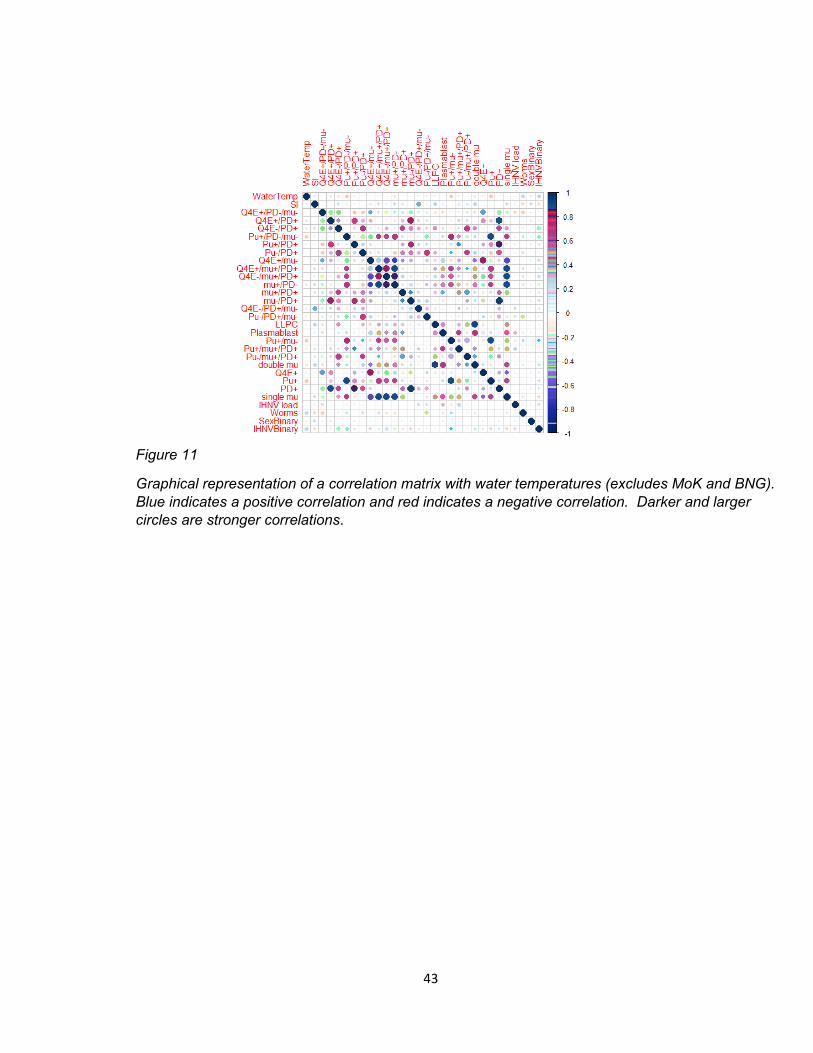
43
Figure 11
Graphical representation of a correlation matrix with water temperatures (excludes MoK and BNG).
Blue indicates a positive correlation and red indicates a negative correlation. Darker and larger
circles are stronger correlations.
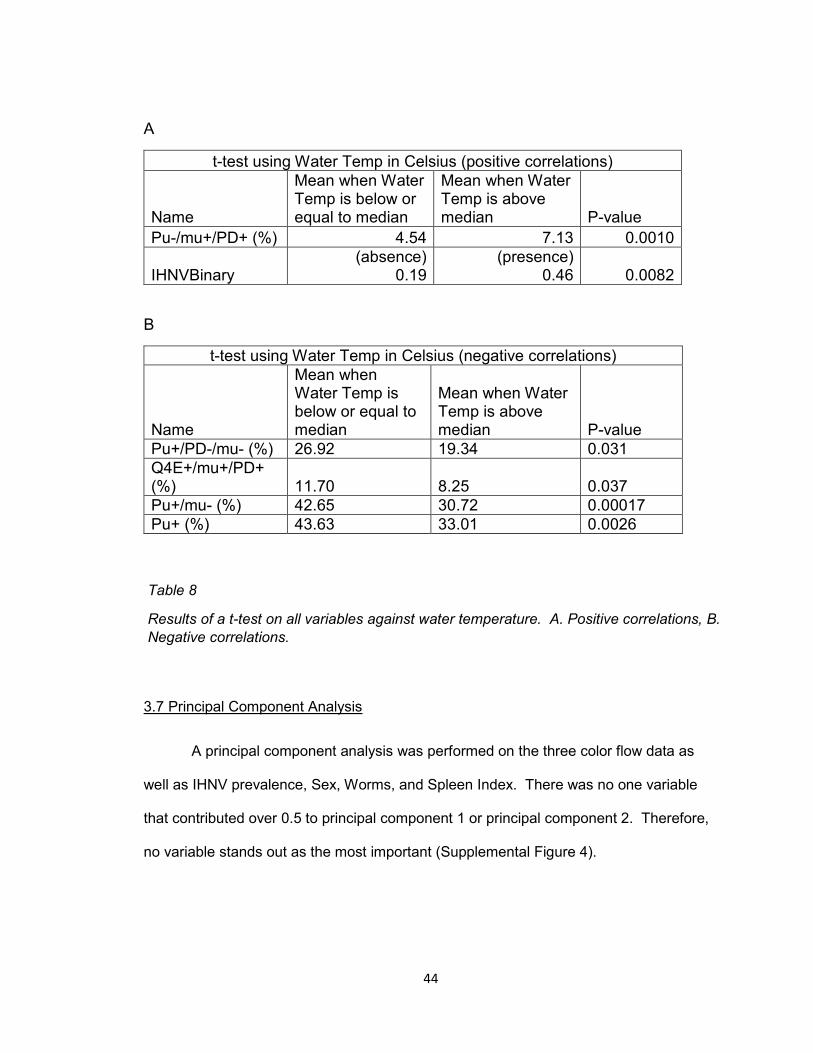
44
A
t-test using Water Temp in Celsius (positive correlations)
Name
Mean when Water Temp is below or equal to median
Mean when Water Temp is above median P-value
Pu-/mu+/PD+ (%) 4.54 7.13 0.0010
IHNVBinary (absence)
0.19 (presence)
0.46 0.0082
B
t-test using Water Temp in Celsius (negative correlations)
Name
Mean when Water Temp is below or equal to median
Mean when Water Temp is above median P-value
Pu+/PD-/mu- (%) 26.92 19.34 0.031
Q4E+/mu+/PD+ (%) 11.70 8.25 0.037
Pu+/mu- (%) 42.65 30.72 0.00017
Pu+ (%) 43.63 33.01 0.0026
3.7 Principal Component Analysis
A principal component analysis was performed on the three color flow data as
well as IHNV prevalence, Sex, Worms, and Spleen Index. There was no one variable
that contributed over 0.5 to principal component 1 or principal component 2. Therefore,
no variable stands out as the most important (Supplemental Figure 4).
Table 8
Results of a t-test on all variables against water temperature. A. Positive correlations, B.
Negative correlations.

45
4. Discussion
The purpose of this thesis research was to characterize immune changes in
sockeye salmon anterior kidney during their spawning journey. Using flow cytometry,
this research showed significant changes in abundance of myeloid lineage and B lineage
cells between sites during the spawning journey. This was the case for both the Kenai
and Copper River Run. Additionally, significant differences were found in myeloid
lineage and B lineage cells between spawning sites. Significant correlations among
abundance of B lineage cells and myeloid lineage cells, infectious hematopoietic
necrosis virus, sex, presence of worms, Spleen Index, distance, and water temperature
are discussed below.
4.1 Transient Shift in Immune Cell Patterns During Kenai Spawning Run
The data from flow cytometry represent the relative abundance of a given cell
type. Therefore, an increase or decrease in a population of cells could be a result of
multiple factors. For example, if a population of cells increased in relative abundance, it
is possible that there was a higher number of those cells present. However, it is also
possible that a different cell type decreased in number, leading to an increase in the
relative abundance of the population in question.
Fish at the third site, D64, had significantly fewer Q4E+/PD-/mu- myeloid cells
than fish at one of the spawning sites, D149. Similarly, Q4E+/mu- myeloid lineage cell
abundance was significantly lower at the third site along the journey, D64, than all but
one other site. Together, these patterns suggest the percentage of myeloid cells
decreases in the middle of the run. However, this pattern was not seen in Pu+ myeloid
cells. It is important to note that Q4E+ and Pu+ myeloid lineage cells did not have the

46
same staining patterns. There was a higher percentage of Q4E+ cells than Pu+ cells,
indicating that Q4E may be marking additional cell types. Previous research from our
lab found two distinct subsets of Q4E+ cells: a Q4E+/ MPO+/IL-1β+/Pu1+ and a Q4E+/
MPOint /IL-1βint /Pu1int population (Moore et al. 2018, in press). Therefore, it makes since
that more Q4E+ cells were found than Pu+ cells. This distinct set of Q4E+ cells could
explain the differences seen in Q4E+ and Pu+ myeloid populations in the data reported
here.
The myeloid cell abundance pattern is supported by an increase in the
percentage of B cells during the spawning run; both IgM+ and (Im)mature B cell
abundance increased before the fish reached the spawning sites at the D126 site
followed by a decrease in abundance at the spawning sites. Hence, there is a transient
shift in abundance towards more B lymphoid cells during the run.
Cells that were termed activated B cells (Q4E+/PD+ and Pu1+/PD+) were
generally higher at the spawning sites than during the journey. This is consistent with an
increase in (im)mature and IgM+ B cells in the middle of the journey and indicates an
activated humoral immune system.
LLPCs (mu++/PD-) were predicted to be maintained throughout the spawning
journey, based on our earlier studies, where levels at the beginning of the journey were
similar to those at the end (Schouten et al. 2013). My research showed that the relative
abundance of LLPCs actually significantly increased in abundance during the journey,
and then decreased before reaching the spawning site. This pattern is in agreement
with the transient increase in activated B cells, and may indicate that some of these
mu++/PD- cells are not LLPC but are newly formed plasma cells. Additionally, the

47
abundance of LLPCs at the beginning of the journey was not significantly different from
abundance at the end of the journey. Therefore, this research was consistent with the
previous published findings (Schouten et al. 2013).
Plasmablasts (mu++/PD+(+)) appeared to have a pattern similar to that of
LLPCs. In general, plasmablast abundance increased (early in the journey, D64) and
decreased before the spawning sites. This further supports that the humoral immune
response is activated transiently during migration.
4.2 Spleen Index Indicates Transient Activation of the Immune System
Spleen index significantly increased in fish late in the journey and then
decreased again before the spawning sites. This is evident in both the Kenai and
Copper Runs, with D126 and EFG having the highest spleen indexes, respectively.
Interestingly, this trend was similar to that of LLPCs and plasmablasts and opposite to
that of myeloid lineage cells. In the correlation analysis, spleen index positively
correlated with LLPCs and mu++ cells. It is important to note that EFG and D126 both
had high relative abundances of LLPCs in addition to the highest spleen indexes, which
may contribute to this finding. These trends indicate that spleen index is important in
detecting immune activation in spawning fish.
Males had a higher spleen index than females in this study. In a study of
spawning cyprinid fish, Rutilus rutilus, researchers found that males on average had a
higher spleen index than females, which is consistent with our data (Kortet et al. 2003).
There are no studies to my knowledge comparing spleen index and sex in salmonids. I
speculate that this difference in spleen index may be a result of the dramatic changes in
male morphology during sexual maturation. Males develop teeth and a pronounced
48
hooked jaw, and are aggressive and territorial during the final stages of migration. So
the difference in relative spleen size could be explained by higher infection rates in
fighting males, as compared to females, as a result of wounding. Alternatively, the
smaller spleen size in females may be linked to conservation of energy to generate
eggs.
IHNV presence in fish negatively correlated with Spleen Index. Fish with an
active IHNV infection tended to have a relatively small spleen. In a study on rainbow
trout, researchers found spleen index positively correlated with infection with the
bacterium Yersenia ruckeri (Wiens and Vallejo 2010). However, bacteria and viruses
may have a different effect on spleen index. There are no studies to my knowledge that
compare spleen index and IHNV infection. Whether the smaller spleen size is a
consequence of the infection, or the cause, remains undetermined.
Additionally, there was a negative correlation between presence of IHNV
infection in a fish and abundance of mu+ cells (Q4E+/mu+/PD+, Q4E-/mu+/PD+, and
mu+) in its AK. This correlation makes sense as spleen index and IgM+ B cell
abundance both increase transiently during the spawning journey, so I would expect a
similar correlation with IHNV infection. This is contradictory to previous research using a
cDNA microarray that found prolonged IHNV infection in rainbow trout induces IgM+ B
cells in the AK, although this research was done in vitro and using a cDNA microarray,
which detects mRNA transcripts (MacKenzie et al. 2008). IHNV infection negatively
correlated with Pu+/PD-/mu- Pu+/mu- cells, which were grouped as myeloid lineage
cells. This is contradictory to the finding presented here that the general trend of
myeloid lineage cells negatively correlated with spleen index and IgM+ B cells. The
transcript Pu1, used to detect myeloid cells, is also present in hematopoietic stem cells.

49
As my research collected cells from the anterior kidney, it is possible that this population
included both myeloid lineage cells and hematopoietic stem cells.
Additionally, spleen index decreased with distance from the river entry site,
indicating that as fish travel to their spawning sites their spleens get smaller. This
correlation is in support of a general decrease in immune response during chronic high
levels of cortisol (Dhabhar and Firbaus, 2014). Further, IHNV infection rate increased
with distance. This makes sense as fish at the spawning sites had the highest IHNV
prevalence and because IHNV infection negatively correlated with spleen index. These
patterns indicate that as fish travel longer distances, their immune system may become
increasingly compromised. This needs further investigation to confirm.
4.3 Immune cell changes may indicate endocrine changes and pathogen infection
Myeloid cell abundance decreased transiently during the spawning journey.
Previous research has linked acute stress (cortisol) and growth hormones with an
increase in myeloid lineage cells (Maruyama et al. 1999; Franz et al. 2016). Cortisol
leads to a decrease in lymphocytes (Maruyama et al. 1999) and low levels of thyroid
hormone correlate with a decrease in IgM+ B cells (Nagae et al. 1994). This may
indicate that cortisol and growth hormone levels are lower in the middle of the journey
than at the entrance and spawning sites. Also, thyroid hormone may be higher during
the journey than at the entrance and spawning sites. This concept consistent with
previous findings that thyroid hormone levels decrease before spawning in sockeye
salmon (Biddiscombe and Idler 1983). Further investigation on thyroid hormone levels is
needed to confirm.

50
The abundance of Q4E-/PD+ and Pu-/PD+ (im)mature B cells increased at D126,
the last site before the spawning sites, and decreased at the spawning sites. These
cells may express IgM or IgT. As B cells central to the humoral immune response
(Owen et al.2013), this could indicate that the adaptive immune system is still capable of
responding to pathogens. Interestingly, IgM+ (im)mature B cells increased slightly
earlier in the journey, before subsequently decreasing. It is possible that the (im)mature
B cells are a different class of immunoglobulin (IgT). As abundance of Q4E+/PD+ and
Pu+/PD+ activated B cells generally increased at the spawning sites, this could be an
indication that fish at the spawning sites are fighting off pathogens. The conflicting
results among activated B cells with and without mu could mean that these cells are
primarily B cells expressing a different class of immunoglobulin.
The overall abundance of LLPCs, or just plasma cells, increased late in the
journey at D126 and EFG and decreased at the spawning sites. LLPCs are thought to
provide memory against specific pathogens, leading to the Immunological Imprinting
Hypothesis. This hypothesis states that adults returning to their natal stream are
protected from the pathogens present since they were exposed to these same
pathogens during outmigration and generated LLPCs secreting antibody with specificity
to site-specific antigens as juveniles (Zwollo 2012). This present research is in
agreement with this hypothesis as the abundance of LLPCs was mostly retained in the
salmon throughout their journey. As noted previously, these LLPCs cells may also be
newly generated plasma cells, which are important in the humoral immune response to
infection, as they constantly secrete antibodies specific to the pathogen.
This research observed two separate increases in plasmablasts (mu++/PD+(+)).
These two separate increases are interesting as plasmablasts follow the activated B cell

51
stage (Owen et al. 2013). This observation could mean the fish are fighting infection
with pathogens in two bursts during the journey.
4.4 Myeloid Lineage Cell, IgM+ B cell, and LLPC Abundance Trends Conserved
between Kenai and Copper Run
When comparing the two spawning journeys, it is important to note relevant
differences in the data. There is no true entrance site in the data set for the Copper
River Run, as MDB is 44km past the mouth of the river. Additionally, the Kenai Run
included two spawning sites, whereas the Copper River Run only included one. Finally,
the Kenai Run included five sites along the journey before fish reach the spawning sites,
while the Copper River Run only included two sites along the journey.
Fish at the D64 site of the Kenai Run had the lowest abundance of Q4E+ myeloid
cells, while fish at the MDB site of the Copper River Run had the lowest abundance of
such cells. These findings suggest that the abundance of Q4E+ myeloid cells decreases
early in the journey.
The IgM+ (im)mature B cell abundance trend at the Kenai Run was similar to the
trend at the Copper River run. There was a significant increase in abundance during the
journey followed by a decrease at the spawning sites. The increase may occur later at
the Copper River Run, but fish at more sites would need to be collected to confirm this.
The pattern of abundance for LLPCs (mu++/PD-) was similar for both spawning
runs. At the Kenai Run, there was a significant increase in abundance of LLPCs at
D126, followed by a decrease at the spawning sites so that the sites at the beginning of
the journey were not significantly different from the spawning sites. The Copper Run fish
also showed an increase in LLPC abundance before EFG, followed by a decrease at the

52
spawning site so that it also was not significantly different from the earlier site (MDB). It
appears that late in the journey the abundance of LLPCs increases briefly before
returning to the original abundance.
4.5 Worms Positively Correlate with Abundance of B Lineage Cells and Negatively
Correlate with Abundance of Myeloid Lineage Cells
Presence of worms in fish correlated positively with abundance of B lineage cells
(Q4E+/mu+/PD+, Q4E-/mu+/PD+, and Pu-/PD+/mu-) and negatively with abundance of
Q4E+ myeloid lineage cells (Q4E+/PD-/mu-) in the AK. In an in vitro study on three-
spined sicklebacks, tapeworm infection initially correlated with a higher abundance of
granulocytes and lower abundance of lymphocytes in blood and AK (Scharsack et al.
2004). Interestingly, the trend was reversed after long-term (63 days post) infection.
This may indicate that infection with worms in my study is prolonged, as the present data
correlates with patterns after long-term infection. However, Scharsack et al. study was
limited, as they only used FSC and SSC to determine cell type. Further, their study was
in a different species of fish, hence it is possible that sockeye salmon may have a
different initial response to worms.
4.6 Increased Water Wemperatures Correlated Positively with High IHNV Prevalence
and IgM+ B Cells and Negatively with Myeloid Lineage Cells
In this study, higher water temperatures at a given location correlated with higher
prevalence of IHNV in fish. The average water temperature where IHNV is present was
13.1°C, which is consistent with the range of temperatures that IHN is detected in fish:
8°C -14°C (Dixon et al., 2016). IHNV infection in fish was found between 5°C and
17.4°C during the spawning journey. Pu+ myeloid lineage cell abundance was

53
negatively correlated with higher water temperatures. Abundance of IgM+ B cells (Pu-
/mu+/PD+) correlated positively with water temperature. This finding is consistent with a
previous study that found that lymphocytes were higher in abundance compared to
phagocytic macrophages at higher temperatures (12°C ), while phagocytic macrophages
were higher in abundance compared to lymphocytes at lower temperatures (8°C)
(Bowden 2008). Together, these trends suggest that cooler water and Pu+ myeloid
lineage cells may be protective against IHNV. It also suggests that water temperature
may play an important role in the activation of the humoral immune response given that
higher temperatures correlated with more IgM+ B cells.
4.5 Conclusions and Future Directions
Overall, this research found multiple significant differences in immune cell
composition during the spawning journey. Myeloid cells and activated B cells transiently
decreased while (im)mature B cells, IgM+ B cells, plasmablasts, and LLPCs transiently
increased during the journey. In general, there were many similarities between the two
spawning runs, as is seen in myeloid lineage cells, IgM+ B cells, and LLPCs. This may
indicate that changes in the immune system are relatively conserved both during the
spawning run and at the end of the spawning journey.
There are various endocrine changes during the spawning journey that may
affect the immune system. To understand the potential role of the endocrine system on
immune cell composition, future research could focus on cortisol, sex hormones, growth
hormones, and thyroid hormones. A correlation analysis would provide insight on the
effect of the endocrine system on spawning salmon. In vitro experiments examining the
role of the endocrine system on the immune system would be informative.

54
It would be interesting to repeat the present experiment using additional
spawning runs. Unfortunately, there were not many locations along the Copper River
Run where fish could be sampled. Including additional spawning runs with more sample
locations would provide a more detailed analysis of the effect of the spawning run on the
immune system. Such research would be important, as it could more conclusively
determine if the changes observed are conserved. In addition, it would allow us to test
our observed effect of distance on the immune system.
Finally, collecting data on other relevant pathogens would be beneficial to
understanding the effect of different pathogens on the immune system as well as the
effect of each spawning run on type of pathogen. The results on immune system
correlations with pathogen load could be compared to in vitro experiments.
This additional research would provide a more detailed analysis on immune
changes during spawning in sockeye salmon. Including endocrine changes, other
spawning runs, and more pathogens would give us a better understanding of not only
what immune changes happen but why they may be happening.

55
5. Appendix
A B
D C
F E
H
G

56
Supplemental Figure 1
Strip Charts with significant differences between sites at the Kenai Run. Significant differences
are as follows: (A) D64 and D149 (p=0.004), D64 and D186 (p=0.003), D81 and D149
(p=0.01), and D81 and D186 (p=0.007). (B) D126 and D0.01 (p=0.04), D126 and D64
(p=0.003), and D126 and D149 (p=0.003). (C) D186 and D64 (p=0.001), D186 and D81
(p=0.02), D186 and D126 (p=0.03), and D186 and D14 (p=0.001). (D) D186 and D0.01
(p=0.03), D186 and D25 (p=0.008), D186 and D64 (p=0.00008), D186 and D81 (p=0.0004),
D186 and D126 (p=0.02), and D186 and D149 (p=0.04). (E) D64 and D126 (p=0.03), D64 and
D149 (p=0.01), D64 and D186 (p=0.01). (F) D25 and D0.01 (p=0.003), D25 and D64
(p=0.006), D25 and D81 (p=0.004), D25 and D149 (p=0.000009), D25 and D186 (p=0.0005),
D126 and D0.01 (p=0.002), D126 and D64 (p=0.003), D126 and D81 (p=0.002), D126 and
D149 (p=0.000006), D126 and D186 (p=0.0003). (G) D64 and D149 (p=0.004), and D64 and
D186 (p=0.05). (H) D186 and D64 (p=0.0005), and D186 and D81 (p=0.01). (I) D0.01 and
D64 (p=0.03), D0.01 and D81 (p=0.01), D0.01 and D149 (p=0.03), D25 and D64 (p=0.0002),
D25 and D81 (p=0.0006), and D25 and D149 (p=0.0002). (J) D126 and D0.01 (p=0.03), D126
and D149 (p=0.007), D126 and D186 (p=0.008). (K) D25 and D126 (p=0.00003), D25 and
D149 (p=0.02, D25 and D186 (p=0.04), D126 and D0.01 (p=0.0000000001), D126 and D64
(0.000000003), D126 and D81 (p=0.000006), D126 and D149 (p=0.00), and D126 and D186
(p=0.00000000004).
K
J I

57
A B
CD
E F
G

58
Supplemental Figure 2
Strip charts with significant differences between sites for the Copper Run. Significant
differences are as follows: (A) MDB and EFG (p=0.007), and MDB and ML (p=0.0007).
(B) EFG and MDB (p=0.05), and EFG and ML (p=0.0009). (C) MDB and EFG
(p=0.00008), and MDB and ML (p=0.000002). (D) EFG and MDB (p=0.0002), and
EFG and ML (p=0.02). (E) MDB and EFG (p=0.00005), and MDB and ML
(p=0.0000003). (F) EFG and MDB (p=0.04), and EFG and ML (p=0.0005). (G) EFG
and MDB (p=0.008), and EFG and ML (p=0.04).
A B
Supplemental Figure 3
Strip charts with significant differences between spawning sites. Significant differences are as
follows: (A) BL and QC (p=0.04), and BL and ML (p=0.0009). (B) MC and ML (p=0.04).

59
A SI
B Q4E+/PD-/mu-
C Q4E+/PD+
E Pu+/PD-/mu-
F Pu+/PD+
I Q4E+/mu+/PD+
J Q4E-/mu+/PD+
N LLPC
O Plasmablast
Q Pu+/mu+/PD+
R Pu-/mu+/PD+
X Worms
Y SexBinary
AA IHNVBinary
Supplemental Figure 4
Graphical representation of a Principle Component Analysis performed using the variables listed
in supplemental table 1.

60
References
Baker, M.R., and C.H. Vynne. 2014. “Cortisol Profiles in Sockeye Salmon:
Sample Bias and Baseline Values at Migration, Maturation, Spawning, and
Senescence.” Fisheries Research 154 (June): 38-43.
Biddiscombe, S., Idler, D.R., 1983. “Plasma levels on thyroid hormones in
sockeye salmon (Oncorhynchus nerka) decrease before spawning.” General and
Comparative Endocrinology 52: 467-470.
Bowden, Timothy J. 2008. “Modulation of the immune system of fish by their
environment.” Fish and Shellfish Immunology 25(4): 373-383.
Bromage, Erin S., Ilsa M. Kaattari, Patty Zwollo, and Stephen L. Kaattari. 2004.
“Plasmablast and Plasma Cell Production and Distribution in Trout
Immune Tissues.” The Journal of Immunology 173 (12):7317–7323.
Carruth, L.L., Dores, R.M., Maldonado, T.A., Norris, D.O., Ruth, T., Jones, R.E.,
2000. “Elevation of plasma cortisol during the spawning migration of
landlocked kokanee salmon (Oncorhynchus nerka kennerlyi).” Comparative
Biochemistry and Physiology-Part C: Toxicology and Pharmacology 127: 123-
131.
Castro, Rasario, Jun Zou, Christopher J. Secombes, and Samuel A.M. Martin.
2010. “Cortisol modulates the Induction of inflammatory gene expression
in a rainbow trout macrophage cell line.” Fish and Shellfish Immunology
30(2011): 215-223. doi: 10.1016/j.fsi.2010.10.010.
DeLuca, D., Wilson, M., Warr, G.W., 1983. “Lymphocyte heterogeneity in the
trout, Salmo gairdneri, defined with monoclonal antibodies to IgM.” European
Journal of Immunology 13: 546–551.
Dhabhar, Firdaus S. 2014. “Effects of Stress on Immune Function: The Good, the
Bad, and the Beautiful.” Immunologic Research 58 (2–3): 193–210.
Dittman, A., and T. Quinn. 1996. “Homing in Pacific Salmon: Mechanisms and
Ecological Basis.” The Journal of Experimental Biology 199 (1): 83–91.
Dixon, Peter, Richard Paley, Raul Alegria-Moran, and Birgit Oidtmann. 2016.

61
“Epidemiological characteristics of infectious hematopoietic necrosis virus
(IHNV): a review.” Veterinary Research 47:63.
Flores, A.-M., J. M. Shrimpton, D. A. Patterson, J. A. Hills, S. J. Cooke, T. Yada,
S. Moriyama, S. G. Hinch, and A. P. Farrell. 2012. “Physiological and
Molecular Endocrine Changes in Maturing Wild Sockeye Salmon,
Oncorhynchus Nerka, during Ocean and River Migration.” Journal of
Comparative Physiology B 182 (1): 77–90.
Franz, A.-C., Faass, O., Kollner, B., Shved, N., Link, K., Casanova, A., Wenger,
M., D'Cotta, H., Baroiller, J. F., Ullrich, O., et al., 2016. “Endocrine and
local IGF-I in the bony fish immune system.” Biology 5.
Hansen, John D., and Agustin G. Zapata. 1998. “Lymphocyte Development in
Fish and Amphibians.” Immunological Reviews 166 (1): 199–220.
Kibenge, Frederick S.B., Marcos G. Godoy, Mark Fast, Samuel Workenhe, and
Molly J.T. Kibenge. 2012. “Countermeasures against Viral Diseases of
Farmed Fish.” Antiviral Research 95 (3): 257–81.
Kortet, Raine, Jouni Taskinen, Tuula Sinisalo, and Ilmari Jokinen. 2003.
“Breeding-related seasonal changes in immunocompetence, health state
and condition of the cyprinid fish, Rutilus rutilus, L.” Biological Journal of
the Linnean Society 78(1): 117-127.
MacKenzie, Simon, Joan C Balasch, Beatriz Novoa, Laia Ribas, Nerea Roher,
Aleksei Krasnov and Antonio Figueras. 2008. “Comparative analysis of the
acute response of the trout, O. mykiss, head kidney to in vivo challenge
with virulent and attenuated infectious hematopoietic necrosis virus and
LPS-induced inflammation.” BMC Genomics (9) 141.
MacMurray, Elizabeth, Maggie Barr, Amber Bruce, Lidia Epp, and Patty Zwollo.
2013. “Alternative splicing of the trout Pax5 gene and identification of
novel B cell populations using Pax5 signatures.” Developmental and
Comparative Immunology 41: 270-281.
Maruyama, Satoshi, Masahiro Minagawa, Takao Shimizu, Hiroshi Oya, Satoshi

62
Yamamoto, Nobuyuki Musha, Wataru Abo, Anura Weerasinghe,
Katsuyoshi Hatakeyama, and Toru Abo. “Administration of Glucocorticoids
Markedly Increases the Numbers of Granulocytes and Extrathymic T cells
in the Bone Marrow.” 1999. Cellular Immunology 194: 28-35.
McCormick S.D. (2011) “The Hormonal Control of Osmoregulation in Teleost
Fish.” In: Farrell A.P., (ed.), Encyclopedia of Fish Physiology: From
Genome to Environment 2: 1466–1473. San Diego: Academic
Press.
Mercer, E.M., Lin, Y.C., and Murre, C. (2011). “Factors and networks that
underpin early hematopoiesis.” Seminars in Immunology 23: 317–325.
Meyers, Theodore, Tamara Burton, Collette Bentz, and Norman Starkley. 2008.
Common Diseases of Wild and Cultured Fishes in Alaska. 2nded. Alaska
Department of Fish and Game, Division of Sport Fish, Research and
Technical Services.
Nagae, M., Fuda, H., Hara, A., 1994. “Changes in serum concentrations of
immunoglobulin M, cortisol, and thyroxine during smoltification in masu
salmon.” Fisheries Science 60: 241-242.
Owen, Judith, Jenni Punt, and Sharon A. Stranford. (2013) Kuby Immunology 7th
Edition.
Pottinger, T.G., Balm, P.H., Pickering, A.D., 1995. “Sexual maturity modifies the
responsiveness of the pituitary-interrenal axis to stress in male rainbow
trout.” General Comparative Endocrinology 98: 311-320.
Quinn, Thomas P., and Katherine W. Myers. 2004. “Anadromy and the Marine
Migrations of Pacific Salmon and Trout: Rounsefell Revisited.” Reviews in
Fish Biology and Fisheries 14(4): 421–42.
Rounsefell, George A. 1958. “Anadromy in North American Salmonidae.” Fishery
Bulletin of the Fish and Wildlife Service 58: 169–85.
Scharsack,J.P., M. Kalbe1, R. Derner, J. Kurtz1, M. Milinski. 2004. “Modulation
of granulocyte responses in three-spined sticklebacks Gasterosteus

63
aculeatus infected with the tapeworm Schistocephalus solidus.” Diseases
of Aquatic Organisms 59: 141-150.
Schouten, Jonathan, Terri Clister, Amber Bruce, Lidia Epp, and Patty Zwollo.
2013. “Sockeye Salmon Retain Immunoglobulin-Secreting Plasma Cells
throughout Their Spawning Journey and Post-Spawning.” Developmental
and Comparative Immunology 40 (2): 202–9.
Truscott, David R.Idler, Ying P.So, and John M.Walsh. 1986. “Maturational
steroids and gonadotropin in upstream migratory sockeye salmon.”
General and Comparative Endocrinology 62(1): 99-110.
Wiens and Vallejo. 2010. “Temporal and pathogen-load dependent changes in
rainbow trout (Oncorhynchus mykiss) immune response traits following
challenge with biotype 2 Yersinia ruckeri.” Fish and Shellfish Immunology
29: 639-647.
Zwollo, Patty, Suzane Cole, Erin Bromage, and Stephen Kaattari. 2005. “B Cell
Heterogeneity in the Teleost Kidney: Evidence for a Maturation Gradient
from Anterior to Posterior Kidney.” The Journal of Immunology 174: 6608–
6616.
Zwollo, Patty. 2008. “Molecular and cellular analysis of B cell populations in the
rainbow trout using Pax5 and immunoglobulin markers.” Developmental
and Comparative Immunology 32(12):1482-96.
Zwollo, Patty. 2011. “Dissecting teleost B cell differentiation using transcription
factors.” Developmental and Comparative Immunology. 35, 898–905.
Zwollo, Patty. 2012. “Why Spawning Salmon Return to Their Natal Stream: The
Immunological Imprinting Hypothesis.” Developmental and Comparative
Immunology 38 (1): 27–29.