imitation is the sincerest form of flattery: warren...
TRANSCRIPT
Imitation is the Sincerest Form of Flattery: Warren Buffett and Berkshire
Hathaway
Gerald S. Martin*
American University
John Puthenpurackal
University of Nevada – Las Vegas
October 19, 2007
Abstract:
We analyze the performance of Berkshire Hathaway’s equity portfolio and explore potential explanations
for its superior performance. Contrary to popular belief we show Berkshire’s investment style is best
characterized as a large-cap growth. We examine whether Berkshire’s investment performance is due to
luck and find that beating the market in 28 out of 31 years places it in the 99.99 percentile; however,
incorporating the magnitude by which Berkshire beats the market makes the “luck” explanation unlikely
even after taking into account ex-post selection bias. After adjusting for risk we find that Berkshire’s
performance cannot be explained by assuming high risk. From 1976 to 2006 Berkshire’s stock portfolio
beats the S&P 500 Index by 14.65%, the value-weighted index of all stocks by 10.91%, and the Fama and
French characteristic portfolio by 8.56% per year. The market also appears to under-react to the news of a
Berkshire stock investment since a hypothetical portfolio that mimics Berkshire’s investments created the
month after they are publicly disclosed earns positive abnormal returns of 14.26% per year. Overall, the
Berkshire Hathaway triumvirates of Warren Buffett, Charles Munger, and Lou Simpson posses’ investment
skill consistent with a number of recent papers that argue investment skill is more prevalent than earlier
papers suggest.
JEL classification: G11; G14; G22; C22
Keywords: Warren Buffett, Berkshire Hathaway, efficient markets, long-term performance, investment
performance, abnormal returns, simulation.
We thank Charles Cuny and Ro Gutierrez for their helpful comments and suggestions. We also thank
Kapil Shiohare for his assistance in collecting data from the SEC Public Reference Room and Logan
Strohm for research assistance.
*Contact author: Tel.: +1-979-574-4874.
[email protected] (Jerry Martin)
Imitation is the Sincerest Form of Flattery: Warren Buffett and Berkshire
Hathaway
Abstract
We analyze the performance of Berkshire Hathaway’s equity portfolio and explore
potential explanations for its superior performance. Contrary to popular belief we show
Berkshire’s investment style is best characterized as a large-cap growth. We examine whether
Berkshire’s investment performance is due to luck and find that beating the market in 28 out of
31 years places it in the 99.99 percentile; however, incorporating the magnitude by which
Berkshire beats the market makes the “luck” explanation unlikely even after taking into account
ex-post selection bias. After adjusting for risk we find that Berkshire’s performance cannot be
explained by assuming high risk. From 1976 to 2006 Berkshire’s stock portfolio beats the S&P
500 Index by 14.65%, the value-weighted index of all stocks by 10.91%, and the Fama and
French characteristic portfolio by 8.56% per year. The market also appears to under-react to the
news of a Berkshire stock investment since a hypothetical portfolio that mimics Berkshire’s
investments created the month after they are publicly disclosed earns positive abnormal returns of
14.26% per year. Overall, the Berkshire Hathaway triumvirates of Warren Buffett, Charles
Munger, and Lou Simpson posses’ investment skill consistent with a number of recent papers that
argue investment skill is more prevalent than earlier papers suggest.

1
Imitation is the Sincerest Form of Flattery: Warren Buffett and Berkshire Hathaway
Warren Buffett’s investment record suggests he is one of the most successful investors of all time.
With his long-time partner Charles Munger, they transformed Berkshire Hathaway from a textile
manufacturer to a holding company with a value in excess of $170 billion. In 1985 with the acquisition
of GEICO, Lou Simpson was added to the collective genius that makes investment decisions for the
company. According to Forbes, Buffett’s 40% beneficial interest in Berkshire Hathaway makes him the
second wealthiest person in America (coincidentally behind Bill Gates, co-founder of Microsoft who is a
director of Berkshire Hathaway and whose foundation is the beneficiary of Buffett’s philanthropy) and he
has been called a genius by the famous economist and efficient market theory proponent, Paul Samuelson
(Samuelson (1989)). Berkshire Hathaway controls a diverse group of subsidiaries, many of which are
industry leaders in both market share and financial strength, and a stock portfolio in excess of $50 billion
in publicly traded companies whose value would equate to the 9th largest equity mutual fund. The
performance of Berkshire’s equity portfolio has beaten the S&P 500 index in 28 out of 31 years from
1976 to 2006 exceeding its average annual return by 14.65% over this period. While there have been
many books written about Buffett attempting to explain his investment philosophy and success, to our
knowledge, no academic work has provided a rigorous analysis of Berkshire Hathaway’s investment
performance. Yet, Buffett’s performance is often cited by the anti-efficient market faction as a violation
of efficient markets theory.1
So how does one explain the investment success of Berkshire Hathaway which has been achieved
over a long period of time?2 There are a number of potential explanations. First, consistent with efficient
markets theory Buffett may have been lucky. That is, if enough people participate in the market, over a
1 In the book “Poor Charlie’s Almanack”, Charles T. Munger, Berkshire Hathaway’s Vice Chairman, interestingly
notes that Paul Samuelson who was one of the important early proponents of efficient markets theory has had a
significant investment in Berkshire Hathaway for a long time. In Munger’s words, “it appears Samuelson was
hedging”.
2 Buffett started managing funds in the 1950s and acquired Berkshire Hathaway in 1965. The company became
listed on the NYSE in 1976. We use Berkshire and Buffett interchangeably throughout the paper.
2
31-year period a few people are going to beat it in all 31 years simply by chance. So, due to pure luck,
some investors can obtain very successful investment records. Buffett’s successful performance has also
been identified after-the-fact so his record is subject to ex-post selection bias. However, we mitigate this
by beginning our analysis in 1976, at a point in time when Buffett had already developed a reputation as a
very successful investor.3 Using a procedure developed by Marcus (1990) we show that Berkshire’s
investment performance is not due to skill or luck after accounting for ex-post selection bias. We also
show that Berkshire’s high returns are not simply compensation for high risk.
Efficient Market Theory does not claim that stock prices are correct at all times, it only states that
stock prices are correct on average. At any point in time, stocks may be mispriced but one does not know
whether they are underpriced or overpriced. If an investor is successful in identifying the direction of
pricing errors in a majority of their investments, they can obtain positive risk-adjusted returns. Such a
scenario would appear to be a violation of EMT since investors should not be able to systematically
identify the direction of pricing errors. However, other interpretations of EMT suggest skilled investors
may be rewarded for the cost of information production (acquiring better information and/or better
processing of available information) keeping markets efficient or that investors may have different
interpretations of the same information allowing a skilled information processor to identify the true value
of stocks before the market does. Such ability would enable the investor (efficiency insurer) to identify
mispriced stocks and earn positive risk-adjusted returns as compensation for their information production.
Under these alternative interpretations, Berkshire may obtain positive risk-adjusted returns that are still
potentially consistent with EMT. However, since we find that a portfolio that mimics Berkshire’s
investments after they are made public in regulatory filings earns significantly large risk-adjusted returns
using various benchmarks, it suggests this information does not get transmitted quickly into stock prices
and would therefore be inconsistent with the predictions of EMT.
3 Buffet ran a successful investment partnership which he used to take control of Berkshire Hathaway and
distributed shares of the firm to the partners when he liquidated the partnership in 1969. In the early 1980’s he was
profiled Barron’s and had a famous debate with Michael Jensen at the Columbia Business School on whether
markets are efficient.

3
Buffet is often characterized as a “value” investor by the financial press. In order to determine
his investment style, we classify the distribution of investments using the Fama and French small vs. big
and value vs. growth scheme. While Buffet takes exception to the “value versus growth” classification of
investment style because growth is an integral component in the calculation of value and the
characteristics used to determine growth stocks such as a high ratio of price to book value is in no way
inconsistent with a "value" purchase, we find contrary to the popular notion of being a value investor,
Berkshire’s investment style is better described as a large-cap growth.
Finally, we examine firms’ stock price reaction to the news of Berkshire’s initial investment in
the stock. If the market interprets Berkshire’s investment as indicating undervaluation with potential
future positive risk-adjusted returns, the impact of the news on the purchased stock will be positive and
significant. We show that over the period from 1976 to 2006, the market reacts positively to the public
disclosure of a Berkshire Hathaway stock investment with an abnormal return of 4.03% on the day of
announcement. The market reaction is stronger in the second half of the study period with an abnormal
return of 4.40% as compared to a 0.82% in the first half suggesting the market views the news as a
creditable signal of positive future risk-adjusted returns and this signal has become stronger as the
investment success of Buffett has become more well-known. However, the market appears to under-react
to this information since investors who mimic Berkshire’s stock investments after they become publicly
known are still able to obtain subsequent positive risk-adjusted returns.
Our results suggest that Buffett’s investment skill cannot be explained by Efficient Market
Theory. This is consistent with findings in a number of recent papers such as Chen, Jegadeesh and
Wermers (2000), Cohen, Coval and Pastor (2005), Wermers (2000) and Kosowski, Timmermann,
Wermers and White (2005) who argue investment skill is more prevalent than previous research indicate.
The rest of the paper is organized as follows. Section I provides a review of related literature.
Section II discusses our data sources. Section III provides details on the empirical methodologies adopted
in this paper. Section IV provides the empirical analyses followed by our conclusion in Section V.

4
I. Literature Review
A. Performance of financial professionals
Many studies have investigated the performance of mutual funds and various financial
professional recommendations to determine if they outperform the market or other suitable benchmarks.
Since Jensen (1968), most papers have found that mutual funds, on average, do not outperform their
benchmarks. Cahart (1995), Malkiel (1995), and Daniel et al. (1997) find small or zero average abnormal
returns by using modern performance evaluation methods on samples that are relatively free of
survivorship bias suggesting the average active mutual fund should be avoided. Alternatively, papers like
Carlson (1970), Lehman and Modest (1987), Grinblatt and Titman (1988, 1992), Hendricks et al. (1993),
Goetzmann and Ibbotson (1994), Brown and Goetzmann (1995), Elton et al. (1996), and Cahart (1997)
have found evidence suggesting future abnormal returns or “alphas” can be forecast using past returns or
alphas. As discussed in Baks et al. (2001), this evidence suggests the possibility alphas are persistent and
that some managers have positive expected alphas.
Desai and Jain (1995) find the recommendations of the Roundtable of Barron’s Superstar money
managers experienced a positive abnormal return on the day of the first public announcement but failed to
provide superior performance thereafter. Similarly, Black (1973), Copeland and Mayers (1982), Stickel
(1985), and Lewis et al. (1997) who examine the “Value Line Anomaly” show that after an initial
reaction, the recommendations show no sustained superior performance once an appropriate benchmark is
used. Graham and Harvey (1996), Jaffe and Mahoney (1999), and Metrick (1999) show investment
newsletters fail to offer superior market timing ability. In contrast, Barber and Loeffler (1993) show a
positive abnormal return on analyst’s recommendations and Womack (1996) indicates that analysts
appear to have market-timing and stock-picking abilities. In addition, Coval, Hirshleifer, and Shumway
(2002) demonstrate trades of individual investors classified in the top ten percent exploit market
inefficiencies to earn abnormal profits above those from other well-known strategies. Thus previous
research suggests only in relatively few cases does there appear to be possible evidence of superior
investment skill.

5
Recent research suggests some fund managers may have superior investment skill. Wermers
(2000) finds high-turnover mutual funds held stocks that substantially beat the S&P 500 index from 1975
to 1994. Chen et al. (2000) investigate the value of active mutual fund management by examining the
stockholdings and trades of mutual funds and find growth-oriented funds exhibit stock selection skills
especially in large growth stocks. Kosowski et al. (2006) provide a comprehensive examination of
mutual fund performance explicitly controlling for luck. Across a wide array of performance
measurements their tests indicate the large, positive alphas of the top ten percent of funds (net of costs)
are extremely unlikely to be solely due to luck. Subsequent tests indicate the superior performance is
concentrated among growth-oriented funds. They also find stronger evidence of superior fund
management during the first half of their sample period (pre-1990s) not simply due to luck. Finally, they
find significant persistence in net return alphas for the top (sometimes top two) deciles of managers.
Cohen et al. (2005) develop a performance evaluation approach in which a manager’s skill is judged by
the extent to which the manager’s investment decisions resemble the decisions of managers with
distinguished historical performance records and find strong predictability in the returns of U.S. equity
funds. Stocks commonly held by managers who have been performing well tend to out-perform in the
future even after adjusting for momentum in stock returns indicating some collective investment skill on
the part of these managers. They also find fund flows do not respond significantly to their measures
indicating investors are unaware of the information contained them. The more recent research suggests
some fund managers may have superior investment skill.
B. Optimal information disclosure by institutional investors
Grossman and Stiglitz (1980) argue that skilled investors are rewarded for the cost of information
production (acquiring better information and/or better processing of available information) keeping
markets efficient. Kurz and Motolese (2000) alternatively argue that rational agents can have diverse
interpretations of the same information suggesting that an investor who is skilled at processing available
public information may be able to identify the true value of stocks before the market does. Such ability

6
would enable an investor to identify mispriced stocks and earn positive risk-adjusted returns. These
interpretations allows for skilled investors (efficiency insurers) to earn positive abnormal returns as
compensation for their information production. If we find that Berkshire obtained positive risk-adjusted
returns it is therefore still potentially consistent with EMT.
It is unclear how the superior information of skilled investors gets transmitted into stock prices.
The traditional explanation under EMT is that skilled investors will trade on their superior information
which gets reflected in stock prices quickly. These investors will have an incentive to conceal their
trading activities until they establish their investment positions since the market over time will recognize
their superior skill and react to the news of their investments reducing returns. Conversely, skilled
investors should welcome mimicking or copy-cat investors after establishing their positions since this
would quicken the correction of miss-pricings and the realization of positive abnormal returns (Frank et
al., 2004). Regulatory rules that require frequent disclosures of holdings may improve the efficiency of
markets since the information produced by skilled investors is incorporated into stock prices faster.
Frequent disclosures may also lower the returns of skilled investors reducing incentives to undertake the
activities with possible adverse effects for the efficiency of markets. Once the investor’s activity in a
particular security becomes known to the market through disclosure, additional investment will come at a
higher cost or sales at lower prices.
C. Performance testing and benchmarking methodologies
Prior research demonstrates the results of long-term performance studies may be dependent upon
the chosen testing methodology and the benchmark. The two most popular choices for long-term
abnormal return measurement are the cumulative abnormal return (CAR) and buy-and-hold abnormal
return (BHAR). The CAR is calculated by summing the abnormal returns (actual returns less benchmark
returns) over all periods of the tested horizon. Alternatively, BHAR is calculated by compounding each
periodic return into a buy-and-hold measure over the tested horizon and subtracting from it the buy-and-

7
hold benchmark return. Barber and Lyon (1997) and Kothari and Warner (1997) argue that both methods
have drawbacks that could bias test statistics to yield different results.
Lyon, Barber, and Tsai (1999) test the calendar-time methodology of Jaffe (1974) and Mandelker
(1974) that is advocated by Fama (1998) and Mitchell and Stafford (2000). While it does not reflect of
the returns experienced by actual investors, the formation of calendar-time portfolios eliminates the cross-
sectional dependence of observations and results in well-specified test statistics. Mitchell and Stafford
(2000) apply several different measurement techniques to a sample of mergers from 1958 to 1993 and
find the calendar-time method is best for testing for abnormal returns. Possible benchmarks include the
value-weighted or equal-weighted CRSP index, reference portfolios such as the Fama and French (1993)
twenty-five size and book-to-market portfolios, a set of control firms selected in a manner designed to
mimic the risk of sample firms, and the application of an asset pricing model such as the three factor
model of Fama and French (1993) or the four factor model of Carhart (1997).
D. Ex-post selection bias
As explained in Marcus (1990) and Statman and Scheid (2001), Buffett may have been identified
ex-post as a successful investor and should therefore not be surprised to find his performance far above
average. We also acknowledge after-the-fact some managers will have been lucky. So, the question
becomes when is the performance of a manager so good that even after accounting for the ex-post
selection bias can pure luck fail to account for the performance? We use a Monte Carlo simulation
technique described by Marcus (1990) to derive a numerical approximation of the probability distribution
of the hypothetical winning manager’s performance derived under the assumption of an efficient market
as a benchmark. To account for cross-sectional variation in manager-specific risk we use a range of noise
estimates in the market to establish a margin by which the best performing manager should beat the
market in order for it to be interpreted as being due to skill and not luck. Once derived, we can test
whether a winner’s abnormally good performance is evidence of an ability to beat the market after
accounting for the fact that we have selected the best performer.
8
II. Data
Data on Berkshire Hathaway’s stock investments was gathered from regulatory filings required
by the Security and Exchange Commission and from the Berkshire Hathaway annual reports. The SEC
filings examined include forms 10K, 13F, 13D, 13G, 3, 4 and 5 which are currently available on the
SEC’s EDGAR website.4 All form 13F reports for Berkshire Hathaway starting with the report dated
December 31, 1998 are available via the internet on EDGAR. Schedule 13D and 13G reports are
available online since March 4, 1994 and Forms 3, 4 and 5 have only recently become available online.
Data from filings for prior dates were collected directly from the SEC’s Public Reference Room.
Berkshire Hathaway provides their annual report to shareholders on their website since 1995 and Warren
Buffett’s Letter to Berkshire Shareholders since 1977.5
It is important to note we do not claim to exactly replicate Berkshire Hathaway’s investment
portfolio. Certain limitations to the data sources including timing, availability of acquisition cost,
availability of the investment itself, and the source of stock return data restricts our analysis to common
equity investments that are publicly disclosed and only those with return data available in CRSP6 during
the study period. For example, Berkshire’s common stock investment in American Express in 1994 was
the result of an automatic conversion of Preferred Equity Redemption Cumulative Stocks (PERCS)
acquired three years earlier. In our analysis we assume the investment occurred in the quarter the PERCS
were converted to common stock at the price reported at the end of month of conversion. Several other
equity investments were also preceded by or were increased through investments in convertible preferred
stock including First Empire State, Geico, Gillete, Salomon, and US Airways. Berkshire’s initial
4 EDGAR, the Electronic Data Gathering, Analysis, and Retrieval system, performs automated collection,
validation, indexing, acceptance, and forwarding of submissions by companies and others who are required by law
to file forms with the U.S. Securities and Exchange Commission. http://www.sec.gov.
5 http://www.berkshirehathaway.com.
6 Source: CRSP, Center for Research in Security Prices. Graduate School of Business, The University of Chicago
2003. Used with permission. All rights reserved. http://www.crsp.uchicago.edu
9
investment in Federal Home Loan Mortgage (Freddie Mac), although technically a preferred stock, was
for all practical purposes a common stock investment made at a time when it was available only to
lending institutions.7 For these reasons the calculated performance of Berkshire’s investment portfolio
will understate the true investment returns earned.
A. Data Sources
The primary source of data is Form 13F reports required to be filed by institutional investment
managers defined as any entity (person or company) that exercise investment discretion at the end of any
calendar month over $100 million or more in securities as specified in Section 13(f) of the Securities
Exchange Act of 1934. The securities requiring reporting are found in the Official List of Section 13(f)
Securities published quarterly and are available on the SEC's website.8 The Form 13F requires disclosure
of the names of institutional investment managers, the names and class of the securities they manage, the
CUSIP number, the number of shares owned, and the total market value of each security as of the last day
of the calendar quarter. The first 13F filing by Berkshire Hathaway occurred for the quarter ended
December 31, 1978 filed with the SEC on May 17, 1979.
Institutional investment managers may request confidential treatment of certain securities
ordinarily required to be reported on Form 13F which would exempt them from public disclosure if the
either the information would identify securities held by the account of an individual, certain estates and
trusts; or the information would reveal an investment manager's program of acquisition or disposition that
is ongoing both at the end of a reporting period and at the time that the Form 13F is filed. If granted, the
SEC will allow the investment manager to withhold certain investments from the report for a period of
7 Berkshire acquired interest equal to the maximum allowed by law through Mutual Savings and Loan a non-
insurance subsidiary of Blue Chip Stamps, itself a subsidiary of Berkshire Hathaway. One year later trading in the
stock became available to the public on the New York Stock Exchange.
8 Section 13(f) securities include equity securities that trade on an exchange or are quoted on the NASDAQ National
Market, certain equity options and warrants, shares of closed-end investment companies, and some convertible debt
securities. Mutual funds (open-end investment companies) and foreign stocks are not included on the list and are
therefore not required to be reported. See http://www.sec.gov/about/forms/form13f.pdf for information regarding
Form 13F and http://www.sec.gov/divisions/investment/13flists.htm for a list of securities for which disclosure is
required.
10
time. If the investment subsequently becomes public knowledge or the need for confidential treatment
ceases, the manager must file an amended Form 13F for each period confidential treatment was granted,
providing information that would have been disclosed had confidential treatment not been granted.9
Berkshire Hathaway has often requested confidential treatment for certain investments and only
recently have some of those requests been denied confidential treatment.10
Not only does confidential
treatment of new investments delay the disclosure to the public of acquisitions, confidential treatment of
existing investments might mistakenly indicate a divestment of a particular security. Indeed this occurred
when numerous press accounts reported Berkshire had divested its holdings of Wells Fargo based upon
(the lack of) information contained in the latest Form 13F. These presumptuous press accounts triggered
a temporary, but significant, decline in the price of Wells Fargo's stock. Certain articles attributed the
confusion about the holdings to the operation of the Commission's rules on confidential treatment of
information filed on Form 13F.11
A final limitation of using Form 13F is due to the requirement of reporting holdings as of the end
of the calendar quarter. Any security acquired and sold between the quarterly report dates or activity that
results in no net change in number of shares held from the prior report would never be disclosed as long
as other regulatory reporting requirements are not triggered.
Additional sources include Schedule 13D, 13G and related amendments filings. These are
required to be filed by any person within 10 days of acquisition who, directly or indirectly acquires the
beneficial ownership of more than five percent of an equity security of a class specified in Section
9 Confidential treatment of Form 13F will limit the ability of a researcher to construct the institutional investment
manager’s portfolio from the Thomson Financial Institutional Holdings Data because Thomson does not “backfill”
data delayed from the amended filings due to confidential treatment.
10 See In the Matter of Berkshire Hathaway, Inc., File No. 28-4545, Securities Exchange Act of 1934 Release No.
43142, August 10, 2000 available at http://www.sec.gov/rules/other/34-43142.htm.
11 See, e.g., Norris, A Misinterpretation of a Buffett Filing Stings Wells Fargo, NY Times (Aug. 22, 1997) at A1;
Fromson, SEC Disclosure Exemption Questioned, Washington Post (Aug. 23, 1997) at C1; Mixup Sheds Light on
Confidential Stock Buys, Chicago Sun-Times (Aug. 25, 1997) at 43. Further guidance on the Commission’s
guidelines for the confidential treatment of Form 13F filings may be found at
http://www.sec.gov/divisions/investment/guidance/13fpt2.htm.

11
13(d)(1) of the Exchange Act. The information contained in these filings include, name of the security,
the CUSIP number, the number of shares beneficially owned, and the date of event which requires the
schedule to be filed. Changes in these holdings must be reported in an amendment to the original filing
and is classified as an amended filing with a “/A” added to the original form (“13D/A” or “13G/A”) and a
serial amendment number indicating the number of amendments to date. Once the holdings fall below the
five percent level the filing will indicate the beneficial owner no longer meets the five percent ownership
level and will no longer be subject to the reporting requirements. Berkshire Hathaway has often taken a
five percent or greater position in a security which triggered the requirement of these filings. Once a
holding reaches and remains above the five percent level, Schedules 13D, 13G and their amendments
provide a better estimate of dates of securities transactions, but, if and only if ownership exceeds the five
percent level. The shorter 13G filing is available only for certain classes of investors and only when they
are not attempting a change in control. In the case of Berkshire Hathaway, a Schedule 13D filed in lieu
of a 13G may signal intent to change or influence control which indeed seems to be the case with 13D
filings in Salomon (where Warren Buffett served as CEO), Gillette (where Mr. Buffett served as Director)
and Benjamin Moore, Comdisco Holding Co, CORT Business Services Corp, Finova Group, General Re,
Justin Industries, International Dairy Queen, MidAmerican Energy Holdings, Shaw Industries, and Xtra
Corp all of which became operating entities under Berkshire Hathaway. All other holdings of five
percent or more without intent to influence control are reported using Schedule 13G except when insider
holdings on Forms 3, 4 or 5 are reported.
A company's officers and directors, and any beneficial owners of more than ten percent of a class
of the company's equity securities registered under Section 12 of the Exchange Act are considered
corporate insiders and must file with the SEC a statement of ownership regarding those securities using
Form 3, 4 or 5. Form 3 is used for the initial filing by an insider and must occur no later than the
effective date of registration if the issuer is registering equity securities for the first time or within ten
days of becoming an officer, director, or beneficial owner of securities previously registered. Changes in
ownership are reported on Form 4 and must be filed at the Commission within two business days. There

12
are limited categories of transactions not subject to the two-day reporting requirement. A Form 5 is used
to report any transactions that should have been reported earlier on a Form 4 or were eligible for deferred
reporting and are required to be filed 45 days after the end of the issuer's fiscal year. Since June 30, 2003,
the SEC has required insiders to submit forms electronically through the SEC's EDGAR system (prior to
that date, insiders could choose, but were not required, to file electronically). The SEC also requires
companies that maintain websites to post the forms by the end of the next business day after filing them
with the SEC.
As with Schedule 13D and 13G and unlike Form 13F, the insider reports of Forms 3, 4 and 5,
require the beneficial owner to disclose initial holdings or changes in holdings with only a short delay
from the event date necessitating the filing. Warren Buffett was required to file these forms for Coca
Cola and Gillette because of directorships at these firms and his status as a control person of Berkshire
Hathaway which owns substantial holdings in these firms.
B. Period of Study
We searched EDGAR and the SEC’s Reference Room for all ownership filings beginning in 1976
to date.12
From each filing we record the source, transaction date, filing date, and date the filing became
public, the name and CUSIP numbers of securities reported, change in number of shares owned, and
market value on date of filing. We supplement this data by searching Berkshire Hathaway’s annual
reports, LexisNexis, and earlier regulatory filings to determine the initial acquisition of stock holdings
that were reported at the beginning of the study. In order to determine the market’s reaction to the initial
news of a Berkshire investment we searched LexisNexis for the first date for which public disclosure
occurred. If none was found we recorded the day following the date of filing as the first public disclosure
12
As of October 16, 2007, the latest 13F filing for which data is collected was reported as of June 30, 2007.

13
date.13
The ending date of December 31, 2006 was the last date for which return data was available in
CRSP.
C. Financial Data
We used the reported CUSIP and dates of holdings to gather data on net sales, total assets and
common equity from Compustat in the fiscal year prior to the first reported holding. Monthly return,
price and outstanding share data from the CRSP database was used to determine monthly returns and
market capitalization. Benchmark portfolios were formed using the value-weight index of
NYSE/AMEX/NASDAQ stocks with dividends from CRSP and the value-weight Fama and French 25
size and book-to-market equity returns.14
We limit our analysis to common equity investments only due to data availability. The resulting
data set includes 335 common equity investments in the period from January 1, 1976 to December 31,
2006. Data is available in CRSP over the relevant period for all but three of the securities: Multimedia
Inc reported on 03/31/80, Guiness PLC reported 12/31/91 and Comdisco Holdings Inc reported 12/31/02
whose initial investments were $3.2, $296.8 and $113.3 million respectively accounting for
approximately 0.4%, 3.0% and 0.4% of the portfolio value. Except for the univariate analysis of
investment characteristics, these investments are omitted from the empirical analysis. Compustat data
was available for all but eight firms which was gathered directly from the companies’ financial reports
and substituted for the Compustat data.
D. Arbitrage versus Long Term
Berkshire Hathaway has often used risk arbitrage as an alternative to holding short-term cash
equivalents. These are arbitrage opportunities that present themselves after an announced corporate event
13
Each filing receives a time stamp when received at the SEC. Most of the time stamps examined occurred late in
the afternoon either near or after close of the markets and, in the earlier periods, it took at least a day for the SEC to
process the filing before it became available to the public.
14 Source: Kenneth R. French. Carl E. and Catherine M. Heidt Professor of Finance, Tuck School of Business, The
University of Dartmouth 2004. http://mba.tuck.dartmouth.edu/pages/faculty/ken.french/index.html.

14
such as sale of the company, merger, recapitalization, reorganization, liquidation, self-tender, etc. The
major risk incurred in these investments is the risk of the event not happening. Berkshire prefers to
engage in only a few large transactions each year because of the effort required to monitor the progress of
transactions and the market movements of related stocks (Letter to Berkshire Shareholders, 1985). We
categorized each investment into one of two investment categories: long-term or risk arbitrage. An
investment was categorized as risk arbitrage if and only if either Warren Buffett indicated it was in
Berkshire’s annual reports or if all of the following conditions were met: (1) the investment appeared in
regulatory filings after a public announcement of a merger, restructuring, liquidation or tender offer; (2)
the investment holdings were disposed of after the completion or cancellation of the event; and (3) the
investment was for a period of less than two years. All other investments were categorized as long-term.
It may be noted there is likely to be some uncertainty in determining whether an investment is a long-term
investment or a risk arbitrage investment for an investor evaluating Berkshire’s investments in real time.15
Our primary purpose in making this classification is to better describe Buffett’s investment methods. We
also note that an investor mimicking Berkshire’s investments may not be able to participate in many of
the risk arbitrage investments because by the time they become public, the investment opportunity is no
longer available. Also, as time passes, the opportunity to profit from arbitrage investments diminishes
since uncertainties are reduced as the announced event approaches.
III. Empirical Methods
We perform three types of empirical tests to evaluate the performance and market impact of
Berkshire Hathaway’s stock investments. First, we use standard event study methodology to evaluate the
market reaction to the news of Berkshire acquiring a stock for the first time. Second, we test the risk-
adjusted investment performance of Berkshire’s stock investment portfolio and a mimicking portfolio
created by an investor following the investments made by Berkshire using both annual buy-and hold and
15
Even Buffett, in his 1992 letter to Berkshire shareholders explained an initial investment in General Dynamics
was intended as a risk arbitrage but changed into a long-term holding after evaluating the direction new CEO Bill
Ander’s was taking the firm. http://www.berkshirehathaway.com/letters/1992.html

15
calendar-time abnormal returns (CTAR). Finally, we test whether Berkshire’s investment performance
could be due to luck after controlling for ex-post selection bias using a Monte Carlo simulation technique
described in Marcus (1990) to derive a close numerical approximation of the probability distribution of
the best performing manager under the assumption of efficient markets.
A. Event Study
We use standard event study methodology to determine the market impact of the first public
disclosure of a Berkshire Hathaway stock investment by subtracting a benchmark or expected return from
the return observed on the date of disclosure to calculate the abnormal return. The benchmark used is the
return of the value-weight index of all firms in NYSE/AMEX/NASDAQ with dividends from CRSP.
This index is an appropriate choice over the equal-weight index due to the preponderance of large firm
investments in the Berkshire Hathaway portfolio. If the disclosure of an investment by Berkshire has no
market impact the abnormal returns will be not be significantly different from zero. The significance of
the abnormal returns are determined using both a parametric Student’s t test and a non-parametric
Wilcoxon rank sum test.
B. Calendar Time Abnormal Returns
To test the long-term performance of Berkshire Hathaway’s stock portfolio and a mimicking
investment strategy, we use calendar-time abnormal returns. The CTAR is calculated as the difference in
the return on a portfolio of stocks less the return on a benchmark portfolio or index in each calendar
month over the study period. The test of abnormal performance is a t-test of the time-series average
monthly abnormal return being different from zero. We first test for abnormal performance of the
Berkshire Hathaway stock portfolio and then test for abnormal performance of an investment strategy
which mimics Berkshire’s investments after they are publicly disclosed. Due to the reporting limitations
discussed above and to eliminate abnormal returns surrounding initial disclosure in the mimicking
16
portfolio, several assumptions were made on the timing of purchases and sales of the stocks in both
portfolios.
First, since investments are reported in Form 13F filings as of the end of the quarter and actual
acquisition dates are not reported, any new investments in the quarter are assumed to have occurred at the
end of the first month in the quarter. For example, if a stock showed up for the first time in a filing for the
quarter ending December 31, 1990, it is assumed to have been acquired at the closing price of the last
trading date in October 1990. Second, a stock that no longer appears or the filing indicates a sale has
taken place, it is assumed to have occurred at the closing price at the end of the month following the last
reported holding. A stock that no longer appears in the Form 13F filing for the report ending June 30,
1995 is assumed to have been sold at the closing price of the last trading date in April 1995. For other
filings including Schedule 13D and 13G (including amendments) and Forms 3, 4 and 5, it is assumed
purchases and sales occurred at the month end closest to the event date causing the reports to be filed.
These assumptions allow us to use the monthly returns file in CRSP for the investments and the monthly
Fama and French size and book-to-market benchmark returns to test portfolio performance.
We use a different set of assumptions for creating the mimicking portfolio in order to exclude
from the portfolio performance any potential abnormal returns surrounding the public disclosure of an
initial acquisition or additions to existing Berkshire Hathaway investments. The filing of Form 13F is
required 45 days from the end of the report date which results in the filing for a report dated December
31, 1990 to be made available on February 14, 1991. When creating the mimicking portfolio, we assume
new investments appearing for the first time begin at the closing price of the last trading day of the month
following the public disclosure. A new investment appearing on the December 31, 1990 report filed and
made public on February 14, 1991 is assumed to start at the close on February 28, 1991. This two-week
delay avoids any positive abnormal returns being included in the mimicking portfolio due to the initial
reaction to the public disclosure of the investment. Similarly, when a filing indicates a sale has taken
place, it is assumed to be sold in the mimicking portfolio at the closing price at the end of the filing
month. This causes any negative abnormal return associated with the public disclosure of the sale to be

17
included in the returns of the mimicking portfolio. These assumptions bias against finding a significant
positive abnormal return in the mimicking portfolio.
The effect of the filing delay and confidential treatment causes the mimicking portfolio to have
fewer stocks than Berkshire Hathaway’s actual portfolio and to be positively time shifted in stock
purchases by an average of 223 days (122 median) and positively shifted by 48 days (31 median) in stock
sales.16
Confidential treatment of holdings will cause either a further delay in its appearance in the
mimicking portfolio or a premature liquidation if the stock is already in the mimicking portfolio. Each
month the portfolios are rebalanced according to the calculated holdings. Since there are a total of 335
stock investments over the 372 month study period from 1976 to 2006 and the average holding period for
a stock in Berkshire Hathaway’s portfolio over this period exceeds 34 months, transaction costs
associated with rebalancing are minimal.
Calendar-time abnormal returns are calculated each month in the study period by subtracting the
return of the benchmark portfolio or index from the portfolio return. The mean and standardized mean
abnormal return calculated by dividing each calendar month portfolio mean return by its corresponding
standard deviation estimate are calculated. Finally, the time-series mean abnormal return is calculated to
provide the estimate of portfolio performance while the standardized means are used in the time-series t-
test. Using standardized means for the test helps to control for heteroskedasticity and provide greater
weights to periods of heavy event activity (Fama (1998) and Mitchell and Stafford (2000)). We also test
the abnormal performance of the mimicking portfolio using equal-weight portfolios since it may be
tedious for an investor desiring to mimic Berkshire’s investments to determine the appropriate weights of
each investment every period.
16
For example a report for March 31, 1991 which is filed on May 14, 1991 indicates a stock is no longer held, it is
assumed the stock is disposed of in the Berkshire Hathaway portfolio on January 31, 1991 and the mimicking
portfolio on May 30, 1991. Due to confidential treatment of some filings, a security may be removed from the
mimicking portfolio before Berkshire Hathaway actually sells the stock (see footnote 8 regarding Wells Fargo &
Co.).

18
We use two different benchmarks: (1) the value-weight index return with dividends of all stocks
from CRSP; and (2) a portfolio created by using the returns from the value-weight 25 size and book-to-
market equity portfolios of Fama and French (1993) selected in a manner designed to match the risk of
the investments. The Fama and French characteristic-based benchmark was constructed by selecting for
each firm-month the return associated with a portfolio of firms with similar market equity at the
beginning of the month and book-to-market equity from the last reported fiscal year end. These
benchmarks are used because Berkshire Hathaway’s investment portfolio predominantly consists of large
firms.
C. Monte Carlo Simulation of Best Performing Manager under Efficient Markets
We create a hypothetical benchmark of the best investment performance assuming EMT holds to
test whether the performance of an investor chosen ex-post is due to luck or superior skill (Marcus, 1990).
According to Marcus (1990) when assessing performance after it is known to be outstanding the standard
market benchmarks no longer apply. The appropriate benchmark is the best performance from a sample
of returns from many managers assuming EMT holds. The probability distribution of the best
performance can be derived through Monte Carlo simulation using the experiment described in Marcus
(1990). The simulation starts as a contest between (n) managers each of whom flips a coin a number of
trials (t). The winning manager and score are determined by manager with the greatest number of heads
(h) that occurred in the (t) flips. This procedure is repeated over a large number of trials (n ≥ 10,000) to
create a frequency distribution of the winning score. The winning score (h) will be an increasing function
of the number of managers (n) and the number of flips (t) in the contest. The frequency distribution of the
winning score provides an estimate of the probability distribution of the best performance due to luck in
an efficient market. The number of standard deviations from the mean represents the margin by which
the winning manager beats the market in an efficient market due to luck
𝑀𝑛 ,𝑡 = max ℎ𝑛 ,𝑡 − ℎ 𝑛 ,𝑡 𝜎𝑛 ,𝑡 . However, when evaluating investment results under efficient
markets, the winning manager’s margin is also dependent on the amount of risk or volatility the manager

19
assumes (manager-specific risk). Winning managers using high variance strategies will result in higher
winning margins. If manager-specific risk (noise) due to high volatility strategies in the market has a
standard deviation of 𝜎 = 15% per year, under the normal distribution it would imply that about one-
third of the managers would perform either better or worse than the market by a margin of 15% (Figure
1). This implies the estimated standard deviation of average annual returns over a 31-year period
𝜎𝑡 = 𝜎 𝑡 is 15% 31 = 2.69% . Multiplying the number of standard deviations by which the
winning manager in the Monte Carlo simulation beats the market (Mn,t) by the standard deviation of
average annual returns (σt) produces the benchmark of the expected margin by which the winning
manager will beat the market 𝐸 𝑟𝑛 ,𝑡 𝐸𝑀𝑇 = 𝑀𝑛 ,𝑡𝜎𝑡 . The benchmark will be an increasing function
the number of mangers (n), the number of trials (t), and the assumed manager-specific risk or noise level
𝜎 due to luck in an efficient market.
IV. Empirical Analyses
A. Investment Characteristics
We classify Berkshire Hathaway’s stock portfolio into three separate categories based upon
different investment philosophies. The first group consists of stocks from firms acquired through a tender
offer and includes Benjamin Moore, Blue Chip Stamps, CORT Business Services, GEICO, General Re,
International Dairy Queen, Johns Manville, Justin Industries, MidAmerican Energy Holdings, Scott &
Fetzer, Shaw Industries, and XTRA Corp. The second consists of 221 long-term investment horizon
stocks characterized by large stakes in large firms in few industries. The third consists of 104 short-term
risk-arbitrage investments that were either labeled by Warren Buffett in Berkshire annual reports as
arbitrage investments or were categorized as such if following conditions were met: (1) the investment
period for the stock was one year or less; (2) the investment appeared in regulatory filings after a public
announcement of a merger, restructuring, liquidation or tender offer; (3) the resulting investment holdings
were disposed of after the completion of the event. Table 1 provides univariate statistics for the three
20
distinct investment classes and statistical tests between long-term holdings and short-term risk-arbitrage
investments using, holding period, initial and average ownership levels, market capitalization, total assets,
common equity and book-to-market of the 335 stock investments during the study period. Three of the
221 long term investments do not have returns available in CRSP during Berkshire’s holding period:
Multimedia Inc, Guinness PLC and Comdisco Holdings Inc.
The long-term holding stocks have a mean (median) holding period of 46.15 (18.50) months
exceeding the 8.31 (9.74) months for the risk arbitrage stocks at p-value < 0.0001. The mean (median) of
initial ownership stake in the long-term holding stocks is 2.66% (0.57%) is not statistically different from
the 2.50% (0.81%) ownership for the risk arbitrage stocks. Similarly the average ownership stake of
3.42% (1.09%) for long-term holding stocks is not statistically different from the 2.51% (0.89%) for risk
arbitrage stocks. The mean (median) market capitalization of the long-term holding stocks are $11.24b
($2.12b) are also not statistically different from the $7.38b ($1.86b) for risk arbitrage stocks. The mean
total assets of the issuers of the long-term holdings stocks are slightly higher at $20.46b compared to
$12.62b for risk-arbitrage stocks at a p-value < 0.0830. The medians are approximately the same at
$2.77b and $3.86b respectively. The mean value of book equity for issuers of long-term holding stocks is
$5.30b and $3.35b for risk arbitrage stocks different at a p-value = 0.0665. The medians are not
statistically different at $1.01b and $1.23b respectively. The mean initial book-to-market ratio of the
issuers of both the long-term holding and risk arbitrage stocks is 0.80 while the medians are 0.64 and 0.63
respectively.
True to the philosophy of investing in businesses which they can understand and are comfortable
with, Table 2 shows a highly concentrated portfolio both by industry and size. Nearly forty-two percent
(140 of 335) are in manufacturing, followed by 21% (72) in finance, insurance and real estate services
and 16% (55) in transportation, communication, electric, gas and sanitary services. Sixty-six percent
(221) are in the largest three size deciles by market capitalization of equity. A Chi-square test of equal
expected proportions supports the findings of industry concentration in at least one of the industry groups
at a p-value < 0.001 level as does the concentration in at least one of the size deciles. Industries with the

21
highest concentrations of stock investments are also those in which Berkshire Hathaway’s operating
subsidiaries are engaged. The largest five holdings average 73.1% of the total portfolio also indicating a
high degree of concentration. Overall, this suggests that Berkshire’s investments are generally consistent
with its stated investment philosophy. However, it may be noted that while the large core holdings tend
to be held for long periods of time, smaller investments are often held for relatively shorter periods.
Contrary the financial press characterization of Buffett as a “value” investor, we categorize the
investments by the six Fama and French size and book-to-market equity groupings and find the largest
group to be “Large Cap-Growth.” We use market value of equity from CRSP at the time of investment to
categorize investments into small versus big stocks using the 50th percentile breakpoint as the division.
Value versus growth is based upon book-to-market ratios calculated using common equity from
Compustat in the last reported fiscal year prior to investment divided by in the market value of equity at
the time of investment. Value stocks are firms with book-to-market ratios greater than the 70th percentile
while growth stocks have book-to-market ratios less than the 30th percentile of all book-to-market ratios.
As shown in Table 3, 77% (259) investments fall into the large cap category (market equity ≥ 50th
percentile) while 41% (138) fall into the low book-to-market or growth category (book-to-market equity ≤
30th percentile). Since only 19% (64) fall into the value category and 23% (76) fall into the small
category, Berkshire’s strategy would be best characterized as a large cap-growth investment strategy.
This is an important finding since a number of papers (e.g. Lakonishok, Shleifer and Vishny (1994)) have
documented that stocks identified as “value” stocks outperform “growth” stocks over the subsequent five
year period. Lakonishok et al. suggests that investors extrapolate the bad news associated with value
stocks too far (underpricing them) and the good news associated with growth stocks (overpricing them).
Fama and French (1993), on the other hand, suggest the higher returns associated with “value” stocks is
due to risk. Not being a traditional “value” investor, Buffet’s performance suggests the traditional
explanation for the abnormal performance by “value” stocks is not applicable for explaining Berkshire’s
portfolio performance. Berkshire’s performance does not appear to be driven by buying traditional

22
“value” stocks (i.e. beaten down stocks), but rather by buying stocks whose growth potential is
undervalued by the market.
B. Market Reaction to Initial Public Disclosure of Berkshire Hathaway Investments
Table 4 presents the results of an event study using the initial disclosure of 208 of the 335 stocks
in Berkshire’s portfolio. The event study sample size is less than the total number of investments in the
period from 1976 to 2006 for several reasons: (1) five stocks are not included in the CRSP files; (2)
twenty-two investments were not publicly trading at the time of announcement; and (3) the disclosure
date is unknown for 100 stocks.
In Panel A, the mean (median) market-adjusted return of the first public disclosure of 208
Berkshire Hathaway stock investments between 1976 and 2006 is 4.03% (1.36%). However, when we
separate the ten acquisition stocks the market-adjusted return drops to 3.09% (1.20%) significant at a p-
value < 0.001. Additionally 84.42% of the announcements have a positive abnormal return.
Panel B partitions the initial disclosure of stock investments (omitting acquisitions) between the
first half of the study period from January 1976 to June 1991 and the second half from July 1991 to
December 2006. The mean (median) abnormal return of disclosures in the first half is 0.82% (0.73%)
significant a p-value < 0.001 level. The mean (median) abnormal return of disclosures in the second half
are significantly higher at 4.40% (1.89%) also significant at p-value < 0.001. A t-Test of the difference in
the means is significant at a p-value < 0.001 and a non-parametric Wilcoxon rank sum test is also
significant at a p-value < 0.001.
The difference between the first half and the second half could be for a variety of reasons. As
more investors recognize the investment prowess of Warren Buffett, the disclosures would have a greater
impact in the second half. It is also possible, due to the less comprehensive coverage of news sources
over the first half of the study; we were unable to record the correct public disclosure date. This problem
becomes less of an issue after the late 1980s due to the growth of electronic medium. We interpret the
positive stock price reaction as evidence that the market views Berkshire’s buying a stock as a signal of

23
positive future risk-adjusted returns and this signal has become stronger as the investment success of
Buffett has become more well-known. The significant stock price reaction to the news of Berkshire
buying a stock suggests that Berkshire’s investments are heavily followed by copy-cat investors.
C. Berkshire’s Long-term Investment Performance
The results of the calendar time abnormal return test of the Berkshire Hathaway portfolio,
presented in Table 5 Panel A, indicate that Berkshire has obtained significant positive abnormal risk-
adjusted returns. The monthly mean (median) CTAR of the stock investment portfolio using Fama &
French 25 size and book-to-market portfolio returns as a proxy for expected returns is 0.53% (0.53%),
significant at a p-value < 0.003 (0.001) level. Using the value weight returns of all stocks in CRSP as a
proxy for expected returns, the monthly mean (median) CTAR of the stock investment portfolio is 0.72%
(0.53%), significant at a p-value < 0.001 (0.001) level. This equates to an annualized excess return of
6.55% over the Fama and French 25 size and book-to-market equity benchmark portfolio and an
annualized excess return of 8.99% over the value weight index. Similarly, the CTAR performance of the
mimicking portfolio also beats the Fama and French and value-weight index as indicated in Panel B of
Table 5.
Table 6 presents the results of factor regressions using the Fama and French 3-Factor and Carhart
4-Factor models on the returns of both the Berkshire Hathaway and mimicking portfolios. The alphas or
intercept terms are all statistically significant at p-values < 0.025 as are the excess market return and high-
minus low book-to-market factors at p-values < 0.001. The small-minus-big market equity and prior 2-12
moth return momentum factors are not significant in explaining the returns of either portfolio.
Table 7 presents an annual comparison of the performance of Berkshire Hathaway’s stock
investment portfolio with the return on Berkshire Hathaway stock, the return on the S&P 500 Index, the
value weight index of all stocks, and the portfolio formed using returns from the value weight 25 Fama
and French size and book-to-market equity portfolios. There is only one year, 2001, when the Berkshire
investment portfolio experiences a negative return. Over the 31 year period from 1976 to 2006, the

24
returns on the Berkshire portfolio exceeded the returns on the S&P 500 Index in all but three years with
the average annual return exceeding the S&P 500 by 14.65%. Average annual excess returns using the
value weight and Fama and French benchmark portfolio are 10.91% and 8.56%.
D. Potential Explanations for Berkshire’s Investment Performance
1. Risk
The positive and significant results using the calendar time abnormal returns methodology
indicates that risk does not appear to explain Berkshire’s performance. Since this methodology controls
for risk using benchmark portfolios, it suggests that Berkshire obtained positive and significant risk-
adjusted returns. As robustness check, we calculated a Berkshire portfolio Beta of 0.811 over the sample
period. Additionally, the Beta of 0.880 was slightly higher in the first half of the sample period (January
1976 - June 1991) than a beta of 0.725 over the second half (July 1991- December 2006). This implies
that Berkshire’s portfolio appears slightly less risky than the market. This indicates that Berkshire’s
investment performance cannot be explained by higher portfolio risk.
2. Luck
By the start of our sample period in 1976 Buffett had already established a reputation as a
successful investor; however, there may still have been uncertainty about his future success (Statman and
Scheid (2001)). Since we chose Buffett due to his successful record, we should not be surprised to find
his performance far exceeds the market. We also know after-the-fact some managers will have been
lucky. So, the question becomes when is the performance of a manager so good that even after
accounting for the bias associated with selecting the ex-post most successful investor, pure chance cannot
account for the performance? In assessing the performance of ex-post most successful investors, the
appropriate benchmark should therefore be the best return from the returns of many investment managers.
We use the Monte Carlo simulations proposed by Marcus (1990) to derive a close numerical
approximation of the probability distribution of the best performance of a sample of managers assuming
that the markets are efficient. Once derived, we can compare Berkshire’s performances with that of the
25
best performing manager to determine if abnormally good performance is evidence of an ability to beat
the market after accounting for the fact that we have selected ex post, the best performing investor.
Table 8 Panel A provides the frequency distribution of the Monte Carlo simulations prescribed by
Marcus (1990) for 173, 1,407 and 2,591 managers17
. In the experiment using 173 managers, the chance
of a winning manager beating the market as many years or more as Buffett (28) over the 31-year period is
0.01%. Increasing the number to 1,407 managers, the probability of a beating the market 28 years or
more increases to 0.31% and for 2,591 managers the probability is 0.56%. Using the conventional 10%
significance level, we therefore can reject the hypothesis that Berkshire’s beating the market in 28 out of
31 years is due to chance. That is, once we take into consideration that Berkshire is not an investor
chosen at random, but one that has been identified as an ex-post winner, the frequency with which it beats
the market is high enough to constitute a contradiction of market efficiency.
This test, however, ignores the magnitude by which Berkshire outperformed the market over the
period. As indicated in Table 8, the mean winning margin of the best performing manager is 2.65, 3.24,
and 3.39 standard deviations in a contest of 173, 1,407 and 12,591 managers respectively. However, one
would expect the extent to which the best performer beats the market would also depend on the volatility
of the manager-specific bets or risk. High variance strategies will result in a winning manager with a
large margin over the market so the expected return for the best performing manager is also a function of
manager-specific risk or noise in the market. By assuming some noise level, we can estimate the standard
deviation of the manager-specific risk and include it in the margin of the winning manager’s score in the
simulation to derive the expected return benchmark of the best performing manager. Berkshire’s return
can then be tested against the expected return benchmark of the best performing manager at a given noise
level. The drawback to this approach is determining how much noise is in the market.
17
We choose 173 since this is the number of unique investment managers in the CDA/Spectrum Institutional Money
Manger 13(f) Holdings database from Thomson Financial with holdings over the etire available data period from
1979 - 2006; 1,407 is the annual average number of investment managers over this period, and 2,591 represents the
maximum number of investment managers in one year. Used with permission. All rights reserved.
26
The standard deviation of noise is a function of the square root of time. For example, at a given
noise level of 10%, the standard deviation of manager-specific noise for the 31-year period is 10%/311/2
=
1.80%. It is helpful to think in terms of the probability distribution of the assumed noise level. An
assumed noise level of 10% is analogous to one-third of all managers performing better or worse than the
market by at least 10%. According to Capital Resource Advisors (formerly SEI) the median tracking
error of fund managers is approximately 5%. Using the CDA/Spectrum Institutional Money Managers
13(f) Holdings data base and merging it with CRSP, we estimate the noise level to be 13.65% by finding
the noise level that provides a distribution such that one-third of the managers perform greater than or less
than that level. We therefore establish benchmarks for levels of noise ranging from 5% to 20% including
the 13.65% empirically estimated noise level (Figure 1).
Table 9 Panel A provides the results of a test of the performance of the Berkshire Hathaway
against the expected return of the best performing manager at noise levels of 5% to 20% and number of
managers of 173, 1,407 and 2,591. The mean annual excess performance of 14.65% for the Berkshire
Hathaway portfolio exceeds the expected returns of the best performing investment manager at p-value <
0.001 for all managers/noise combination levels except for the 20%-noise/173-manager combination
which is significant at a p-value < 0.011. Once we account for the magnitude by which Berkshire beats
the market, performance due to “luck” is very unlikely and we conclude Berkshire’s performance cannot
be explained as due to luck or chance after accounting for ex-post selection bias.
3. Evidence using long term returns to a mimicking portfolio
The preceding arguments suggest that Berkshire’s performance is not due to higher levels of risk
or pure luck, explanations which are consistent with EMT. However, under Grossman and Stiglitz’s
(1980) interpretation of EMT, positive abnormal returns may be compensation for information production
that keeps market efficient. If this is correct, Berkshire’s positive risk-adjusted performance is still
potentially consistent with EMT. If we find that if an investor who mimics Berkshire investment
portfolio earns positive abnormal returns, this would suggest that the information produced by skilled
investors does not get transmitted quickly into stock prices and would appear inconsistent with the

27
Grossman and Stiglitz prediction of EMT. Table 9 Panel B provides the results of a test of the
performance of the mimicking portfolio against the expected return of the best performing manager at
noise levels of 5% to 20% and number of managers of 173, 1,407 and 2,591. The mean annual excess
performance of 14.26% for the mimicking portfolio exceeds the expected returns of the best performing
manager at manager noise levels of 15% and below at a p-value < 0.001. At the 20% manager noise level
with 173 managers the p-value < 0.021. Therefore at any noise level up to 20%, the performance of the
mimicking portfolio exceeds the performance of the best performing manager under efficient market
theory. Noise levels of greater than 20% are not likely under EMT. The magnitude by which mimicking
portfolio beats the market indicates that information does not get transmitted quickly into stock prices and
therefore appears inconsistent with the Grossman and Stiglitz interpretation of EMT. Overall, we
conclude the performance of Berkshire Hathaway’s investment portfolio indicates superior investment
skill in direct contradiction to Efficient Market Theory.
IV. Conclusion
This paper provides one of the most rigorous analyses of Berkshire Hathaway’s investment
performance to date. We analyze Berkshire Hathaway’s investment style and explore potential
explanations for its superior investment performance. We show that Berkshire’s investment style is better
described as a large-cap growth style contrary to the popular notion of Buffett being a traditional “value”
or “contrarian” investor. Hence, Berkshire’s performance does not appear to be driven by buying
traditional “value” stocks (i.e. beaten down stocks) but by buying stocks whose growth potential is
undervalued by the market.
We explore a number of potential explanations for Berkshire’s investment performance. Since
Buffett has been identified ex-post as a successful investor, we should not be surprised to find his
performance is far above the mean. We use the Monte Carlo simulation methodology proposed by
Marcus (1990) to derive a close numerical approximation of the probability distribution of the best
performance of a sample of managers, assuming that markets are efficient. Using this as a benchmark, we

28
assess whether Berkshire’s performance is evidence of an ability to beat the market even after accounting
for the fact that we have selected the best performing investor. We show that under reasonable
assumptions, pure luck appears to be an unlikely explanation for Berkshire’s performance.
We then examine whether Berkshire’s high investment returns is a result of high risk in its stock
portfolio. We compute calendar time abnormal returns using three benchmarks and find that returns to
Berkshire’s investment are statistically greater indicating that Berkshire’s investment performance is not
being driven by high risk.
We evaluate the performance of an investment strategy that mimics Berkshire’s investments after
they are publicly disclosed to evaluate how quickly information produced by skilled investors gets
incorporated into stock prices. We find that an investor who mimicked Berkshire’s investments from
1976 to 2006 after they were publicly disclosed in regulatory filings could obtain calendar time positive
annualized abnormal returns significantly greater statistically and economically over returns of three
different benchmarks of similar risk characteristics. This would suggest that the market under-reacts to
the information that Berkshire has bought a stock and indicates that the market is slow in incorporating
the information produced by skilled investors. So, while Grossman and Stiglitz’s interpretation of EMT
allows for the existence of skilled investors who earn positive abnormal returns while ensuring the
efficiency of markets, the slow incorporation of their information into stock prices appears inconsistent
with traditional predictions of EMT.
We also examine the stock price reaction to the news of Berkshire buying a stock. We find that
the market reacts positively to the public disclosure of a Berkshire Hathaway stock investment with the
market reaction becoming stronger in the second half of the study period. This suggests that the market
views Berkshire’s buying a stock as a signal of positive future risk-adjusted returns and this signal has
become stronger as the investment success of Buffett has become more well-known. The significant
stock price reaction to the news of Berkshire buying a stock suggests that Berkshire’s investments are
heavily followed by copy cat investors.

29
We conclude that Warren Buffett appears to possess investment skill. This result is consistent
with findings in a number of recent papers such as Chen, Jegadeesh and Wermers (2000), Cohen, Coval
and Pastor (2005), Wermers (2000) and Kosowski, Timmermann, Wermers and White (2005) that argue
that investment skill is more prevalent than earlier papers indicate.
30
References
Baks, K.P., A. Metrick and J. Wachter, 2001, Should investors avoid all actively managed mutual funds?
A study in Bayesian performance evaluation, Journal of Finance 56, 45-84.
Barber, B.M. and J. D. Lyon, 1997, Detecting long-run abnormal stock returns: the empirical power and
specification of test statistics, Journal of Financial Economics 42, 341-372.
Barber, B. M. and D. Loeffler, 1993, The “dartboard” column: second-hand information and price
pressure. The Journal of Financial and Quantitative Analysis 28, 273-284.
Black, F. 1973, Yes Virginia, there is hope: tests of value line ranking system, Financial Analysts Journal
29, 10-14.
Bollen, Nicolas P. B. and Jeffrey A. Busse, 2001, On the timing ability of mutual fund managers, Journal
of Finance 56, 1075-1094.
Brown, S.J., and W. Goetzmann, 1995, Performance persistence, Journal of Finance 50, 679-698.
Carhart, M. M., 1997, On persistence in mutual fund performance, Journal of Finance 52, 57-82.
Carlson, R.S., 1970, Aggregate performance in mutual funds, Journal of Financial and Quantitative
Analysis 5, 1-32.
Chance, Don M. and Michael Hemler, 2001, The performance of professional market timers: daily
evidence from executed strategies, Journal of Financial Economics 62, 377-411.
Chen, H., N. Jegadeesh and R. Wermers, 2000, The value of active mutual fund management: An
examination of the stock holdings and trades of fund managers, Journal of Financial and Quantitative
Analysis 35, 343-368.
Cohen, R., J. Coval, and L. Pastor, 2005, Judging fund managers by the company they keep, Journal of
Finance 60, 1057-1096.
Copeland, T. E. and D. Mayers, 1982, The value line enigma (1965-1978): a case study of performance
evaluation issues, Journal of Financial Economics 10, 289-321.
Coval, Joshua D., David A. Hirshleifer and Tyler G. Shumway, 2002, Can individual investors beat the
market? Working paper, Ann Arbor: University of Michigan.
Daniel. K., M. Grinblatt, S. Titman and R. Wermers, 1997, Measuring mutual fund performance with
characteristics based benchmarks, Journal of Finance 52, 1035-1058.
Desai, H. and P. C. Jain, 1995, An analysis of the recommendations of “superstar” money managers at
Barron’s annual roundtable, Journal of Finance 50, 1257-1274.
Elton, E. J., M. J. Gruber and C. R. Blake, 1996, The persistence of risk-adjusted mutual fund
performance. Journal of Business 69, 133-157.
Fama, E. F. and K. R. French, 1993, Common risk factors in the returns on stocks and bonds, Journal of
Financial Economics 33, 3-56.
31
Fama, E. F., 1998, Market efficiency, long-term returns, and behavioral finance, Journal of Financial
Economics 49, 283-306.
Frank, M., J. Poterba, J. Shoven and D. Shackelford, 2004, Copycat funds: Information disclosure
regulation and the returns to active management in the mutual fund industry, Journal of Law and
Economics 47, 515-541.
Goetzmann, W., and R.G. Ibbotson, 1994, Do winners repeat? Patterns in mutual fund performance,
Journal of Portfolio Management 20, 9-18.
Graham, John R. and Campbell R. Harvey, 1996, Market timing ability and volatility implied in
investment newsletters’ asset allocation recommendations, Journal of Financial Economics 42, 397-421.
Grinblatt, M., and S. Titman, 1988, The evaluation of mutual fund performance: An analysis of monthly
returns, Working Paper, University of California at Los Angeles.
Grinblatt, M., and S. Titman, 1992, The persistence of mutual fund performance, Journal of Finance 47,
1977-1984.
Grossman, S. and J. Stiglitz, 1980. One the impossibility of informationally efficient markets, American
Economic Review 70, 393-408.
Hendricks, D., J. Patel and R. Zeckhauser, 1993, Hot hands in mutual funds: The persistence of
performance 1974-1988, Journal of Finance 48, 93-130.
Ikenberry, D., J. Lakonishok and T. Vermaelen, 1995, Market underreaction to open market share
repurchases, Journal of Financial Economics 39, 181-208.
Jaffe, J. F., 1974, Special information and insider trading, Journal of Business 47, 410-428.
Jaffe, Jeffrey F. and James M. Mahoney, 1999, The performance of investment newsletters, Journal of
Financial Economics 53, 289-307.
Jensen, M. C., 1968, The performance of mutual funds in the period 1945-1964, Journal of Finance 23,
389-416.
Kosowski, R., A. Timmerman, R. Wermers and Hal White, 2006, Can mutual fund “stars” really pick
stocks? New evidence from a bootstrap analysis, Journal of Finance 61 (6) 2551-2595.
Kothari, S. P. and J. B. Warner, 1997, Measuring long-horizon security price performance, Journal of
Financial Economics 43, 301-339.
Kurz, M. and M. Motolese, 2000, Endogenous uncertainty and market volatility, Stanford University
working paper.
Lehman, B. N., and D. Modest, 1987, Mutual fund performance evaluation: A comparison of benchmarks
and a benchmark of comparisons, Journal of Finance 42, 233-265.
Lewis, C. M., R. J. Rogalski and J. K. Seward, 1997, The information content of value line convertible
bond ratings, Journal of Portfolio Management 24, 42-52.
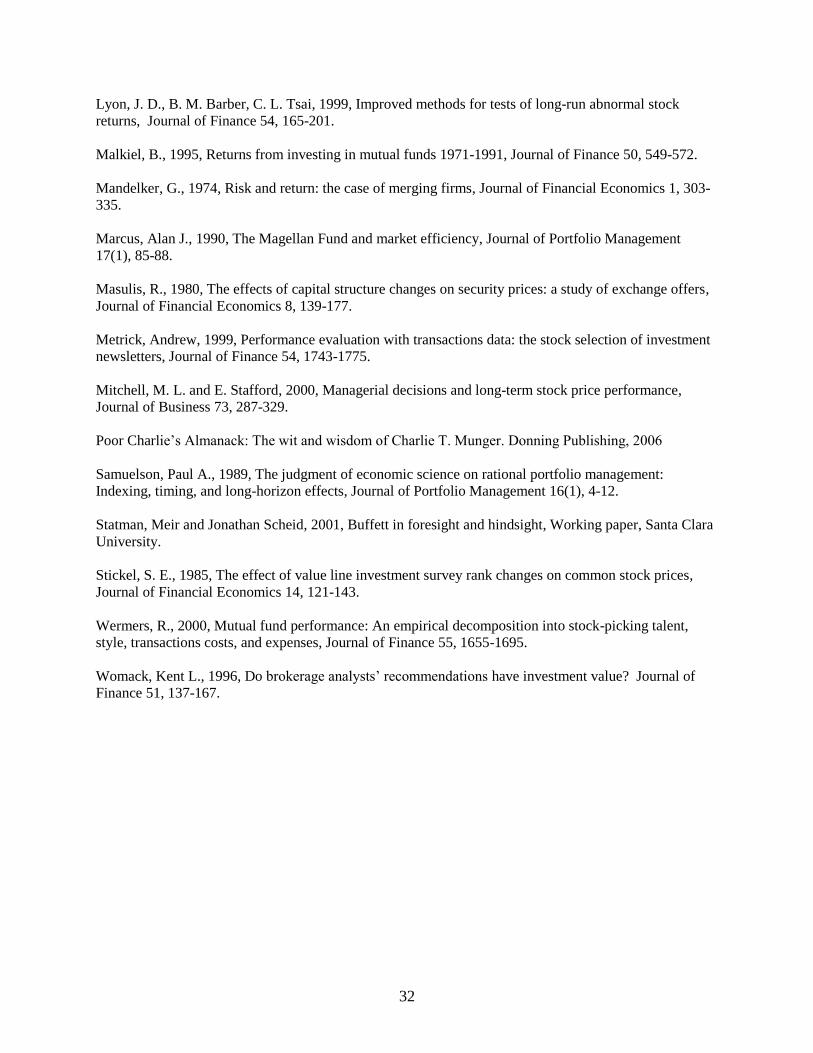
32
Lyon, J. D., B. M. Barber, C. L. Tsai, 1999, Improved methods for tests of long-run abnormal stock
returns, Journal of Finance 54, 165-201.
Malkiel, B., 1995, Returns from investing in mutual funds 1971-1991, Journal of Finance 50, 549-572.
Mandelker, G., 1974, Risk and return: the case of merging firms, Journal of Financial Economics 1, 303-
335.
Marcus, Alan J., 1990, The Magellan Fund and market efficiency, Journal of Portfolio Management
17(1), 85-88.
Masulis, R., 1980, The effects of capital structure changes on security prices: a study of exchange offers,
Journal of Financial Economics 8, 139-177.
Metrick, Andrew, 1999, Performance evaluation with transactions data: the stock selection of investment
newsletters, Journal of Finance 54, 1743-1775.
Mitchell, M. L. and E. Stafford, 2000, Managerial decisions and long-term stock price performance,
Journal of Business 73, 287-329.
Poor Charlie’s Almanack: The wit and wisdom of Charlie T. Munger. Donning Publishing, 2006
Samuelson, Paul A., 1989, The judgment of economic science on rational portfolio management:
Indexing, timing, and long-horizon effects, Journal of Portfolio Management 16(1), 4-12.
Statman, Meir and Jonathan Scheid, 2001, Buffett in foresight and hindsight, Working paper, Santa Clara
University.
Stickel, S. E., 1985, The effect of value line investment survey rank changes on common stock prices,
Journal of Financial Economics 14, 121-143.
Wermers, R., 2000, Mutual fund performance: An empirical decomposition into stock-picking talent,
style, transactions costs, and expenses, Journal of Finance 55, 1655-1695.
Womack, Kent L., 1996, Do brokerage analysts’ recommendations have investment value? Journal of
Finance 51, 137-167.

33
Figure 1: Manager-Specific Risk (Noise) under Efficient Markets
Under efficient markets using the normal distribution the assumed level of manager-specific risk (noise) would
imply that 16% of the managers would perform better and 16% worse than the market average by the assumed level.
Prior empirical research estimates this level to be from 5% to 20%. Using the CDA/Spectrum Institutional
Money Managers 13(f) Holdings data base and merging it with CRSP we empirically estimate this level is
13.65%.
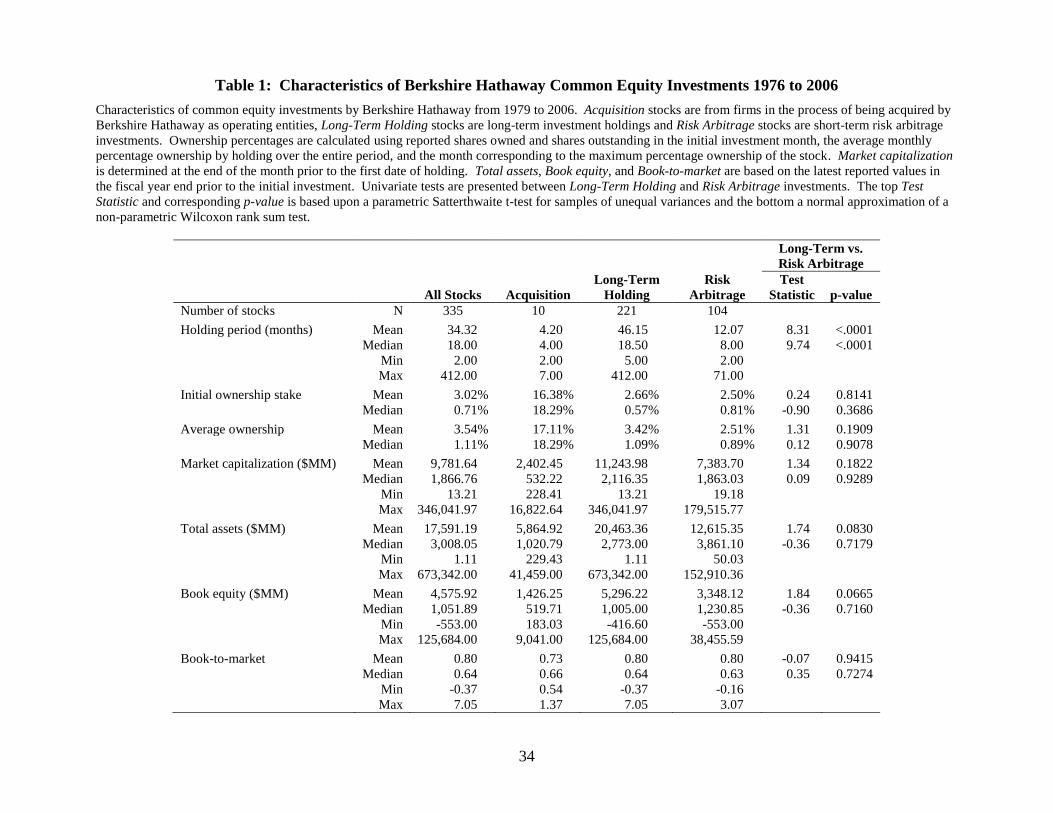
34
Table 1: Characteristics of Berkshire Hathaway Common Equity Investments 1976 to 2006
Characteristics of common equity investments by Berkshire Hathaway from 1979 to 2006. Acquisition stocks are from firms in the process of being acquired by
Berkshire Hathaway as operating entities, Long-Term Holding stocks are long-term investment holdings and Risk Arbitrage stocks are short-term risk arbitrage
investments. Ownership percentages are calculated using reported shares owned and shares outstanding in the initial investment month, the average monthly
percentage ownership by holding over the entire period, and the month corresponding to the maximum percentage ownership of the stock. Market capitalization
is determined at the end of the month prior to the first date of holding. Total assets, Book equity, and Book-to-market are based on the latest reported values in
the fiscal year end prior to the initial investment. Univariate tests are presented between Long-Term Holding and Risk Arbitrage investments. The top Test
Statistic and corresponding p-value is based upon a parametric Satterthwaite t-test for samples of unequal variances and the bottom a normal approximation of a
non-parametric Wilcoxon rank sum test.
Long-Term vs.
Risk Arbitrage
All Stocks
Acquisition
Long-Term
Holding
Risk
Arbitrage
Test
Statistic p-value
Number of stocks N 335 10 221 104
Holding period (months) Mean 34.32 4.20 46.15 12.07 8.31 <.0001
Median 18.00 4.00 18.50 8.00 9.74 <.0001
Min 2.00 2.00 5.00 2.00
Max 412.00 7.00 412.00 71.00
Initial ownership stake Mean 3.02% 16.38% 2.66% 2.50% 0.24 0.8141
Median 0.71% 18.29% 0.57% 0.81% -0.90 0.3686
Average ownership Mean 3.54% 17.11% 3.42% 2.51% 1.31 0.1909
Median 1.11% 18.29% 1.09% 0.89% 0.12 0.9078
Market capitalization ($MM) Mean 9,781.64 2,402.45 11,243.98 7,383.70 1.34 0.1822
Median 1,866.76 532.22 2,116.35 1,863.03 0.09 0.9289
Min 13.21 228.41 13.21 19.18
Max 346,041.97 16,822.64 346,041.97 179,515.77
Total assets ($MM) Mean 17,591.19 5,864.92 20,463.36 12,615.35 1.74 0.0830
Median 3,008.05 1,020.79 2,773.00 3,861.10 -0.36 0.7179
Min 1.11 229.43 1.11 50.03
Max 673,342.00 41,459.00 673,342.00 152,910.36
Book equity ($MM) Mean 4,575.92 1,426.25 5,296.22 3,348.12 1.84 0.0665
Median 1,051.89 519.71 1,005.00 1,230.85 -0.36 0.7160
Min -553.00 183.03 -416.60 -553.00
Max 125,684.00 9,041.00 125,684.00 38,455.59
Book-to-market Mean 0.80 0.73 0.80 0.80 -0.07 0.9415
Median 0.64 0.66 0.64 0.63 0.35 0.7274
Min -0.37 0.54 -0.37 -0.16
Max 7.05 1.37 7.05 3.07
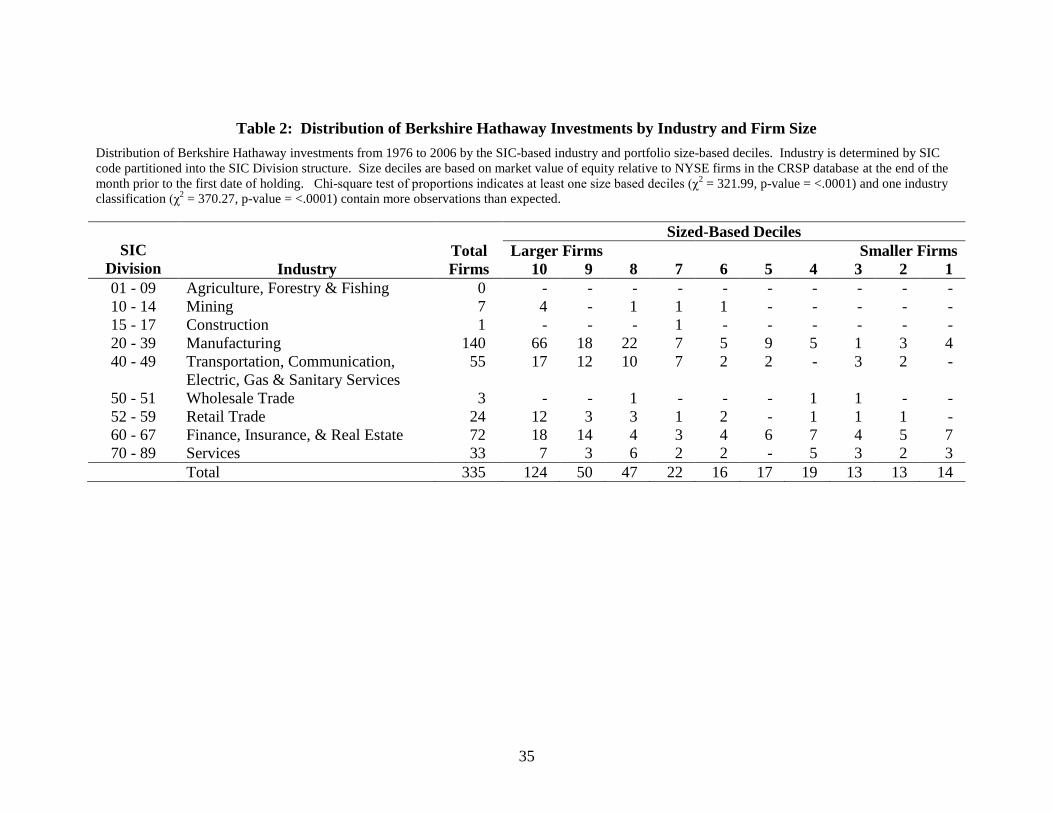
35
Table 2: Distribution of Berkshire Hathaway Investments by Industry and Firm Size
Distribution of Berkshire Hathaway investments from 1976 to 2006 by the SIC-based industry and portfolio size-based deciles. Industry is determined by SIC
code partitioned into the SIC Division structure. Size deciles are based on market value of equity relative to NYSE firms in the CRSP database at the end of the
month prior to the first date of holding. Chi-square test of proportions indicates at least one size based deciles (χ2 = 321.99, p-value = <.0001) and one industry
classification (χ2 = 370.27, p-value = <.0001) contain more observations than expected.
SIC
Division Industry
Total
Firms
Sized-Based Deciles
Larger Firms Smaller Firms
10 9 8 7 6 5 4 3 2 1
01 - 09 Agriculture, Forestry & Fishing 0 - - - - - - - - - -
10 - 14 Mining 7 4 - 1 1 1 - - - - -
15 - 17 Construction 1 - - - 1 - - - - - -
20 - 39 Manufacturing 140 66 18 22 7 5 9 5 1 3 4
40 - 49 Transportation, Communication,
Electric, Gas & Sanitary Services
55 17 12 10 7 2 2 - 3 2 -
50 - 51 Wholesale Trade 3 - - 1 - - - 1 1 - -
52 - 59 Retail Trade 24 12 3 3 1 2 - 1 1 1 -
60 - 67 Finance, Insurance, & Real Estate 72 18 14 4 3 4 6 7 4 5 7
70 - 89 Services 33 7 3 6 2 2 - 5 3 2 3
Total 335 124 50 47 22 16 17 19 13 13 14
36
Table 3: Distribution of Berkshire Hathaway Investments by Fama & French Size
and Book-to-Market Equity Classification
Distribution of Berkshire Hathaway stock investments from 1976 to 2006 using Fama & French small vs.
big (size) and value vs. growth (book-to-market equity) classification. The classification is based upon
portfolios constructed at the end of each June, as the intersection of 2 portfolios formed on size (market
equity) and 3 portfolios formed on the ratio of book equity to market equity. The size breakpoint for year t
is the median NYSE market equity at the end of June of year t. BE/ME for June of year t is the book equity
for the last fiscal year end in t-1 divided by ME for December of t-1. The BE/ME breakpoints are the 30th
and 70th NYSE percentiles. The firms are classified based upon the book value from the latest annual
financial information available and the market equity value at the end of the month prior to the first date of
holding.
Market Equity
Book-to-Market Equity Small Big Total
Value ( ≥ 70th
percentile ) 27 37 64
Neutral 31 95 126
Growth ( ≤ 30th
percentile ) 17 121 138
Negative 1 6 7
Total 76 259 335

37
Table 4: Abnormal Returns of Initial Public Disclosure of Berkshire Hathaway
Investments
Average market-adjusted returns of first public disclosure of Berkshire Hathaway stock investments
between 1976 and 2006. Abnormal returns are measured on the day of public disclosure relative to the
value weighted index of all stocks in CRSP. Panel A contrasts acquisition announcements and investment
announcements consisting of long-term and risk arbitrage investments. Panel B compares the results of the
first half of the study period with the second half pre and post June 30, 1991. Announcement returns are
not available for some stocks due to: (1) returns unavailable from CRSP or other sources; (2) investment
unavailable due to not trading; and (3) public announcement date unknown. Parametric test uses the
Student’s t distribution and non-parametric test uses the Wilcoxon rank sum test.
Panel A: Abnormal Returns by Announcement Type
All Stocks
Acquisition Investment
Test
Statistic p-value
Number of stocks 335 10 325
Returns unavailable 5 1 4
Investment unavailable 22 0 22
Announcement unknown 100 0 100
Available returns 208 9 199
Percent positive 85.10% 100.00% 84.42%
Mean 4.03% 24.91% 3.09% -1.97 0.083
t 6.71 3.53 6.91
Prob > |t| <.001 0.008 <.001
Median 1.36% 22.62% 1.20% 2.40 0.017
s 8,922.0 22.5 8,005.5
Prob > |s| <.001 0.004 <.001
Panel B: Disclosure of Stock Investments Pre and Post June 30, 1991
1st Half 2
nd Half
First Half vs. Second
Half
All
Investments
Pre-
06/30/91
Post-
06/30/91
Test
Statistic p-value
Number of stocks 325 174 151
Returns unavailable 4 2 2
Investment unavailable 22 7 15
Announcement unknown 100 92 8
Available returns 199 73 126
Percent positive 72.60% 91.27%
Mean 0.82% 4.40% -5.15 <.001
t 4.35 6.57
Pr > |t| <.001 <.001
Median 0.73% 1.89% -5.06 <.001
s 759.5 3,608.5
Pr > |s| <.001 <.001

38
Table 5: Calendar-Time Returns of Berkshire Hathaway and Mimicking Portfolios
Monthly calendar-time returns (CTRs) of Berkshire Hathaway stock investment portfolio and mimicking portfolio from 1976
to 2006. Mean and median CTRs are calculated each month as the difference between the portfolio return and the expected
return represented by a value weight index of all stocks in CRSP and a portfolio formed using the returns from the Fama &
French 25 size and book-to-market equity portfolios. The Fama & French size and book-to-market equity benchmark
portfolio is created by selecting for each firm the corresponding monthly returns from the 5 x 5 matrix of value weight
returns and weighting by the matching investment in the Berkshire Hathaway portfolio. The corresponding cell in the 25 size
and book-to-market equity matrix is determined using market equity of the firm at the beginning of the month and the book
value of equity from Compustat in the fiscal year end prior to the reported quarter. Student’s t tests and resulting p-values are
based upon the mean CTAR standardized by the portfolio residual standard deviation. Non-parametric tests of medians are
based upon Wilcoxon rank sum tests. Panel A presents the return on Berkshire Hathaway’s portfolio calculated based upon
the investment weights as reported in regulatory filings with monthly prices and returns from CRSP. Panel B presents returns
on a mimicking portfolio formed each month beginning the month after the investment is reported in regulatory filings.
Monthly portfolio returns are formed using both investment weights and equal weights. The investment opportunity in a
mimicking portfolio is restricted due to delay in filings, confidential 13F filings and Berkshire Hathaway arbitrage activities.
Panel A: Berkshire Hathaway’s Portfolio
Benchmark N %Pos Mean t Pr > |t| Median s Pr > |s|
S&P 500 Index 372 64.5% 1.01% 5.30 <.001 0.91% 12,544 <.001
Value Weight Index 372 59.9% 0.72% 3.74 <.001 0.53% 9,315 <.001
Fama & French 25 Size-
BE/ME Portfolio 372 58.9% 0.53% 2.95 0.003 0.53% 7,468 <.001
Panel B: Mimicking Portfolio
Portfolio/Benchmark N %Pos Mean t Pr > |t| Median s Pr > |s|
S&P 500 Index 372 65.6% 0.99% 5.08 <.001 0.88% 12,100 <.001
Value Weight Index 372 59.4% 0.71% 3.57 <.001 0.61% 8,910 <.001
Fama & French 25 Size-
BE/ME Portfolio 372 58.9% 0.50% 2.75 0.006 0.51% 7,100 <.001

39
Table 6: Factor Regressions of Berkshire Hathaway and Mimicking Portfolios
Fama & French three factor and Carhart four factor regressions of Berkshire Hathaway stock investment portfolio and
mimicking portfolio from 1976 to 2006. Portfolio returns for each month are regressed on the three/four factors shown to
explain returns in Fama and French (1993) and Carhart (1997) respectively. The Fama/French factors are constructed using
the 6 value-weight portfolios formed on size and book-to-market. Small-minus-big is the average return on the three small
market capitalization portfolios minus the average return on the three big market capitalization portfolios. High-minus-low is
the average return on the two value portfolios (high book-to-market) minus the average return on the two growth (low book-
to-market) portfolios. Excess return on the market is the value-weight return on all NYSE, AMEX, and NASDAQ stocks
(from CRSP) minus the one-month Treasury bill rate (from Ibbotson Associates). Momentum is the average return on the
two high prior return portfolios minus the average return on the two low prior return portfolios formed by the intersections of
2 portfolios formed on size (market equity) and 3 portfolios formed on prior (2-12) monthly return. The monthly size
breakpoint is the median NYSE market equity. The monthly prior (2-12) return breakpoints are the 30th and 70th NYSE
percentiles. P-values using robust standard errors are presented below coefficient estimates.
Berkshire Hathaway Portfolio Mimicking Portfolio
Variable
Fama & French
3-Factor Model
Carhart
4-Factor Model
Fama & French
3-Factor Model
Carhart
4-Factor Model
Intercept 0.0045
(0.012)
0.0044
(0.019)
0.0045
(0.016)
0.0044
(0.024)
Excess market return 1.0450
(<.001)
1.0459
(<.001)
1.0256
(<.001)
1.0263
(<.001)
Small-minus-big
(market equity)
-0.0148
(0.880)
-0.0177
(0.856)
-0.0052
(0.960)
-0.0070
(0.946)
High-minus-low
(book-to-market)
0.5546
(<.001)
0.5573
(<.001)
0.5565
(<.001)
0.5582
(<.001)
Momentum
(prior 2-12 returns)
0.0175
(0.766)
0.0109
(0.865)
F Value 179.76 134.56 162.51 121.59
Pr > F <.001 <.001 <.001 <.001
Adj R-Square 59.11% 59.02% 56.64% 56.52%

40
Table 7: Berkshire Hathaway Stock Portfolio vs. Benchmarks.
Annual performance summary of Berkshire Hathaway stock investment portfolio return and various benchmarks. The return on Berkshire Hathaway stock portfolio is calculated
based upon the investment weights at the end of a reported quarter with monthly returns from CRSP for the three months that correspond to the quarter’s end. N and Value are the
number of stocks and the portfolio value at the end of each calendar year. Largest 5 Holdings is the percentage of the portfolio value the 5 largest holdings represent and Return is
the return on the stock portfolio for the year. Turnover Ratio is calculated as the minimum of the sum of total purchases and total sales divided by average portfolio value. The
S&P 500 Index return is reported in the 2003 Berkshire Hathaway Annual Report and the Value Weight Index is the value-weight index of all stocks listed in CRSP. The Fama &
French 25 size and book-to-market equity portfolio is calculated by creating a portfolio of stock returns corresponding to the cell each firm would fall based upon the 5 x 5 matrix
of quintiles created by market equity and the book-to-market equity ratio.
Year
Berkshire Hathaway Stock Portfolio
Benchmarks
S&P 500 Index Value Weight Index F&F 25 Size-BE/ME
N Value
Largest 5
Holdings Return Return Difference Return Difference Return Difference
1976 11 $125 77.2% 121.12% 19.15% 101.97% 26.77% 94.35% 44.41% 76.71%
1977 19 196 55.4 16.43 -11.50 27.93 -2.98 19.41 13.52 2.92
1978 22 290 56.5 12.99 1.06 11.92 8.54 4.44 12.98 0.01
1979 96 534 45.5 24.64 12.31 12.33 24.41 0.23 24.37 0.27
1980 110 665 49.1 13.34 25.77 -12.43 33.23 -19.89 34.54 -21.19
1981 29 748 64.2 26.63 -9.73 36.36 -3.98 30.61 2.93 23.70
1982 25 1,162 71.5 46.50 14.76 31.74 20.42 26.08 22.57 23.94
1983 15 1,405 85.8 34.78 17.27 17.51 22.65 12.13 26.34 8.43
1984 18 1,394 76.6 10.13 1.40 8.72 3.16 6.96 2.14 7.99
1985 14 1,467 83.3 71.95 26.33 45.61 31.41 40.53 34.61 37.33
1986 11 2,115 95.4 21.46 14.62 6.84 15.56 5.90 12.16 9.31
1987 15 2,499 95.3 18.56 2.03 16.54 1.82 16.74 5.11 13.46
1988 20 3,730 87.4 18.53 12.40 6.13 17.55 0.98 10.36 8.17
1989 12 5,741 93.0 50.20 27.25 22.95 28.43 21.77 31.80 18.40
1990 13 5,819 91.6 0.00 -6.56 6.56 -6.08 6.08 4.91 -4.91
1991 16 10,295 85.0 43.36 26.31 17.05 33.64 9.71 43.35 0.01
1992 18 12,890 78.3 15.70 4.46 11.23 9.06 6.63 7.56 8.14
1993 24 13,652 70.8 9.73 7.06 2.68 11.59 -1.85 1.49 8.24
1994 29 16,045 70.6 12.20 -1.54 13.74 -0.76 12.96 2.74 9.46
1995 27 23,221 73.3 44.54 34.11 10.43 35.67 8.87 38.84 5.70
1996 34 28,840 71.0 33.69 20.26 13.42 21.16 12.52 23.44 10.24
1997 35 37,908 71.2 36.87 31.01 5.86 30.33 6.54 33.13 3.74
1998 35 38,450 77.5 10.17 26.67 -16.49 22.29 -12.12 37.69 -27.51
1999 48 38,188 76.9 0.18 19.53 -19.35 25.26 -25.08 23.25 -23.07
2000 55 39,796 73.8 7.76 -10.14 17.90 -11.04 18.81 -8.17 15.93
2001 51 31,196 71.8 -10.33 -13.04 2.71 -11.27 0.94 -10.34 0.01
2002 45 31,295 68.7 -1.44 -23.37 21.93 -20.84 19.40 -20.41 18.97
2003 44 39,807 66.3 43.34 26.38 16.96 33.15 10.20 27.76 15.67
2004 42 43,284 62.3 13.32 8.99 4.33 13.00 0.32 8.86 4.46
2005 43 47,808 64.3 7.50 3.00 4.50 7.31 0.19 4.66 2.84
2006 50 62,785 57.9 20.21 13.62 6.59 16.23 3.99 12.17 8.04
Average 33.1 $17,527 73.1% 24.97% 10.32% 14.65% 14.05% 10.91% 16.41% 8.56%
σ 25.32 14.90 21.18 15.39 20.41 16.50 18.30
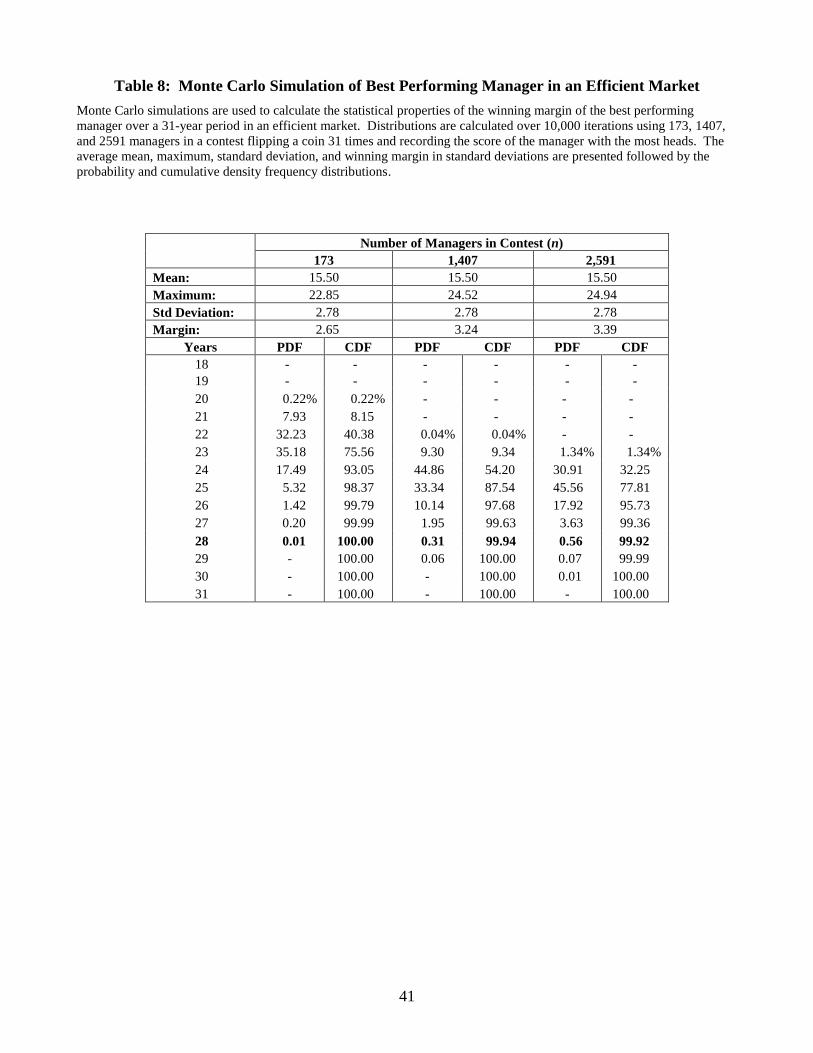
41
Table 8: Monte Carlo Simulation of Best Performing Manager in an Efficient Market
Monte Carlo simulations are used to calculate the statistical properties of the winning margin of the best performing
manager over a 31-year period in an efficient market. Distributions are calculated over 10,000 iterations using 173, 1407,
and 2591 managers in a contest flipping a coin 31 times and recording the score of the manager with the most heads. The
average mean, maximum, standard deviation, and winning margin in standard deviations are presented followed by the
probability and cumulative density frequency distributions.
Number of Managers in Contest (n)
173 1,407 2,591
Mean: 15.50 15.50 15.50
Maximum: 22.85 24.52 24.94
Std Deviation: 2.78 2.78 2.78
Margin: 2.65 3.24 3.39
Years PDF CDF PDF CDF PDF CDF
18 - - - - - -
19 - - - - - -
20 0.22% 0.22% - - - -
21 7.93 8.15 - - - -
22 32.23 40.38 0.04% 0.04% - -
23 35.18 75.56 9.30 9.34 1.34% 1.34%
24 17.49 93.05 44.86 54.20 30.91 32.25
25 5.32 98.37 33.34 87.54 45.56 77.81
26 1.42 99.79 10.14 97.68 17.92 95.73
27 0.20 99.99 1.95 99.63 3.63 99.36
28 0.01 100.00 0.31 99.94 0.56 99.92
29 - 100.00 0.06 100.00 0.07 99.99
30 - 100.00 - 100.00 0.01 100.00
31 - 100.00 - 100.00 - 100.00
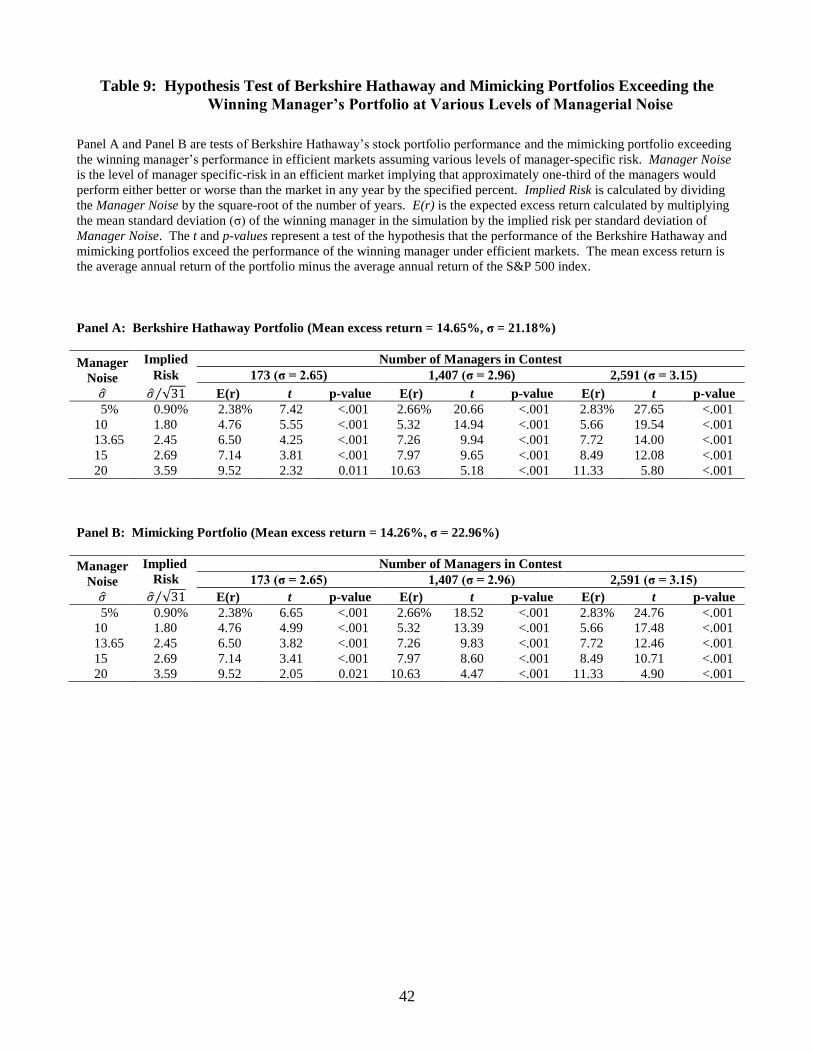
42
Table 9: Hypothesis Test of Berkshire Hathaway and Mimicking Portfolios Exceeding the
Winning Manager’s Portfolio at Various Levels of Managerial Noise
Panel A and Panel B are tests of Berkshire Hathaway’s stock portfolio performance and the mimicking portfolio exceeding
the winning manager’s performance in efficient markets assuming various levels of manager-specific risk. Manager Noise
is the level of manager specific-risk in an efficient market implying that approximately one-third of the managers would
perform either better or worse than the market in any year by the specified percent. Implied Risk is calculated by dividing
the Manager Noise by the square-root of the number of years. E(r) is the expected excess return calculated by multiplying
the mean standard deviation (σ) of the winning manager in the simulation by the implied risk per standard deviation of
Manager Noise. The t and p-values represent a test of the hypothesis that the performance of the Berkshire Hathaway and
mimicking portfolios exceed the performance of the winning manager under efficient markets. The mean excess return is
the average annual return of the portfolio minus the average annual return of the S&P 500 index.
Panel A: Berkshire Hathaway Portfolio (Mean excess return = 14.65%, σ = 21.18%)
Manager
Noise
𝜎
Implied Number of Managers in Contest
Risk 173 (σ = 2.65) 1,407 (σ = 2.96) 2,591 (σ = 3.15)
𝜎 31 E(r) t p-value E(r) t p-value E(r) t p-value
5% 0.90% 2.38% 7.42 <.001 2.66% 20.66 <.001 2.83% 27.65 <.001
10 1.80 4.76 5.55 <.001 5.32 14.94 <.001 5.66 19.54 <.001
13.65 2.45 6.50 4.25 <.001 7.26 9.94 <.001 7.72 14.00 <.001
15 2.69 7.14 3.81 <.001 7.97 9.65 <.001 8.49 12.08 <.001
20 3.59 9.52 2.32 0.011 10.63 5.18 <.001 11.33 5.80 <.001
Panel B: Mimicking Portfolio (Mean excess return = 14.26%, σ = 22.96%)
Manager
Noise
𝜎
Implied
Risk
𝜎 31
Number of Managers in Contest
173 (σ = 2.65) 1,407 (σ = 2.96) 2,591 (σ = 3.15)
E(r) t p-value E(r) t p-value E(r) t p-value
5% 0.90% 2.38% 6.65 <.001 2.66% 18.52 <.001 2.83% 24.76 <.001
10 1.80 4.76 4.99 <.001 5.32 13.39 <.001 5.66 17.48 <.001
13.65 2.45 6.50 3.82 <.001 7.26 9.83 <.001 7.72 12.46 <.001
15 2.69 7.14 3.41 <.001 7.97 8.60 <.001 8.49 10.71 <.001
20 3.59 9.52 2.05 0.021 10.63 4.47 <.001 11.33 4.90 <.001