imf country report no. 17/100 benin - compact with africa with africa... · imf country report no....
TRANSCRIPT

© 2017 International Monetary Fund
IMF Country Report No. 17/100
BENIN REQUEST FOR A THREE-YEAR ARRANGEMENT UNDER THE EXTENDED CREDIT FACILITY—PRESS RELEASE; STAFF REPORT; AND STATEMENT BY THE EXECUTIVE DIRECTOR FOR BENIN
In the context of the request for a three-year arrangement under the extended credit
facility, the following documents have been released and are included in this package:
A Press Release including a statement by the Chair of the Executive Board and
summarizing the views of the Executive Board as expressed during its April 7, 2017
consideration of the staff report on the request for a three-year arrangement under
the Extended Credit Facility.
The Staff Report prepared by a staff team of the IMF for the Executive Board’s consideration on April 7, 2017, following discussions that ended on February 22, 2017, with the officials on Benin’s program. Based on information available at the time of these discussions, the staff report was completed on March 23, 2017.
A Debt Sustainability Analysis prepared by the staffs of the IMF and the
International Development Association (IDA).
A Statement by the Executive Director for Benin.
The documents listed below have been or will be separately released:
Letter of Intent sent to the IMF by the authorities of Benin*
Memorandum of Economic and Financial Policies by the authorities of Benin*
Technical Memorandum of Understanding*
The IMF’s transparency policy allows for the deletion of market-sensitive information and
premature disclosure of the authorities’ policy intentions in published staff reports and
other documents.
Copies of this report are available to the public from
International Monetary Fund Publication Services
PO Box 92780 Washington, D.C. 20090
Telephone: (202) 623-7430 Fax: (202) 623-7201
E-mail: [email protected] Web: http://www.imf.org
Price: $18.00 per printed copy
International Monetary Fund
Washington, D.C.
April 2017
Press Release No. 17/124 FOR IMMEDIATE RELEASE April 7, 2017
IMF Executive Board Approves US$ 151.03 Million under the ECF Arrangement for Benin
The Executive Board of the International Monetary Fund (IMF) today approved a three-year arrangement under the Extended Credit Facility (ECF)1 for Benin for an amount equivalent to SDR111.42 million (about US$ 151.03 million, or 90 percent of Benin’s quota) to support the country’s economic and financial reform program. This new program aims to address Benin’s protracted balance of payments needs, and alleviate the impediments to inclusive growth, and poverty reduction by creating fiscal space for infrastructure investment and priority social spending. It is also aimed at helping to catalyze official and private financing and build resilience to future economic shocks. The Executive Board’s decision will enable an immediate disbursement of SDR 15.917 million (about US$ 21.58 million). The remaining amounts will be phased over the duration of the program, subject to semi-annual reviews. At the conclusion of the Board meeting, Mr. Tao Zhang, Deputy Managing Director and Acting Chair, made the following statement: “Despite negative spillovers from neighboring countries, Benin’s economy rebounded in 2016 and its outlook is favorable. Inflation remained subdued and the fiscal deficit narrowed, reflecting the authorities’ efforts to contain expenditure in the face of continued weak revenue performance. Nonetheless, reducing poverty and infrastructure gaps will take time. Against this backdrop, the authorities’ new economic program under the Extended Credit Facility focuses on raising living standards through a structural transformation of the economy while preserving macroeconomic stability. The program is expected to catalyze official and private financing and is consistent with achieving the West African Economic and Monetary Union convergence criteria by 2019.
“The authorities’ goal is to strengthen domestic revenue mobilization and improve the quality of spending to create fiscal space for infrastructure and priority social spending while 1 The ECF is a lending arrangement that provides sustained program engagement over the medium to long term in case of protracted balance of payments problems.
International Monetary Fund Washington, D.C. 20431 USA

2
preserving debt sustainability. To this end, implementing the reforms underway to modernize the Tax and Customs Administrations will be critical, including enhancing their efficiency and strengthening their coordination to ensure a durable improvement in revenue collection.
“The authorities’ measures to enhance financial intermediation—including operationalizing the credit bureau—and their efforts to promote financial inclusion will help sustain healthy credit expansion and support private sector-led economic growth. Implementing the new harmonized regional resolution framework and strengthening the supervisory body for microfinance institutions will be critical to strengthen financial sector supervision.
“Further improvements to the business environment are essential, particularly by removing bottlenecks to private-sector development and levelling the playing field for all investors. The authorities’ continued efforts to fight corruption and improve accountability in public administration and competitive procurement for government contracts will support private investment. In addition, improving the quality, coverage, and timeliness of economic statistics will help achieve better policy making.
Annex
Recent Economic Developments
Despite difficult domestic and external environments, growth in 2016 is estimated to have reached 4 percent on the back of strong agriculture production—after 2.1 percent growth in 2015. Inflation remained subdued at less than 1 percent in 2015 and turned negative in 2016. The fiscal deficit (including grants) narrowed to 6.2 percent of GDP in 2016 from 8 percent of GDP a year earlier, reflecting the authorities’ effort to contain expenditure in the face of continued weak revenue performance. For 2017 and the medium term, growth is projected to rebound, mainly thanks to agriculture and a significant increase in public investment. Inflation would remain below the West African Economic and Monetary Union’s (WAEMU) threshold of 3 percent and the fiscal deficit also converge to below the WEAMU’s criterion of 3 percent of GDP by 2019, after peaking at 7.9 percent in 2017. The external current account deficit would remain high, reflecting investment-related imports, but the overall balance of payment position would generate small surpluses on the financial account position. Program summary The new program aims to create fiscal space by stepping up domestic revenue mobilization and enhancing the efficiency of government spending; increasing gradually absorptive capacity to scale up investment; strengthening public debt management, and promoting private sector investment by strengthening institutions and improving the business environment while preserving debt sustainability. More importantly, it will aim to ensure that scaled-up public investment is consistent with debt sustainability. This is particularly important for Benin, as recent borrowing has significantly reduced available fiscal space, and potential risks from growth shortfalls, fiscal

3
slippages, and contingent liabilities from state-owned enterprises have materialized. The overarching macroeconomic policy goal is to limit the present value of non-financial public sector debt to no more than 50 percent of GDP. To this end, current indicative projections for the 2018 and 2019 budgets will be reassessed in future program reviews against debt developments as assessed through the debt sustainability analysis.
Background
Benin, which became a member of the IMF on July 10, 1963, has an IMF quota of SDR 123.80 million.
For additional information on the IMF and Benin, see: www.imf.org/benin

4
2014 2015 2016 2017 2018 2019 2020 2021 2022 Est.
National income GDP at current prices 12.9 8.7 6.1 2.2 3.7 7.6 8.2 8.4 8.8 9.2 8.3 GDP at constant prices 4.8 7.2 6.4 2.1 4.0 5.4 6.0 6.3 6.7 7.1 6.2 GDP deflator 7.7 1.4 -0.2 0.1 -0.3 2.1 2.0 2.0 2.0 2.0 2.0 Consumer price index (average) 6.7 1.0 -1.1 0.3 -0.8 2.0 2.1 2.0 2.0 2.0 2.0 Consumer price index (end of period) 6.8 -1.8 -0.8 2.3 -2.7 2.2 2.0 2.0 2.0 2.0 2.0
Central government finance Total revenue 19.3 10.1 -1.9 5.0 -9.0 13.2 12.4 13.4 12.6 12.3 10.7 Expenditure and net lending 8.1 16.7 -3.7 35.5 -12.6 24.4 -4.0 1.0 5.2 5.7 5.9
External sector Exports of goods and services -6.3 27.4 8.3 2.4 7.0 19.7 16.1 13.8 6.6 16.7 11.8 Imports of goods and services 9.0 22.0 16.4 -5.3 1.6 22.3 7.8 10.9 4.8 11.1 8.1 Terms of trade (minus = deterioration) -1.0 1.1 1.0 2.9 3.3 1.0 0.2 0.3 2.9 1.3 0.6 Nominal effective exchange rate (minus = depreciation) -5.0 3.6 2.6 -8.9 … … … … … … … Real effective exchange rate (minus = depreciation) -1.8 1.4 -1.1 -10.8 … … … … … … …
Money and credit Net domestic assets 4.7 10.6 8.4 3.8 7.3 9.6 … … … … … Domestic credit 4.4 16.5 0.4 2.3 7.3 9.6 … … … … … Net claims on central government -0.9 0.9 1.7 5.2 4.2 3.1 … … … … … Credit to the nongovernment sector 5.3 15.6 -1.2 -2.9 3.1 6.5 … … … … … Broad money (M2) 9.0 17.3 16.7 7.9 5.9 11.5 … … … … …
National accountsGross investment 22.6 27.8 28.6 26.0 24.6 29.3 27.4 26.3 26.9 27.6 24.2
Government investment 5.2 6.4 5.2 7.7 5.9 10.1 7.6 6.2 5.9 5.5 5.3Nongovernment investment 1 17.3 21.4 23.4 18.3 18.7 19.3 19.8 20.1 21.1 22.1 18.9
Gross domestic saving 10.6 15.1 13.4 13.1 12.8 15.5 15.0 14.2 15.6 17.0 14.5Government saving 3.1 3.6 2.0 -0.5 -0.7 0.8 1.7 2.6 3.5 4.2 4.9Non-government saving 7.5 11.5 11.4 13.6 13.5 14.7 13.3 11.6 12.1 12.8 9.6
Gross national saving 15.1 20.4 20.0 17.6 17.4 20.2 20.0 19.1 20.7 21.8 19.2 Consumption 89.4 84.9 86.6 86.9 87.2 84.5 85.0 85.8 84.4 83.0 85.5
Government consumption 12.3 12.2 12.5 15.0 12.6 11.3 11.0 10.7 10.6 10.6 10.6Non-government consumption 77.0 72.8 74.2 71.9 74.6 73.3 74.0 75.1 73.8 72.3 74.9
Central government financeTotal revenue 17.4 17.6 16.3 16.7 14.7 15.4 16.0 16.8 17.4 17.9 18.3Expenditure and net lending 19.6 21.0 19.1 25.3 21.4 24.7 21.9 20.4 19.7 19.1 18.7Primary balance 2 -1.7 -3.0 -2.4 -7.9 -5.5 -7.5 -4.1 -1.7 -0.6 0.3 1.0Basic primary balance 3 0.6 1.1 0.0 -4.2 -3.0 -3.1 -0.7 1.7 2.5 3.0 3.8Overall fiscal deficit (commitment basis, excl. grants) -2.2 -3.5 -2.8 -8.6 -6.7 -9.3 -5.9 -3.6 -2.4 -1.2 -0.4Overall fiscal deficit (commitment basis, incl. grants) -0.4 -2.6 -1.9 -8.0 -6.2 -7.9 -4.0 -1.9 -0.8 -0.2 0.6Debt service (percent of revenue) 6.7 6.1 6.0 8.2 12.5 15.4 14.8 14.8 13.1 11.5 10.2Total government debt 26.7 25.3 30.5 42.4 49.5 54.3 54.4 52.3 49.1 45.3 41.7
External sectorBalance of goods and services -12.0 -12.8 -15.2 -12.9 -11.8 -13.8 -12.4 -12.1 -11.4 -10.5 -9.8Current account balance (incl. grants) -7.4 -7.4 -8.6 -8.4 -7.2 -9.1 -7.4 -7.2 -6.2 -5.7 -5.0Current account balance (excl. grants) -8.2 -7.7 -8.8 -8.4 -7.2 -9.4 -8.1 -7.9 -6.8 -6.3 -5.5Overall balance of payments -2.6 -0.7 1.0 0.9 -1.6 -1.4 -0.8 -0.8 0.2 0.5 1.1Debt service-to-exports ratio 6.5 5.4 5.1 6.0 5.0 5.3 5.3 5.1 5.2 4.7 4.4
Nominal GDP (billions of CFA francs) 4,162 4,524 4,800 4,904 5,084 5,472 5,919 6,415 6,977 7,617 8,246Nominal GDP (millions of US$) 8,157.3 9,159.8 9,722.9 8,295.3 8,577.4 8,791.9 9,485.2 10,289.1 11,189.5 12,215.7 13,225.1 CFA francs per U.S. dollar (period average) 510.2 493.9 493.6 591.2 592.7 … … … … … …Total non-financial public sector debt (percent of GDP) 4 … 50.3 55.1 55.2 53.1 49.8 46.1 41.7p
Government guarantees (percent of GDP) … 0.8 0.8 0.8 0.8 0.8 0.8 0.0Suspended pre-financing (percent of GDP) 5 … 20.6Population (millions) 10.0 10.3 10.6 10.9 11.1 11.4 11.7 11.9 12.2 12.4 12.7Nominal GDP per capita (U.S. dollars) 812 888 918 764 771 772 813 863 919 982 1042
Sources: Beninese authorities; IMF staff estimates and projections.1 Including off-budget investment implemented by non-financial public enterprises.2 Total revenue minus current primary expenditure, capital expenditure, and net lending. 3 Total revenue minus current primary expenditure and capital expenditure financed by domestic resources.
4 Data include projected central government debt and new non-financial public sector borrowing for infrastructure from 2016 onward as well as the nominal amount of government guarantees
2012 2013
(Percent of GDP, unless otherwise indicated)
Program
Table 1. Benin: Selected Economic and Financial Indicators, 2012–22
Projections
(Annual percentage change)
(Change in percent of beginning-of-period broad money)

BENIN REQUEST FOR A THREE-YEAR ARRANGEMENT UNDER THE EXTENDED CREDIT FACILITY
EXECUTIVE SUMMARY Background: Significant fiscal slippages in late 2015 and early 2016, compounded by negative spillovers from Nigeria, led to a deterioration of the macroeconomic situation. The election in March 2016 of a new president who campaigned for a clear break with past policies offers an opportunity to implement sensible policies to promote inclusive and sustainable growth and reduce poverty. The authorities have launched an ambitious reform agenda and reaffirmed their commitment to preserving macroeconomic stability and medium-term debt sustainability.
The Proposed Program: The program focuses on: (i) creating fiscal space by stepping up domestic revenue mobilization and enhancing the efficiency of government spending; (ii) increasing gradually absorptive capacity to scale up investment; (iii) strengthening public debt management and pursuing prudent borrowing policy; and (iv) promoting private sector investment by strengthening institutions and improving the business environment. It supports the scaling up of public investment in a manner that does not threaten debt sustainability. From a regional perspective, Benin’s three-year Fund-supported program is consistent with achieving all the West African Economic and Monetary Union (WAEMU) convergence criteria by 2019, except for the revenue-to-GDP criterion of 20 percent. Moreover, policies under the program will contribute to building up regional reserves.
Request for an ECF Arrangement: The Beninese authorities requested a three-year arrangement under the ECF in an amount equivalent to SDR 111.42 million (90 percent of quota) in support of their medium-term economic reform program.
Staff views and risks: Staff supports the authorities’ request. The Letter of Intent (LOI) and Memorandum of Economic and Financial Policies (MEFP) set out appropriate policies to pursue the program’s objectives. Risks to the program include: (i) weak institutional capacity and resistance from vested interests that could delay the structural and institutional reforms and weaken the private sector response to rising public investment; (ii) unforeseen contingent liabilities associated with state-owned enterprises (SOEs); and (iii) further negative spillovers from Nigeria should the expected recovery in 2017 fall short. The design of the program takes into account these risks and reviews will address them should they materialize.
March 23, 2017

BENIN
2 INTERNATIONAL MONETARY FUND
Approved By Dominique Desruelle (AFR) and Peter Allum (SPR)
Discussions on the ECF-supported program were initiated in June 2016, resumed in December 2016, and concluded in February 2017. Ms. Dieterich led the June mission. The staff teams that visited Cotonou during November 30-December 12, 2016 and February 15–22, 2017 consisted of Messrs. Toé (head), Maino, Op de Beke and Ramirez (December mission), Ms. Diallo (February mission) (all AFR), and Ms. Salins (FAD). Both missions met with President Talon, Mr. Abdoulaye Bio Tchané, Minister of State of Planning and Development; Mr. Romuald Wadagni, Minister of Economy and Finance; Mr. Alain Komaclo, BCEAO National Director, and senior economic and financial officials. The missions were assisted by Mr. Barhoumi (Resident Representative), who has also participated in the discussions, and Mr. Joseph Houessou (Economist at the Res. Rep. Office). Staff of the World Bank and the African Development Bank participated in the meetings. The mission met with representatives of the diplomatic community and the private sector.
CONTENTS
Glossary ___________________________________________________________________________________________ 4
BACKGROUND: SETTING THE STAGE FOR A STRUCTURAL TRANSFORMATION OF THE
ECONOMY _________________________________________________________________________________________ 5
RECENT ECONOMIC AND FINANCIAL DEVELOPMENTS: COPPING WITH THE FALLOUT FROM
SHOCKS ___________________________________________________________________________________________ 6
MEDIUM-TERM CHALLENGES AND POLICIES: SCALING UP INVESTMENT WHILE PRESERVING
DEBT SUSTAINABILITY _________________________________________________________________________ 10
A. Proposed Three-Year Fund-Supported Program ______________________________________________ 10
B. Creating Fiscal Space for Increased Public Investment and Pro-Poor Spending _______________ 11
C. Rationalizing and enhancing the efficiency of public investment _____________________________ 12
D. Preserving Long-Term Debt Sustainability ____________________________________________________ 13
E. Promoting Inclusive Growth and Financial deepening _________________________________________ 16
F. Strengthening the Business Environment by Promoting Good Governance ___________________ 16
PROGRAM MODALITIES, RISKS, AND OTHER ISSUES ________________________________________ 17
A. Economic Program for 2017 ___________________________________________________________________ 17
B. Proposed Access and Capacity to Pay the Fund _______________________________________________ 18
C. Risks, Safeguards Assessment, and Financing Assurances _____________________________________ 18

BENIN
INTERNATIONAL MONETARY FUND 3
D. Statistical Issues and Capacity Development __________________________________________________ 19
STAFF APPRAISAL ______________________________________________________________________________ 19 BOXES 1. Spillovers from Nigeria __________________________________________________________________________ 8 2. Strengthening Public Investment Management (PIM) _________________________________________ 14 FIGURE 1. Recent Economic Developments, 2010–16 ______________________________________________________ 9 TABLES 1. Selected Economic and Financial Indicators, 2012–22 _________________________________________ 22 2. Consolidated Central Government Operations, 2012–22 ______________________________________ 23 3. Benin: Consolidated Central Government Operations, 2016–17 _______________________________ 24 4. Benin: Consolidated Central Government Operations, 2012–22 _______________________________ 25 5. Balance of Payments, 2012–22 ________________________________________________________________ 26 6. Monetary Survey, 2013–18 ____________________________________________________________________ 27 7. Proposed Schedule of Disbursements Under the ECF Arrangement __________________________ 28 8. Indicators of Capacity to Repay the Fund, 2017–31 ___________________________________________ 29 9. Summary of the Government External Borrowing Program for 2017-19 (US$ million) ________ 30 10. Risk Assessment Matrix ______________________________________________________________________ 31 11. Financial Soundness Indicators, 2011–16 _____________________________________________________ 32 ANNEXES I. Government Action Plan, 2016–21 _____________________________________________________________ 33 II. Managing Fiscal Costs and Risks from Public Private Partnerships ____________________________ 35 III. Capacity Development Strategy for FY 2017 __________________________________________________ 38 APPENDICES I. Letter of Intent _________________________________________________________________________________ 43 Attachment I. Memorandum of Economic and Financial Policies ______________________________ 45 Attachment II. Technical Memorandum of Understanding _____________________________________ 65

BENIN
INTERNATIONAL MONETARY FUND 4
Glossary AfDB African Development Bank AML/CFT Anti-Money Laundering and Combatting the Financing of Terrorism BCEAO Central Bank of West African States CAA Caisse autonome d’amortissement CET Common External Tariff CPIA Country Policy and Institutional Assessment DGBF General Directorate of Budget and Finance DGD General Directorate of Customs DGTCP General Directorate of the Treasury and Public Accounting DSA Debt Sustainability Analysis ECF Extended Credit Facility ECOWAS Economic Community of West African States E-GDDS Enhanced General Data Dissemination System FDI Foreign Direct Investment GAP Government Action Program (2016-21) GFSM Government Finance Statistics Manual IHPI Harmonized Industrial Production Index INSAE National Institute of Statistics and Economic Analysis MEFP Memorandum of Economic and Financial Policies MFIs Microfinance Institutions NDF Net Domestic Financing NFPS Non-Financial Public Sector PFM Public Financial Management PIM Public Investment Management PIMA Public Investment Management Assessment POSAF Plan d’orientation stratégique de l’administration fiscale PPP Private-Public Partnership SIGFiP Integrated Government Finance Management System SOE State-Owned Enterprises SSA Sub-Saharan Africa TMU Technical Memorandum of Understanding TOFE Tableau des Opérations Financières de l’Etat TSA Treasury Single Account UNDP United Nations Development Program WAEMU West African Economic and Monetary Union WEO World Economic Outlook

BENIN
INTERNATIONAL MONETARY FUND 5
BACKGROUND: SETTING THE STAGE FOR A STRUCTURAL TRANSFORMATION OF THE ECONOMY The newly-elected government committed to preserve medium-term macroeconomic stability and to implement an ambitious reform agenda to alleviate the structural impediments to sustainable and inclusive growth. Program discussions sought to balance the authorities’ development priorities with the need to preserve fiscal and debt sustainability. 1. A series of peaceful elections underscored Benin’s stable political environment, but public finances suffered. In a one-year span, Benin organized presidential, parliamentary, and local elections, all without serious irregularities. Patrice Talon won the run-off presidential elections in March 2016 with 65 percent of the vote. The elections were, however, marred by excessive spending—both on and off budget1—with costly financing from the regional debt market, pushing the overall fiscal deficit (excluding grants) from 2.8 percent of GDP in 2014 to 8.6 percent of GDP in 2015. The new government adopted a revised budget for 2016 cutting drastically current spending to restore fiscal sustainability. The revised budget was approved by parliament in July 2016.
2. With a strong private sector orientation, the new government aims to structurally transform Benin’s economy. Following the approval of the revised budget, President Talon emphasized his commitment to medium-term macroeconomic stability and to implementing a comprehensive reform agenda to bring about a structural transformation of the economy towards more value added in agriculture and tourism—major potential sources of growth and less dependence on Nigeria. In December 2016, a Government’s Action Program (GAP) for 2016–21 aimed at improving the living conditions of the population through a structural transformation of the economy was unveiled to the public (Annex I). A Law on Public-Private Partnerships (PPP) has also been adopted to pave the way for private sector participation in public investment.
3. Poverty remains pervasive. The solid macroeconomic performance recorded from 2012 to 2014 did not translate in a meaningful reduction in poverty. According to the National Institute of Statistics and Economic Analysis (INSAE), the proportion of the population living below the poverty line rose from 36.2 percent in 2011 to 40.1 percent in 2015 with rural poverty increasing the most (Text Figure 1). Poverty reduction therefore remains a major challenge, which if not addressed, would exacerbate existing inequality and intensify socio-political tensions.
1 During late 2015 and early 2016, the outgoing government approved 21 road projects costing 24 percent of GDP without budgetary allocations through non-concessional pre-financing schemes; the new government cancelled most of the contracts and has discontinued the use of this type of financing as a funding method for public investment (MEFP ¶20).
(continued)

BENIN
6 INTERNATIONAL MONETARY FUND
4. The government has requested an ECF-supported arrangement to support the broad objectives of the GAP.2 In this context, the government scaled back significantly the investment envelope initially envisaged under the GAP to ensure fiscal and debt sustainability the government (Annex I ¶¶5 and 6).
RECENT ECONOMIC AND FINANCIAL DEVELOPMENTS: COPPING WITH THE FALLOUT FROM SHOCKS 5. Economic developments in 2015–16 were affected by the expansionary fiscal stance and negative spillovers from Nigeria (Box 1). Economic growth in 2015 decelerated sharply to 2.1 percent due to negative spillovers from Nigeria and depressed agriculture output due to
2 Benin’s last ECF arrangement expired in June 2014 and was fully disbursed.
Text Figure 1. Benin: Non-inclusive growth
GDP accelerated in 2010-12... while real GDP per capita increased steadily since
1965.
However, poverty remains high in rural areas... …and a moderate improvement in human capital.
Source. Beninese authorities
‐4
-2
0
2
4
6
8
10
1990 1995 2000 2005 2010 2015
Real GDP Growth, 1990-2016(Percent)
Frontier market SSA SSA Benin240
260
280
300
320
340
360
380
400
1965 1975 1985 1995 2005 2015
Real GDP per Capita, 1965-2016(Thousands of CFAF)
36.2 31.439.740.1 35.8
43.6
0
10
20
30
40
50
Total Urban Rural
Development in Poverty Rate, 2011-2015 (percent of population)
2011 2015
0.20
0.30
0.40
0.50
0.60
1980 1990 2000 2005 2008 2010 2011 2012 2013 2014
Benin Sub-Saharan Africa SSA Frontier Markets
Human Development Index, 1980-2014

BENIN
INTERNATIONAL MONETARY FUND 7
unfavorable weather, but rebounded to 4 percent estimated for 2016 as improved weather led to bumper crops. Inflation remained subdued in 2015 and turned negative in 2016. Nigeria’s decision to cut fuel subsidies was offset by the devaluation of the naira, resulting in lower domestic fuel prices, a major component of the consumer price index. The fiscal deficit more than tripled, reflecting a significant increase in current transfers, especially subsidies to the cotton and electricity sectors, as well as a higher wage bill, while tax revenues weakened. The drop in the tax performance from the average of 17 percent of GDP over 2011–14 stemmed essentially from negative spillovers from Nigeria and a general weakening of the efficiency of the tax and customs administrations. The deficit fell to 6.7 percent in 2016 owing to the authorities’ efforts to contain expenditure in line with the revised budget in the face of a larger shortfall in government revenue. The external current account deficit remained broadly unchanged in 2015 despite the expansionary fiscal stance, owing to an improvement in the trade balance that was driven by exports. It declined in 2016 by 1.2 percentage points of GDP due to continued strong export performance (Table 1 and Figure 1).
Text Table 1. Benin: Composition of Fiscal Revenues, 2011–16 (percent of GDP)
2011-14* 2015 2016
Avg. Act.
Tax revenues 14.6 14.5 12.6
Tax on international trade 7.7 7.0 5.7
Direct and indirect taxes 7.0 7.5 6.9
Non tax revenues 2.4 2.2 2.1
Total Revenues 17.0 16.7 14.7
* Average.
Sources: Beninese authorities and IMF staff calculations.
Act.

BENIN
8 INTERNATIONAL MONETARY FUND
Box 1. Spillovers from Nigeria
Benin’s economy is deeply interconnected with Nigeria. Staff estimates that a 1 percentage point reduction in Nigeria’s GDP growth rate is associated with 0.3 percentage point reduction in Benin’s growth rate. Spillovers from Nigeria affect Benin through the following channels:
Informal trade. Nigeria has import bans and high tariffs on a wide range of products, leading to arbitrage trade. The World Bank (2015) estimated that about 20 percent of Benin’s GDP is related to this informal trade. Nigerian domestic demand thus significantly affects Benin’s growth. The Common External Tariff (CET) of the Economic Community of West African States (ECOWAS) is expected to reduce tariffs in Nigeria gradually,1 likely leading to a decline in informal trade over time.
Fuel prices and subsidies. Nigeria’s subsidized fuel prices have attracted informal fuel exports to Benin, where 85 percent of the gasoline is estimated to be from Nigeria. Nigeria’s temporary cut of fuel subsidies in January 2012 triggered an immediate fuel price spike in Benin. As trading smuggled fuel is a significant source of income for poor households, a reduction in fuel subsidies in Nigeria, as currently under consideration, would negatively affect traders in Benin.
Fiscal revenue. Benin’s revenue collection from informal trade is estimated at 2 percent of GDP, equivalent to 14 percent of total tax revenues.2 In addition to customs duties and processing fees, VAT is levied on these imports, which have to be declared for domestic consumption, because the Beninese authorities refuse to process imports prohibited by Nigeria as transit goods.
Remittances. Nigeria is an important destination for emigrants from Benin and an important source of remittances. According to the World Bank, the remittances from Nigeria accounted for 44.7 percent of all remittances in 2015.
Financial sector. The main shareholders of two banks in Benin are Nigerian. These banks are sufficiently capitalized and have some buffer against possible shocks to Nigeria’s banking system. A third bank with Nigerian ownership is under receivership. These three banks hold about 15 percent of total deposits and a similar amount of loans. The portfolio of banks in Benin is highly concentrated on commerce, which, in turn, depends on Nigeria’s performance.
1 The CET has a provision for temporary Import Adjustment Tax to allow non-WAEMU countries to adjust to the
CET during the 5-year transitional period ending in 2019.
2 Geourjon, Chambas, and Laporte, 2008, Benin: Modernization of the Fiscal System, IMF TA Report.
0
100
200
300
400
500
600
700
800
Jun-11 Dec-11 Jun-12 Dec-12 Jun-13 Dec-13 Jun-14 Dec-14 Jun-15
Informal Fuel Price in Benin and Fuel Price in Nigeria (CFAF per liter)
Informal fuel price in Benin Fuel price in Nigeria
Increase due to fuelsubsidy cut in Nigeria in January 2012.
-2
0
2
4
6
8
10
2008-12 Avg. 2013 2014 2015 2016 2017
Negative spillovers from Nigerian slowdown
Benin: Tax on international trade (percent of GDP)
Benin: Real growth (percent)
Nigeria: Real growth (percent)
Proj.

BENIN
INTERNATIONAL MONETARY FUND 9
Figure 1. Benin: Recent Economic Developments, 2010–16
Growth decelerated in 2015, pulled down by agriculture and a slowdown in services…
...while inflation remained subdued.
Election related increase in the fiscal deficit... ...led to a surge in public debt.
A large structural trade gap, exacerbated by spillovers from Nigeria...
...contributed to persistent high current account deficits.
-4
-2
0
2
4
6
8
2010 2011 2012 2013 2014 2015 2016
Contribution to GDP Growth (Percent)
Primary Secondary Teritary GDP -8-6-4-202468
10
Jan-
13
May
-13
Sep-
13
Jan-
14
May
-14
Sep-
14
Jan-
15
May
-15
Sep-
15
Jan-
16
May
-16
Sep-
16
Inflation (CPI, annual percentage change)
Overall
Food
Non-food
-10.0-9.0-8.0-7.0-6.0-5.0-4.0-3.0-2.0-1.00.0
2010 2011 2012 2013 2014 2015 2016
Overall Fiscal Balance(In percent of GDP, excluding grants)
0
10
20
30
40
50
60
2010 2011 2012 2013 2014 2015 2016
Public Sector Debt (In percent of GDP)
0
5
10
15
20
25
2010 2011 2012 2013 2014 2015 2016
International Trade (Goods, in percent of GDP)
Exports Improts-9.0
-8.5
-8.0
-7.5
-7.0
-6.5
2010 2011 2012 2013 2014 2015 2016
Current Account Balance (In percent of GDP)
BENIN
10 INTERNATIONAL MONETARY FUND
MEDIUM-TERM CHALLENGES AND POLICIES: SCALING UP INVESTMENT WHILE PRESERVING DEBT SUSTAINABILITY The priorities of the economic program for 2017–19 reflect the strategic directions of the GAP by supporting a scaled up public investment in a manner that does not threaten debt sustainability. The objectives are to create fiscal space, promote inclusive growth, preserve debt sustainability, and accelerate structural and institutional reforms that support the authorities’ transformative agenda.
A. Proposed Three-Year Fund-Supported Program
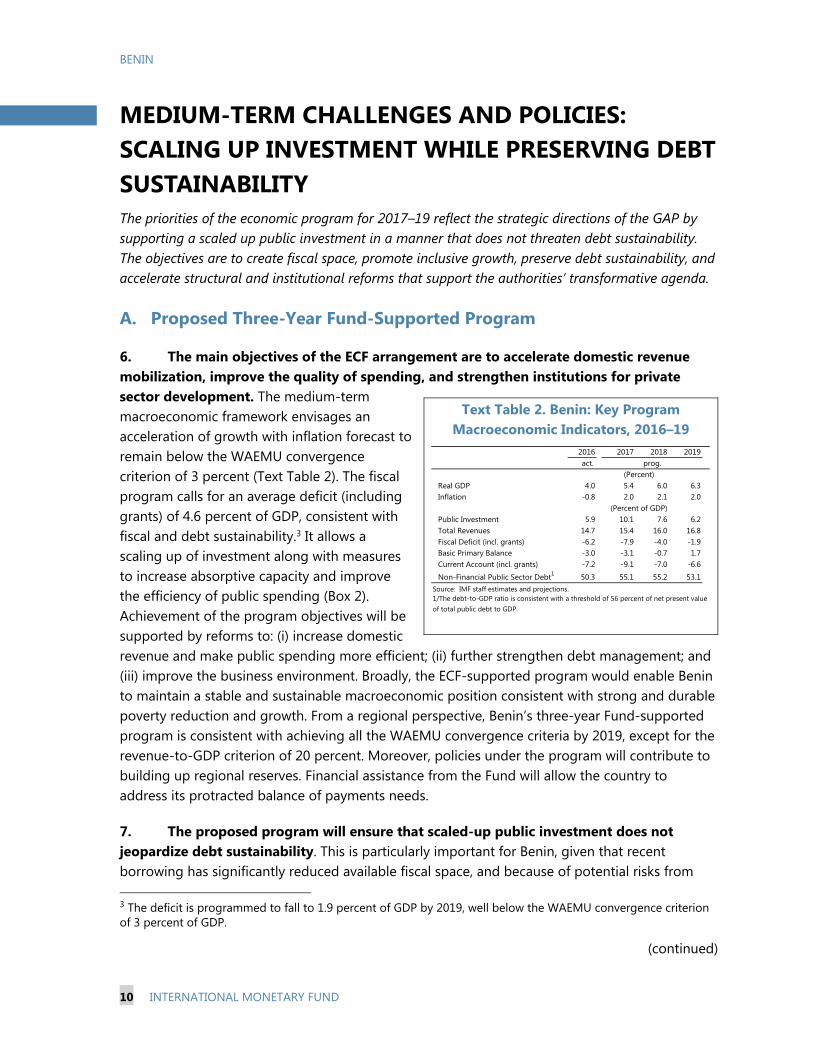
6. The main objectives of the ECF arrangement are to accelerate domestic revenue mobilization, improve the quality of spending, and strengthen institutions for private sector development. The medium-term macroeconomic framework envisages an acceleration of growth with inflation forecast to remain below the WAEMU convergence criterion of 3 percent (Text Table 2). The fiscal program calls for an average deficit (including grants) of 4.6 percent of GDP, consistent with fiscal and debt sustainability.3 It allows a scaling up of investment along with measures to increase absorptive capacity and improve the efficiency of public spending (Box 2). Achievement of the program objectives will be supported by reforms to: (i) increase domestic revenue and make public spending more efficient; (ii) further strengthen debt management; and (iii) improve the business environment. Broadly, the ECF-supported program would enable Benin to maintain a stable and sustainable macroeconomic position consistent with strong and durable poverty reduction and growth. From a regional perspective, Benin’s three-year Fund-supported program is consistent with achieving all the WAEMU convergence criteria by 2019, except for the revenue-to-GDP criterion of 20 percent. Moreover, policies under the program will contribute to building up regional reserves. Financial assistance from the Fund will allow the country to address its protracted balance of payments needs.
7. The proposed program will ensure that scaled-up public investment does not jeopardize debt sustainability. This is particularly important for Benin, given that recent borrowing has significantly reduced available fiscal space, and because of potential risks from 3 The deficit is programmed to fall to 1.9 percent of GDP by 2019, well below the WAEMU convergence criterion of 3 percent of GDP.
(continued)
Text Table 2. Benin: Key Program Macroeconomic Indicators, 2016–19
2016 2017 2018 2019 act.
Real GDP 4.0 5.4 6.0 6.3Inflation -0.8 2.0 2.1 2.0
Public Investment 5.9 10.1 7.6 6.2Total Revenues 14.7 15.4 16.0 16.8Fiscal Deficit (incl. grants) -6.2 -7.9 -4.0 -1.9Basic Primary Balance -3.0 -3.1 -0.7 1.7Current Account (incl. grants) -7.2 -9.1 -7.0 -6.6
Non-Financial Public Sector Debt1 50.3 55.1 55.2 53.1Source: IMF staff estimates and projections.1/The debt-to-GDP ratio is consistent with a threshold of 56 percent of net present value of total public debt to GDP.
prog.(Percent)
(Percent of GDP)
BENIN
INTERNATIONAL MONETARY FUND 11
growth shortfalls, fiscal slippages, and contingent liabilities from state-owned enterprises (SOEs) and PPPs. This is built on an overarching macroeconomic policy goal of limiting the present value (PV) of non-financial public sector (NFPS) debt to no more than 50 percent of GDP.4 To make this ceiling operational, current indicative projections for the 2018 and 2019 budgets will be reassessed in future program reviews against debt developments as assessed through the debt sustainability analysis (DSA). If debt dynamics were to deteriorate relative to the initial program projections, borrowing plans (and associated fiscal deficits) would be reconsidered. Similarly, indicative capital spending plans for 2018 and 2019 are conditional on achieving strengthened revenue mobilization and savings on primary recurrent spending. Should these not materialize or the programmed borrowing plan from the regional market fall short, capital spending will be reduced accordingly.
B. Creating Fiscal Space for Increased Public Investment and Pro-Poor Spending
Boosting domestic revenues
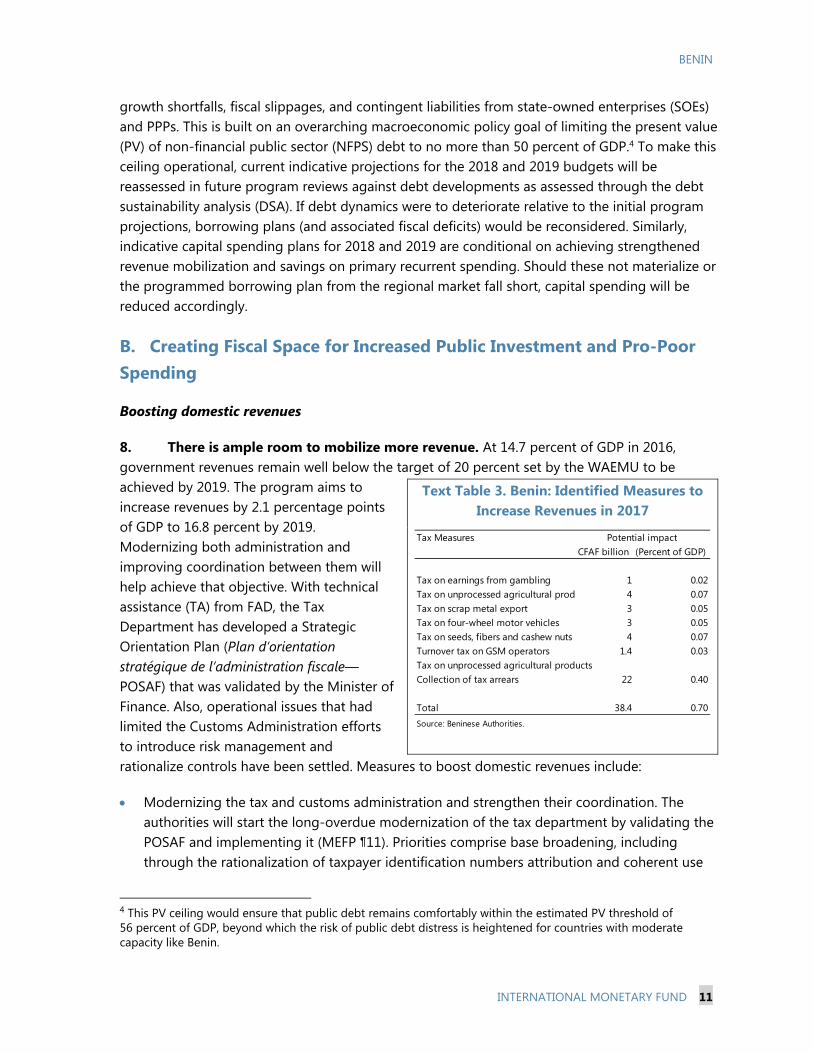
8. There is ample room to mobilize more revenue. At 14.7 percent of GDP in 2016, government revenues remain well below the target of 20 percent set by the WAEMU to be achieved by 2019. The program aims to increase revenues by 2.1 percentage points of GDP to 16.8 percent by 2019. Modernizing both administration and improving coordination between them will help achieve that objective. With technical assistance (TA) from FAD, the Tax Department has developed a Strategic Orientation Plan (Plan d’orientation stratégique de l’administration fiscale—POSAF) that was validated by the Minister of Finance. Also, operational issues that had limited the Customs Administration efforts to introduce risk management and rationalize controls have been settled. Measures to boost domestic revenues include:
Modernizing the tax and customs administration and strengthen their coordination. The authorities will start the long-overdue modernization of the tax department by validating the POSAF and implementing it (MEFP ¶11). Priorities comprise base broadening, including through the rationalization of taxpayer identification numbers attribution and coherent use
4 This PV ceiling would ensure that public debt remains comfortably within the estimated PV threshold of 56 percent of GDP, beyond which the risk of public debt distress is heightened for countries with moderate capacity like Benin.
Text Table 3. Benin: Identified Measures to Increase Revenues in 2017
Tax MeasuresCFAF billion (Percent of GDP)
Tax on earnings from gambling 1 0.02Tax on unprocessed agricultural prod 4 0.07Tax on scrap metal export 3 0.05Tax on four-wheel motor vehicles 3 0.05Tax on seeds, fibers and cashew nuts 4 0.07Turnover tax on GSM operators 1.4 0.03Tax on unprocessed agricultural productsCollection of tax arrears 22 0.40
Total 38.4 0.70Source: Beninese Authorities.
Potential impact

BENIN
12 INTERNATIONAL MONETARY FUND
with the Customs Administration, and institutional strengthening through better segmentation of all tax payer units and strengthening of the large-tax-payer unit.
Accelerating tax policy reforms. The authorities will review and quantify tax revenue losses from exemptions, and agree to a time-bound strategy for minimizing tax expenditures (MEFP ¶48). They will also simplify the professional tax on micro and small enterprises to facilitate its administration (MEFP ¶47).
Improving revenue administration. Consistent with the POSAF, revenue administration measures aim at: (i) modernizing the tax administration through its human resources, structures, processes and technology; (ii) improving tax payer services; and (iii) enhancing enforcement of the tax law. Efforts will also be made to recover tax arrears estimated at CFAF 107 billion at End-December 2016 (MEFP ¶46).
Strengthening IT. Moreover, efforts have recently been undertaken to improve the management of taxpayer database and share it with the Custom Administration. This step is critical to improve the coordination between the different administrations.
These measures, included in the 2017 budget approved by Parliament, are expected to yield 0.7 percent of GDP in additional revenues (Text Table 3). C. Rationalizing and enhancing the efficiency of public investment
9. The government intends to address noted inefficiency of public spending. Recent IMF and World Bank reviews and the 2014 Public Expenditure and Financial Accountability (PEFA) assessment identified weaknesses in the areas of multi-year budgeting, treasury management, and monitoring of project execution.5 Also, the new PPP legal framework has shortcomings6 and the capacity to manage PPPs is yet to be fully developed. Measures fleshed out in the MEFP to enhance the efficiency of public spending relate to:
Strengthening the selection of public investment projects, enhancing transparency and stepping up audit. The authorities will (i) strengthen project selection through the creation of a Unit responsible for the implementation of the flagship projects; and (ii) implement procurement reform, including a system of transparent reporting. They also intend to (i) improve the monitoring and control of spending commitments to prevent accumulation of domestic payment arrears (MEFP ¶16); (ii) enhance cash forecasting and management, and
5 The document describing the World Bank’s Public Investment Management and Governance Support Project, June 2, 2016, notes that delays in execution across the whole portfolio drive up investment costs by 80 percent. 6 These are notably the (i) the prevalence of spontaneous offers, including the right of first refusal; (ii) the absence of an independent assessment of fiscal risks by the Ministry of Finance; and (iii) the absence of adequate selection criteria; and (iv) the absence of publication requirements.

BENIN
INTERNATIONAL MONETARY FUND 13
introduce a Treasury Single Account; (iii) broaden the scope of budget reporting and increase its frequency in line with PEFA requirements; and (iv) develop multi-year project planning.
Ensuring value for money. Selective value-for-money audits will be conducted, if necessary with assistance from external audit companies. To bolster the recommended public investment scaling up, the authorities have front-loaded key supportive structural reforms, working closely with the World Bank in the context of a Public Investment Management (PIM) project (Box 2). A Fiscal Reform and Growth Credit under preparation will also help. Following the decentralization of the procurement system in 2014, the capacity of sectoral ministries to carry out their responsibilities will be developed. Enhancing transparency throughout the contracting process is also being given a priority, and to that end the authorities intend to adopt the Open Contracting Data Standard sponsored by the World Bank.
Monitoring closely possible contingent liabilities from PPPs. The authorities will evaluate their PPP projects using the IMF-World Bank framework, identify the risks and integrate them into their debt strategy. The authorities will address the shortcomings of the PPP framework, building on Fund and World Bank advice, including developing an institutional capacity to control fiscal risks associated with PPPs in the Ministry of Finance.7
D. Preserving Long-Term Debt Sustainability
10. Preserving public debt sustainability is a key pillar of the program. The 2015 DSA rated Benin’s risk of external debt distress as low. Given the need to accommodate a meaningful investment scaling up to address the infrastructure gap, the upward revisions to public debt will push the external debt distress risks to moderate. To safeguard against a further deterioration of the rating, the program aims to limit the PV of NFPS debt to no more than 50 percent of GDP, establishing a cushion relative to the 56 percent of GDP PV threshold beyond which the risk of total public debt distress for Benin is elevated.
7 Annex II discusses fiscal risks from PPPs.
Text Figure 2. Benin: Spending Efficiency, 2015
0
0.5
1
1.5
2
2.5
3
3.5
BudgetCredibilty
Tranparency Policy basedBudgeting
BudgetExecution
Reporting ExternalAudit
PEFA Scores1
Benin SSA (excl. Benin) SSA LIC (excl. Benin)
1 . Calculated by simple averages using latest available data.

BENIN
14 INTERNATIONAL MONETARY FUND
Box 2. Benin: Strengthening Public Investment Management (PIM)
The Government is aware that the success of its scaling up of public investment depends crucially on accompanying measures to strengthen the systems and procedures for identifying, evaluating, implementing and monitoring projects. Therefore, the GAP (Annex I) includes a new mechanism for implementing and monitoring the flagship projects (projets phares), which accounts for two thirds of the GAP. That mechanism consists of two committees: Project Monitoring Committee under the supervision of the President and a Monitoring and Evaluation Committee chaired by the Minister of Planning. There are also autonomous agencies for sectoral ministries all under the supervision of a Unit at the presidency. Most of the 45 flagship projects are aimed at developing: (i) agriculture (cashew, pineapples, corn and rice); (ii) tourism (building a tourist pole around Voodoo art); (iii) infrastructure (extension of the port of Cotonou, construction of a new international airport, extension of the road network); and (iv) energy (thermal power stations and renewable energies).
The Government also solicited assistance from the World Bank with its investment scaling up, in the form of a Public Investment and Governance Support Project, approved in June 2016. This US$30 million project aims to build capacity in the following PIM areas:
• Efficiency and effectiveness in PIM—covering strategic guidance, appraisal, multi-year budgeting, project selection, implementation, and evaluation and audit, and PPPs.
• Strengthening good governance and accountability—covering support to the justice sector, the Anticorruption Authority, and improved service delivery.
• Results-based financing in the electricity, water and justice sectors—covering planning, budgeting, procurement and monitoring and evaluation in six major projects.
In the context of the ECF arrangement, priority will be placed on areas of synergy with past Fund TA. These include speeding up the spending process (through speeding up procurement and removing treasury bottlenecks), more use of multi-year contracts, better intra-year monitoring and end-of-year financial accountability, and program budgeting.

BENIN
INTERNATIONAL MONETARY FUND 15
Adequate measures are being put in place to strengthen debt management and monitor closely SOEs’ borrowing and contingent liabilities. In nominal terms, NFPS debt is projected to peak at 55.2 percent of GDP in 2018, relative to the WAEMU convergence criterion of 70 percent of GDP. Given the high share of domestic debt, including regional borrowing with shorter maturities and higher interest rates, efforts will be made to rely mostly on concessional external borrowing (Text Table 4 and Text Figure 3). An updated DSA consistent with the proposed ECF arrangement is presented in a companion document.8
Specific measures to preserve public debt sustainability over the medium to long term include:
Strengthening debt management. The government will pursue the reform of the institutional and legal framework of debt management initiated in 2015 (MEFP ¶¶17 and 18). In particular, the Treasury will be reorganized to complement the recent reorganization of the Debt Directorate, Caisse autonome d’amortissement (CAA). Also, the authorities will: (i) prepare and publish a medium-term debt strategy, including a specific mechanism to assess and monitor government guarantees; (ii) improve the management and the monitoring of the external debt incurred, or guaranteed by the government; and (iii) publish detailed debt report.
Rebalancing the composition of total public debt. Given the roll-over and interest rate risks associated with the domestic debt, the authorities will pursue a more balanced mix between external concessional and domestic debt and reliance on longer maturity obligations when tapping the regional financial market.
Monitoring the debt of SOEs and other contingent liabilities. The authorities will collect and analyze the financial statements and questionnaire responses of all 22 SOEs and 140 autonomous agencies in order to assess their indebtedness and identify and contain contingent liabilities to the budget.
8 The assessment includes an analysis of debt sustainability resulting from lower economic growth (2 percentage points lower real GDP growth from 2017 to 2021). For total public debt, the baseline remains (slightly) below the threshold, but the most extreme shock breaches the threshold for three years.
Text Figure 3. Benin: Composition of Public Debt, 2013–16
Text Table 4. Benin: Selected Public Debt Indicators, 2017–19
2015 2016 2017
Proj.
Central Government Debt 3.5 3.8 4.6
External 1.0 1.0 1.6
Domestic 6.3 6.3 6.9
Central Government Debt 8.9 8.9 8.9
External 14.5 14.5 14.5
Domestic 3.3 3.2 3.2
*weighted average.
Sources: Beninese authorities and IMF staff calculations.
(Average maturity, years)*
(Interest rate, percent)
Act.

BENIN
16 INTERNATIONAL MONETARY FUND
E. Promoting Inclusive Growth and Financial deepening
11. Infrastructure bottlenecks and a weak business environment are the main constraints to higher growth.9 The lack of property titles, asymmetric information, and the weak judicial system are key barriers to more efficient financial intermediation. While financial soundness indicators do not present immediate stability concerns, financial institutions are reluctant to lend, unless large guarantees are provided (Table 11). An insufficiently time-bound bank resolution regime leads to protracted resolutions during which banks continue to make losses. The fast growth in microfinance institutions (MFIs)—10 percent of assets, 2.1 million clients—is encouraging for inclusive growth but calls for enhanced supervision. All institutions that cannot be regularized will be closed so as to protect the popular trust in the sector. To address the impediments identified, the authorities will:
Implement measures aimed at financial deepening. Following adoption of the legislation for a credit bureau the authorities will establish a credit bureau and make it operational to facilitate bank access to credit information and, consequently, reduce lending risks. In addition, the authorities will strengthen the judicial system’s capacity by extending training on commercial regulation and creating commercial courts and arbitration mechanisms. They will strengthen the business environment by: (i) advancing reforms to reduce red tape; (ii) improving tax and customs administration; and (iii) facilitating access to financing.
Strengthen bank resolution. Adoption of a new regional framework for banking resolution offers a roadmap for resolving banking crises in the WAEMU. In this context, the authorities will accelerate the resolution of a problem bank that has been under receivership for three years.
Step up supervision and regulation of MFIs. The authorities will strengthen the supervisory body for microfinance by increasing the number of supervisors, especially in rural areas, necessary for timely supervision and enforcement of regulations.
F. Strengthening the Business Environment by Promoting Good Governance
12. Improving the business environment is essential to promote a dynamic and vibrant private sector. The government is counting on both domestic and foreign private investment to finance the GAP, including through PPPs. Despite some progress made, a weak business environment continues to be a deterrent for domestic and international investors. In particular, Benin continues to face major corruption challenges with Transparency International-ranking 95 out of 175 countries in its 2016 Corruption Perceptions Index published in early February 2017.
9 See “Make Investment Scaling-Up Work in Benin: A Macro-Fiscal Analysis”: African Departmental Paper Series, 2016.
(continued)

BENIN
INTERNATIONAL MONETARY FUND 17
This follows a ranking of 83th and 80th in 2015 and 2014, respectively. The new government has, therefore, made improving accountability in public administration one of its priorities and will promote competitive procurement and effective audits to steer government contracts to the most cost effective enterprises (MEFP ¶¶ 39–40).10 Specific measures include:
Adopting a strategy for the full computerization of government transactions so as to minimize the room for discretion. Also, adopt implementing decrees for the Commercial Court, including the assignment of judges and clerks and the allocation of an operating budget.
Pursuing a competitive procurement system, by reducing direct tendering and practicing best practice disclosure on procurement outcomes, with TA from the World Bank.
Reforming audit institutions to strengthen internal and external controls. The objective is to create a truly independent and transparent audit system, including a Court of Auditors (Court des comptes).
Strengthening the anti-corruption and anti-money laundering and combatting the financing of terrorism (AML/CFT) regimes. The authorities will bolster the framework for combating corruption and improve transparency by strengthening the asset declaration regime and preparing and implementing an anti-corruption action plan. Also, the authorities will strengthen and effectively implement the AML/CFT framework to assist anti-corruption efforts, both in the public and private sector, focusing, in particular, on effective implementation of preventive measures, including for politically-exposed persons, improvement of suspicion transactions reporting and enhancement of national and international cooperation.
13. Benin’s Doing Business indicators have moderately improved in 2016. According to the recent Doing Business Report, Benin improved its ranking by 3 places moving from 158th in 2015 to 155th ranking in 2016. These improvements reflect progress on starting business as well as on resolving insolvency. However, more needs to be done to improve access to electricity, pay taxes, and obtain credit.
PROGRAM MODALITIES, RISKS, AND OTHER ISSUES A. Economic Program for 2017
14. Real GDP growth in 2017 would benefit from the expected improvement in the global economy, an expansion of agricultural output, and major capital spending. Inflation is forecast to turn positive and remain below the WAEMU convergence threshold of 3 percent. The fiscal program targets an increase in government revenue to 15.4 percent of GDP, while total 10 On March 3, 2017, the Supreme Court has nominated the new members of the National Anti-Corruption Authority.
BENIN
18 INTERNATIONAL MONETARY FUND
expenditure is expected to grow by 3.3 percentage points of GDP to 24.7 percent of GDP, driven essentially by capital spending while current primary expenditure would decline by 1.2 percentage points of GDP. However, priority social spending will be protected (MEFP ¶8). As a result, the overall deficit (including grants) would widen to 7.9 percent of GDP in 2017 and financed mostly with concessional borrowing. The current account deficit (including grants) is projected to reach 9.1 percent of GDP in 2017, reflecting larger investment-related imports and an increase in domestic demand.
B. Proposed Access and Capacity to Pay the Fund
15. Proposed access, phasing, and program monitoring. An access of 90 percent of quota (SDR 111.42 million) is proposed, which is enough to cover one fourth of the financing gap. The remaining financing is expected from other donors, mainly multilateral institutions and the EU. The program will be monitored semi-annually based on quantitative performance criteria and indicative targets (MEFP, Table 1). All five prior actions targeting urgent reforms in revenue administration (POSAF and integration of the Customs and Tax Administration IT systems), public investment, banking resolution framework, and agreement on a 2017 budget consistent with the program have been implemented (MEFP, Table 2). The PCs and ITs are defined in the Technical Memorandum of Understanding.
16. Capacity to repay the Fund is adequate. Credit outstanding from the Fund once all disbursements under the ECF arrangement are made will be 109.7 percent of quota (SDR 135.82 million). Benin’s capacity to repay the Fund remains sound (Table 8) as confirmed by its moderate risk of debt distress and favorable economic growth outlook. C. Risks, Safeguards Assessment, and Financing Assurances
17. Risks. Risks to the program include: (i) weak institutional capacity and or resistence from vested interests that could delay the structural and institutional reforms, undermine the quality of investment, and weaken the private sector response to rising public investment; (ii) unforeseen contingent liabilities associated with SOEs and other government contracts; and (iii) a further deepening of the recession in Nigeria. The design of the program takes into account these risks and subsequent reviews would address them should they materialize.
18. Safeguards assessment. The 2013 assessment of the WAEMU regional central bank, BCEAO, found a continuing strong control environment. All recommendations from the assessment have been implemented. These include strengthening the external audit arrangements by appointment of an international firm with ISA experience for the audits of FY 2015–17, reinforcing the capacity of the audit committee with external expertise to oversee the audit and financial reporting processes, and adoption of IFRS starting with the financial year 2015.
19. Financing assurances are adequate for the duration of the program. Financing needs are expected to be met by a combination of donor and Fund support. The projected financing

BENIN
INTERNATIONAL MONETARY FUND 19
gap through April 2018 (about 1.4 percent of GDP) will be covered by budget support from the World Bank (about CFAF 22.6 billion), by the EU (about CFAF 15.8 billion), by the African Development Bank (about CFAF 16.4 billion), and by the proposed disbursements from the Fund under three-year ECF arrangement. There are good prospects that there will be adequate financing for the remaining program period (Table 9).
D. Statistical Issues and Capacity Development
20. Improving quality and timeliness of economic data is essential. Despite some recent improvements, there are significant weaknesses in the compilation and dissemination of economic statistics. With the help of IMF technical assistance, the authorities have made good progress in improving national account statistics, which enabled Benin to participate in the Enhanced General Data Dissemination System (e-GDDS).11 They have recently completed and published the final national accounts for 2013 and 2014. There are weaknesses in public finance and developing a framework to implement the Government Financial Statistics Manual (GFSM) 2001/2014 would provide a good roadmap to improve fiscal data.
21. Capacity development and strong coordination of TA from donors will be essential for the smooth implementation of the program. With the help of IMF technical assistance, the authorities will continue to improve national account statistics; consolidate public financial management by strengthening budget execution and control; make further progress on tax administration by minimizing tax expenditures and simplify taxes; modernize customs administration by improving management and governance, and reinforce the dissemination of statistics in the context of the e-GDDS (Annex III).
STAFF APPRAISAL 22. Benin is at a crossroad. The new government’s commitment to forge ahead with comprehensive structural and institutional reforms to underpin implementation of the GAP puts Benin in a unique position to bring about a much-needed structural transformation of the economy. Adhering to policies that preserve macroeconomic stability and medium-term fiscal and public debt sustainability is essential in light of the important public investment program.
23. The medium-term economic outlook remains favorable, but is vulnerable to negative spillovers from Nigeria. The recovery in economic activity projected for 2017 and its acceleration starting in 2018 rests essentially on the scaling up of public investment and the positive response from agriculture and tourism, two major sources of growth. While the economy was relatively resilient, the public finances bore the brunt of the negative spillovers from Nigeria, particularly in 2016. The prompt action taken to rein in expenditure helped to contain the fiscal deficit, but going forward efforts should be made to reduce the vulnerability of public finances
11 To date, Benin and Senegal are the only francophone sub-Saharan African countries participating in the e-GDDS.

BENIN
20 INTERNATIONAL MONETARY FUND
by lessening the dependence on the trade with Nigeria. In this regard, the scaling up of investment, if implemented efficiently, would help remove the bottlenecks to sustained growth.
24. The proposed program strikes the right balance between fiscal and debt sustainability and the need for spending on priority sectors and investment scaling up. The program focuses on policies to boost domestic revenue mobilization to reduce reliance on borrowing and preserve debt sustainability. It is essential that the authorities remain steadfast in their effort to redirect spending to investment while implementing well-targeted measures to protect the most vulnerable segments of the population. Also, ensuring that the selection of public investment projects is strengthened and procurement reform is carried out diligently would help increase absorptive capacity and further improve growth prospects.
25. Fiscal policy should aim to strengthen domestic revenue mobilization and improve the quality of spending. Staff welcomes the prior actions taken to facilitate achievement of the programmed revenue target. The authorities are encouraged to implement the reforms underway to modernize the Tax and Customs Administrations, enhance their efficiency and strengthen their coordination to ensure a durable improvement in revenue collection. Rationalization of current spending should be given priority to ensure that the reorientation of public spending does not lead accumulation of domestic payment arrears. The planned public expenditure review with World Bank’s assistance would provide a roadmap to achieve long-lasting improvement in the quality of public expenditure.
26. Strengthening debt management capacity to effectively monitor debt development is essential. Prudent borrowing policy and strengthened debt management practices would help preserve debt sustainability. Staff urges the authorities to strengthen the surveillance of public enterprises’ financial position and contingent liabilities stemming from PPPs through enhanced monitoring and a transparent reporting of all public debt. The planned reorganization of the Treasury complementing the recent reorganization of the Debt Directorate would go a long way in strengthening public debt management. The authorities’ efforts to rebalance the composition of the public debt toward longer maturity and more concessional terms would also contribute to preserving debt sustainability.
27. Promoting financial sector stability and development while improving inclusion should help sustain strong economic growth and reduce poverty. Structural reforms aimed at financial deepening and inclusion are needed to boost private sector contribution to growth and increase access of the rural population to financial services. In this regard, the measures to remove the key barriers to more efficient financial intermediation need to be pursued vigorously. Passage of the legislation for a credit bureau and its enactment is welcome; it now imperative that the credit bureau be established and made operational to facilitate bank access to credit information. The authorities are encouraged to accelerate the implementation of the new harmonized regional resolution framework and strengthen the supervisory body for microfinance by increasing the number of supervisors, especially in rural areas, necessary for timely supervision and enforcement of regulations.

BENIN
INTERNATIONAL MONETARY FUND 21
28. Fostering economic transformation will require further improvement in the business climate. The heavy reliance of the GAP on the private sector for funding makes it imperative to remove bottlenecks to private sector development and level the playing field for all investors. Staff welcomes the government’s focus on fighting corruption and improving accountability in public administration and competitive procurement for government contracts. The recent progress made the 2016 Doing Business Report needs to be improved upon by boosting access to electricity, facilitating paying taxes, and obtaining credit.
29. Improved data quality and better dissemination of economic statistics will support policymaking and private investment. Staff commends the authorities for the efforts to improve national accounts statistics and for participating in the e-GDDS. The authorities’ commitment to further improve the quality and timeliness of economic data is welcome and needs to be underpinned by adequate resource both financial and human to economic data gathering and analysis.
30. Staff supports the authorities’ request for program under the ECF arrangement with access equivalent to SDR 111.42 million (90 percent of quota). The LOI and MEFP set out appropriate policies to pursue the program’s objectives. Risks to the program are manageable given the prior actions already implemented and Benin’s good track record of policy implementation under the ECF arrangement.

BENIN
22 INTERNATIONAL MONETARY FUND
Table 1. Benin: Selected Economic and Financial Indicators, 2012–22
2014 2015 2016 2017 2018 2019 2020 2021 2022 Est.
National income GDP at current prices 12.9 8.7 6.1 2.2 3.7 7.6 8.2 8.4 8.8 9.2 8.3 GDP at constant prices 4.8 7.2 6.4 2.1 4.0 5.4 6.0 6.3 6.7 7.1 6.2 GDP deflator 7.7 1.4 -0.2 0.1 -0.3 2.1 2.0 2.0 2.0 2.0 2.0 Consumer price index (average) 6.7 1.0 -1.1 0.3 -0.8 2.0 2.1 2.0 2.0 2.0 2.0 Consumer price index (end of period) 6.8 -1.8 -0.8 2.3 -2.7 2.2 2.0 2.0 2.0 2.0 2.0
Central government finance Total revenue 19.3 10.1 -1.9 5.0 -9.0 13.2 12.4 13.4 12.6 12.3 10.7 Expenditure and net lending 8.1 16.7 -3.7 35.5 -12.6 24.4 -4.0 1.0 5.2 5.7 5.9
External sector Exports of goods and services -6.3 27.4 8.3 2.4 7.0 19.7 16.1 13.8 6.6 16.7 11.8 Imports of goods and services 9.0 22.0 16.4 -5.3 1.6 22.3 7.8 10.9 4.8 11.1 8.1 Terms of trade (minus = deterioration) -1.0 1.1 1.0 2.9 3.3 1.0 0.2 0.3 2.9 1.3 0.6 Nominal effective exchange rate (minus = depreciation) -5.0 3.6 2.6 -8.9 … … … … … … … Real effective exchange rate (minus = depreciation) -1.8 1.4 -1.1 -10.8 … … … … … … …
Money and credit Net domestic assets 4.7 10.6 8.4 3.8 7.3 9.6 … … … … … Domestic credit 4.4 16.5 0.4 2.3 7.3 9.6 … … … … … Net claims on central government -0.9 0.9 1.7 5.2 4.2 3.1 … … … … … Credit to the nongovernment sector 5.0 15.6 -1.2 -2.9 3.1 6.5 … … … … … Broad money (M2) 9.0 17.3 16.7 7.9 5.9 11.5 … … … … …
National accountsGross investment 22.6 27.8 28.6 26.0 24.6 29.3 27.4 26.3 26.9 27.6 24.2
Government investment 5.2 6.4 5.2 7.7 5.9 10.1 7.6 6.2 5.9 5.5 5.3Nongovernment investment 1 17.3 21.4 23.4 18.3 18.7 19.3 19.8 20.1 21.1 22.1 18.9
Gross domestic saving 10.6 15.1 13.4 13.1 12.8 15.5 15.0 14.2 15.6 17.0 14.5Government saving 3.1 3.6 2.0 -0.5 -0.7 0.8 1.7 2.6 3.5 4.2 4.9Non-government saving 7.5 11.5 11.4 13.6 13.5 14.7 13.3 11.6 12.1 12.8 9.6
Gross national saving 15.1 20.4 20.0 17.6 17.4 20.2 20.0 19.1 20.7 21.8 19.2 Consumption 89.4 84.9 86.6 86.9 87.2 84.5 85.0 85.8 84.4 83.0 85.5
Government consumption 12.3 12.2 12.5 15.0 12.6 11.3 11.0 10.7 10.6 10.6 10.6Non-government consumption 77.0 72.8 74.2 71.9 74.6 73.3 74.0 75.1 73.8 72.3 74.9
Central government financeTotal revenue 17.4 17.6 16.3 16.7 14.7 15.4 16.0 16.8 17.4 17.9 18.3Expenditure and net lending 19.6 21.0 19.1 25.3 21.4 24.7 21.9 20.4 19.7 19.1 18.7Primary balance 2 -1.7 -3.0 -2.4 -7.9 -5.5 -7.5 -4.1 -1.7 -0.6 0.3 1.0Basic primary balance 3 0.6 1.1 0.0 -4.2 -3.0 -3.1 -0.7 1.7 2.5 3.0 3.8Overall fiscal deficit (commitment basis, excl. grants) -2.2 -3.5 -2.8 -8.6 -6.7 -9.3 -5.9 -3.6 -2.4 -1.2 -0.4Overall fiscal deficit (commitment basis, incl. grants) -0.4 -2.6 -1.9 -8.0 -6.2 -7.9 -4.0 -1.9 -0.8 -0.2 0.6Debt service (percent of revenue) 6.7 6.1 6.0 8.2 12.5 15.4 14.8 14.8 13.1 11.5 10.2Total government debt 26.7 25.3 30.5 42.4 49.5 54.3 54.4 52.3 49.1 45.3 41.7
External sectorBalance of goods and services -12.0 -12.8 -15.2 -12.9 -11.8 -13.8 -12.4 -12.1 -11.4 -10.5 -9.8Current account balance (incl. grants) -7.4 -7.4 -8.6 -8.4 -7.2 -9.1 -7.4 -7.2 -6.2 -5.7 -5.0Current account balance (excl. grants) -8.2 -7.7 -8.8 -8.4 -7.2 -9.4 -8.1 -7.9 -6.8 -6.3 -5.5Overall balance of payments -2.6 -0.7 1.0 0.9 -1.6 -1.4 -0.8 -0.8 0.2 0.5 1.1Debt service-to-exports ratio 6.5 5.4 5.1 6.0 5.0 5.3 5.3 5.1 5.2 4.7 4.4
Nominal GDP (billions of CFA francs) 4,162 4,524 4,800 4,904 5,084 5,472 5,919 6,415 6,977 7,617 8,246Nominal GDP (millions of US$) 8,157.3 9,159.8 9,722.9 8,295.3 8,577.4 8,791.9 9,485.2 10,289.1 11,189.5 12,215.7 13,225.1CFA francs per U.S. dollar (period average) 510.2 493.9 493.6 591.2 592.7 … … … … … …Total non-financial public sector debt (percent of GDP) 4 … 50.3 55.1 55.2 53.1 49.8 46.1 41.7pPopulation (millions) 10.0 10.3 10.6 10.9 11.1 11.4 11.7 11.9 12.2 12.4 12.7Nominal GDP per capita (U.S. dollars) 812 888 918 764 771 772 813 863 919 982 1042
Sources: Beninese authorities; IMF staff estimates and projections.1 Including off-budget investment implemented by non-financial public enterprises.2 Total revenue minus current primary expenditure, capital expenditure, and net lending. 3 Total revenue minus current primary expenditure and capital expenditure financed by domestic resources.
4 Data Include projected central government debt and new non-financial public sector borrowing for infrastructure from 2016 onward as well as the nominal amount of government guarantees.
2012 2013Projections
(Annual percentage change)
(Change in percent of beginning-of-period broad money)
(Percent of GDP, unless otherwise indicated)
Program

BENIN
INTERNATIONAL MONETARY FUND 23
Table 2. Benin: Consolidated Central Government Operations, 2012–22
2017 2018 2019 2020 2021 2022
Budget Rev. Budget 5 Est.
Total revenue 722.5 795.5 780.8 819.5 896.3 845.9 745.7 843.9 949.0 1076.0 1212.0 1361.2 1506.7
Tax revenue 598.2 668.2 701.2 713.1 792.4 742.0 641.1 739.3 835.2 950.1 1075.1 1211.8 1345.0Tax on international trade 318.1 371.6 362.1 345.7 397.7 347.3 288.5 337.6 377.0 427.9 479.3 538.5 599.4Direct and indirect taxes 280.1 296.5 339.1 367.4 394.7 394.7 352.6 401.7 458.2 522.3 595.9 673.4 745.5
Nontax revenue 124.4 127.3 79.5 106.4 103.9 103.9 104.6 104.6 113.7 125.8 136.8 149.4 161.7
Total expenditure and net lending 815.7 952.0 916.5 1242.3 1196.5 1105.9 1086.3 1351.7 1297.4 1309.7 1377.7 1455.9 1541.2
Current expenditure 592.5 632.8 683.4 845.3 800.5 774.1 781.1 801.7 847.5 909.7 967.1 1036.6 1104.2Current primary expenditure 569.3 612.9 665.1 809.0 736.2 692.1 717.8 705.2 744.3 788.1 845.9 918.7 990.6
Wage bill 279.4 300.3 317.4 343.4 331.4 340.7 353.8 363.1 378.0 406.5 442.0 482.6 522.5Pensions and scholarships 55.5 61.2 67.5 75.0 83.1 83.1 78.4 88.9 93.9 99.1 104.7 110.5 116.7
Current transfers 124.5 132.3 176.4 249.5 202.6 174.1 185.5 158.5 170.0 172.0 186.0 202.0 217.7of which: subsidies to the cotton sector 30.0 … … … 0.0 0.0 0.0 0.0 0.0 0.0 0.0of which: subsidies to the energy sector … … … … 0.0 46.0 22.0 12.0 12.0 12.0 12.0
Goods and services 110.0 119.0 103.9 141.1 119.1 94.2 100.1 94.7 102.5 110.5 113.2 123.6 133.8Interest 23.1 19.9 18.3 36.3 64.3 82.0 63.3 96.5 103.1 121.6 121.2 118.0 113.5
Internal debt 12.5 10.1 8.1 20.3 40.2 58.9 51.4 77.6 78.6 91.3 86.1 80.2 71.7External debt 10.6 9.8 10.3 16.0 24.1 23.1 11.9 18.8 24.5 30.3 35.2 37.7 41.8
Capital expenditure and net lending 223.3 319.2 233.1 397.0 396.0 331.9 305.2 550.0 449.9 400.0 410.6 419.3 437.0
Capital expenditure 1 217.3 288.1 249.6 376.9 396.0 331.9 299.6 550.0 449.9 400.0 410.6 419.3 437.0Financed by domestic resources 129.6 133.8 114.6 216.6 214.1 177.0 178.5 310.0 246.9 178.9 194.6 213.3 206.1Financed by external resources 87.7 154.3 135.1 160.3 181.9 154.9 121.1 240.0 203.0 221.1 216.0 206.0 230.9
Net lending 6.0 31.2 -16.5 20.2 0.0 0.0 5.5 0.0 0.0 0.0 0.0 0.0 0.0
Overall balance (payment order basis, excl. grants) -93.2 -156.5 -135.8 -422.9 -300.2 -260.0 -340.6 -507.8 -348.4 -233.7 -165.7 -94.7 -34.5
Primary balance 2 -70.1 -136.6 -117.5 -386.6 -235.9 -178.0 -277.3 -411.3 -245.3 -112.1 -44.5 23.3 79.0Basic primary balance 3 23.6 48.8 1.1 -206.1 -54.0 -23.1 -150.6 -171.3 -42.3 109.0 171.5 229.3 309.9
Change in arrears -12.2 -7.2 -2.4 -0.4 -10.0 -10.0 -1.4 -10.0 -10.0 -10.0 -10.0 -10.0 -10.0External debt 0.0 0.0 0.0 0.0 0.0 0.0 0.0 0.0 0.0 0.0 0.0 0.0 0.0Domestic debt (net) -12.2 -7.2 -2.4 -10.3 -10.0 -10.0 -1.4 -10.0 -10.0 -10.0 -10.0 -10.0 -10.0
Float 4 5.3 13.0 -28.1 10.4 0.0 0.0 0.8 0.0 0.0 0.0 0.0 0.0 0.0
Overall balance (commitment basis, excl. grants) -100.2 -150.7 -166.2 -422.8 -310.2 -270.0 -341.3 -517.8 -358.4 -243.7 -175.7 -104.7 -44.5
Financing 100.2 150.7 166.2 422.8 310.2 270.0 341.3 441.2 308.6 178.0 169.4 104.7 44.5
Domestic financing 6.0 -25.5 39.8 291.4 113.3 138.0 232.8 177.7 43.5 -104.8 -109.0 -143.1 -222.1Bank financing -9.9 15.2 33.6 121.4 77.7 91.2 107.3 56.0 -96.2 -256.3 -273.8 -322.9 -416.8
Net use of IMF resources 16.1 7.5 5.1 -3.6 -6.6 -6.6 -5.1 -10.0 -12.5 -12.4 -11.6 -9.8 -6.2 Disbursements 16.4 7.9 7.9 0.0 0.0 0.0 0.0 0.0 0.0 0.0 0.0 0.0 0.0 Repayments -0.3 -0.4 -2.8 -3.6 -6.6 -6.6 -5.1 -10.0 -12.5 -12.4 -11.6 -9.8 -6.2Other -26.0 7.7 28.5 125.1 84.3 97.8 112.4 66.0 -83.7 -243.9 -262.2 -313.1 -410.6
Nonbank financing 15.8 -40.7 6.1 170.0 86.0 46.8 125.5 121.7 139.7 151.5 164.7 179.8 194.7Privatization 0.0 0.0 0.0 0.0 100.0 0.0 0.0 0.0 0.0 0.0 0.0 0.0 0.0Restructuring -11.2 -15.8 -8.7 -7.4 -10.2 -10.2 -7.1 -7.5 0.0 0.0 0.0 0.0 0.0Other 27.1 -24.9 14.8 177.4 -3.8 57.0 132.5 129.2 139.7 151.5 164.7 179.8 194.7
External financing 94.2 176.2 126.5 131.4 146.5 132.0 108.5 263.5 265.1 282.8 278.5 247.7 266.6Project financing 87.7 154.3 135.1 160.3 181.9 154.9 121.1 240.0 203.0 221.0 216.0 206.0 264.4
Grants 43.4 28.1 35.9 28.8 91.0 55.1 26.1 60.0 67.0 71.0 71.0 60.0 75.9Loans 44.3 126.2 99.2 131.4 90.9 99.8 95.0 180.0 136.0 150.0 145.0 146.0 188.5
Amortization due -25.0 -28.2 -26.6 -28.9 -47.1 -46.1 -24.3 -31.5 -23.8 -24.0 -24.8 -28.2 -30.9Budgetary assistance 31.5 50.1 18.0 0.0 11.7 23.2 11.6 55.0 85.8 85.8 87.3 70.0 66.7
Financing gap 0.0 76.6 49.8 65.7 6.3 0.0 0.0Expected Financing 76.6 49.8 65.7 6.3 IMF 26.6 26.7 26.7 13.9 Others 50.0 18.5 29.3 -
Nominal GDP 4,162 4,524 4,800 4,904 … 5,139 5,084 5,472 5,919 6,415 6,977 7,617 8,246Central government debt 1,112 1,144 1,462 2,080 … … 2,517 2,974 3,223 3,356 3,423 3,450 3,443 Domestic public debt 473 388 511 1,037 1,373 1,569 1,628 1,537 1,434 1,303 1,090 External public debt 639 756 951 1,044 1,143 1,405 1,594 1,818 1,988 2,148 2,353Government guarantees 39.0 42.0 45.4 49.2 53.5 58.4 0.0Nonfinancial public sector debt … … 2,556 3,016 3,268 3,405 3,476 3,509 3,443
Sources: Beninese authorities; IMF staff estimates and projections.1 Data include executed pre-financed projects.2 Total revenue minus current primary expenditure, capital expenditure, and net lending. 3 Total revenue minus current primary expenditure and capital expenditure financed by domestic resources. 4 Net change in the stock of payment orders whose payment has been postponed to the following period.5 As presented in the authorities' 2016 supplementary budget as of June 10, 2016.
20132012 2014 2015
(Billions of CFA francs)
2016
ProjectionsProgramAct.

BENIN
24 INTERNATIONAL MONETARY FUND
Table 3. Benin: Consolidated Central Government Operations, 2016–17
2016 2017
Year Q1 Q2 Q3 Year YearEst. Prog. Prog. Prog. Prog.
Total revenue 745.7 182.9 386.1 602.9 843.9 843.9
Tax revenue 641.1 161.5 338.9 527.5 739.3 739.3Tax on international trade 288.5 70.1 143.6 239.1 337.6 337.6Direct and indirect taxes 352.6 91.4 195.3 288.4 401.7 401.7
Nontax revenue 104.6 21.4 47.2 75.3 104.6 104.6
Total expenditure and net lending 1086.3 311.9 616.0 964.4 1351.7 1351.7
Current expenditure 781.1 216.6 404.1 597.0 801.7 801.7Current primary expenditure 717.8 202.5 365.4 540.6 705.2 705.2
Wage bill 353.8 106.9 192.7 282.7 363.1 363.1Pensions and scholarships 78.4 23.7 44.4 68.3 88.9 88.9Current transfers 185.5 49.3 86.7 128.0 158.5 158.5
of which: subsidies to the cotton sector 0.0 0.0 0.0 0.0 0.0 0.0
Expenditure on goods and services 100.1 22.6 41.6 61.6 94.7 94.7Interest 63.3 14.1 38.7 56.3 96.5 96.5
Internal debt 51.4 10.3 29.3 43.2 77.6 77.6External debt 11.9 3.7 9.3 13.2 18.8 18.8
Capital expenditure and net lending 305.2 95.3 211.9 367.5 550.0 550.0Capital expenditure 299.6 95.3 211.9 367.5 550.0 550.0
Financed by domestic resources 178.5 45.1 93.8 201.3 310.0 310.0Financed by external resources 121.1 50.2 118.1 166.2 240.0 240.0
Net lending (minus = reimbursement) 5.5 0.0 0.0 0.0 0.0 0.0
Overall balance (commitment basis, excl. grants) -340.6 -129.0 -229.9 -361.6 -507.8 -507.8Primary balance 1 -277.3 -114.9 -191.2 -305.2 -411.3 -411.3Basic primary balance 2 -150.6 -64.7 -73.1 -139.0 -171.3 -171.3
Change in arrears -1.4 -2.5 -5.0 -7.5 -10.0 -10.0External debt 0.0 0.0 0.0 0.0 0.0 0.0Domestic debt (net) -1.4 -2.5 -5.0 -7.5 -10.0 -10.0
Float 3 0.8 0.0 0.0 0.0 0.0 0.0
Overall balance (commitment basis, excl. grants) -341.3 -131.5 -234.9 -369.1 -517.8 -517.8
Financing 341.3 131.5 234.9 369.1 441.2 441.2
Domestic financing 232.8 70.1 116.1 183.9 177.7 177.7Bank financing 107.3 -50.6 23.6 47.4 56.0 56.0
Net use of IMF resources -5.1 -3.9 -4.3 -6.8 -10.0 -10.0 Disbursements 0.0 0.0 0.0 0.0 0.0 0.0 Repayments -5.1 -3.9 -4.3 -6.8 -10.0 -10.0Other 112.4 -46.7 27.9 54.2 66.0 66.0
Nonbank financing 125.5 117.8 88.0 130.5 121.7 121.7Privatization 0.0 0.0 0.0 0.0 0.0 0.0Restructuring -7.1 -3.0 -4.5 -6.0 -7.5 -7.5Other 132.5 120.8 92.5 136.5 129.2 129.2
External financing 108.5 61.3 118.8 185.2 263.5 263.5Project financing 121.1 50.2 118.1 166.2 240.0 240.0
Grants 26.1 6.3 16.9 31.9 60.0 60.0Loans 95.0 43.9 101.2 134.3 180.0 180.0
Amortization due -24.3 -5.1 -15.5 -20.2 -31.5 -31.5Budgetary assistance 11.6 16.2 16.2 39.2 55.0 55.0
Grants 0.0 0.0 0.0 0.0 15.8 15.8Loans 11.6 16.2 16.2 39.2 39.2 39.2
Financing gap 0.0 0.0 0.0 0.0 76.6 76.6Expected Financing 0.0 0.0 0.0 0.0 76.6 76.6 IMF 0.0 0.0 0.0 0.0 26.6 26.6 Others 0.0 0.0 0.0 0.0 50.0 50.0
Memorandum item:
GDP (billions of CFA francs, annual) 5084 5,472 5,472 5,472 5,472 5472
Sources: Beninese authorities; IMF staff estimates and projections.1 Total revenue minus current primary expenditure, capital expenditure, and net lending. 2 Total revenue minus current primary expenditure and capital expenditure financed by domestic resources. 3 Net change in the stock of payment orders whose payment has been postponed to the following period.
Proj.
(Billions of CFA francs)
2017

BENIN
INTERNATIONAL MONETARY FUND 25
Table 4. Benin: Consolidated Central Government Operations, 2012–22
2017 2018 2019 2020 2021 2022
Prel. Budget Rev. Budget5 Est.
Total revenue 17.4 17.6 16.3 16.7 17.6 16.6 14.7 15.4 16.0 16.8 17.4 17.9 18.3Tax revenue 14.4 14.8 14.6 14.5 15.6 14.6 12.6 13.5 14.1 14.8 15.4 15.9 16.3
Tax on international trade 7.6 8.2 7.5 7.0 7.8 6.8 5.7 6.2 6.4 6.7 6.9 7.1 7.3Direct and indirect taxes 6.7 6.6 7.1 7.5 7.8 7.8 6.9 7.3 7.7 8.1 8.5 8.8 9.0
Nontax revenue 3.0 2.8 1.7 2.2 2.0 2.0 2.1 1.9 1.9 2.0 2.0 2.0 2.0
Total expenditure and net lending 19.6 21.0 19.1 25.3 23.5 21.8 21.4 24.7 21.9 20.4 19.7 19.1 18.7
Current expenditures 14.2 14.0 14.2 17.2 15.7 15.2 15.4 14.7 14.3 14.2 13.9 13.6 13.4Current primary expenditures 13.7 13.5 13.9 16.5 14.5 13.6 14.1 12.9 12.6 12.3 12.1 12.1 12.0
Wage bill 6.7 6.6 6.6 7.0 6.5 6.7 7.0 6.6 6.4 6.3 6.3 6.3 6.3Pensions and scholarships 1.3 1.4 1.4 1.5 1.6 1.6 1.5 1.6 1.6 1.5 1.5 1.5 1.4Current transfers 3.0 2.9 3.7 5.1 4.0 3.4 3.6 2.9 2.9 2.7 2.7 2.7 2.6Expenditure on goods and services 2.6 2.6 2.2 2.9 2.3 1.9 2.0 1.7 1.7 1.7 1.6 1.6 1.6
Interest 0.6 0.4 0.4 0.7 1.3 1.6 1.2 1.8 1.7 1.9 1.7 1.5 1.4Internal debt 0.3 0.2 0.2 0.4 0.8 1.2 1.0 1.4 1.3 1.4 1.2 1.1 0.9External debt 0.3 0.2 0.2 0.3 0.5 0.5 0.2 0.3 0.4 0.5 0.5 0.5 0.5
Capital expenditure and net lending 5.4 7.1 4.9 8.1 7.8 6.5 6.0 10.1 7.6 6.2 5.9 5.5 5.3Capital expenditure 5.2 6.4 5.2 7.7 7.8 6.5 5.9 10.1 7.6 6.2 5.9 5.5 5.3
Financed by domestic resources 3.1 3.0 2.4 4.4 4.2 3.5 3.5 5.7 4.2 2.8 2.8 2.8 2.5Financed by external resources 2.1 3.4 2.8 3.3 3.6 3.0 2.4 4.4 3.4 3.4 3.1 2.7 2.8
Net lending (minus = reimbursement) 0.1 0.7 -0.3 0.4 0.0 0.0 0.1 0.0 0.0 0.0 0.0 0.0 0.0
Overall balance (commitment basis, excl. grants) -2.2 -3.5 -2.8 -8.6 -5.9 -5.1 -6.7 -9.3 -5.9 -3.6 -2.4 -1.2 -0.4Primary balance 1 -1.7 -3.0 -2.4 -7.9 -4.6 -3.5 -5.5 -7.5 -4.1 -1.7 -0.6 0.3 1.0Basic primary balance 2 0.6 1.1 0.0 -4.2 -1.1 -0.5 -3.0 -3.1 -0.7 1.7 2.5 3.0 3.8
Change in arrears -0.3 -0.2 0.0 0.0 -0.2 -0.2 0.0 -0.2 -0.2 -0.2 -0.1 -0.1 -0.1External debt 0.0 0.0 0.0 0.0 0.0 0.0 0.0 0.0 0.0 0.0 0.0 0.0 0.0Domestic debt (net) -0.3 -0.2 0.0 -0.2 -0.2 -0.2 0.0 -0.2 -0.2 -0.2 -0.1 -0.1 -0.1
Float 3 0.1 0.3 -0.6 0.2 0.0 0.0 0.0 0.0 0.0 0.0 0.0 0.0 0.0
Overall balance (cash basis, excl. grants) -2.4 -3.3 -3.5 -8.6 -6.1 -5.3 -6.7 -9.5 -6.1 -3.8 -2.5 -1.4 -0.5
Financing 2.4 3.3 3.5 8.6 6.1 5.3 6.7 8.1 5.2 2.8 2.4 1.4 0.5
Domestic financing 0.1 -0.6 0.8 5.9 2.2 2.7 4.6 3.2 0.7 -1.6 -1.6 -1.9 -2.7Bank financing -0.2 0.3 0.7 2.5 1.5 1.8 2.1 1.0 -1.6 -4.0 -3.9 -4.2 -5.1
Net use of IMF resources 0.4 0.2 0.1 -0.1 -0.1 -0.1 -0.1 -0.2 -0.2 -0.2 -0.2 -0.1 -0.1Other -0.6 0.2 0.6 2.6 1.7 1.9 2.2 1.2 -1.4 -3.8 -3.8 -4.1 -5.0
Nonbank financing 0.4 -0.9 0.1 3.5 1.7 0.9 2.5 2.2 2.4 2.4 2.4 2.4 2.4Privatization 0.0 0.0 0.0 0.0 2.0 0.0 0.0 0.0 0.0 0.0 0.0 0.0 0.0Restructuring -0.3 -0.3 -0.2 -0.2 -0.2 -0.2 -0.1 -0.1 0.0 0.0 0.0 0.0 0.0Other 0.7 -0.6 0.3 3.6 -0.1 1.1 2.6 2.4 2.4 2.4 2.4 2.4 2.4
External financing 2.3 3.9 2.6 2.7 2.9 2.6 2.1 4.8 4.5 4.4 4.0 3.3 3.2Project financing 2.1 3.4 2.8 3.3 3.6 3.0 2.4 4.4 3.4 3.4 3.1 2.7 3.2
Grants 1.0 0.6 0.7 0.6 1.8 1.1 0.5 1.1 1.1 1.1 1.0 0.8 0.9Loans 1.1 2.8 2.1 2.7 1.8 1.9 1.9 3.3 2.3 2.3 2.1 1.9 2.3
Amortization due -0.6 -0.6 -0.6 -0.6 -0.9 -0.9 -0.5 -0.6 -0.4 -0.4 -0.4 -0.4 -0.4Budgetary assistance 0.8 1.1 0.4 0.0 0.2 0.5 0.2 1.0 1.5 1.3 1.3 0.9 0.8
Financing gap 0.0 0.0 1.4 0.8 1.0 0.1 0.0 0.0Expected Financing 1.4 0.8 1.0 0.0 IMF 0.5 0.5 0.4 0.0 Others 0.9 0.3 0.5 -
Memorandum items:
Total revenue and grants 19.2 18.5 17.2 17.3 19.5 15.0 16.8 17.9 18.5 19.0 18.7 19.2Revenue 17.4 17.6 16.3 16.7 17.4 14.5 15.4 16.0 16.8 17.4 17.9 18.3Grants 1.8 0.9 0.9 0.6 2.1 0.5 1.4 1.9 1.7 1.6 0.8 0.9
Total loan disbursement 1.1 3.6 2.3 2.7 1.9 2.1 4.0 3.0 3.0 2.8 1.9 2.3Overall balance incl. grants (commitment basis) -0.4 -2.6 -1.9 -8.0 -3.8 -6.1 -7.9 -4.0 -1.9 -0.8 -0.5 0.5Total central government debt 26.7 25.3 30.5 42.4 … … 49.5 54.3 54.4 52.3 49.1 45.3 41.7Total nonfinancial public sector debt 4 … 50.3 55.1 55.2 53.1 49.8 46.1 41.7GDP (billions of CFA francs) 4,162 4,524 4,800 4,904 … 5,139 5,084 5,472 5,919 6,415 6,977 7,617 8,246
Sources: Beninese authorities; IMF staff estimates and projections.1 Total revenue minus current primary expenditure, capital expenditure, and net lending. 2 Total revenue minus current primary expenditure and capital expenditure financed by domestic resources. 3 Net change in the stock of payment orders whose payment has been postponed to the following period.4 Data include projected central government debt and new non-financial public sector borrowing for infrastructure from 2016 onward as well as the nominal amount of government
guarantees.5 As presented in the authorities' revised 2016 budget as of June 10, 2016.
2012 2013 2016
ProjectionsProgram
(Percent of GDP)
2014 2015

BENIN
26 INTERNATIONAL MONETARY FUND
Table 5. Benin: Balance of Payments, 2012–22
2012 2013 2014 2015 2016 2017 2018 2019 2020 2021 2022
Est.
Current account balance -308.2 -335.6 -412.3 -412.1 -364.8 -497.0 -436.1 -462.9 -434.4 -436.9 -415.1Excluding budgetary assistance grants -339.8 -348.4 -420.5 -412.1 -364.8 -512.9 -480.2 -504.1 -475.5 -478.1 -456.3
Balance of goods and services -497.4 -577.4 -728.9 -631.9 -600.9 -756.3 -732.2 -778.9 -792.4 -801.9 -804.7Credit 551.0 701.7 760.2 778.8 833.1 997.6 1157.8 1317.0 1404.5 1638.8 1832.9Debit -1048.4 -1279.1 -1489.1 -1410.8 -1434.0 -1753.9 -1890.0 -2095.9 -2196.9 -2440.7 -2637.5
Trade balance 1 -460.1 -455.5 -527.9 -411.1 -391.7 -473.7 -432.8 -446.6 -423.1 -387.5 -360.4
Exports, f.o.b. 289.5 447.6 523.6 608.4 650.5 802.0 954.4 1106.3 1185.4 1410.4 1592.4Cotton and textiles 85.5 128.9 153.5 173.4 192.4 256.7 295.4 373.7 480.1 574.6 676.6Other 204.0 318.7 370.1 435.0 458.1 545.3 658.9 732.6 705.3 835.8 915.9
Imports, f.o.b. 2 -749.6 -903.1 -1051.5 -1019.5 -1042.2 -1275.6 -1387.1 -1552.9 -1608.6 -1797.9 -1952.8p
Services (net) -37.3 -121.8 -201.0 -220.9 -209.2 -282.6 -299.4 -332.3 -369.2 -414.4 -444.3Credit 261.5 254.1 236.6 170.4 182.6 195.6 203.4 210.7 219.1 228.4 240.4Debit -298.7 -376.0 -437.7 -391.3 -391.8 -478.2 -502.9 -543.0 -588.3 -642.8 -684.7
Income (net) -15.4 2.7 7.2 -0.1 1.9 -7.8 -16.7 -26.2 -29.4 -32.0 -36.1Of which: interest due on central government debt -10.6 -9.8 -10.3 -16.0 -11.9 -18.8 -24.5 -30.3 -35.2 -37.7 -41.8
Current transfers (net) 204.6 239.1 309.4 219.9 234.3 267.0 312.7 342.2 387.5 397.0 425.6Unrequited private transfers 70.5 86.6 95.5 118.4 134.6 149.8 166.2 196.6 240.3 248.2 274.9Public current transfers 134.1 152.6 214.0 101.5 99.7 117.2 146.6 145.6 147.1 148.7 150.7
Of which: budgetary assistance grants 31.5 12.8 8.2 0.0 0.0 15.8 44.0 41.1 41.1 41.1 41.1
Capital and financial account balance 125.9 198.3 274.8 392.6 285.8 423.0 390.2 411.3 446.0 474.7 506.5
Capital account balance 43.4 28.1 35.9 28.8 26.1 60.0 67.0 71.0 75.2 79.7 84.5
Financial account balance 82.4 170.2 239.0 363.7 259.6 363.0 323.2 340.3 370.8 395.0 422.0Medium- and long-term public capital 23.2 139.3 86.4 106.5 86.4 191.7 158.0 174.7 186.4 197.2 210.7
Disbursements 48.3 167.4 113.1 135.4 110.6 223.2 181.8 198.7 211.2 225.5 241.7Project loans 48.3 130.2 103.2 135.4 99.0 184.0 140.0 154.0 166.6 180.8 197.0
Of which: central government project loans 44.3 126.2 99.2 131.4 95.0 180.0 136.0 150.0 145.0 146.0 188.5Budgetary assistance loans 0.0 37.3 9.8 0.0 11.6 39.2 41.8 44.7 44.7 44.7 44.7
Amortization due -25.0 -28.2 -26.6 -28.9 -24.3 -31.5 -23.8 -24.0 -24.8 -28.2 -30.9Foreign direct investment 107.5 149.0 191.8 69.2 67.8 94.1 101.8 116.4 123.1 134.4 145.5Portfolio investment 35.2 19.5 23.9 117.5 48.4 52.1 50.7 43.9 55.0 60.0 64.9Other medium- and long-term private capital 74.6 -3.2 31.1 28.6 29.0 28.7 31.4 33.3 36.6 40.3 88.5Deposit money banks -175.7 -148.3 -117.4 -53.6 -43.5 -49.8 -48.7 -47.6 -43.0 -45.4 -45.4
Short-term capital 2 17.7 13.9 23.1 159.4 71.6 46.3 30.0 19.5 12.7 8.3 5.4
Errors and omissions 74.4 104.4 187.0 63.8 0.0 0.0 0.0 0.0 0.0 0.0 0.0
Overall balance -108.0 -32.8 49.5 44.3 -79.0 -74.0 -45.9 -51.6 11.7 37.8 91.3
Change in net foreign assets, BCEAO (- = increase) 108.0 32.8 -49.5 -44.3 79.0 -2.6 -3.8 -14.1 -18.0 -37.8 -91.3
Financing gap 0.0 0.0 0.0 0.0 0.0 76.6 49.8 65.7 6.3 0.0 0.0
Expected Financing 76.6 49.8 65.7 6.3
IMF 26.6 26.7 26.7 13.9
Others 50.0 18.5 29.3 -
Memorandum items:
Current account balance (incl. budgetary assistance grants) -7.4 -7.4 -8.6 -8.4 -7.2 -9.1 -7.4 -7.2 -6.2 -5.7 -5.0Current account balance (excl. budgetary assistance grants) -8.2 -7.7 -8.8 -8.4 -7.2 -9.4 -8.1 -7.9 -6.8 -6.3 -5.5
Balance of goods and services -12.0 -12.8 -15.2 -12.9 -11.8 -13.8 -12.4 -12.1 -11.4 -10.5 -9.8Trade balance -11.1 -10.1 -11.0 -8.4 -7.7 -8.7 -7.3 -7.0 -6.1 -5.1 -4.4
Exports 7.0 9.9 10.9 12.4 12.8 14.7 16.1 17.2 17.0 18.5 19.3Imports -18.0 -20.0 -21.9 -20.8 -20.5 -23.3 -23.4 -24.2 -23.1 -23.6 -23.7
Income and current transfers (net) 4.5 5.3 6.6 4.5 4.6 4.7 5.0 4.9 5.1 4.8 4.7Capital account balance 1.0 0.6 0.7 0.6 0.5 1.1 1.1 1.1 1.1 1.0 1.0Financial account balance 2.0 3.8 5.0 7.4 5.1 6.6 5.5 5.3 5.3 5.2 5.1Overall balance -2.6 -0.7 1.0 0.9 -1.6 -1.4 -0.8 -0.8 0.2 0.5 1.1International price of cotton (Cotlook "A" Index, U.S. cents a lb.) 89.2 90.4 83.1 70.4 74.2 82.2 80.2 79.6 79.7 79.7 79.7International price of oil (U.S. dollars a barrel) 105.0 104.1 96.2 50.8 42.8 54.9 55.7 55.7 55.9 56.3 56.9
GDP (billions of CFA francs) 4,162 4,524 4,800 4,904 5,084 5,472 5,919 6,415 6,977 7,617 8,246
Sources: Beninese authorities; IMF staff estimates and projections.
Note: … = not available.1 Excludes re-exports and imports for re-export. 2 Projections for short-term capital include estimates to adjust for the trend in errors and omissions.
ProjectionsProgram
(Percent of GDP, unless otherwise indicated)
(Billions of CFA francs)
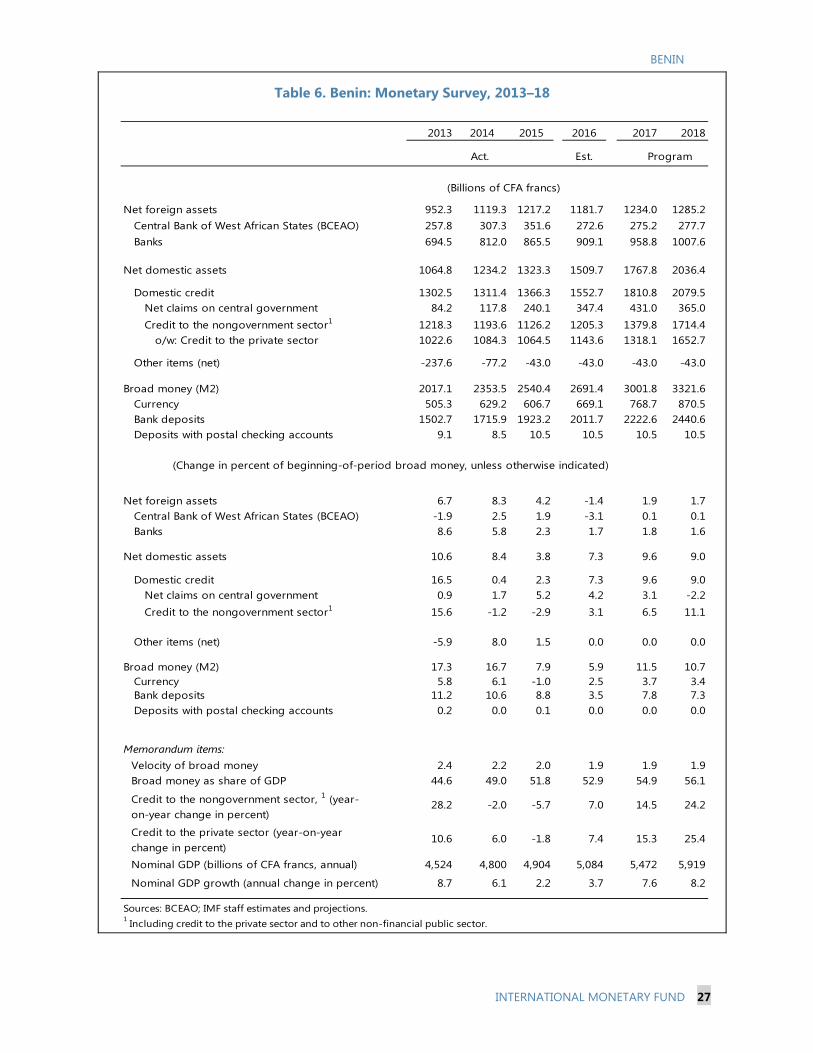
BENIN
INTERNATIONAL MONETARY FUND 27
Table 6. Benin: Monetary Survey, 2013–18
2013 2016 2017 2018
Est.
Net foreign assets 952.3 1119.3 1217.2 1181.7 1234.0 1285.2 Central Bank of West African States (BCEAO) 257.8 307.3 351.6 272.6 275.2 277.7 Banks 694.5 812.0 865.5 909.1 958.8 1007.6
Net domestic assets 1064.8 1234.2 1323.3 1509.7 1767.8 2036.4
Domestic credit 1302.5 1311.4 1366.3 1552.7 1810.8 2079.5 Net claims on central government 84.2 117.8 240.1 347.4 431.0 365.0 Credit to the nongovernment sector1 1218.3 1193.6 1126.2 1205.3 1379.8 1714.4
o/w: Credit to the private sector 1022.6 1084.3 1064.5 1143.6 1318.1 1652.7
Other items (net) -237.6 -77.2 -43.0 -43.0 -43.0 -43.0
Broad money (M2) 2017.1 2353.5 2540.4 2691.4 3001.8 3321.6 Currency 505.3 629.2 606.7 669.1 768.7 870.5 Bank deposits 1502.7 1715.9 1923.2 2011.7 2222.6 2440.6 Deposits with postal checking accounts 9.1 8.5 10.5 10.5 10.5 10.5
Net foreign assets 6.7 8.3 4.2 -1.4 1.9 1.7 Central Bank of West African States (BCEAO) -1.9 2.5 1.9 -3.1 0.1 0.1 Banks 8.6 5.8 2.3 1.7 1.8 1.6
Net domestic assets 10.6 8.4 3.8 7.3 9.6 9.0
Domestic credit 16.5 0.4 2.3 7.3 9.6 9.0 Net claims on central government 0.9 1.7 5.2 4.2 3.1 -2.2 Credit to the nongovernment sector1 15.6 -1.2 -2.9 3.1 6.5 11.1
Other items (net) -5.9 8.0 1.5 0.0 0.0 0.0
Broad money (M2) 17.3 16.7 7.9 5.9 11.5 10.7 Currency 5.8 6.1 -1.0 2.5 3.7 3.4 Bank deposits 11.2 10.6 8.8 3.5 7.8 7.3 Deposits with postal checking accounts 0.2 0.0 0.1 0.0 0.0 0.0
Memorandum items:Velocity of broad money 2.4 2.2 2.0 1.9 1.9 1.9Broad money as share of GDP 44.6 49.0 51.8 52.9 54.9 56.1
Credit to the nongovernment sector, 1 (year-on-year change in percent)
28.2 -2.0 -5.7 7.0 14.5 24.2
Credit to the private sector (year-on-year change in percent)
10.6 6.0 -1.8 7.4 15.3 25.4
Nominal GDP (billions of CFA francs, annual) 4,524 4,800 4,904 5,084 5,472 5,919
Nominal GDP growth (annual change in percent) 8.7 6.1 2.2 3.7 7.6 8.2
Sources: BCEAO; IMF staff estimates and projections.1 Including credit to the private sector and to other non-financial public sector.
(Billions of CFA francs)
(Change in percent of beginning-of-period broad money, unless otherwise indicated)
2014 2015
ProgramAct.
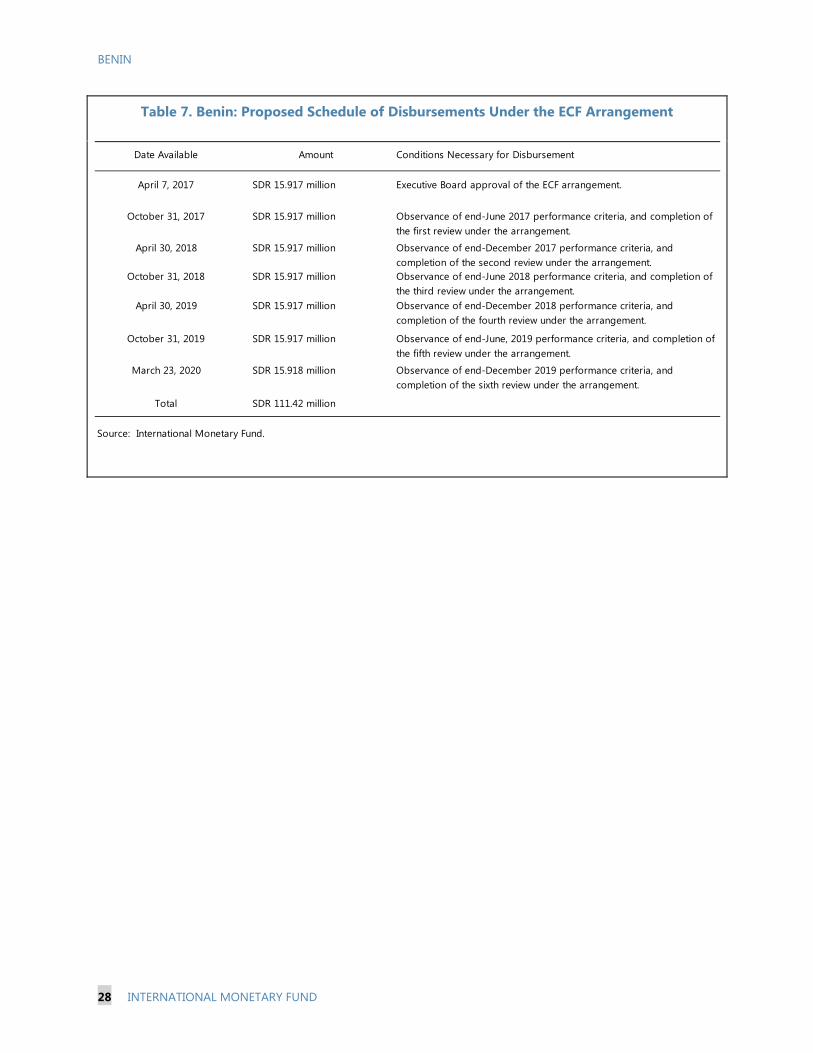
BENIN
28 INTERNATIONAL MONETARY FUND
Table 7. Benin: Proposed Schedule of Disbursements Under the ECF Arrangement
Date Available Amount Conditions Necessary for Disbursement
April 7, 2017 SDR 15.917 million Executive Board approval of the ECF arrangement.
October 31, 2017 SDR 15.917 million Observance of end-June 2017 performance criteria, and completion of the first review under the arrangement.
April 30, 2018 SDR 15.917 million Observance of end-December 2017 performance criteria, and completion of the second review under the arrangement.
October 31, 2018 SDR 15.917 million Observance of end-June 2018 performance criteria, and completion of the third review under the arrangement.
April 30, 2019 SDR 15.917 million Observance of end-December 2018 performance criteria, and completion of the fourth review under the arrangement.
October 31, 2019 SDR 15.917 million Observance of end-June, 2019 performance criteria, and completion of the fifth review under the arrangement.
March 23, 2020 SDR 15.918 million Observance of end-December 2019 performance criteria, and completion of the sixth review under the arrangement.
Total SDR 111.42 million
Source: International Monetary Fund.
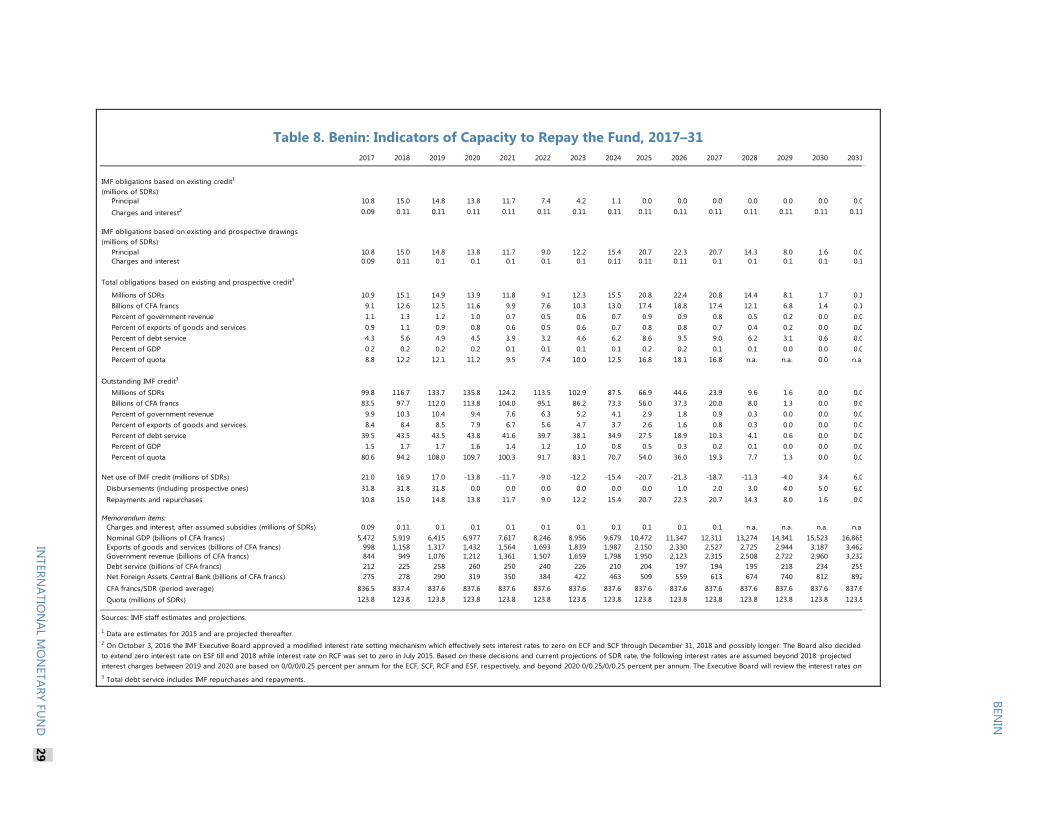
Table 8. Benin: Indicators of Capacity to Repay the Fund, 2017–31
2017 2018 2019 2020 2021 2022 2023 2024 2025 2026 2027 2028 2029 2030 2031
Principal 10.8 15.0 14.8 13.8 11.7 7.4 4.2 1.1 0.0 0.0 0.0 0.0 0.0 0.0 0.0
Charges and interest2 0.09 0.11 0.11 0.11 0.11 0.11 0.11 0.11 0.11 0.11 0.11 0.11 0.11 0.11 0.11
Principal 10.8 15.0 14.8 13.8 11.7 9.0 12.2 15.4 20.7 22.3 20.7 14.3 8.0 1.6 0.0Charges and interest 0.09 0.11 0.1 0.1 0.1 0.1 0.1 0.11 0.11 0.11 0.1 0.1 0.1 0.1 0.1
Millions of SDRs 10.9 15.1 14.9 13.9 11.8 9.1 12.3 15.5 20.8 22.4 20.8 14.4 8.1 1.7 0.1Billions of CFA francs 9.1 12.6 12.5 11.6 9.9 7.6 10.3 13.0 17.4 18.8 17.4 12.1 6.8 1.4 0.1Percent of government revenue 1.1 1.3 1.2 1.0 0.7 0.5 0.6 0.7 0.9 0.9 0.8 0.5 0.2 0.0 0.0Percent of exports of goods and services 0.9 1.1 0.9 0.8 0.6 0.5 0.6 0.7 0.8 0.8 0.7 0.4 0.2 0.0 0.0Percent of debt service 4.3 5.6 4.9 4.5 3.9 3.2 4.6 6.2 8.6 9.5 9.0 6.2 3.1 0.6 0.0Percent of GDP 0.2 0.2 0.2 0.2 0.1 0.1 0.1 0.1 0.2 0.2 0.1 0.1 0.0 0.0 0.0Percent of quota 8.8 12.2 12.1 11.2 9.5 7.4 10.0 12.5 16.8 18.1 16.8 n.a. n.a. 0.0 n.a.
Outstanding IMF credit3
Millions of SDRs 99.8 116.7 133.7 135.8 124.2 113.5 102.9 87.5 66.9 44.6 23.9 9.6 1.6 0.0 0.0Billions of CFA francs 83.5 97.7 112.0 113.8 104.0 95.1 86.2 73.3 56.0 37.3 20.0 8.0 1.3 0.0 0.0Percent of government revenue 9.9 10.3 10.4 9.4 7.6 6.3 5.2 4.1 2.9 1.8 0.9 0.3 0.0 0.0 0.0Percent of exports of goods and services 8.4 8.4 8.5 7.9 6.7 5.6 4.7 3.7 2.6 1.6 0.8 0.3 0.0 0.0 0.0Percent of debt service 39.5 43.5 43.5 43.8 41.6 39.7 38.1 34.9 27.5 18.9 10.3 4.1 0.6 0.0 0.0Percent of GDP 1.5 1.7 1.7 1.6 1.4 1.2 1.0 0.8 0.5 0.3 0.2 0.1 0.0 0.0 0.0Percent of quota 80.6 94.2 108.0 109.7 100.3 91.7 83.1 70.7 54.0 36.0 19.3 7.7 1.3 0.0 0.0
Net use of IMF credit (millions of SDRs) 21.0 16.9 17.0 -13.8 -11.7 -9.0 -12.2 -15.4 -20.7 -21.3 -18.7 -11.3 -4.0 3.4 6.0Disbursements (including prospective ones) 31.8 31.8 31.8 0.0 0.0 0.0 0.0 0.0 0.0 1.0 2.0 3.0 4.0 5.0 6.0Repayments and repurchases 10.8 15.0 14.8 13.8 11.7 9.0 12.2 15.4 20.7 22.3 20.7 14.3 8.0 1.6 0.0
Memorandum items:Charges and interest, after assumed subsidies (millions of SDRs) 0.09 0.11 0.1 0.1 0.1 0.1 0.1 0.1 0.1 0.1 0.1 n.a. n.a. n.a. n.a.Nominal GDP (billions of CFA francs) 5,472 5,919 6,415 6,977 7,617 8,246 8,956 9,679 10,472 11,347 12,311 13,274 14,341 15,523 16,865Exports of goods and services (billions of CFA francs) 998 1,158 1,317 1,432 1,564 1,693 1,839 1,987 2,150 2,330 2,527 2,725 2,944 3,187 3,462Government revenue (billions of CFA francs) 844 949 1,076 1,212 1,361 1,507 1,659 1,798 1,950 2,123 2,315 2,508 2,722 2,960 3,232Debt service (billions of CFA francs) 212 225 258 260 250 240 226 210 204 197 194 195 218 234 255Net Foreign Assets Central Bank (billions of CFA francs) 275 278 290 319 350 384 422 463 509 559 613 674 740 812 892
CFA francs/SDR (period average) 836.5 837.4 837.6 837.6 837.6 837.6 837.6 837.6 837.6 837.6 837.6 837.6 837.6 837.6 837.6Quota (millions of SDRs) 123.8 123.8 123.8 123.8 123.8 123.8 123.8 123.8 123.8 123.8 123.8 123.8 123.8 123.8 123.8
Sources: IMF staff estimates and projections.
IMF obligations based on existing and prospective drawings(millions of SDRs)
Total obligations based on existing and prospective credit3
1 Data are estimates for 2015 and are projected thereafter.
3 Total debt service includes IMF repurchases and repayments.
IMF obligations based on existing credit1
(millions of SDRs)
2 On October 3, 2016 the IMF Executive Board approved a modified interest rate setting mechanism which effectively sets interest rates to zero on ECF and SCF through December 31, 2018 and possibly longer. The Board also decided to extend zero interest rate on ESF till end 2018 while interest rate on RCF was set to zero in July 2015. Based on these decisions and current projections of SDR rate, the following interest rates are assumed beyond 2018: projected interest charges between 2019 and 2020 are based on 0/0/0/0.25 percent per annum for the ECF, SCF, RCF and ESF, respectively, and beyond 2020 0/0.25/0/0.25 percent per annum. The Executive Board will review the interest rates on
BENIN
INTERN
ATION
AL MO
NETARY FU
ND
29

BENIN
30 INTERNATIONAL MONETARY FUND
Table 9. Benin: Summary of the Government External Borrowing Program for 2017-19 (US$ million)
2018 2019Projections Present Value Projections Projections
Source of debt financing 1,100.3 679.6 397.1 257.9
Concesstional debt 815.3 470.8 397.1 257.9Multilateral debt1 344.7 179.2 174.8 105.5Bilateral debt 80.6 49.8 61.5 40.8Other 390.0 241.8 160.7 111.6
Non Concessional debt 285.0 - -Multilateral debt1 285.0 208.9 0.0 0.0Bilateral debt 0.0 0.0 0.0 0.0
Utilization of the amount borrowedBudgetary financing 64.5 6.0 9.1 5.0Infrastructure 287.7 26.0 110.4 64.8Social spending 80.6 7.0 47.2 41.6Other 667.5 60.7 114.3 77.6
Source: Benenise authorities1The IMF financing is excluded
2017

BENIN
INTERNATIONAL MONETARY FUND 31
Table 10. Benin: Risk Assessment Matrix1
1/ The Risk Assessment Matrix (RAM) shows events that could materially alter the baseline path (the scenario most likely to materialize in the view of IMF staff). The relative likelihood of risks listed is the staff’s subjective assessment of the risks surrounding the baseline (“low” is meant to indicate a probability below 10 percent, “medium” a probability between 10 and 30 percent, and “high” a probability between 30 and 50 percent). The RAM reflects staff views on the source of risks and overall level of concern as of the time of discussions with the authorities. Non-mutually exclusive risks may interact and materialize jointly.
Source of Risks Relative Likelihood
Impact if Realized Recommended Policy Response
External Risks Significant slowdown in EMs/frontier economies and China.
Medium Medium Lower export demand may reduce revenue and net export and increase fiscal risks. Tighter or more volatile global financial conditions could increase funding costs for the 2016–21 Government Action Plan.
Improve business environment to support diversification. Rebuild fiscal buffers through domestic revenue mobilization.
Implement prudent public investment plans.
Structurally weak growth in key advanced and emerging economies.
High/Medium Medium/High Adverse impact on growth through less foreign direct investment inflows.
Retreat from cross-border integration.
High Medium/High Reversals in policy coordination could reduce international aid, trade flows, and impede export market access.
Strengthen regional bond markets and trade secondary markets. Reduce fiscal exposure, including consolidation of fiscal revenue collection.
Adverse developments in Nigeria.
Medium High Trade liberalization or adverse security situation reduces trade revenues, and growth; cutting subsidy can cause fuel price spikes.
Improve business environment to support private sector growth and diversification. Boost domestic revenue to reduce dependency.
Domestic Risks
Adverse weather conditions. Medium High Adverse impact on agricultural output and exports that could affect the standards of living of the population, lower tax revenues, increase the need to expand subsidies.
On the short run, relax the fiscal position to mitigate the impact on poor sectors of the population through targeted spending. On the medium run, monitor potential effects on inflation. On the long run, diversify the economy.
Sharp rise in risk premia and the cost of debt.
High
High Higher costs of borrowing for government and business reduce economic activities.
Rely predominantly on concessional financing; optimize debt portfolio; Adjust investment level, if necessary; Improve business environment, including by reform financial sector reform; Improve tax payer service and reduce tax distortion.
Protracted uncertainty regarding institutional reforms.
Medium High Delays in reforms and business environment constraints can affect investors’ confidence and undermine business growth.

BENIN
32 INTERNATIONAL MONETARY FUND
Table 11. Benin: Financial Soundness Indicators, 2011–16
2011 2012 2013 2014 2015 2016Jun.
Regulatory capital to risk-weighted assets 12.5 12.8 12.9 12.7 12.6 11.4Core capital to risk-weighted assets1 11.7 11.9 11.8 11.2 10.5 10.3Provisions to risk-weighted assets 10.7 10.8 10.3 10.7 11.7 10.6Capital to total assets 7.3 7.3 7.2 6.7 5.7 6.1
Composition and quality of assets Total loans to total assets 55.2 55.0 55.9 54.6 53.1 52.5 Concentration: Credit to the 5 largest borrowers 92.9 92.3 75.1 88.6 113.1 100.9 (in terms of total capital)
Credit by sector2 Agriculture, Forestry, and Fishing 2.9 2.6 2.9 3.1 3.2 2.6 Extractive Industries 2.2 1.6 1.8 2.0 2.0 1.8 Manufacturing 18.8 18.2 17.0 17.9 17.2 16.7 Electricity, Water, and Gas 3.2 3.2 3.7 3.9 4.2 4.1 Buildings and Public Works 6.7 6.7 7.8 8.7 9.4 10.0 Commerce, Restaurants, and Hotels 32.3 34.7 33.5 31.1 31.5 30.6 Transportation and Communication 11.2 10.0 11.2 9.3 9.5 10.9 Financial and Business Services 5.5 6.1 6.0 6.5 6.6 7.1 Other Services 17.2 16.8 16.2 17.0 16.4 16.2
Non-Performing Loans (NPLs) Gross NPLs to Total loans3 15.9 16.0 15.5 14.4 14.4 15.2 Provisioning rate 64.2 63.4 61.0 62.8 62.8 63.9 Net NPLs to total loans 6.4 6.5 6.6 6.1 5.9 6.1 Net NPLs to capital 47.8 48.8 51.1 50.0 54.9 52.7
Earnings and profitability4 Average cost of borrowed funds 2.4 2.5 2.8 2.4 2.4 … Average interest rate on loans 9.7 9.8 10.7 9.1 2.4 …
Average interest margin5 7.3 7.3 7.9 6.7 6.4 … After-tax return on average assets (ROA) 1.2 0.9 0.9 1.1 1.2 … After-tax return on average equity (ROE) 13.7 10.1 11.5 15.5 16.4 … Noninterest expenses/net banking income 61.6 61.0 60.7 58.6 58.6 … Salaries and wages/net banking income 26.4 25.7 26.5 25.4 25.4 …
Liquidity Liquid assets to total assets 33.6 32.5 32.2 30.9 29.4 27.6 Liquid assets to total deposits 46.1 45.8 46.1 45.9 43.8 41.1 Total loans to total deposits 84.3 86.2 90.0 89.5 87.0 86.4 Total deposits to total liabilities 72.9 71.1 68.5 63.4 67.1 67.4 Demand deposits to total liabilities6 37.8 36.5 35.5 34.5 35.4 35.2 Term deposits to total liabilities 35.1 34.6 33.0 32.8 31.7 32.2
Source: BCEAO.Note: … = not available.1 Tier 1 Capital.2 Identified sectors represent at least 80 percent of credit
4 Some account elements available semi-annually. 5 Excluding taxes on banking operations.6 Including savings accounts.
3 The improvement of NPLs since 2014 includes the reduced exposure by several banks to a business group that encountered difficulties in 2012-14.
(Percent unless otherwise indicated)

BENIN
INTERNATIONAL MONETARY FUND 33
Annex I. Benin: Government’s Action Program, 2016–21
The Beninese authorities have launched an ambitious Government’s Action Program (GAP) to be implemented during the President’s term (2016–21). The program is aimed at boosting investment (public and private) to bring about a structural transformation of the economy. 1. The Council of Ministers adopted the GAP on October 26, 2016 and presented it to the public in December 2016. It presents a five-year public investment program worth CFAF 9,039 billion (US$15.3 billion or 170 percent of GDP). The GAP is inspired by then presidential candidate Talon’s vision for Benin (The New Start—Nouveau Départ). It focuses on three pillars: (i) strengthen democracy, the rule of law, and good governance; (ii) foster the structural transformation of the economy; and (iii) improve the living conditions of the population. The GAP seeks to develop the potential for higher domestic value-added in the agriculture and tourism sectors, identified as major potential sources of growth. It recognizes the importance of improving the quality of education and strengthening basic social services and social protection. Public and private investments focus on infrastructure (27 percent), energy (11 percent), agriculture, and tourism (9 percent each). The orientation of the GAP is in line with the 2030 Agenda for Sustainable Development and the 2015 Paris Climate Conference (COP21). 2. Funding of the GAP relies heavily on PPPs. Some 61 percent of the funds are expected from the private sector in the form of PPPs and 39 percent from public resources, including grants and borrowing (CFAF 3,525 billion). The PPP funding is projected to build up gradually and peak in 2019 at about 28 percent of GDP; the public contribution would start off high in 2017 at 14 percent of GDP decreasing gradually to 7 percent by 2021.
3. The GAP aims to redirect public resources from current to capital spending. The GAP assumes that available resources are gradually reoriented towards capital expenditures while efforts are made to improve the quality of spending and strengthen procurement procedures.
4. An enabling environment for increased private sector involvement. Besides passage of the PPP Law, the GAP envisages a range of structural reforms to improve the business environment. These include measures to boost financial sector development and advance reforms in health, education, and the judiciary.
Source: Beninese authorities.

BENIN
34 INTERNATIONAL MONETARY FUND
5. The medium-term investment outlook underpinning the GAP was overly ambitious and could have led to unsustainable debt. The scaling up of public investment equivalent to 10.4 percent of GDP annually (Text Table 1) would result in fiscal deficits (excluding grants) averaging 8.8 percent over a six-year period. Public debt would peak at 62.5 percent of GDP in 2020, pushing the risk of external debt distress from low to high. While the impact on inflation would be marginal because most capital goods will be imported, higher imports of capital goods would worsen the current account deficit, which would average 12.7 percent of GDP over 2016–21. 6. Based on these considerations, the authorities agreed to scale back their investment envelope under the program for 2017–19. The envelope for the three years was reduced from about CFAF 2,254 billion to CFAF 1,400 billion to preserve debt sustainability.
Text Table 1. Benin: Key Macroeconomic Indicators Under the GAP, 2016–19
2016 2017 2018 2019 2020 2021 Act.
Real GDP 4.0 5.1 6.0 6.3 6.3 6.3
Inflation -0.8 3.0 4.6 4.7 4.7 4.7
Public Investment 5.9 14.3 11.6 10.3 9.0 6.7Total Revenues 14.7 15.3 15.5 15.8 15.8 15.8Fiscal Deficit (excl. grants) -6.7 -13.9 -10.4 -8.6 -7.4 -5.2Basic Primary Balance -3.0 -7.9 -5.0 -3.0 -2.2 -0.3Current Account (excl. grants) -7.2 -14.4 -13.6 -14.1 -13.1 -12.0Non-Financial Public Sector Debt 50.3 57.2 60.9 62.3 62.5 61.5
Source: IMF staff estimates and projections.
(Percent)
(Percent of GDP)
1/The debt-to-GDP ratio is consistent with a threshold of 56 percent of net present value of total public debt to GDP.
Proj.

BENIN
INTERNATIONAL MONETARY FUND 35
Annex II. Benin: Managing Fiscal Costs and Risks from Public-Private Partnerships (PPPs)
The Beninese authorities are seeking larger private sector involvement through PPPs, in the context of the Government’s Action Program, 2016–21. This note proposes operational guidelines for addressing issues related to PPPs and the associated fiscal risks for Benin. More specifically, it focuses on three key questions: (i) challenges pose by PPPs; (ii) fiscal risks associated with PPPs, and (iii) evaluation of potential fiscal costs of PPPs.
1. PPPs could be a good opportunity to tackle both infrastructure gap and financing constraints Benin is facing. In general, PPPs are long-term contracts under which the private sector supplies goods and infrastructure services traditionally provided by the government. PPPs can also increase efficiency and productivity through improved project design and higher quality services, and can serve as an appropriate guarantee over time. As Benin is facing both infrastructure gap and financing constraints, PPPs present prospects and could be a strong catalyst to implement their development’s objectives. In addition, PPPs can also make it possible for Benin to withdraw from day-to-day management activities in order to focus on expected outputs and results. 2. However, PPPs can also bear fiscal risks that must be assessed. PPPs are difficult to organize and manage because they necessitate complex financial arrangements and public sector capacity building. They also entail high transaction costs (structuring, contracting, contract management, possible renegotiations, handling of cancellations). In addition, PPPs can be unduly perceived as costless infrastructures because (i) they are an appealing option, particularly when the government lacks financing and is trying hard to achieve its fiscal objectives, (ii) they allow the government to defer expenditure on infrastructures without, however, depriving the public of their benefits, and (iii) they increase investment without immediately raising the level of government debt. PPPs can entail major fiscal risks attributable to (a) off-budget expenditure not subject to controls, (b) off-balance sheet debt, (c) the creation of contingent and future liabilities. These risks can limit fiscal flexibility in the long term owing to unexpected fiscal costs (if infrastructure projects are largely disproportionate to the country’s available resources or the private operator declares bankruptcy and seeks government assistance), and can jeopardize macroeconomic viability, especially debt sustainability. 3. Benin should follow good international practices to manage the fiscal risks associated with PPPs. The impact of the fiscal risks associated with PPP operations depends on several factors: (i) the economic ownership of the PPP asset (whether the asset is held or controlled by the private partner or is procured by the public sector), (2) to what extent the budgeting, accounting, and reporting of PPPs are consistent with best international practices. Beninese authorities can manage the risks associated with PPPs by following best practices (in line with the principles set out in international standards). In particular, they should fully and transparently disclose all fiscal risks associated with PPPs through proper budgeting, accounting, and reporting.

BENIN
36 INTERNATIONAL MONETARY FUND
4. PPP budgeting. First, if the PPP asset is considered public, the PPP should be included in the budget and in the medium-term fiscal framework in the same way as traditional public investments. However, if the PPP asset is considered private, the charges the government pays for services should be included in the budget and in the medium-term fiscal framework. Second, the selection and prioritization of investment projects should be based on cost-benefit analyses and a good quality/price ratio. Third, the monitoring and reporting of the fiscal risks must be associated with PPPs by disclosing such risks in a document attached to the budget. 5. PPP accounting. It is recommended that the International Public Sector Accounting Standards (IPSAS 32) be applied throughout the life cycle of a PPP project:
The construction phase. For all PPPs, the government recognizes an asset and a financial liability in the same amount (for example, construction costs). The result is an increase in the commitment-basis deficit owing to the capital expenditure, and an equivalent increase in gross debt. However, there will be no impact on the cash-basis deficit.
The operational phase. The accounting depends on the type of PPP project. In particular, if the PPP project is (i) financed by the state, the government’s expenses will consist of the depreciation of the asset (fixed capital consumption), finance charges, and payment for the services provided by the operator (use of goods and services) and its financing the payment of finance charges and debt retirement. The cash-basis deficit will increase by the same amount as the expenses; (ii) if the project is a concession, the government’s expenses will consist of the depreciation of the asset and its income the revenues accumulated during the term of the contract. In terms of financing, the amount of debt retirement will equal the amount of revenue. However, the cash-basis deficit will not be impacted.
The final phase or completion of the contract. The accounting depends on the type of PPP project, particularly if:
The PPP asset is considered private: (i) transfer of the asset to the government’s balance sheet, (ii) increase in revenue (transfer received), (iii) increase in expenditure (acquisition of a nonfinancial asset), (iv) the deficit remains unchanged.
The PPP asset is considered public: no change because the asset has already been recognized in the government’s balance sheet.
6. PPP reporting. PPP statistics are reported in accordance with international standards, such as those found in the Government Finance Statistics Manual (GFSM 2014) and in the Public Sector Debt Guidelines (PSDG 2011). During the transition to best reporting practices, governments should aim to reduce moral hazard by fully disclosing the known and potential costs of “all” PPPs in the analysis of the medium-term fiscal framework and debt sustainability, regardless of how such costs are classified. In particular, the following information should be compiled for each PPP project:

BENIN
INTERNATIONAL MONETARY FUND 37
Future payment obligations/revenues (1–5 years, 5–10 years, 10–20 years, >20 years).
Key provisions of the contract that can affect the amount, timing, and certainty of budget cash flows.
Obligations borne by the government or public financial institutions/enterprises.
Arrangements for the transfer of assets upon completion of the contract.
All project financing or off-balance sheet items, such as contingent liabilities incurred by entities owned or controlled by the government.
7. Going forward, Benin’s main priorities are to adequately tackle the potential fiscal costs and risks associated with PPPs. First, the authorities should seek the help of World Bank’s assistance to strengthen their PPP legal and institutional framework in order to (i) better assess fiscal risk stemming from each PPP project; and (ii) enhance planning, review, approval and monitoring of PPP projects for each of the institutions handling public investment. Second, authorities can request technical assistance with the aim of (i) undertaking a Public Investment Management Assessment (PIMA) of practices and institutional capacity related to public investment management; and (ii) assisting Beninese authorities with a PPP Fiscal Assessment Model (PFRAM), developed by the IMF and World Bank, to take an inventory of and monitor fiscal risks stemming from PPP projects.

BENIN
38 INTERNATIONAL MONETARY FUND
Annex III. Benin: Capacity Development Strategy for FY 2017
The authorities are seeking an ECF supported program with the Fund and, hence, they would like to successfully implement economic and financial programs discussed with the IMF for which TA could be critical. The capacity building program in Benin and the associated technical assistance delivery are intrinsically interweaved with surveillance and program priorities.
Overall Assessment of Capacity Development 1. As a low income country, Benin faces capacity and institution building challenges, which are being addressed with tailored technical assistance. Enhancing domestic revenue mobilization (revenue administration and tax policy) and improving budget preparation and execution will be essential to preserve debt sustainability in the longer term. These key priorities will also require reforms to strengthen economic governance (public finance management systems) and improve real sector statistics, government, and external sector statistics, including, oversight of public enterprises and other public entities.
2. Program engagement has contributed in the past to build capacity in Benin. However, there have been highs and lows regarding TA implementation. Key achievements include the following:
Creation of a unique account for the treasury (2015), not yet fully implemented and
operational;
Increased capacity to formulate economic and financial policies under the ECF program,
including macroeconomic forecasts (2015–16);
Enhanced production of budget execution data and reports (2015–16); and
Initiation of reforms on customs administration, including risk management (2015–16)
TA implementation is being compromised by data gaps (lack of relevant and timely indicators), including poor data management and data analysis. Also, turnover of senior officials and technical-level staff has compromised absorption capacity and TA delivery. In addition, lack of appropriate infrastructure and institutional coordination—in particular, at customs and tax administrations—has impeded an effective technical delivery.
Forward Looking Priorities 3. The TA strategy for Benin should focus on revenue and customs administration, PFM—focusing on budget execution—debt management, national accounts, tax policy, and enhancing the quality of macroeconomic data. In particular,

BENIN
INTERNATIONAL MONETARY FUND 39
Public investment management, currently split into separate administrative units, needs to be streamlined to ensure capacity building and efficiency/transparency in investment project selections and monitoring.
A state-owned enterprise unit was recently created but oversight remains weak and still need to be strengthened and consolidated.
Related to budget execution control and external audit including full implementation of the Court of Auditors, the internal audit and control methods need also to be strengthened by using professional standards and systematic risk-based approach.
4. For FY 2017, key priorities and objectives include:
PRIORITIES OBJECTIVES
Tax Administration Minimize tax expenditures and simplify taxes
Customs Administration Improve management and governance
Public Financial Management Strengthen budget execution and control
Statistics National account: update base year and move to 2008 SNA; government finance: expand to general government: external statistics: improve current and financial account
Dissemination of statistics Implement e-GDDS (launched in late February 2017)
The main risk to capacity development is weak absorptive capacity, which could be mitigated by carefully selecting and designing the TA programs to tailor to the local audience’s need.
Authorities’ Views 5. The authorities agree with the thrust of the capacity development strategy. In particular, they consider that the strategy and objectives are appropriately formulated for the country and in line with the strategic orientations of the Government’s Action Program, 2016–21 unveiled by the authorities in December 2016.
Furthermore, in light of the current absorption capacity of technical assistance, the authorities have recommended to adjust its volume and mid-term priorities appropriately to attain an efficient delivery.

BENIN
40 INTERNATIONAL MONETARY FUND
Benin—Three-Year Arrangement Under the Extended Credit
Facility
Attached hereto is a letter dated March 23, 2017 (the “Letter”) from the Minister of the Economy and Finance of Benin, with its attached Memorandum of Economic and Financial Policies (the “MEFP”) and Technical Memorandum of Understanding (the “TMU”), requesting from the International Monetary Fund, as Trustee of the Poverty Reduction and Growth Trust (the “Trustee”), a three-year arrangement under the Extended Credit Facility (“ECF”), and setting forth:
(a) the objectives and policies of the program that the authorities of Benin intend to pursue during the three-year period of the arrangement;
(b) the objectives, policies and measures that the authorities of Benin intend to pursue during
the first year of the arrangement; and
(c) understandings of Benin with the Trustee regarding reviews that will be made of progress in realizing the objectives of the program and of the policies and measures that the authorities of Benin will pursue during the second and third years of the arrangement.
To support these objectives and policies, the Trustee grants the requested three-year arrangement in accordance with the following provisions, and subject to the provisions applying to assistance under the Poverty Reduction and Growth Trust (the “PRG Trust”) including in particular Section II, paragraph 1(b)(4) of the PRG Trust instrument annexed to Decision No. 8759-(87/176) ESAF, as amended.
1. (a) For a period of three years from the date of approval of this arrangement, Benin will have the right to obtain disbursements from the Trustee in a total amount equivalent to SDR 111.42 million, subject to the availability of resources in the PRG Trust.
(b) Disbursements under this arrangement shall not exceed the equivalent of SDR 31.834 million during the first 12 months of the arrangement, and the equivalent of SDR 63.668 million during the first 24 months of the arrangement.
2. During the period of the arrangement:
(a) the first disbursement, in an amount equivalent to SDR 15.917 million, will be available upon
approval of the arrangement, at the request of Benin;
(b) the second disbursement, in an amount equivalent to SDR 15.917 million, will be available on or after October 31, 2017 at the request of Benin and subject to paragraphs 4 and 5 below;

BENIN
INTERNATIONAL MONETARY FUND 41
(c) the third disbursement, in an amount equivalent to SDR 15.917 million, will be available on
or after April 30, 2018, at the request of Benin and subject to paragraphs 4 and 5 below.
3. The right of Benin to request further disbursements during the second and third years of this arrangement shall be subject to such phasing and conditions as shall be determined in the context of reviews under the ECF arrangement for Benin.
4. Benin will not request: A. The second or third disbursements under this arrangement specified in paragraphs 2(b) and 2(c) above, respectively:
(a) if the Managing Director of the Trustee finds that, with respect to the second disbursement, the data as of June 30, 2017, and with respect to the third disbursement, the data as of December 31, 2017, indicate that: (i) the ceiling on the net domestic financing of the government; (ii) the floor on the basic primary balance (excluding grants); or (iii) the floor on the total government revenue,
as set out in Table 1 of the MEFP, and further specified in the TMU, was not observed; or (b) until the Trustee has determined that, with respect to the second disbursement, the first
program review, and with respect to the third disbursement, the second program review, referred to in paragraph [50] of the MEFP has been completed.
5. Benin will not request a disbursement under this arrangement if at any time during the period of this arrangement: (a) the ceiling on the accumulation of external payments arrears;
(b) the ceiling on the present value of new external debt contracted or guaranteed by the
government;
(c) the ceiling on the accumulation of domestic payments arrears; or
(d) the ceiling on government pre-financing contracts for public investments, as set out in Table 1 of the MEFP, and as further specified in the TMU, is not observed, or

BENIN
42 INTERNATIONAL MONETARY FUND
(e) Benin: (i) imposes or intensifies restrictions on the making of payments and transfers for
current international transactions, or
(ii) introduces or modifies multiple currency practices, or
(iii) concludes bilateral payments agreements that are inconsistent with Article VIII, or
(iv) imposes or intensifies import restrictions for balance of payments reasons. 6. When Benin is prevented from requesting disbursements under this arrangement because of
paragraphs 4 and 5 above, such disbursements may be made available only after consultation has taken place between the Trustee and Benin and understandings have been reached regarding the circumstances in which Benin may request the disbursements.
7. In accordance with Paragraphs 5 and 6 of the Letter, Benin will provide the Trustee with such information as the Trustee requests in connection with the progress of Benin in implementing the policies and reaching the objectives of the program supported by this arrangement.
8. During the period of this arrangement, Benin shall remain in close consultation with the Trustee.
In accordance with Paragraph 5 of the Letter, Benin shall consult with the Trustee on the adoption of any measures that may be appropriate at the initiative of the government or whenever the Managing Director of the Trustee requests such a consultation. Moreover, after the period of this arrangement and while Benin has outstanding financial obligations to the Trustee arising from loan disbursements under this arrangement, Benin will consult with the Trustee from time to time, at the initiative of the government or whenever the Managing Director of the Trustee requests consultation on Benin’s economic and financial policies. These consultations may include correspondence and visits of officials of the Trustee to Benin or of representatives of Benin to the Trustee.

BENIN
43
Appendix I. Letter of Intent
Cotonou, March, 23 2017
Madame Christine Lagarde Managing Director International Monetary Fund 700 19th Street, N.W. Washington, D.C. 20431 USA
Dear Madame Managing Director:
In March 2016, following transparent elections, Mr. Patrice Talon was elected President of Benin. In April 2016 he formed a reduced government consisting of 21 members. The 65 percent share of the votes that he received has granted him the opportunity to turn his single term into five years of economic recovery. The people have thus given him a clear mandate for implementing his vision for the country, which was outlined in his New Beginning election campaign. This vision was articulated in the Government’s Action Program (GAP) for 2016–21, which the government adopted and the President introduced publicly on December 16, 2016.
The implementation of the GAP is occurring in a challenging environment marked by the effects of the recession in Nigeria on the national economy and the fiscal slippages of the previous administration. It is with the aim of maximizing the prospects for success of the GAP that we are asking for support from the International Monetary Fund within the framework of a three-year arrangement under the Extended Credit Facility (ECF).
The Memorandum of Economic and Financial Policies (MEFP) attached herewith presents the economic and financial policies, as well as the structural reforms, that the Beninese government intends to implement over the next three years (2017–19). They are aimed at bringing about an in-depth transformation of Benin’s economy through sustainable and inclusive growth, while maintaining macroeconomic stability and the sustainability of public debt. The emphasis is on: (a) the creation of fiscal space through increased mobilization of domestic resources and more effective public spending; (b) strengthening of our capacity to prepare for and implement effective public investments; and (c) measures aimed at improving the business climate and enabling the private sector to benefit from new infrastructure so that it can develop and create jobs for young people, whose numbers are growing rapidly.
BENIN
44
With the aim of helping to achieve the objectives of this program, the government is asking that the IMF provide a three-year arrangement under the ECF in an amount equivalent to SDR 111.42 million (US$150 million). This arrangement will serve as an anchor for the government’s macroeconomic policies and as a catalyst for financial assistance from Benin’s technical and financial partners.
The government believes that the measures and policies outlined in the attached MEFP are adequate to achieve the objectives of its program. It will undertake all additional measures that may become appropriate to this end. It will consult with the Fund regarding the adoption of such measures and prior to any revision of the policies outlined in the attached MEFP, in accordance with the Fund’s policies on such consultation.
The government will furnish IMF staff with all of the information mentioned in the Technical Memorandum of Understanding (“the Memorandum”) as provided in the attachment so that they can evaluate the progress made in the implementation of the economic program supported by the ECF. In addition, the government undertakes to discuss with IMF staff any other economic or financial matters related to the program, and in particular the drafting of the annual budget laws.
The government intends to make public the content of the IMF staff report, including this letter, the attached MEFP, the Memorandum, and the debt sustainability analysis performed by IMF and World Bank staff. Accordingly, it authorizes the IMF to publish these documents on its external website following approval of the new ECF arrangement by the IMF Executive Board.
Very truly yours,
/s/ Mr. Romuald Wadagni Minister of the Economy and Finance
Attachments (2): I. Memorandum of Economic and Financial Policies II. Technical Memorandum of Understanding

BENIN
INTERNATIONAL MONETARY FUND 45
Attachment I. Memorandum of Economic and Financial Policies for 2017–19
RECENT ECONOMIC DEVELOPMENTS AND THE GOVERNMENT’S ACTION PROGRAM
A. Macroeconomic Developments in 2015 and 2016
1. The stability of the domestic environment and favorable international conditions of thepast few years enabled Benin to achieve relatively dynamic growth rates (6 percent on average between 2012 and 2014), while inflation remained moderate. Nevertheless, in 2015 there was a significant slowdown in this growth, due primarily to contagion effects from the recession that hit Nigeria, Benin’s main trading partner. Furthermore, the steep increase in public spending, driven largely by the presidential elections that were held in March 2016, led to a substantial rise in the budget deficit, which almost tripled between 2014 and 2015. Economic growth nevertheless strengthened in 2016 and reached 4 percent thanks to the solid performance of the agricultural sector. The level of activity in the industrial sector, and to an even greater extent in the trade sector, is still being affected by the Nigerian recession and the depreciation of the naira.
2. The solid macroeconomic performance reported from 2012 to 2014 did not lead to areduction in poverty in Benin. On the contrary, according to the National Institute of Statistics and Economic Analysis (INSAE), the proportion of the population living below the poverty line rose from 36.2 percent in 2011 to 40.1 percent in 2015. Poverty reduction therefore remains a major challenge that should spur political reforms and the redirection of public finances that the government is committed to implementing within the framework of this program for which it is requesting support from the IMF under the Extended Credit Facility (ECF).
3. Inflation has remained moderate in spite of the rise in prices for petroleum productscoming from Nigeria. Refined petroleum products sold to Benin, for the most part imported from Nigeria through informal channels, experienced a rise in prices following the decision by the Nigerian authorities to reduce subsidies for petroleum products. The impact of this policy on the overall level of prices in Benin was largely offset, however, by a decline in the value of the Nigerian currency, in particular in the parallel market.
4. In terms of public finances, the execution of the revised budget for 2016, which wasapproved by the parliament in July, had mixed results. While efforts were agreed upon to contain current spending, a sharper decline in revenues, in particular customs revenues, led to a budget deficit (excluding grants) of 6.7 percent of GDP, 1.6 percentage points of GDP higher than budgeted. The current account deficit remained broadly stable between 2014 and 2015, in spite of the expansionary fiscal policy pursued by the government in 2015.
BENIN
46 INTERNATIONAL MONETARY FUND
B. The Government’s Action Program for 2016–21
5. On October 26, 2016, the Council of Ministers adopted the Government’s Action Program(GAP) for 2016–21, which was unveiled by the President to the nation on December 16, 2016. The GAP is based on President Talon’s vision for Benin (Nouveau départ—New Beginning), which was discussed during the election campaign. It is centered around three pillars: (i) consolidation of democracy, the rule of law, and good governance; (ii) launching the structural transformation of the economy; and (iii) improving the living conditions of the population. The GAP is aimed at developing the potential for growth in value added in agriculture and tourism, which are identified as the main potential sources of growth. It recognizes the key importance of improving the quality of education as a determining factor in raising the productivity of the workforce. The strengthening of basic social services and social protection are also important goals. The focus of the GAP is in line with the 2030 Agenda for Sustainable Development and the 2015 Paris Climate Conference (COP21).
6. Along with the efforts undertaken to focus spending on investment and to mobilize moredomestic revenues, efforts will be made to improve the quality of public spending by strengthening the selection, preparation, and execution of projects, and the procurement mechanism. The creation of a favorable environment for greater participation by the private sector is an essential component. To this end, a law on public-private partnerships (PPP) was passed by the parliament on October 11, 2016, and enacted by the government on October 24, 2016. The implementing decrees for the law in question have also been adopted. A series of structural reforms will allow for improvement of the business climate. These include measures aimed at improving the quality of governance in general and creating a favorable environment for the implementation of projects initiated in response to the results of economic and social assessments performed within the context of the drafting of the GAP. The GAP documentation, which is available on the government’s website, includes the complete version of the GAP, called “Bénin Révélé—Benin Revealed,” a summary of the program, as well as a portfolio of projects by sector, describing in details the Flagship Projects and the Priority Projects for the five-year period. The publication of these public investment project documents is unprecedented in Benin.
MEDIUM-TERM MACROECONOMIC OBJECTIVES AND POLICIES
A. Macroeconomic Objectives
7. The priorities of the economic program for 2017–19 are consistent with the strategicdirections of the GAP. It is aimed at boosting the mobilization of domestic revenues, improving the quality and effectiveness of public spending, and strengthening governance and institutions with a view to promoting the development of the private sector. The medium-term macroeconomic framework is focused on an acceleration of economic growth, but with a lower level of investment than that provided for under the GAP in order to ensure the sustainability of public debt. Inflation should remain moderate and at a level below the West African Economic and Monetary Union (WAEMU) convergence threshold of 3 percent. The medium-term fiscal
BENIN
INTERNATIONAL MONETARY FUND 47
program calls for an overall budget deficit (on a commitment basis, including grants) of 4.6 percent on average during the three years covered by the program. The achievement of the program goals would be supported by structural reforms aimed at: (a) creating more fiscal space through the modernization of the tax and customs administrations and improvement in the quality of public spending; (b) strengthening the management of public debt; and (c) improving the business climate. More generally, the Fund-supported should enable Benin to achieve sustained and inclusive growth with the aim of reducing poverty while ensuring the sustainability of public finances and debt. The financial assistance provided by the IMF under the ECF should also help the country to address the need for financing of its balance of payments.
8. Given the government’s strategy to redirect public spending to investment, efforts will bemade to protect the most vulnerable segments of the population. Accordingly, the government has made improved living standards for the population a priority in its program “Benin Revealed”. This program will entail a new policy on social safety nets and universal access to basic social services. In particular, the State will be responsible for ensuring social protection for the most disadvantaged members of society. In addition, the government will roll out a policy to support the creation of income-generating activities for members of public, to be implemented through ongoing training, entrepreneurship, and microcredit for the financing of specific projects. This component, focusing on improved living standards, is based on two strategic pillars, including strengthened basic social services and social protection.
9. To ensure the sustainability of public debt, the government is committed to maintainingtotal public debt, in terms of net present value, at a maximum of 50 percent of GDP, despite the higher threshold afforded to it by Benin’s moderate rating of its Country Policy and Institutional Assessment (CPIA). Maintaining public debt at this level will enable the government to substantially increase capital expenditures while broadly limiting the risk of financial crisis to which the country could be exposed. With this in mind, a debt sustainability analysis will be performed regularly. This exercise will include an analysis of fiscal risks associated with public-private partnerships (PPPs), the debt of state-owned enterprises (SOEs) after an audit and evaluation are completed, as well as guarantees issued by the government on behalf of SOEs. With the aim of reducing the burden of short-term debt service on public finances, the government will seek to extend the maturity of financing on which it is relying for the funding of its large investment program.
B. Structural Reforms and Policies
Increasing Domestic Revenue Mobilization
10. For all the assistance from our technical and financial partners, and the funds contributedby international investors, we realize that Benin’s economic development should rely largely on domestic resources. In this context, and with a view to ensuring the sustainability of public debt, we are seeking to reform our fiscal policy and to improve the performance of the tax and customs administrations in order to increase the mobilization of revenues. Broadening of the tax
BENIN
48 INTERNATIONAL MONETARY FUND
base is necessary in particular in order to boost government revenues. The goal is to raise the tax/GDP ratio from 14.7 percent in 2016 to 16.8 percent in 2019, in spite of the under-taxation of the primary sector, which nevertheless contributes more than one-third to the value added of economic activity. This tax-to-GDP ratio is still considerably lower than the WAEMU convergence target, which is set at 20 percent of GDP.
Strengthening the Tax and Customs Administrations
11. Benin has been working for several years with its technical and financial partners onapproaches and tools to turn the tax administration into a modern, effective institution that simultaneously meets revenue requirements and provides high-quality user services. These reforms are consistent with the government’s goal of shifting public administration from a resource-based budget system to a system focused on results. These efforts led to the drafting of the 2017-2021 Strategic Plan for the Tax Administration (POSAF), which was adopted by the Committee of Directors of the Ministry of Finance at its special meeting on February 15, 2017 and validated by the Minister of Economy and Finance on March 13, 2017. The next step will be to prepare annual operational and working action plans based on the Strategic Plan with the technical assistance of the IMF, in order to launch the process of modernizing the tax administration. The DGI is also committed to compiling and publishing a list of VAT collectors starting in 2017.
12. Given an economy dominated by trade activities, close cooperation between the tax andcustoms administrations is a prerequisite for expansion of the tax base and the establishment of effective tax controls. At this time, the taxpayer base is quite narrow: only one-third of the “large” taxpayers pay the value-added tax. More effective use of the Single Taxpayer Identification Number (IFU) through the establishment of a comprehensive taxpayer database that is shared by the tax and customs administrations should allow for a significant improvement in the coordination between these two authorities. The issuing of temporary IFUs, used in particular for customs purposes, has been prohibited since 2015. The DGI is committed to ensuring the monitoring of the platform containing the central database of active IFUs and to making every effort necessary to ensure its regular updating through the entry of all of the relevant information about taxpayers, including their location, verified following an on-site visit. An interconnection with the Automated System for Customs Data (ASYCUDA), which is already operational, will enable customs authorities to consult that platform. Starting in February 2017, an importer who does not have an updated IFU will have to pay an additional charge of 10 percent on the value of its imports, in addition to the VAT and customs duties (structural benchmark). This reform will provide for more widespread use of the IFU and should enable the DGI to perform better monitoring of imported goods and to verify consistency with the taxpayers’ tax declarations. The Treasury will be connected to this IFU platform in a second phase.
13. The customs administration reforms have been delayed, primarily as a result of a longertransition than originally planned for the full implementation of the ASYCUDA World system. The operational problems have been resolved, however, and the transition to ASYCUDA World

BENIN
INTERNATIONAL MONETARY FUND 49
should allow for the strengthening of risk analysis in customs in order combat fraud. Risk assessment should be focused on the high-priority sectors and adapted to the intervention capacities of the control services, primarily through better monitoring of goods selected for the red channel. On the other hand, value has been factored into customs operations since January 2017, in particular through the effective monitoring of valuation notices issued by the value unit.
Improving the Functioning of the Expenditure Chain
14. The Ministry of Finance has just completed an action plan to improve the managementof public spending (PAAGFP), which has allowed for significant progress in this direction (revision of the Tax and Customs Code, evaluation of debt sustainability, better monitoring of economic conditions, production of the annual report on debt and the annual cash plan …). There is still considerable room for improvement in the system, however, as noted in the Public Expenditure and Financial Accountability (PEFA) and Public Expenditure Management and Financial Accountability Review (PEMFAR) reports (2014). The weaknesses that were identified involved in particular the absence of multi-year budgeting, the management of cash flow, and the monitoring of project execution. The government is planning to conduct, in collaboration with the World Bank, a review of public expenditure over the past five years in order to identify the factors affecting the quality of public expenditure (Structural Benchmark).
Strengthening Cash Flow Management
Treasury Single Account
15. For some time, we have been working to strengthen our cash flow function. We expectthat this will result in gains in efficiency, but also better functioning of the expenditure chain, in particular the prevention of arrears and recourse to unnecessary borrowing. One major reform is the adoption of a Treasury Single Account (TSA). The directives of the WAEMU require that all public funds (those of the central government, administrative public agencies, and local governments) be managed through an account opened with the Central Bank of West African States (BCEAO). At this time, the Treasury has a single account with the BCEAO, but the accounts of other entities – ministries, administrative public agencies, and local governments – have not been closed. An inventory of these accounts is under way, and the results are expected by End-March 2017. Our timetable for their closure and for making the TSA operational provides for the following steps:
determination of the architecture and functioning of the TSA by End-July 2017;
adoption of an implementing text for the decree on public sector accounting standards withthe aim of defining the scope of the TSA in August 2017;
bringing the chart of accounts and the information system into line with the TSA architectureby End-November 2017;
closure of all the accounts opened at banks by End-December 2017;

BENIN
50 INTERNATIONAL MONETARY FUND
adoption of appropriate measures for the opening of deposit accounts for the administrativepublic agencies and administrative government entities concerned during 2018;
drafting and approval of procedural manuals regarding the TSA by February 2018;
training of personnel in the new procedures and IT applications by April 2018; and
putting the TSA into operation starting in July 2019.
Cash Flow Management, Arrears, Budgetary Float, Certified Treasury Checks
16. Improvement of the expenditure chain also involves better cash flow management(structural benchmark). We currently produce a monthly cash plan, but up until now this tool has not resulted in a significant reduction in domestic payment arrears, or a substantial decline in the issuing of certified Treasury checks that remain unpaid. To this end, within the framework of the new 2016-2020 PAAGF, we will:
put into place a specific mechanism for the monitoring of budgetary float and arrears withinthe framework of the Cash Management Committee;
improve the planning of cash requirements by making use of commitment plans ofauthorities and institutions related to the state budget;
put into place a system for regulating commitments that takes into account the actualmobilization of resources (collection of budget revenues, disbursement of budget support,domestic financing);
strengthen the capacities of the Cash Management Committee with regard to the monitoringand weekly allocation of cash resources.
Payment arrears as of End-June 2016 are currently the subject of an audit, which will be completed in September 2017. On the basis of the results of this audit, we will put into place a plan to clear the arrears and we will work on the implementation of its recommendations. Efforts have begun to resolve the issues with certified Treasury checks: this will allow for immediate payment of certified checks that currently remain unpaid, within an average period of 15 days. The process of dealing with all of the outstanding certified Treasury checks will be completed by June 2017.
Strengthening of Debt Management
17. A number of reforms have been undertaken in Benin within the framework ofinstitutional and legal strengthening of debt management. Debt is managed jointly by the Treasury and Public Accounting Directorate (DGTCP) and the National Amortization Fund (CAA—the government debt management agency). In order to improve the effectiveness of debt management, a decree was issued in October 2015 to define the responsibilities and authorities

BENIN
INTERNATIONAL MONETARY FUND 51
of the two structures in this area and thereby to avoid a fragmented approach and operational overlaps. Since 2015, the CAA departments have been reorganized around front, middle, and back office functions in accordance with international standards. The reorganization of Treasury departments has lagged behind, but it will take effect by End-2017. It makes provision for the following measures: (i) organization of the departments in the new organization chart establishing the [responsibilities, organization, and functions (AOF) of the DGTCP in divisions and sections in the third quarter of 2017; (ii) the transfer and allocation of responsibilities across technical directorates, in accordance with the new organization chart establishing the responsibilities, organization, and functions of the DGTCP in the first half of 2017; (iii) preparation of manuals of procedures for the various technical directorates of the DGTCP as well as other documents required by the reorganization of the DGTCP by End-August 2017; and (iv) dissemination of provisions governing the new organization chart establishing the responsibilities, organization, and functions of the DGTCP by End-June 2017.
18. Significant efforts have been made to improve the availability of information on publicdebt: (i) the CAA website has gone online; (ii) a statistical bulletin on public debt is published on a quarterly basis; (iii) an annual report on public debt management has been prepared; and (iv) a medium-term debt management strategy document was appended to the 2017 budget law. Some additions could be made to this document, however, and it could explicitly include a public debt ceiling as recommended by the Organic Law on Budget Laws. In addition, the monitoring of public debt should cover all of the guarantees granted by the government and the debt of public enterprises.
Multi-Year Budgeting
19. The transition to multi-year programming has been effectively implemented for budgetpreparation at all ministries. As for the execution of public expenditure in program mode, this will be tested in 2017 by five (05) pilot ministries, namely the Ministry of Economy and Finance, the Ministry of Infrastructure and Transport, the Ministry of Nursery School and Primary School Education, the Ministry of Secondary and Technical Education and Professional Training, and the Ministry of Foreign Affairs and Cooperation. This public expenditure budgeting and execution system is expected to be fully operational in 2019 and should be expanded to all of the ministries in line with the recommendation of the AFRITAC West mission (structural benchmark).
Procurement
20. The public procurement oversight system has been improved considerably over the pastfive years thanks to the utilization of the new Public Procurement Code. We intend, however, to make some adjustments to it in order to bring it into line with best international practices. The modernization of procurement procedures has benefited from the implementation of the Integrated Public Procurement Management System (SIGMap) and the introduction of a public procurement web portal (www.marches-publics.bj), which the public procurement officials of various contracting authorities use for conducting the procurement process and for producing the relevant statistics in real time. The times required for the performance of several stages in the

BENIN
52 INTERNATIONAL MONETARY FUND
process have been reduced. The production and dissemination of manuals and guides has improved the quality of tenders. The monitoring and transparency of procurement procedures could still be improved, however.
21. The Public Procurement Regulatory Authority (ARMP) and the National Directorate forOversight of Public Procurement (DNCMP) will develop databases on public procurement in order to meet not only needs related to management and oversight of the procurement processes, but also needs related to evaluating the effectiveness and efficiency of the procurement system. Regulation will be strengthened with regard to the statistical publications drawn from these databases and measures will be taken to ensure the effectiveness and regularity of these publications. The transparency of the public procurement system will be further enhanced by the publication on the national website (www.marches-publics.bj) of information drawn from SIGMap, in line with the Open Contracting Data Standard (OCDS) initiative, which we intend to adopt (structural benchmark). We will ask the World Bank, one of the partners in the initiative, to provide us with technical assistance in this effort.
22. In view of recent experiences in the sub-region and lessons learned from the pre-financing arrangements used in 2015 and early 2016, the government has canceled most of the contracts in question and has discontinued the use of this type of financing as a funding method for public investment (see paragraph 9). Furthermore, the law on PPPs enacted in October 2016 should provide a frame of reference for the financing of major investment projects by the private sector.
Monitoring GAP Projects
23. We recognize the need for strengthening of our capacities in terms of investmentplanning and the assessment, selection, and monitoring of projects in order to ensure the effectiveness of public investment. An institutional framework for the monitoring and coordination of the GAP has been adopted for this purpose. This framework is organized around the following entities: (i) the Council of Ministers, which sets the general guidelines and reviews and approves the implementation reports; (ii) the Committee for the Monitoring of Flagship Projects (CSPP), under the supervision of the President of the Republic; (iii) the Monitoring and Evaluation Committee (CSE), which is chaired by the Minister of State for Planning; and (iv) the sectoral monitoring committees (CSSs), which are chaired by the sectoral ministers. The planning and execution of priority investments by the sectoral ministries – one fourth of the GAP – follow existing procedures for the most part, under the supervision of the Ministry of Planning and Development. Given the scale of the flagship projects—which account for three-fourths of the GAP—the CSPP is responsible, among other things, for addressing the main risk factors (resource constraints, weak absorption capacities, delays in administrative procedures, etc.) with the aim of ensuring the proper execution of investment projects.
24. In addition to this general institutional framework, two specific mechanisms have beenprovided for in order to strengthen monitoring and facilitate the performance of investment projects and the effective implementation of the 77 priority reforms outlined in the GAP:
BENIN
INTERNATIONAL MONETARY FUND 53
the creation of presidential GAP monitoring units: these are units will be put into place byeconomic sectors (education, health, etc.) and comprised of monitoring and evaluationexperts and sectoral experts tasked with close supervision of projects to provide real-timealerts to the Office of the President, to the two Ministers of State, and to the Minister ofFinance. Some 20 monitoring officials have been recruited for the launching of these units.
the creation of sectoral reform committees: the 77 priority reforms have been allocated bythe Ministry, and they will be implemented by the sectoral committees under the supervisionof the Office of Analysis and Investigation (Bureau d’investigation et d’analyse—BAI). It shouldbe noted in particular that major reforms are planned to improve the business climate inBenin in order to attract the private investment planned for the financing of the GAP(61 percent of the total cost).
25. Better planning of public investments, particularly by making use of the capacities foranalysis of the effectiveness and feasibility of major projects, is a priority of the Ministry of the Economy and Finance. Following the launching of the GAP, most of the autonomous agencies for carrying out the actions and reforms defined by the sectoral ministries have been created for the implementation of flagship projects. The BAI under the Office of the President is responsible for their supervision. The creation of the BAI is justified by the need for the President of the Republic to have an authoritative body to oversee the mobilization of financial and human resources within the framework of the implementation of the GAP (structural benchmark). The BAI serves the entire government and it is comprised of a group of various experts who participate in: (i) the design and monitoring of projects (strategic guidelines, feasibility studies, monitoring of finances, performance, and reporting); (ii) operations management (legal and organizational support, research, and staffing, etc.); (iii) governance (support, monitoring, and quality review of reforms; strengthening of the management processes and the internal control system; establishment of performance plans, investigation missions, and specific studies); and (iv) the mobilization of resources (identification of technical and financial partners, arrangements with technical and financial partners and follow-up on commitments, support for the launching and monitoring of PPP operations).
Evaluation and Monitoring of Public-Private Partnership Projects
26. Since the use of PPPs could serve as a significant source of financing for major capitaland infrastructure projects under the GAP, our institutional framework needs to be adapted to the management of contracts of this kind. The law on public-private partnerships was passed in October 2016 and three implementing decrees were approved by the Council of Ministers in December 2016 to make it operational. These decrees take account of World Bank staff comments. The Support Unit for Public-Private Partnerships (CAPPP) under the Office of the President of the Republic is the central body at the national level which provides TA at all stages of the contracting process for PPP operations. A strategic support unit is in place under the Minister of Finance and it should guide the work on the assessment of fiscal risks related to GAP projects financed through PPPs. This unit will follow best practices and standards in the assessment of fiscal risks associated with PPPs (structural benchmark). It will assess these risks

BENIN
54 INTERNATIONAL MONETARY FUND
using the Public-Private Partnership Fiscal Risk Assessment Model (PFRAME), which was developed jointed by the IMF and the World Bank, or any other model that the government may deem suitable.
State-Owned Enterprises
27. Mindful of the potentially significant fiscal risks associated with the management of SOEs,we undertook a comprehensive survey of the government’s portfolio. Work is under way to strengthen the professionalism of boards of directors and efforts to increase their accountability are also being stepped up. In addition, managers will be selected according to objective competency criteria and they will be subject to performance contracts between the government and the enterprises. These contracts will be finalized for all of the enterprises during 2017. The creation in June 2016 of the General Directorate for State Holdings and Denationalization was aimed at improving the financial monitoring of SOEs. Its capacities at this point are quite limited, however, and this means that it is not able to perform its mission effectively. We are therefore planning to increase its staffing in 2017 through the recruitment of around 30 employees. Efforts will also be undertaken to ensure that it has at its disposal more comprehensive information about public enterprises, in particular their financial statements and their budgets, within the legally established deadlines.
28. An audit program, as part of the review of SOEs and public agencies and coordinated bythe BAI, is being carried out for SOEs that have already been audited, and the findings from these audits will be included in the report, which will be published (structural benchmark). This report will help us to limit financing through cross claims and debts, and thus to regulate the financial flows between the government and SOEs, which in turn will allow for a comprehensive survey of public debt.
29. In addition, the government has undertaken a rationalization of the public portfoliothrough: (i) the restructuring of the Benin Radio and Television Broadcasting Office (ORTB) and the National Food Aid and Security Office (ONASA); (ii) the liquidation of twelve (12) entities, including the National Company for the Promotion of Agriculture (SONAPRA), the National Price Stabilization Office (ONS), the Central Supply of Inputs (CAI-SA), the Mechanization Development Agency (ADMA), and regional action centers for rural development (CARDER); (iii) the leasing of district hospitals (Djidja, Cové, and Djougou); and (iv) the denationalization of factories for the processing of agricultural produce and the rice mills in Malanville and Glazoué, as well as other public enterprises whose financial situations are under review.
Strengthening of Internal and External Control
30. The 2014 PEFA report identified significant deficiencies in the audit function in Benin. Thegovernment would like to have an independent, transparent, and accountable audit function. The Office of the Auditor General has been dissolved, but the General Inspectorate of Finance and the other general inspectorates for the ministries are continuing to execute their activity programs. However, the BAI under the Office of the President of the Republic has been entrusted

BENIN
INTERNATIONAL MONETARY FUND 55
with coordinating efforts to reorganize the internal and external audit structures for the State. The new structure for the organization of government control bodies and the plan for the strengthening and enhanced professionalism of auditors will be completed by End-September 2017. The Office of Analysis and Investigation is also responsible for arranging for specific audits in order to clarify the reform process or within the context of steps to assess the current state of affairs following the assumption of power by the government. As for the various audits that have been performed, the government chose to make public the summary audit reports presented to the Council of Ministers and to turn over to the justice system the cases that call for judicial investigations. The audit reports (regarding financial legal audits) for all public enterprises and the 30 largest administrative public agencies (EPA) will be published by 2020.
31. The draft Budget Execution Law for 2015 was, as provided for by law, submitted to theNational Assembly by Decree No. 2016-617 of October 6, 2016, prior to the adoption of the 2017 budget law, and the relevant report by the Accounting Chamber is posted on the Supreme Court’s website (www.coursupremebenin.com). Finally, the government believes that an independent Court of Auditors, which meets international performance standards, should be put into place at the top of the Benin’s control structure. The creation of such an entity will therefore be included in the constitutional reform that the government is planning to adopt as soon as possible.
Promoting Financial Inclusion
32. More robust economic growth requires greater financial intermediation. In order toachieve this, we are planning to limit the bottlenecks in our financial infrastructure. The lack of property titles, information asymmetry, and the weakness of the judicial system are major obstacles. While financial soundness indicators do not raise immediate concerns in terms of financial stability, the quality of banks’ loan portfolios remains weak and limits lending to the private sector.
33. The high level of nonperforming loans has a negative impact on lending by banks, inparticular lending to the private sector. The capital adequacy figure for banks is 8.8 percent (End-September 2016), just above the minimum of 8 percent (but significantly below the WAEMU average, which was 11.4 percent at End-June 2016. The nonperforming loan ratio, estimated at 23 percent, is one of the highest among WAEMU countries (the average is 18.4 percent), while the provisioning ratio remains weak at 15 percent of risk-weighted assets in 2016. By End-June 2017, all banks will be required to achieve a minimum equity capital figure of CFAF 10 billion. Those that have not yet achieved this target have submitted action plans to the BCEAO: of 14 banks, there are 6 that need to make efforts to reach the goal. The concentration of loans, primarily in the trade sector, which is closely linked to trade with Nigeria, makes the banks’ assets vulnerable to a slowdown in Nigeria. In addition, the growing exposure to Treasury notes and bonds has made banks more vulnerable to a deterioration in public finances and to a tightening of rates in the regional market.

BENIN
56 INTERNATIONAL MONETARY FUND
34. Together with the BCEAO, the government has a major role to play in order to ensure thestability and soundness of the financial system. We are therefore carrying out a number of structural reforms to this end. We would like to establish a credit bureau. The Law on Credit Information Offices (BIC) was adopted by the National Assembly and promulgated by the President of the Republic on January 23, 2017. The adoption of this law means that Benin has established the legal framework required to launch BIC activities. We will take steps to support the Central Bank in this matter and to make the BIC operational by End-2017. By facilitating banks’ access to information about their customers regarding credit with other banks, the BIC will reduce credit risks, which will allow for a reduction in credit costs and development of the financial system. We are taking measures to facilitate the use of collateral to obtain bank loans. We will also work to promote the electronic registration of land titles, extending it to cover the entire country. The initiative contained in the amended 2016 budget law to eliminate registration fees has had the expected result and the number of land titles registered has increased.
35. We are strengthening the system for dealing with banking crises. The new framework willenable us to accelerate the resolution of one bank that was placed in receivership three years ago but that remains in operation and is likely to create liabilities for the government.
36. We believe that the microfinance sector is essential in order to promote access to thefinancial system for small business. With the aim of maintaining their viability and credibility, we will strengthen the supervision and regulation of microfinance institutions (MFIs). It turns out that 65.1 percent of authorized MFIs (with deposits of CFAF 88 billion at End-2015 out of a total of CFAF 93.2 billion) are in good financial health, while the condition of the other institutions is less sound. We will strengthen the supervisory authority by increasing the number of supervisors, in particular in rural areas, which is a necessary measure for timely oversight and enforcement of the regulations.
37. Out of a total of 721 microfinance initiatives surveyed in 2011, 495 were not authorizedto operate; but with the public awareness efforts and support for some that show signs of viability, this number was brought down to 332 by End-2015. The unauthorized MFIs will be brought into line with the regulations or closed. Specifically, in 2017 a communication regarding clean-up of the microfinance sector initiated jointly by the Ministry of the Economy and Finance and the Ministry in Charge of Social Affairs will be submitted to the Council of Ministers with the aim of obtaining the government’s authorization to take tangible action against unauthorized MFIs. We are planning, on the one hand, to raise awareness among local elected officials in the departments of Zou, Collines, Borgou, and Alibori, and among religious denominations, and on the other hand, we intend to close some MFIs with respect to which the procedure for obtaining court rulings is sufficiently advanced.
Improving the Business Climate
38. The business climate in Benin is not conducive to the development of the private sector.Some progress has been made, however, in improving the business climate. Benin’s ranking in the Doing Business report has therefore improved recently, in recognition of our work on

BENIN
INTERNATIONAL MONETARY FUND 57
simplifying the regulatory environment. But the bulk of the work remains to be done. Among the most significant challenges are poor governance and the precarious situation involving the generation and distribution of electricity.
Governance
39. One of our major problems is the poor enforcement of contracts. As a result of this, thereis a great deal of distrust on the part of entities in the private sector with respect to the government. The GAP is therefore aimed at a radical reform of all relevant aspects of the judicial system, which we are undertaking with the assistance of our technical and financial partners. One example is the creation of commercial courts, which is provided for under the law containing amendments and additions to Law No. 2001-37 of June 10, 2002, on the organization of the judicial system in the Republic of Benin, and the law containing amendments and additions to Law No. 2008-07 on the code of civil, commercial, social, and administrative procedure in the Republic of Benin, which were enacted in September 2016 (structural benchmark). The next steps toward making these courts operational are: (i) the identification of buildings to house the Trade Court of Cotonou and the Trade Appeals Court of Porto Novo; (ii) the appointment of career and commercial court judges and the official installation of the courts in these two jurisdictions no later than May 31, 2017.
40. We are strengthening the effectiveness of the anti-corruption framework that has beenput in place in recent years. In that perspective, the role of the ANLC is critical and it will be provided with the resources necessary to carry out its vital functions. We are committed to address the deficiencies in the asset declaration regime. In this regard, we will introduce, by end-August 2017, the required legislative amendments to (i) ensure dissuasive sanctions for absence of asset declaration, (ii) require comprehensive declaration of assets owned and beneficially owned, in Benin and abroad, by the high-level official, their family members and close associates, and (iii) allow for online publication of the asset declarations. In order to tackle impunity, the ANLC will introduce, by end-August 2017, an online system for monitoring judicial actions taken on the basis of reports from government oversight institutions.
Energy policies
41. A sufficient supply of high-quality electricity at affordable prices is an essential conditionfor the improvement in economic growth that we are seeking. Investments in the production and distribution of electricity are therefore major components of the GAP. They will reduce our dependence on imports, they will fill in the structural deficit, and they will meet the increase in demand that is expected. By 2021, we expect to satisfy a total demand of 500 megawatts, half of which will be produced within the country. The GAP makes provision for the construction of two thermal power stations in addition to the Djarala hydroelectric dam. It is also important to improve the system for the distribution of electricity. We are pleased to have received financing from one of our partners to improve the quality of our distribution network. In total, this investment will be equal to 5.0 percent of the 2016 GDP over five years. Within the context of this assistance, we have taken measures to strengthen the Beninese Energy and Electricity Company

BENIN
58 INTERNATIONAL MONETARY FUND
(SBEE), which is responsible for importation and distribution. The measures already taken include: the recruitment of a new general manager and an assistant manager through a competitive hiring process; the appointment of members of the board of directors according to objective criteria; the establishment of a performance contract for the general manager; and an audit of SBEE’s debt and arrears, together with a restructuring plan. A new formula for the adjustment of consumer prices is currently under development. We have also introduced competition into electricity imports.
42. In order to provide for a bridging mechanism until the new generating capacity isavailable, and taking into account the fact that imports cannot be increased reliably, the SBEE has leased a temporary production facility. A 70-megawatt production facility has been in service since 2014, to which another 80 megawatts will be added starting in January 2017. Unfortunately, this production output is more expensive than our average import price (CFAF 120-150 per kilowatt-hour, compared to CFAF 58 per kilowatt-hour). The government therefore decided to subsidize the leasing and fuel costs of these temporary installations.
C. Technical Assistance and Capacity Development
43. As with low-income countries, Benin faces challenges in terms of capacity developmentand it benefits from technical assistance provided by the IMF, the World Bank, and other development partners. The technical assistance is focused on increasing the mobilization of domestic resources, strengthening public financial management, and improving statistics, in particular national accounts. The technical assistance provided to Benin by the IMF has been directed strategically at the consolidation of the macroeconomic framework and the implementation of structural reforms. Efforts to carry out previous technical assistance recommendations remain uneven, while the principal structural reforms are lagging behind owing to a lack of implementation capacity.
PROGRAM FOR 2017
44. For 2017, growth in real GDP should benefit from the expected improvement in theglobal economy, an expansion of agricultural output, and medium- and long-term capital injections for investment purposes. Inflation should return to its lower trend levels and remain below the WAEMU convergence threshold of 3 percent. In order to support growth, however, the structural reform program should be carried out in its entirety and within the established timeframe, including measures to boost the mobilization of domestic revenues, to improve the quality and effectiveness of public spending, and to strengthen governance and institutions with a view to promoting the development of the private sector.
A. Macro-Fiscal Framework for 2017
45. In accordance with the medium-term goals, the macro-fiscal framework for 2017 calls foran increase in budget revenues equal to 0.7 percentage point of GDP to 15.4 percent, while

BENIN
INTERNATIONAL MONETARY FUND 59
public spending should grow by 3.3 percentage points of GDP, reaching 24.7 percent of GDP, which would mean an overall deficit equal to 9.3 percent of GDP. The increase in public spending would come from a marked rise in capital expenditures, which would be equal to 10.1 percent of GDP in 2017, compared to 6.0 percent in 2016. This stimulus for investment would be compensated for in part by a rationalization of current spending, which would decline by 1.2 percent of GDP. The amount of capital expenditures for 2017 would nevertheless be below the figure set in the 2017 budget law as adopted by the parliament in December 2016, which was equal to 15.7 percent of GDP. This figure brought the public deficit to 14.4 percent of GDP. In order to ensure public debt sustainability, we will limit publicly funded capital expenditures to an amount not to exceed CFAF 550 billion, i.e. 68 percent of the amount approved. The 2017 budget law paves the way for an increase in capital expenditures financed by greater mobilization of revenues, rationalization of current spending, bond issues in the regional market, and optimization of financing within the framework of public-private partnerships.
Tax Policy
46. In order to mobilize more revenues, the 2017 budget law calls for the creation of severaltaxes which, coupled with the efforts to strengthen the tax and collection administrations, is expected to generate additional resources estimated at CFAF 38.4 billion, or 0.7 percent of GDP (structural benchmark). These new taxes include:
a tax on gambling (generating revenues estimated at CFAF 1 billion);
a special tax on unprocessed agricultural products (generating revenues estimated atCFAF 4 billion);
a tax on exports of scrap metal (generating revenues estimated at CFAF 3 billion);
a tax on four-wheel motor vehicles (expected revenues estimated at CFAF 3 billion);
a tax on seeds, fibers, and cashew nuts, and its extension to all unprocessed products(generating revenues estimated at CFAF 4 billion); and
a turnover tax on GSM operators (generating revenues estimated at CFAF 1.4 billion); and
efforts to recover tax arrears (approximately CFAF 22 billion).
In addition to these fiscal measures, the tax administration is pursuing reforms of an organizational and administrative nature that will have a tangible impact on revenues. These include: (i) the establishment of a single database for taxpayers subject to the VAT; (ii) implementation of a tax and customs data platform; (iii) heightened tax supervision among sensitive sectors (Banking - Telecommunications - Insurance - Oil); (iv) withholding of all of the VAT at the source for enterprises subject to the VAT; (v) application of the transaction value in customs processing; (vi) resumption of the import verification program mechanism, as well as efforts to combat fraud. These administrative measures are expected to generate around

BENIN
60 INTERNATIONAL MONETARY FUND
CFAF 60 billion on a full-year basis and safeguard tax resources over the medium term. Furthermore, as indicated above, a strategy to recover tax arrears will be put into place with the aim of the boosting the level of expected revenues over the coming years. This strategy is based on the recent diagnostic work performed by the January 2017 FAD TA mission on the levels of outstanding balances, valued at CFAF 107.6 billion at End-December 2016. The goal is to reduce this stock of outstanding balances by at least 30 percent by December 2017.
47. On the other hand, we made the decision to eliminate transfer taxes with the aim ofstimulating the real estate market (the estimated cost of the measure is CFAF 12 billion in a full year). In order to make more systematic improvements in our fiscal policy, a Fiscal Policy Unit will be created in 2017 under the General Tax Directorate (DGI). The staff of this unit will be recruited in June 2017. The personnel who are recruited will receive targeted training and will be capable of performing studies on the impact of the reforms that are to be implemented in order to mobilize more domestic resources. In addition, several approaches to improving revenues have been suggested by IMF technical assistance missions and other partners, as well as our own specialists. These approaches include: (i) simplification of the personal income tax (IRPP); (ii) simplification of the combined business tax; (iii) protection of the corporate tax base against aggressive tax optimization behavior (updating of the legislation on transfer pricing); (iv) management of tax exemptions; and (v) the establishment of a tax mediator for small and medium-sized businesses.
Tax Expenditures
48. Tax expenditures were reported as CFAF 128 billion in 2016, which was an increase ofCFAF 11 billion compared to the previous year. Our goal is to contain the rise in these expenditures by identifying and eliminating those that are no longer justified from an economic and social standpoint, or that do not have a legal basis. From now on, tax expenditures not provided for under the codes (investment, mining, and oil) may no longer be granted by the sectoral ministries by a discretionary decision without the prior authorization of the Minister of Finance (Article 1103-1 of the 2017 budget law). Furthermore, the 2017 budget law calls for the elimination of exemptions for power companies. Our efforts will be facilitated by the expiration in June 2017 and 2018 of the exemptions enjoyed by telecommunications companies with regard to GSM licensing. In addition, we are committed to performing a comprehensive analysis of tax expenditures before End-2017 in order to design a strategy aimed at containing and streamlining these expenditures. The measures that are decided upon will be included in the 2018 budget law (structural benchmark).
B. Program Monitoring
Prior Actions
49. With the aim of ensuring the proper execution of this program and in line with theurgency that we are assigning it, we have already undertaken a number of significant measures some of which are prior actions, including:

BENIN
INTERNATIONAL MONETARY FUND 61
the creation in June 2016 of the Office of Analysis and Investigation, which becameoperational in September 2016 and is responsible for the GAP implementation andmonitoring mechanism, in particular its flagship projects component;
approval by the Minister of Finance of the 2017–21 POSAF, following its adoption by theCommittee of Directors of the Ministry of Finance;
the effective integration of control activities of the tax and customs general directoratesthrough a shared computer platform maintained by the GDI, the Single TaxpayerIdentification No. (IFU), and the imposition of penalties for importers who do not have anupdated IFU starting in February 2017;
the establishment of a framework for the preparation and monitoring of the government’scash flow plan;
an agreement on the 2017 budget in accordance with the program; and
Quantitative Performance Criteria and Structural Benchmarks
50. We have established quantitative performance criteria for End-June and End-December2017 and indicative targets for End-March and End-September 2017 (Table 1) with the aim of making provision for monitoring of the program with the IMF. The above prior actions and the structural benchmarks, as well as the macroeconomic justifications, are described in Table 2. All the prior actions have been implemented. The first and second program reviews are expected to be completed on or after October 31, 2017 and April 30, 2018, respectively.

Table 1. Benin: Proposed Quantitative Performance Criteria and Indicative Targets, 20171 (Billions of CFA francs)
#######
6:34 PM
Est. Prog. Prog. Prog. Prog.
A. Quantitative performance criteria2
Net domestic financing of the government (ceiling)3,4, 5 232.8 70.1 116.1 183.9 177.7
Basic primary balance (excluding grants) (floor) -150.6 -64.7 -73.1 -139.0 -171.3
Total revenue (floor) 745.7 182.9 386.1 602.9 843.9
B. Continuous quantitative performance criteria (ceilings)
Accumulation of external payments arrears 0.0 0.0 0.0 0.0 0.0Ceiling on the present value of new external debt contracted or guaranteed by the government 211.5 402.8 402.8 402.8 402.8Accumulation of domestic payments arrears 0.0 0.0 0.0 0.0 0.0Contracts by the government for the prefinancing of public investments projects … 0.0 0.0 0.0 0.0
C. Memorandum Items2
Priority social expenditure (floor) 84.8 36.3 85.0 125.0 160.0
Memorandum item: Budgetary assistance6 11.6 16.2 16.2 39.2 55.0
Sources: Beninese authorities; IMF staff estimates and projections.
1 The terms in this table are defined in the Technical Memorandum of Understanding (TMU).2The performance criteria and indicative targets are cumulative from the beginning of the calendar year.3 The performance criterion on net domestic financing is automatically adjusted as indicated in the TMU.4 If the amount of disbursed external budgetary assistance net of external debt service obligations falls short of the program forecast, the ceiling on net domestic financing will be adjusted pro-tanto, subject to limits specified in the TMU.5 If the amount of disbursed external budgetary assistance net of external debt service obligations exceeds the program forecast, the ceiling will be adjusted downward by the excess disbursement unless it is used to reduce domestic payment arrears.6 Gross disbursements, not adjusted for debt service obligations.
December 31, 2016 March 31, 2017 June 30, 2017 September 30, 2017
Performance Criteria
December 31, 2017
Performance Criteria Indicative Targets
BENIN
62 INTERN
ATION
AL MO
NETARY FU
ND

BENIN
INTERNATIONAL MONETARY FUND 63
Table 2. Benin: Prior Actions, Structural Benchmarks, and Macroeconomic Rationale Measures Dates Rationale
Revenue administration
Have the Strategic Plan for the Tax Administration (POSAF) approved by the Ministry of Finance.
Prior action Modernize the tax administration to increasdomestic revenue mobilization.
Integrate the Customs and Tax Administrations’ computer systems to strengthen their coordination.
Prior action Boost domestic revenue collection.
Agree upon a 2017 budget consistent with the ECF-supported program.
Prior action Preserve fiscal sustainability.
Review and quantify all tax expenditures and agree on a time-bound strategy to suppress all tax expenditures that are not in line with the WAEMU directives.
End-September 2017
Boost domestic revenue collection.
Public financial management
Put into place a framework for the preparation and monitoring of the government’s cash flow plan.
End-June 2017 Ensure effective cash flow management.
Prepare monthly plans for cash flow forecasts and quarterly comprehensive assessments of budget execution.
End-June 2017 (then on an
ongoing basis)
Enhance the transparency, timeliness, and accuracy of budget information.
Increase the transparency of procurement operations by publishing on the internet all basic information about procurement.
End-June 2017 Ensure the optimal utilization of resources aencourage competition in the private secto
Conduct a public expenditure review with World Bank assistance.
End-September 2017
Improve the quality of public expenditure.

BENIN
64 INTERNATIONAL MONETARY FUND
Table 2. Benin: Prior Actions, Structural Benchmarks, and Macroeconomic Rationale
(concluded) Public investment
Establish a Unit responsible for the implementation of the GAP, notably the Flagship projects.
Prior action
Improve the outlook for growth and contribute to debt sustainability.
Launch the Strategic Support Unit under the Ministry of Finance, which is responsible inter alia for evaluating the fiscal risks associated with public-private partnerships.
End-June 2017 Promote transparency and reduce contingent liabilities.
Develop a multi-year commitment framework for investment projects.
End-September 2017
Ensure the availability of information on stipulations and conditions in order to comply with the debt limit policy.
Debt management and sustainability
Extend the coverage, under the medium-term debt strategy, to the debt of state-owned enterprises, after completion of data collection on their financial condition and to contingent liabilities.
End-December 2017
Improve the capacity for active debt management and ensure debt sustainability.
Reform of state-owned enterprises
Collect data on the debt of state-owned enterprises and adopt a monitoring mechanism.
End-September 2017
Ensure better monitoring of contingent liabilities and improve public debt management.
Business climate and financial inclusion
Adopt implementing decrees for Laws No. 2001-37 and 2008-07, dealing with commercial courts.
Prior action Improve governance and the business climate.
Establish a credit bureau and make it operational.
End-December 2017
Improve the efficiency of the financial sector and intermediation.

BENIN
INTERNATIONAL MONETARY FUND 65
Attachment II. Technical Memorandum of Understanding
1. This Technical Memorandum of Understanding (“the Memorandum”) defines the quantitative performance criteria and benchmarks, and structural benchmarks, for the Republic of Benin’s program supported by the Extended Credit Facility (ECF). It also sets out the frequency and deadlines for data reporting to the staff of the International Monetary Fund (IMF) for program monitoring purposes.
PROGRAM ASSUMPTIONS
2. Exchange rates under the program. For the purposes of this Memorandum, the value of transactions denominated in foreign currencies shall be converted into the national currency of Benin (the CFA franc, or CFAF), on the basis of the exchange rates agreed upon for the program projections. The key exchange rates are presented below.1
CFAF/US$ 592.7
CFAF/euro
655.96
CFAF/SDR 836.57
Definitions
3. Unless otherwise indicated, “government” is understood to mean the central government of the Republic of Benin and does not include any political subdivisions (such as local governments), the central bank, or any other public or government-owned entity with autonomous legal personality not included in the government’s flow-of-funds table (TOFE).
4. The definitions of “debt” for the purposes of this Memorandum is set out in point 8 of IMF Executive Board Decision No. 6230-(79/140), as amended on December 5, 2014, by Executive Board Decision No. 15688-(14/107):
(a) Debt is understood to mean a current, that is, not contingent, liability, created under a contractual agreement through the provision of value in the form of assets (including currency) or services, which requires the obligor to make one or more payments in the form of assets (including currency) or services at some future point(s) in time, and these payments will discharge the principal and/or interest liabilities incurred under the contract. Debts can take a number of forms; the primary ones being as follows:
1 Exchange rates are average for 2017.
BENIN
66 INTERNATIONAL MONETARY FUND
i) loans, that is, advances of money to the obligor by the lender made on the basis of an undertaking that the obligor will repay the funds in the future (including deposits, bonds, debentures, commercial loans, and buyers’ credits) and temporary exchanges of assets that are equivalent to fully collateralized loans under which the obligor is required to repay the funds, and usually pay interest, by repurchasing the collateral from the buyer in the future (such as repurchase agreements and official swap arrangements);
ii) suppliers’ credits, that is, contracts where the supplier permits the obligor to defer payments until sometime after the date on which the goods are delivered or services are provided;
iii) leases, that is, arrangements under which property is provided which the lessee has the right to use for one or more specified period(s) of time that are usually shorter than the total expected service life of the property, while the lessor retains title to the property. For the purpose of this guideline, the debt is the present value (at the inception of the lease) of all lease payments expected to be made during the period of the agreement excluding those payments that cover the operation, repair or maintenance of the property; and
iv) Treasury bills and bonds issued in Communauté Financière Africaine (CFA) francs on the West African Economic and Monetary Union’s (WAEMU) regional market, which are included in public debt for the purpose of this Memorandum.
Under the definition of debt set out above, arrears, penalties, and judicially awarded damages arising from failure to make payment under a contractual obligation that constitutes debt are debt. Failure to make payment on an obligation that is not considered debt under this definition (for example, payment on delivery) will not give rise to debt. (b) The present value of the loan will be calculated by discounting future payments of interest and principal using the commercial interest reference rates (CIRRs) established by the Organization for Economic Cooperation and Development (OECD). Specifically, the 10-year average of CIRRs reported by the OECD will be used for loans with maturities longer than 15 years, while the six-month average of CIRRs will be used for loans with shorter maturities. To both the 10-year and 6-month averages of the reference rate, the margin for different repayment periods will be added, as established by the OECD (0.75 percent for repayment periods of less than 15 years, 1.00 percent for repayment periods of 15–19 years, 1.15 percent for repayment periods of 20–29 years, and 1.25 percent for repayment periods of 30 years or more).
(c) Domestic debt is defined as debt denominated or serviced in CFA francs, unless it is contracted with another member state; (d) External debt is defined as debt denominated in any currency other than the CFA franc and debt in CFA francs contracted with another member state.

BENIN
INTERNATIONAL MONETARY FUND 67
QUANTITATIVE PERFORMANCE CRITERIA
A. Ceiling on Net Domestic Financing of the Government
Definitions
5. Net domestic financing (NDF) of the government is defined as the sum of (i) net bank credit to the government, defined below; and (ii) net nonbank financing of the government, including the proceeds of the sale of government assets, which includes proceeds from the divestiture of parts of public enterprises, that is, privatizations, Treasury bills, and other securitized obligations issued by the government and listed in CFA francs on the WAEMU regional financial market, and any BCEAO credit to the government, including any drawings on the CFA franc counterpart of the allocation of Special Drawing Rights (SDRs).
6. Net bank credit to the government is defined as the balance between the debts and claims of the government vis-à-vis the central bank and the national commercial banks. The scope of net credit to the government is that used by the BCEAO and is in keeping with general IMF practice in this area. It implies a definition of government that is broader than the one indicated in paragraph 2. Government claims include the CFA franc cash balance, postal checking accounts, subordinated debt (obligations cautionnées), and all deposits with the BCEAO and commercial banks of government owned entities, with the exception of industrial or commercial public agencies (EPIC) and government corporations, which are excluded from the calculation. Government debt to the banking system includes all debt to the central bank and the national commercial banks, including Treasury bills and other securitized debt.
7. The figures deemed valid within the framework of the program will be the figures for net bank credit to the government and for the net amount of Treasury bills and bonds issued in CFA francs on the WAEMU regional financial market calculated by the BCEAO and the figures for nonbank financing calculated by the Treasury of Benin.
8. Gross external budgetary assistance is defined as grants, loans, and non-earmarked debt relief operations (excluding project-related loans and grants, use of IMF resources, and debt relief under the Heavily Indebted Poor Countries (HIPC) and Multilateral Debt Relief Initiatives). Net external budgetary assistance is defined as the difference between gross external budgetary assistance and the sum of total debt service obligations on all external debt (defined, in turn, as the sum of interest payments and amortizations on all external loans, including interest payments and other charges to the IMF and on project-related loans, but excluding repayment obligations to the IMF), and all payments of external payments arrears.
Performance Criteria and Indicative Targets
9. The ceiling on net domestic financing of the government (cumulative since January 1 of the same year) is set as follows: CFAF 70.1 billion at End-March 2017; CFAF 116.1 billion at end-June 2017; CFAF 183.9 billion at end-September 2017; and CFAF 177.7 billion at end-December 2017. The

BENIN
68 INTERNATIONAL MONETARY FUND
ceiling is a performance criterion for End-June and End-December 2017, and an indicative target for End-September 2017.
Adjustments
10. Net domestic financing of the government will be adjusted if net external budgetary assistance exceeds or falls short of the program projections indicated in paragraph 10:
If, at the end of a quarter, net external budgetary assistance exceeds the total projected amounts (cumulative since January 1 of the same year) by over CFAF 5 billion, the NDF ceiling will be lowered by an amount equivalent to this excess minus CFAF 5 billion.
If at the end of a quarter, net external budgetary assistance falls short of the projected amounts (cumulative since January 1 of the same year), the NDF ceiling will be increased by an amount equivalent to this shortfall, within the following limits: the increase may not exceed CFAF 15 billion at End-June 2017 and CFAF 25 billion at End-December 2017.
11. For the purposes of calculating the adjustment to the NDF ceiling, the following amounts are projected in the program:
The amounts of gross external budgetary assistance (cumulative since January 1 of the same year) projected in the program are CFAF 16.2 billion at End-March 2017; CFAF 16.2 billion at End-June 2017; CFAF 39.2 billion at End-September 2017; and CFAF 55.0 billion at End-December 2017.
The amounts of external debt service obligations (cumulative since January 1 of the same year) projected in the program are CFAF 8.8 billion at End-March 2017; CFAF 24.8 billion at End-June 2017; CFAF 32.4 billion at End-September 2017; and CFAF 50.4 billion at End-December 2017.
B. Floor for Basic Primary Fiscal Balance
Definition
12. The basic primary fiscal balance is defined as being equal to the difference between total fiscal revenue (tax and nontax) and basic primary fiscal expenditure (on a payment order basis). Basic primary fiscal expenditure is defined as fiscal (current plus capital) expenditure minus (a) the payments of interest on domestic and external debt; and (b) capital expenditure financed by external grants and loans. Grants are excluded from revenue and net government lending is excluded from fiscal expenditure.
Performance Criteria and Indicative Targets
13. The floor on the basic primary fiscal balance (cumulative since January 1 of the same year) is a balance of not less than CFAF -64.7 billion at End-March 2017; CFAF -73.1 billion at End-June 2017;

BENIN
INTERNATIONAL MONETARY FUND 69
CFAF -139.0 billion at End-September 2017; and CFAF -171.3 billion at End-December 2017. The floor is a performance criterion for End-June and End-December 2017, and an indicative target for End-September 2017.
C. Floor for Total Government Revenue
Definition
14. Total government revenue includes tax and nontax revenue as shown in the TOFE, but it excludes external grants, revenue of autonomous agencies, and privatization receipts.
Performance Criteria and Indicative Targets
15. The floor on total government revenue (cumulative since January 1 of the same year) is set at an amount that is not less than CFAF 182.9 billion at End-March 2017; CFAF 386.1 billion at End-June 2017; CFAF 602.9 billion at End-September 2017; and CFAF 843.9 billion at End-December 2017. The floor is a performance criterion for End-June and End-December 2017, and an indicative target for End-September 2017.
D. Non-Accumulation of New Domestic Payments Arrears by the Government
Definition
16. Domestic payments arrears are defined as domestic payments due but not paid after a 90-day grace period, unless the obligation specifies a longer grace period. The National Amortization Fund (CAA) and the Treasury record and update the data on the accumulation of domestic payments arrears, as well as their settlement.
Continuous Performance Criterion
17. The government undertakes not to accumulate any new domestic payments arrears. The non-accumulation of new domestic payments arrears will be continuously monitored throughout the program.
E. Non-Accumulation of External Payments Arrears by the Government
Definition
18. External public payments arrears are defined as the sum of payments due, but not paid, by the government at the due date specified in the contract, taking into account any applicable grace period, on external debt of, or guaranteed by, the government.

BENIN
70 INTERNATIONAL MONETARY FUND
19. The government undertakes not to accumulate any external public payments arrears, with the exception of arrears relating to debt that is the subject of renegotiation or rescheduling. The performance criterion on the non-accumulation of external public payments arrears will be continuously monitored throughout the program.
F. Present Value of New External Debt Contracted or Guaranteed
Definition
20. This performance criterion applies not only to debt as defined in paragraph 4a, but also to commitments contracted or guaranteed by the government (including lease-purchase contracts) for which no value has been received. This criterion also applies to private sector debt guaranteed by the government, which constitutes a contingent liability of the government. As indicated in paragraph 4c, external debt excludes Treasury bills and bonds issued in CFA francs on the WAEMU regional market.
21. The concept of “government” used for this performance criterion and for the performance criterion on the contracting or guaranteeing by the government of new external debt, includes the government, as defined in paragraph 2, local governments, and all public enterprises, including administrative public agencies (EPA), scientific and technical public agencies, professional public agencies, and enterprises jointly owned by the Beninese government with the governments of other countries.
22. Changes to the ceiling may be made (subject to approval by the IMF Executive Board) based on the results of the debt sustainability analysis prepared jointly by the staffs of the World Bank and the IMF. The performance criterion on the ceiling on the contracting or guaranteeing by the government of new external debt maturing in one year or more will be continuously monitored throughout the program.
G. Ceiling on Pre-Financing Contracts for Public Investments
Definition
23. Pre-financing contracts are defined as contracts pursuant to which the following steps are taken, normally concurrently: (i) the government entrusts a private entity with the responsibility for executing public works, financed by a loan to the entity from a commercial bank or group of commercial banks; (ii) the government, including, for the avoidance of doubt, the Minister of Finance, guarantees this loan and signs an unconditional and irrevocable agreement to replace the private entity to honor the full amount of principal and interest of the loan.

BENIN
INTERNATIONAL MONETARY FUND 71
Continuous Performance Criterion
24. The government undertakes to refrain from entering into any pre-financing contracts during the life of the program. This performance criterion with respect to pre-financing contracts for public investment will be continuously monitored throughout the program.
INDICATIVE TARGETS
A. Floor for Priority Social Expenditures
25. Priority social expenditures are determined in relation to the priority programs identified in the GAP. These expenditures consist of selected (nonwage) expenditures inter alia in the following sectors: health; energy, water, and mines; agriculture; livestock and fisheries; social affairs; education, and living standards. The execution of these expenditures is monitored on a payment order basis during the program through the Integrated Government Finance Management System (SIGFiP).
Definition
26. The indicative target for priority social expenditures is defined as the total amount (cumulative since January 1 of the same year) of the payment orders issued under the budget lines indicated in Table 1 below.
Table 1. Benin: Priority Social Expenditure Categories Budget code Description 36 Ministry of Health 37 Ministry of Energy, Water, and Mines 39 Ministry of Agriculture, Livestock, and Fisheries 26 Ministry of Justice 31 Ministry of Labor, the Civil Service, and Social Affairs 44 Ministry of Higher Education and Scientific Research 62 Ministry of Nursery School and Primary School Education 63 Ministry of Secondary and Technical Education and Professional
Training 34 Ministry of Living Standards and Sustainable Development

BENIN
72 INTERNATIONAL MONETARY FUND
INFORMATION FOR PROGRAM MONITORING
B. Data on Performance Criteria and Indicative Targets
27. To facilitate effective program monitoring, the government will provide IMF staff with the following data:
Every month:
data on any loan (terms and creditors) contracted or guaranteed by the government, in the first week after the end of the month;
monthly consumer price index, within two weeks of the end of the month;
the TOFE, including revenue, detailed data on net domestic financing of the government (bank and nonbank domestic financing, including the claims held by the nonbank private sector); and data on the basic primary fiscal balance, including data generated by the integrated fiscal management system (SIGFiP), within six weeks of the end of the month;
data on the balance, accumulation, amount (stock), and repayment of public domestic and external payments arrears, including in the event that these arrears amount to zero, within six weeks of the end of the month; and
the monetary survey, within eight weeks of the end of the month.
Every quarter:
data pertaining to the amount of exceptional payment procedures or other exceptional measures, within six weeks of the end of the quarter; and
data pertaining to priority social expenditures, within six weeks of the end of the quarter.
C. Other Information
28. The government will provide IMF staff with the following data:
Every month:
banking supervision indicators for bank and nonbank financial institutions within eight weeks of the end of the month.
Every quarter:

BENIN
INTERNATIONAL MONETARY FUND 73
data on the implementation of the public investment program, including detailed information on sources of financing, within four weeks of the end of the quarter; and
data on the stock of external debt, external debt service, the signing of external loans and disbursements of external loans, within twelve weeks of the end of the quarter.
On an ad hoc basis:
in the quarter when they become available: a copy of the budget law and its supplementary documents; a copy of the most recent budget execution law; as well as any decree or law pertaining to the budget or implementation of the IMF-supported program.

BENIN REQUEST FOR A THREE-YEAR ARRANGEMENT UNDER THE EXTENDED CREDIT FACILITY—DEBT SUSTAINABILITY ANALYSIS
This debt sustainability analysis (DSA) for Benin finds a moderate risk of debt distress, higher than in the 2015 DSA. All projected external debt burden indicators in the baseline and most indicators under stress tests remain below the policy-dependent thresholds. One indicator, the ratio of the present value of external debt to exports, exceeds its threshold in the case of an extreme shock to exports, while the debt-to-GDP ratio and all debt service indicators remain below thresholds, largely reflecting Benin’s high historical export volatility. Improving debt management is essential to contain risk at the low level. While total public and publicly-guaranteed debt confirms this conclusion, the fixed primary balance scenario underscores that medium-term fiscal consolidation is needed to strengthen long-term fiscal sustainability.
1 Prepared in collaboration with the Beninese authorities. The fiscal year for Benin is January 1–December 31. The previous DSA update was completed on November 24, 2015 (IMF Country Report No. 16/6).
Approved By Dominique Desruelle and Peter Allum (IMF) and Paloma Anos-Casero (IDA)
Prepared by staffs of the International Monetary Fund (IMF) and the International Development Association (IDA)1.
March 24, 2017
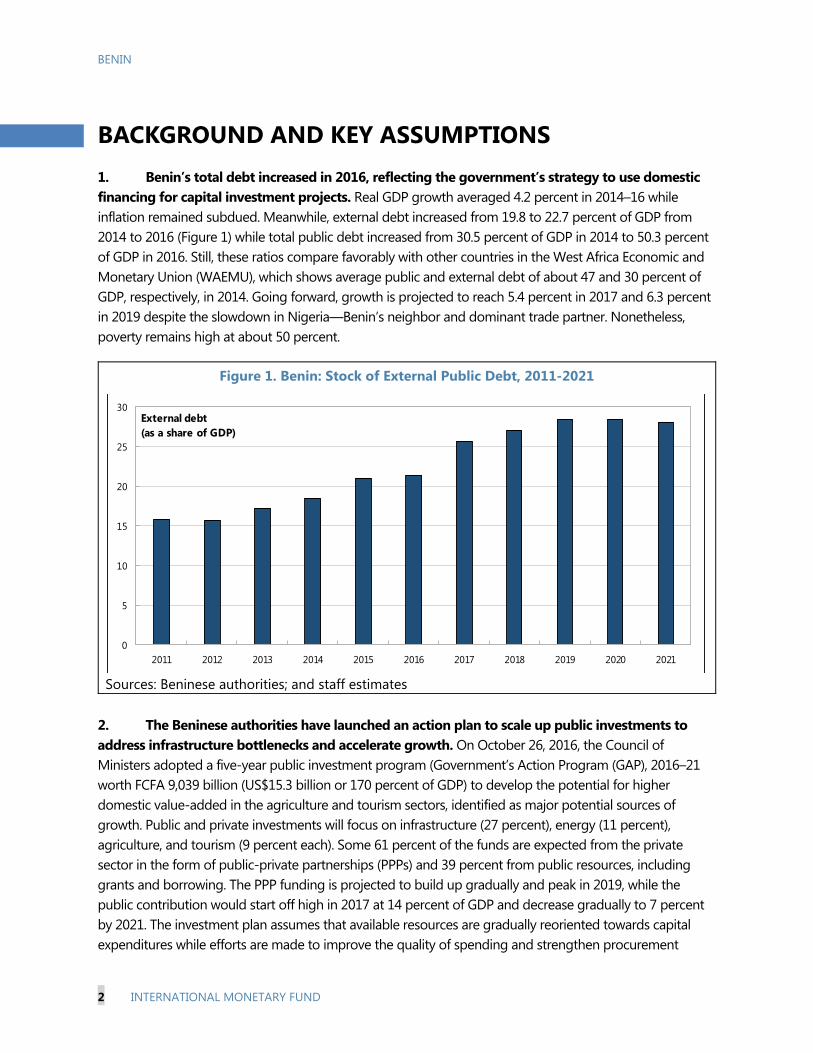
BENIN
2 INTERNATIONAL MONETARY FUND
BACKGROUND AND KEY ASSUMPTIONS 1. Benin’s total debt increased in 2016, reflecting the government’s strategy to use domesticfinancing for capital investment projects. Real GDP growth averaged 4.2 percent in 2014–16 while inflation remained subdued. Meanwhile, external debt increased from 19.8 to 22.7 percent of GDP from 2014 to 2016 (Figure 1) while total public debt increased from 30.5 percent of GDP in 2014 to 50.3 percent of GDP in 2016. Still, these ratios compare favorably with other countries in the West Africa Economic and Monetary Union (WAEMU), which shows average public and external debt of about 47 and 30 percent of GDP, respectively, in 2014. Going forward, growth is projected to reach 5.4 percent in 2017 and 6.3 percent in 2019 despite the slowdown in Nigeria—Benin’s neighbor and dominant trade partner. Nonetheless, poverty remains high at about 50 percent.
Figure 1. Benin: Stock of External Public Debt, 2011-2021
Sources: Beninese authorities; and staff estimates
2. The Beninese authorities have launched an action plan to scale up public investments toaddress infrastructure bottlenecks and accelerate growth. On October 26, 2016, the Council of Ministers adopted a five-year public investment program (Government’s Action Program (GAP), 2016–21 worth FCFA 9,039 billion (US$15.3 billion or 170 percent of GDP) to develop the potential for higher domestic value-added in the agriculture and tourism sectors, identified as major potential sources of growth. Public and private investments will focus on infrastructure (27 percent), energy (11 percent), agriculture, and tourism (9 percent each). Some 61 percent of the funds are expected from the private sector in the form of public-private partnerships (PPPs) and 39 percent from public resources, including grants and borrowing. The PPP funding is projected to build up gradually and peak in 2019, while the public contribution would start off high in 2017 at 14 percent of GDP and decrease gradually to 7 percent by 2021. The investment plan assumes that available resources are gradually reoriented towards capital expenditures while efforts are made to improve the quality of spending and strengthen procurement
0
5
10
15
20
25
30
2011 2012 2013 2014 2015 2016 2017 2018 2019 2020 2021
External debt(as a share of GDP)

BENIN
INTERNATIONAL MONETARY FUND 3
procedures. Besides enactment of a PPP Law in October 2016, the plan envisages a range of structural reforms to improve the business environment, including measures to boost financial sector development and advance reforms in health, education, and the judiciary.
3. Domestic public debt has recorded a steady increase. From about 8.6 percent of GDP in2013, domestic debt has risen by 19 percentage points to 27.6 percent of GDP in 2016 (Figure 2). About 90 percent of government domestic liabilities consist of government securities issued to the regional bond market.
Figure 2. Benin: Stock of Domestic Public Debt, 2011-2016
4. Notwithstanding weaknesses in public financial management, the scale up in investmentcould have a positive impact on growth (Text table 1). Benin’s governance indicators suggest that it can achieve higher growth from scale up investments similar to what is discussed in the literature2. In particular, increasing investments by 1 percentage point is expected to increase growth by about 0.3 percentage points on average in 2017–22 compared with projections in the 2015 DSA. The World Bank’s Country Policy and Institutional Assessment (CPIA) classifies Benin as having medium government capacity, and the latest CPIA component ratings related to fiscal management compare Benin favorably with averages for SSA and WAEMU (Text Figure 1). The 2014 PEFA assessment scores Benin broadly in line with the SSA average, although the slow enhancement since 2007 points to the need for accelerated reforms3. Medium-term
2 For example, see Arslanalp Serkan, Fabian Bornhorst, and Sanjeev Gupta, 2011, Investing in Growth, FINANCE DEVELOPMENT, March, Vol. 48, No. 1. 3 Recommendations for PFM reform to enhance investment efficiency were provided in IMF TAs and a World Bank TA on public investments and procurement.
0.0
5.0
10.0
15.0
20.0
25.0
30.0
2011 2012 2013 2014 2015 2016
Sources: Beninese authorities; and IMF staff estimates.
Domestic debt(as a share of GDP)

BENIN
4 INTERNATIONAL MONETARY FUND
growth is projected to remain at about 6 percent through 2022, higher than the average outturn in 2012–16 with gross investment picking at 29.3 percent of GDP in 2017 as a result of the scaled up investment plan.
Text Table 1: Benin: Comparison of Selected Debt-related Indicators, 2015–20 (In percent of GDP, unless noted otherwise)
Text Figure 1. Benin: Indicators of Public Sector Capacity and Governance
Benin’s capacity indicators compare favorably with the
regional averages
As does this governance indicator, despite no
improvement
2015 2016 2017 2018 2019 2020 act.
Real GDP2015 DSA 5.2 5.5 5.5 5.7 5.8 6.0Current DSA 2.2 4.0 5.4 6.0 6.3 6.7
Inflation2015 DSA 0.8 1.9 2.1 2.2 2.0 2.1Current DSA 0.3 -0.8 2.0 2.1 2.0 2.0
Public Investment 2015 DSA 7.8 8.9 8.0 7.7 7.6 7.3Current DSA 7.7 5.9 10.1 7.6 6.2 5.9
Debt-service to exports ratio2015 DSA 6.6 5.7 5.0 5.0 4.6 4.3Current DSA 6.0 4.9 4.8 5.1 4.8 4.9
Fiscal Deficit 2015 DSA (excl. grants) -6.7 -5.8 -5.3 -5.0 -4.9 -4.7Current DSA (incl. grants) -8.6 -6.7 -9.3 -5.9 -3.6 -2.4
Current Account 2015 DSA -11.0 -11.4 -11.1 -11.0 -10.7 -10.5Current DSA -8.4 -7.2 -9.1 -7.4 -7.2 -6.2
Source: IMF staff estimates and projections.
(Percent)
(Percent of GDP, unless otherwise indicated)
1/The debt-to-GDP ratio is consistent with a threshold of 56 percent of net present value of total public debt to GDP.
prog. proj.
40
42
44
46
48
50
52
54
56
58
60
Benin Other WAEMU Sub-Saharan Africa
Be
tte
r G
ove
rnan
ce -
-->
Ibrahim Index of African Governance
2005 2014

BENIN
INTERNATIONAL MONETARY FUND 5
5. Financing needs are expected to be met by a combination of donor and Fund support. Whilethe authorities continue to work with potential financiers, progress has been achieved in mobilizing concessional financing. The projected financing gap for 2017 (about 1.4 percent of GDP) will be covered by budget support from multilateral institutions and by the proposed disbursements from the Fund under the three-year ECF arrangement. Prospects are good that there will be adequate financing for the remaining program period.
6. The authorities are committed to discontinue the use of pre-financing arrangements, optingfor PPP instruments. In view of recent experiences in the sub-region and lessons learned from the pre-financing arrangements used in 2015 and early 2016, the government has canceled most of the contracts in question and has discontinued the use of this type of financing as a funding method for public investment. Furthermore, the law on PPPs should provide a frame of reference for the financing of major investment projects by the private sector. PPPs are long-term contracts under which the private sector supplies goods and infrastructure services traditionally provided by the government. PPPs can also increase efficiency and productivity through improved project design and higher quality services, and can serve as an appropriate guarantee over time. As Benin is facing both infrastructure gap and financing constraints, PPPs present prospects and could be a strong catalyst to implement their development’s objectives. On the one hand, PPPs can make it possible for Benin to withdraw from day-to-day management activities in order to focus on expected outputs and results. On the other hand, it should also be recognized that PPPs pose risks and present contingent liabilities, particularly in environments of limited capacity, weak PPP framework and related PPP institutional structures, and where prior experience with PPPs is limited.
7. The large size of the informal sector continues to complicate the DSA. Recent estimatesindicate that about 80 percent of Benin’s imports are subsequently informally re-exported to Nigeria. While the Central Bank of West-African States’ (BCEAO) balance of payment statistics attempt to differentiate between re-exports and export originating in Benin, this remains a possible source of statistical errors for trade statistics, and could also be a reason for the high export volatility recorded in the past.4
8. This DSA is consistent with the macroeconomic framework underlying the staff reportprepared for the request for a three-year ECF arrangement. The macro framework assumes a gradual convergence towards a more sustainable growth path in the long run, an increasing contribution of aggregate demand to GDP—including higher capital expenditure and private consumption—and convergence to Benin’s WAEMU membership commitments. A sustainable budget deficit level alongside the implementation of the structural reforms outlined in the GAP will allow a steady expansion of the economy throughout the baseline horizon, and the buildup of necessary buffers. In particular, the ECF supported-program envisages for 2017:
4 Overestimation of exports results in large residuals in the external DSA; the residual is projected to decline in the long term.

BENIN
6 INTERNATIONAL MONETARY FUND
real GDP growth of 5.4 percent from the expected improvement in the global economy, an expansion of agricultural output, and major capital spending;
inflation turning positive and remaining below the WAEMU convergence threshold of 3 percent.
the fiscal program targets an increase of 0.7 percentage points of GDP in government revenue to 15.4 percent of GDP, while total expenditure is expected to grow by 3.3 percentage points of GDP to 24.7 percent of GDP, driven essentially by capital spending while current primary expenditure would decline by 1.2 percentages points of GDP
the overall deficit (including grants) would widen to 7.1 percent of GDP;5 and
the current account deficit is projected to reach 9.1 percent of GDP, reflecting larger investment-related imports and an increase in domestic demand.
9. Risks to the baseline are to the downside. Main risks include weak external demand and soft commodity prices in light of the fragile global recovery, particularly the recent slowdown in Nigeria driven by lower oil prices. Also, achieving the expected growth and export impact requires the authorities to rigorously implement structural reforms to improve public financial management and the business environment. Enhancing domestic revenue performance becomes essential to reduce Benin’s dependence on informal re-exports to Nigeria over time. Furthermore, there is a risk that the private sector’s response to government investment plans in terms of planned involvement in PPPs may not be fully realized. Given the significant risk of lower growth, a customized alternative scenario is included to compare the impact.
5 The deficit is programmed to fall to 1.9 percent of GDP by 2019, well below the WAEMU convergence criterion of 3 percent.

BENIN
INTERNATIONAL MONETARY FUND 7
Box 1. Benin: Underlying Assumptions in the DSA
The assumptions in the baseline scenario are consistent with the medium-term macroeconomicframework underlying the program envisaged under the ECF arrangement. Key macroeconomicassumptions are as follows:
Global environment. The nominal exchange rate (FCFA/USD) is assumed to appreciate slightly byabout 3 percent over the baseline horizon and stabilize in the medium and long term. The externaldemand from Benin’s trading partners is projected to be stable.
Growth impact. Growth assumptions have remained roughly stable relative to the 2015 DSA. NominalGDP is expected to grow, on average, by 6.0 percent over the horizon 2017–19, supported by a robustinvestment growth and increasingly by private consumption. Growth is assumed to gradually decelerateto 6.5 percent in 2020–22 as investment normalizes and net trade contribution becomes more negative.Growth is expected to stabilize at 6.6 percent in the long run. The projected growth rates reflect lowerNigeria growth as compared to projections in the 2015 DSA.
Inflation. Capital goods will be partly imported, and the effect on non-tradable would be muted byhigh unemployment and labor mobility in WAEMU. CPI is projected to increase by up to 1 percentagepoint during the scaling up but remain below the WAEMU convergence threshold of 3 percent.
Fiscal impact. Tax revenue is projected to increase from 14.7 percent of GDP in 2016 to 16.8 percent ofGDP in 2019 as the expected reforms in tax policy and administration mature.1 The primary deficit risestemporarily with higher capital spending and then turn into a surplus in 2021.
Current account impact. As assumed in the 2015 DSA, the current account deficit is projected toincrease in the short run as Benin transitions gradually to a more domestic driven growth path and laterstabilize in the medium and long run.
Financing. The increase of central government investments of 9 percent of GDP ispredominately financed by concessional resources, with some domestic financing. Non-concessional PPG debt financing is also included. Also, the recent rise of FDI in construction,manufacturing, and services are projected to continue, in line with Benin’s recentachievements in improving its Doing Business indicators, ranked among Top 10 mostimproved countries in 2013–15.
1 Recent IMF staff analysis finds that when benchmarked by regional peers, Benin has significant scope for raising tax revenue, by about 2 percent of GDP, particularly through better domestic revenue mobilization. For example, tax expenditure is estimated to be about 1 percent of GDP per year.
EXTERNAL AND PUBLIC DEBT SUSTAINABILITY A. External Debt Sustainability Analysis
10. The results of the external DSA show that Benin’s debt dynamics are sustainable under thebaseline scenario, facing a moderate risk of debt distress (Tables A1, A2 and Figure A1). In the baseline, all debt indicators remain below their relevant policy-dependent thresholds. The present value (PV) of debt-to-GDP ratio, debt-to-exports ratio, debt-to-revenue ratio and debt service-to-exports ratio

BENIN
8 INTERNATIONAL MONETARY FUND
remain safely under the debt distress threshold under the baseline. The PV of total PPG external debt is expected to rise from about 17.4 percent of GDP in 2017 to 18.3 percent of GDP on average for 2019–21, surging to 22.5 percent of GDP in 2036. The ratio would remain below the corresponding threshold of 40 percent of GDP throughout the projection period. Nonetheless, one indicator—the ratio of the PV of external debt to exports—exceeds its threshold in the case of an extreme shock to exports, while the debt-to-GDP ratio and all debt service indicators remain below thresholds6. Benin’s WAEMU membership ensures its ability to pay in case of such a temporary shock. The debt dynamic also exhibits some vulnerability to shocks in financing terms and a one-off FCFA depreciation, although all indicators remain below thresholds in the corresponding stress scenarios. Thus, overall, Benin’s risk of external debt distress is assessed to be moderate, although further improving debt management is essential to contain potential risks at this level.
B. Public Debt Sustainability Analysis7
11. Total public (external and domestic) debt is projected to rise during the scaling up of public investment and decline afterwards (Tables A2, A3 and Figure A2). The PV of debt-to-GDP ratio is projected to rise from 42.7 percent in 2016 to 46.7 percent in 2017 with the surge in investment and then decline steadily. The ratio remains consistently below the indicative benchmark of 56 percent8, a level that research has linked to increased probability of debt distress. The debt level also remains below the WAEMU convergence criteria of 70 percent of GDP. In the most extreme shock scenario (Figure A2), the peak PV of debt-to-GDP ratio exceeds 50 percent but remains below the 56 percent threshold. Overall, the dynamics in total public debt are consistent with a moderate risk of debt distress.
C. Debt Management Capacity
12. The authorities are strengthening reforms to boost debt management capacity to support medium-term debt sustainability. Benin’s current debt monitoring capacity in recording and monitoring public debt is considered to be “adequate” since 2016, an improvement from “weak” in 2015. The reforms include streamlining of the fragmented public debt management between the treasury and the debt management agency—Caisse Autonome d'Amortissement (CAA), in line with recent IMF technical assistance recommendations. In particular, the authorities plan to enhance CAA’s capacity for more comprehensive and timely debt recording, and extend the coverage of debt monitoring, including key state-owned enterprises (SOEs) that undertake significant investment projects. The capacity to fully analyze
6 The export shock in the stress test is one standard deviation lower than the historical average export growth. For Benin, the ratio of the standard deviation to average level of the export growth over the last 10 years is about 1.7 and thus makes the shock particularly large relative to the baseline export growth. In contrast, the ratio is about 1 in the four WAEMU countries for which 2016 DSAs are available (Burkina Faso, Cote d’Ivoire, Togo, and Senegal). 7 Public DSA ratios include expected disbursements under the new ECF arrangement in an amount of SDR 111.42 million while the fiscal tables do not. 8 This PV ceiling would ensure that public debt remains comfortably within the estimated PV threshold of 56 percent of GDP, beyond which the risk of public debt distress is heightened for countries with moderate capacity like Benin.

BENIN
INTERNATIONAL MONETARY FUND 9
the impact of non-concessional borrowing needs to be enhanced to avoid an increase in the risk of debt distress.
CONCLUSION 13. The updated DSA shows a moderate risk of debt distress for Benin. Under the baselinescenario, all debt burden indicators for external debt remain under their respective debt distress thresholds. One indicator—PV of debt-to-export ratio—exceeds its threshold in an extreme shock scenario, which is confirmed by the inclusion of domestic public debt in the analysis. Nonetheless, to maintain a sustainable position, the investment plan proposed by the authorities requires the pursuit of prudent fiscal policies and pro-growth structural reforms, including in mobilizing domestic revenue and improving PFM and the business environment. Medium-term fiscal consolidation is also needed to support long-term fiscal sustainability. Finally, risks to this baseline DSA are to the downside.
14. The authorities agree with the staff’s conclusions. They concur that debt sustainability willdepend crucially on the efficiency of public investments, progress in reforms to support competitiveness, and a sound fiscal policy, including enhanced mobilization of domestic source of financing and prudent borrowing mainly through concessional financing. The authorities also committed to enhancing debt management capacity to further minimize the risk of debt distress.

Table A1. Benin External Debt Sustainability Framework Program Scenario, 2013-2036 1/ (In Percent of GDP, unless otherwise indicated)
BENIN
10 IN
TERNATIO
NAL M
ON
ETARY FUN
D
Historical 6/ Standard 6/
Average Deviation 2016-2021 2022-20362013 2014 2015 2016 2017 2018 2019 2020 2021 Average 2026 2036 Average
External debt (nominal) 1/ 16.7 19.8 21.3 22.7 26.3 27.1 27.7 27.8 27.7 31.4 32.9of which: public and publicly guaranteed (PPG) 16.7 19.8 21.3 22.7 26.3 27.1 27.7 27.8 27.7 31.4 32.9
Change in external debt 1.4 3.1 1.5 1.5 3.5 0.8 0.6 0.1 -0.1 0.6 -0.4Identified net debt-creating flows 2.4 3.6 10.4 5.0 6.2 4.2 3.9 2.8 2.2 0.6 -0.4
Non-interest current account deficit 7.2 8.4 8.1 7.4 1.2 7.0 8.8 7.0 6.8 5.8 5.3 6.8 3.7 2.3 3.5Deficit in balance of goods and services 12.8 15.2 12.9 11.8 13.8 12.4 12.1 11.4 10.5 8.6 6.2
Exports 15.5 15.8 15.9 16.4 18.2 19.6 20.5 20.1 21.5 25.1 30.0Imports 28.3 31.0 28.8 28.2 32.0 31.9 32.7 31.5 32.0 33.7 36.2
Net current transfers (negative = inflow) -5.3 -6.4 -4.5 -4.9 0.9 -4.6 -4.9 -5.3 -5.3 -5.6 -5.2 -4.3 -3.3 -4.0of which: official -3.4 -4.5 -2.1 -2.0 -2.1 -2.5 -2.3 -2.1 -2.0 -1.8 -1.8
Other current account flows (negative = net inflow) -0.3 -0.4 -0.3 -0.2 -0.1 -0.1 0.0 0.0 0.0 -0.6 -0.6Net FDI (negative = inflow) -3.3 -4.0 -1.4 -2.5 1.2 -1.3 -1.7 -1.7 -1.8 -1.8 -1.8 -2.0 -1.8 -1.9Endogenous debt dynamics 2/ -1.5 -0.8 3.8 -0.6 -0.9 -1.1 -1.2 -1.2 -1.4 -1.1 -0.9Contribution from nominal interest rate 0.2 0.2 0.4 0.2 0.3 0.4 0.4 0.5 0.4 0.6 0.6Contribution from real GDP growth -1.0 -1.0 -0.5 -0.8 -1.2 -1.5 -1.6 -1.7 -1.8 -1.7 -1.5Contribution from price and exchange rate changes -0.7 0.0 3.9 … … … … … … … …
Residual (3-4) 3/ -1.1 -0.5 -9.0 -3.6 -2.6 -3.4 -3.2 -2.7 -2.3 0.0 0.0of which: exceptional financing 0.0 0.0 0.0 0.0 0.0 0.0 0.0 0.0 0.0 0.0 0.0
PV of external debt 4/ ... ... 14.0 15.1 17.4 17.9 18.3 18.3 18.3 20.9 22.5In percent of exports ... ... 88.1 92.4 95.5 91.4 89.0 91.0 84.8 83.3 75.0
PV of PPG external debt ... ... 14.0 15.1 17.4 17.9 18.3 18.3 18.3 20.9 22.5In percent of exports ... ... 88.1 92.4 95.5 91.4 89.0 91.0 84.8 83.3 75.0In percent of government revenues ... ... 83.8 103.2 112.9 111.5 109.0 105.5 102.1 112.9 115.3
Debt service-to-exports ratio (in percent) 5.4 5.1 6.0 4.9 4.8 5.1 4.8 4.9 4.3 4.9 5.5PPG debt service-to-exports ratio (in percent) 5.4 5.1 6.0 4.9 4.8 5.1 4.8 4.9 4.3 4.9 5.5PPG debt service-to-revenue ratio (in percent) 4.8 5.0 5.7 5.5 5.7 6.2 5.8 5.7 5.2 6.7 8.4Total gross financing need (Billions of U.S. dollars) 0.4 0.5 0.6 0.6 0.7 0.6 0.6 0.6 0.5 0.5 0.7Non-interest current account deficit that stabilizes debt ratio 5.8 5.3 6.6 5.5 5.3 6.2 6.2 5.7 5.4 3.1 2.7
Key macroeconomic assumptions
Real GDP growth (in percent) 7.2 6.4 2.1 4.3 1.9 4.0 5.4 6.0 6.3 6.7 7.1 5.9 6.0 4.8 5.2GDP deflator in US dollar terms (change in percent) 4.8 -0.2 -16.4 1.6 8.6 -0.6 -2.8 1.7 2.1 2.0 2.0 0.7 0.8 2.0 1.9Effective interest rate (percent) 5/ 1.5 1.3 1.5 2.9 4.7 1.0 1.2 1.6 1.6 1.9 1.7 1.5 2.0 2.0 2.0Growth of exports of G&S (US dollar terms, in percent) 31.6 8.4 -14.5 11.2 21.7 6.7 14.0 15.8 13.9 6.6 16.7 12.3 7.0 8.0 9.6Growth of imports of G&S (US dollar terms, in percent) 26.0 16.5 -20.9 10.6 21.7 1.4 16.5 7.5 11.0 4.8 11.1 8.7 7.5 7.5 8.1Grant element of new public sector borrowing (in percent) ... ... ... ... ... 38.9 39.2 41.1 41.1 41.6 42.3 40.7 38.4 33.5 36.1Government revenues (excluding grants, in percent of GDP) 17.6 16.3 16.7 14.7 15.4 16.0 16.8 17.4 17.9 18.5 19.5 18.8Aid flows (in Billions of US dollars) 7/ 0.1 0.1 0.0 0.2 0.4 0.4 0.4 0.4 0.4 0.4 0.5
of which: Grants 0.1 0.1 0.0 0.0 0.1 0.2 0.2 0.2 0.1 0.1 0.1of which: Concessional loans 0.0 0.0 0.0 0.1 0.3 0.2 0.2 0.2 0.2 0.3 0.4
Grant-equivalent financing (in percent of GDP) 8/ ... ... ... 1.3 3.6 3.3 3.1 2.8 2.2 1.7 1.2 1.6Grant-equivalent financing (in percent of external financing) 8/ ... ... ... 51.0 51.1 62.2 61.4 62.4 58.2 46.7 40.0 43.9
Memorandum items:Nominal GDP (Billions of US dollars) 9.2 9.7 8.3 8.6 8.8 9.5 10.3 11.2 12.2 17.8 34.8Nominal dollar GDP growth 12.3 6.1 -14.7 3.4 2.5 7.9 8.5 8.8 9.2 6.7 6.9 6.9 7.2PV of PPG external debt (in Billions of US dollars) 1.1 1.2 1.5 1.7 1.9 2.1 2.2 3.7 7.8(PVt-PVt-1)/GDPt-1 (in percent) 1.2 3.4 1.9 2.0 1.6 1.6 2.0 1.8 1.3 1.8Gross workers' remittances (Billions of US dollars) 0.2 0.3 0.3 0.3 0.3 0.3 0.4 0.5 0.4 0.5 0.6PV of PPG external debt (in percent of GDP + remittances) ... ... 13.6 14.6 16.8 17.3 17.6 17.6 17.6 20.4 22.1PV of PPG external debt (in percent of exports + remittances) ... ... 73.1 76.3 80.0 77.2 75.1 74.8 73.0 75.1 71.0Debt service of PPG external debt (in percent of exports + rem ... ... 5.0 4.1 4.0 4.3 4.0 4.1 3.7 4.4 5.2
Sources: Country authorities; and staff estimates and projections.
1/ Includes both public and private sector external debt.2/ Derived as [r - g - ρ(1+g)]/(1+g+ρ+gρ) times previous period debt ratio, with r = nominal interest rate; g = real GDP growth rate, and ρ = growth rate of GDP deflator in U.S. dollar terms. 3/ Includes exceptional financing (i.e., changes in arrears and debt relief); changes in gross foreign assets; and valuation adjustments. For projections also includes contribution from price and exchange rate changes.4/ Assumes that PV of private sector debt is equivalent to its face value.5/ Current-year interest payments divided by previous period debt stock. 6/ Historical averages and standard deviations are generally derived over the past 10 years, subject to data availability. 7/ Defined as grants, concessional loans, and debt relief.8/ Grant-equivalent financing includes grants provided directly to the government and through new borrowing (difference between the face value and the PV of new debt).
Actual Projections

BENIN
INTERNATIONAL MONETARY FUND 11
Table A2. Benin Sensitivity Analysis for Key Indicators of Public and Publicly Guaranteed External Debt, 2016-2036
(In Percent)
1/ Variables include real GDP growth, growth of GDP deflator (in U.S. dollar terms), non-interest current account in percent of GDP, and non-debt
creating flows.
2/ Assumes that the interest rate on new borrowing is by 2 percentage points higher than in the baseline., while grace and maturity periods are the
same as in the baseline.
3/ Exports values are assumed to remain permanently at the lower level, but the current account as a share of GDP is assumed to return to its
baseline level after the shock.
(Implicitly assuming an offsetting adjustment in import levels).
4/ Includes official and private transfers and FDI.
5/ Depreciation is defined as percentage decline in dollar/local currency rate, such that it never exceeds 100 percent.
2016 2017 2018 2019 2020 2021 2026 2036
Baseline 15 17 18 18 18 18 21 23
A. Alternative Scenarios
A1. Key variables at their historical averages in 2016-2036 1/ 15 15 16 17 18 19 33 53A2. New public sector loans on less favorable terms in 2016-2036 2 15 19 20 21 22 23 29 37
B. Bound Tests
B1. Real GDP growth at historical average minus one standard deviation in 2017-2018 15 18 19 19 20 19 22 24B2. Export value growth at historical average minus one standard deviation in 2017-2018 3/ 15 20 26 26 25 25 26 24B3. US dollar GDP deflator at historical average minus one standard deviation in 2017-2018 15 18 20 21 21 21 24 26B4. Net non-debt creating flows at historical average minus one standard deviation in 2017-2018 4/ 15 18 20 20 20 20 22 23B5. Combination of B1-B4 using one-half standard deviation shocks 15 19 26 26 26 25 27 26B6. One-time 30 percent nominal depreciation relative to the baseline in 2017 5/ 15 25 26 26 27 26 30 33
Baseline 92 95 91 89 91 85 83 75
A. Alternative Scenarios
A1. Key variables at their historical averages in 2016-2036 1/ 92 85 82 81 89 89 130 177A2. New public sector loans on less favorable terms in 2016-2036 2 92 103 103 104 110 105 117 123
B. Bound Tests
B1. Real GDP growth at historical average minus one standard deviation in 2017-2018 92 95 91 89 91 85 83 75B2. Export value growth at historical average minus one standard deviation in 2017-2018 3/ 92 140 216 207 209 192 174 135B3. US dollar GDP deflator at historical average minus one standard deviation in 2017-2018 92 95 91 89 91 85 83 75B4. Net non-debt creating flows at historical average minus one standard deviation in 2017-2018 4/ 92 100 102 99 100 93 89 77B5. Combination of B1-B4 using one-half standard deviation shocks 92 119 158 152 153 142 131 105B6. One-time 30 percent nominal depreciation relative to the baseline in 2017 5/ 92 95 91 89 91 85 83 75
Baseline 103 113 112 109 105 102 113 115
A. Alternative Scenarios
A1. Key variables at their historical averages in 2016-2036 1/ 103 100 100 100 103 107 177 273A2. New public sector loans on less favorable terms in 2016-2036 2 103 122 126 128 127 127 158 189
B. Bound Tests
B1. Real GDP growth at historical average minus one standard deviation in 2017-2018 103 116 119 116 113 109 120 123B2. Export value growth at historical average minus one standard deviation in 2017-2018 3/ 103 130 160 153 146 140 143 125B3. US dollar GDP deflator at historical average minus one standard deviation in 2017-2018 103 118 128 125 121 117 129 132B4. Net non-debt creating flows at historical average minus one standard deviation in 2017-2018 4/ 103 119 124 121 116 112 121 118B5. Combination of B1-B4 using one-half standard deviation shocks 103 126 161 155 148 142 147 134B6. One-time 30 percent nominal depreciation relative to the baseline in 2017 5/ 103 163 161 158 153 148 163 167
PV of debt-to GDP ratio
Projections
PV of debt-to-exports ratio
PV of debt-to-revenue ratio

BENIN
12 INTERNATIONAL MONETARY FUND
Figure A1. Benin: Indicators of Public and Publicly Guaranteed External Debt under Alternative Scenarios, 2016-2036 1/
Sources: Country authorities and staff estimates
1/ The most extreme stress test is the test that yields the highest ratio on or before 2026. In figure b. it corresponds to a
Combination shock; in c. to an Exports shock; in d. to a Combination shock; in e. to an Exports shock and in figure f. to a
Combination shock.
0
5
10
15
20
25
2016 2021 2026 2031 2036
Baseline Historical scenarioMost extreme shock Exports Threshold
e.Debt service-to-exports ratio
0
5
10
15
20
25
2016 2021 2026 2031 2036
f.Debt service-to-revenue ratio
0
5
10
15
20
25
30
35
40
45
0.0
0.5
1.0
1.5
2.0
2.5
3.0
3.5
4.0
2016 2021 2026 2031 2036
Rate of Debt AccumulationGrant-equivalent f inancing (% of GDP)Grant element of new borrowing (% right scale)
a. Debt Accumulation
0
50
100
150
200
250
2016 2021 2026 2031 2036
c.PV of debt-to-exports ratio
0
10
20
30
40
50
60
2016 2021 2026 2031 2036
b.PV of debt-to GDP ratio
0
50
100
150
200
250
300
2016 2021 2026 2031 2036
d.PV of debt-to-revenue ratio

BENIN
INTERNATIONAL MONETARY FUND 13
Table A3. Benin: Public Debt Sustainability Framework, Baseline Scenario 2013-2036 (in percent of GDP, unless otherwise indicated)
Estimate
2013 2014 2015 Average5/ Standard
Deviation
5/
2016 2017 2018 2019 2020 20212016-21 Average 2026 2036
2022-36 Average
Public sector debt 1/ 25.3 30.5 42.4 50.3 55.6 56.1 54.3 51.1 47.2 37.9 39.4of which: foreign-currency denominated 16.7 19.8 21.3 22.7 26.3 27.1 27.7 27.8 27.7 31.4 32.9
Change in public sector debt -1.4 5.2 12.0 7.9 5.3 0.5 -1.8 -3.3 -3.9 0.2 -0.4Identified debt-creating flows -0.2 2.2 10.0 5.4 4.4 -0.1 -2.5 -3.6 -4.1 -0.6 -0.3
Primary deficit 2.1 1.5 7.3 1.6 2.4 5.0 6.2 2.3 0.1 -0.9 -1.3 1.9 0.6 1.0 0.4Revenue and grants 18.5 17.2 17.3 15.2 16.8 17.9 18.5 19.0 18.9 19.0 19.8
of which: grants 0.9 0.9 0.6 0.5 1.4 1.9 1.7 1.6 1.0 0.5 0.3Primary (noninterest) expenditure 20.6 18.7 24.6 20.2 23.0 20.2 18.6 18.1 17.6 19.6 20.8
Automatic debt dynamics -2.3 0.7 2.7 0.4 -1.9 -2.5 -2.6 -2.7 -2.8 -1.2 -1.3Contribution from interest rate/growth differential -1.7 -1.1 0.1 -0.3 -1.9 -2.5 -2.5 -2.7 -2.8 -1.2 -1.3
of which: contribution from average real interest rate 0.1 0.4 0.7 1.4 0.7 0.7 0.8 0.7 0.6 0.9 0.5of which: contribution from real GDP growth -1.8 -1.5 -0.6 -1.6 -2.6 -3.2 -3.3 -3.4 -3.4 -2.1 -1.8
Contribution from real exchange rate depreciation -0.6 1.8 2.6 0.7 0.0 0.0 0.0 0.0 0.0 0.0 0.0Other identified debt-creating flows 0.0 0.0 0.0 0.0 0.0 0.0 0.0 0.0 0.0 0.0 0.0
Privatization receipts (negative) 0.0 0.0 0.0 0.0 0.0 0.0 0.0 0.0 0.0 0.0 0.0Recognition of implicit or contingent liabilities 0.0 0.0 0.0 0.0 0.0 0.0 0.0 0.0 0.0 0.0 0.0Debt relief (HIPC and other) 0.0 0.0 0.0 0.0 0.0 0.0 0.0 0.0 0.0 0.0 0.0Other (specify, e.g. bank recapitalization) 0.0 0.0 0.0 0.0 0.0 0.0 0.0 0.0 0.0 0.0 0.0
Residual, including asset changes -1.2 2.9 2.0 2.5 0.9 0.7 0.7 0.3 0.2 0.8 -0.1
Other Sustainability IndicatorsPV of public sector debt ... ... 35.1 42.7 46.7 46.9 44.9 41.6 37.8 27.4 29.0
of which: foreign-currency denominated ... ... 14.0 15.1 17.4 17.9 18.3 18.3 18.3 20.9 22.5of which: external ... ... 14.0 15.1 17.4 17.9 18.3 18.3 18.3 20.9 22.5
PV of contingent liabilities (not included in public sector debt) ... ... ... ... ... ... ... ... ... ... ...Gross financing need 2/ 12.2 8.1 14.7 12.4 14.1 15.6 11.7 9.4 7.6 4.1 4.7PV of public sector debt-to-revenue and grants ratio (in percent) … … 203.1 281.3 277.9 262.1 242.5 219.5 200.0 144.2 146.3PV of public sector debt-to-revenue ratio (in percent) … … 210.3 291.1 302.9 292.8 267.8 239.5 211.5 148.0 148.6
of which: external 3/ … … 83.8 103.2 112.9 111.5 109.0 105.5 102.1 112.9 115.3Debt service-to-revenue and grants ratio (in percent) 4/ 25.3 11.7 14.4 18.7 29.6 40.8 32.3 28.2 24.6 11.0 11.5Debt service-to-revenue ratio (in percent) 4/ 26.6 12.3 14.9 19.4 32.3 45.6 35.6 30.7 26.1 11.3 11.7Primary deficit that stabilizes the debt-to-GDP ratio 3.5 -3.6 -4.7 -2.9 0.9 1.8 1.9 2.4 2.6 0.4 1.4
Key macroeconomic and fiscal assumptionsReal GDP growth (in percent) 7.2 6.4 2.1 4.3 1.9 4.0 5.4 6.0 6.3 6.7 7.1 5.9 6.0 4.8 5.2Average nominal interest rate on forex debt (in percent) 1.5 1.3 1.5 2.9 4.7 1.0 1.2 1.6 1.6 1.9 1.7 1.5 2.0 2.0 2.0Average real interest rate on domestic debt (in percent) 0.7 2.3 3.9 0.3 3.1 5.3 3.3 2.8 3.3 3.0 2.9 3.5 9.0 8.3 7.5Real exchange rate depreciation (in percent, + indicates depreciation) -4.3 11.1 13.4 1.2 8.8 3.2 0.2 0.1 -0.2 0.0 0.0 0.5 ... ... ...Inflation rate (GDP deflator, in percent) 1.4 -0.2 0.1 2.5 2.7 -0.3 2.1 2.0 2.0 2.0 2.0 1.6 0.8 2.0 1.9Growth of real primary spending (deflated by GDP deflator, in percent) 16.0 -3.4 34.2 4.7 11.6 -14.8 20.4 -6.8 -2.3 3.5 4.6 0.8 11.3 5.8 6.4Grant element of new external borrowing (in percent) ... ... ... … … 38.9 39.2 41.1 41.1 41.6 42.3 40.7 38.4 33.5 ...
Sources: Country authorities; and staff estimates and projections.1/ Data refer to gross debt, and the coverage is central government as of 2015 and includes projected new non-financial public sector borrowing from 2016 onward.2/ Gross financing need is defined as the primary deficit plus debt service plus the stock of short-term debt at the end of the last period. 3/ Revenues excluding grants.4/ Debt service is defined as the sum of interest and amortization of medium and long-term debt.5/ Historical averages and standard deviations are generally derived over the past 10 years, subject to data availability.
Actual Projections
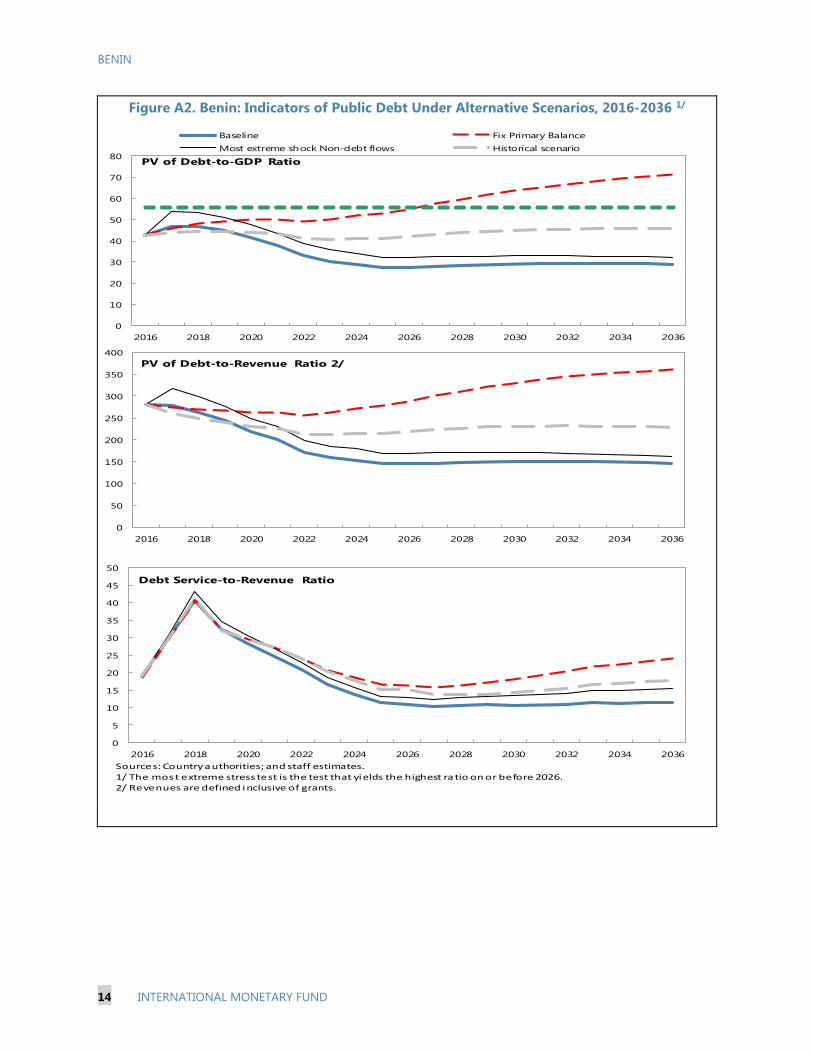
BENIN
14 INTERNATIONAL MONETARY FUND
Figure A2. Benin: Indicators of Public Debt Under Alternative Scenarios, 2016-2036 1/
0
50
100
150
200
250
300
350
400
2016 2018 2020 2022 2024 2026 2028 2030 2032 2034 2036
PV of Debt-to-Revenue Ratio 2/
0
10
20
30
40
50
60
70
80
2016 2018 2020 2022 2024 2026 2028 2030 2032 2034 2036
Baseline Fix Primary Balance
Most extreme shock Non-debt flows Historical scenario
PV of Debt-to-GDP Ratio
0
5
10
15
20
25
30
35
40
45
50
2016 2018 2020 2022 2024 2026 2028 2030 2032 2034 2036
Debt Service-to-Revenue Ratio
Sources: Country authorities; and staff estimates.
1/ The most extreme stress test is the test that yields the highest ratio on or before 2026. 2/ Revenues are defined inclusive of grants.

Statement by Mr. Sembene, Executive Director for Benin and Mr. Nguema-Affane, Senior Advisor to the Executive Director
April 7, 2017
Our Beninese authorities are thankful to Management and staff for the constructive policy dialogue that paved the way for their current request for an ECF arrangement.
Following the 2016 presidential elections, the authorities promptly took a series of urgent measures aimed at addressing growing macroeconomic imbalances facing the country, including a significant increase in the fiscal deficit and public debt. In the context of the Government’s Action Program (GAP) for 2016-21, a comprehensive strategy was developed to promote structural transformation through the consolidation of democracy, the rule of law, and good governance; launch the structural transformation of the economy; and improve living standards. The focus of the GAP is in line with the 2030 Agenda for Sustainable Development and the 2015 Paris Climate Conference (COP21).
With the aim at implementing successfully the GAP, the authorities are seeking a three-year arrangement under the Extended Credit Facility (ECF). This arrangement will serve as an anchor for the government’s macroeconomic policies and as a catalyst for financial assistance from Benin’s technical and financial partners.
Recent Economic Developments
Macroeconomic developments have been broadly positive in 2016. Despite the negative effects of the recession of the Nigerian economy on Benin’s industrial and trade sectors, the rate of economic growth almost doubled, increasing from 2.1 percent in 2015 to 4 percent in 2016 driven by a solid performance of the agricultural sector. Inflation remained below the West African Economic and Monetary Union (WAEMU) convergence threshold of 3 percent. The current account deficit declined due to continued strong export performance.
Because of the difficult economic situation in the neighboring trading partner, the revenue targets set forth in the revised budget were missed with large margins. Yet, the overall fiscal deficit was significantly reduced in 2016 owing to the authorities’ efforts to contain expenditure in line with the revised 2016 budget.
2
Advancing the Structural Reform Agenda
The implementation of the structural reform agenda accelerated markedly since June 2016, consistent with the authorities’ commitment to create fiscal space for higher public investment, improving governance and improving the business climate. On the fiscal front, reform efforts to increase domestic revenue mobilization translated into improvements in the coordination of the tax and customs administrations, and risk management procedures and controls in the customs administration. In addition, a Strategic Plan for the Tax Administration (POSAF) for 2017-2021 was adopted in February 2017 to turn the tax administration into a modern, effective institution. In parallel, an action plan to improve the management of public spending (PAAGFP) has been completed earlier this year. To ensure the effectiveness of public investment, an institutional framework for the monitoring and coordination of the GAP has been adopted. An Office of Analysis and Investigation (BAI) has been created in June 2016 for the implementation and monitoring of the GAP flagship projects.
To strengthen cash flow management, an inventory of all public accounts was launched. This initiative aims ultimately to ensure compliance with the regional directives requiring that all public funds be managed through a Treasury Single Account (TSA) opened with the regional central bank (BCEAO). In addition, a framework for the preparation and monitoring of the government’s cash flow plan was established. At the same time, an audit of domestic payment arrears is underway. Upon the completion of this audit, it is expected that an arrears clearance strategy will be developed.
Significant progress has been made in strengthening debt management. The responsibilities of the Treasury and the debt management agency (CAA) which oversee public debt management have now been clearly delineated. The availability of information on public debt has also improved with the creation of a website1, the publication of a quarterly statistical bulletin, the preparation of an annual report on public debt management; and the attachment of a medium-term debt management strategy document to the 2017 Budget.
To further improve fiscal governance and transparency, procurement procedures have been modernized with the implementation of the Integrated Public Procurement Management System (SIGMap) and the introduction of a public procurement web portal.2 This has already contributed to streamlining the procurement process. Going forward, it is the authorities’ intention to further strengthen the transparency of the public procurement system through the adoption of the Open Contracting Data Standard (OCDS) initiative.
1 http://www.caabenin.net/
2 www.marches-publics.bj

3
The law on public-private partnerships was passed in October 2016, with a view to promoting private sector participation in public investment. Nevertheless, scope still exists for further improving the PPP framework and in this regard, technical assistance from the World Bank and the Fund will be helpful. The tools developed by the IMF and the World Bank to assess and minimize fiscal risks from PPPs would be of great value.
Other major legislations adopted recently that aimed at improving the business climate include the amendments to legislations on commercial courts in September 2016, and the promulgation of the law on credit bureaus in January 2017, consistent with regional regulations.
The staff report rightly underscores the importance of reforming SOEs to fiscal risks associated with their management. in this connection, an entity tasked with overseeing State holdings has been established in June 2016 with the aim at monitoring the financial situation of SOEs more effectively. In particular, the governance framework of the national power company (SBEE) has been strengthened, notably with the recruitment of a new management team through a competitive hiring process, the appointment of a new board of directors, the establishment of a performance contract, and an audit of debt and arrears, together with a restructuring plan. The authorities intend to adopt a similar approach for other SOEs.
Implementing the Medium-Term Policy and Reform Agenda
The priorities of the economic program for 2017–19 are consistent with the strategic directions of the GAP. Policies envisaged over the medium term aimed at bringing about an in-depth transformation of Benin’s economy through sustainable and inclusive growth, while maintaining macroeconomic stability and the sustainability of public debt. The emphasis of the proposed ECF-supported program will be put on: (a) the creation of fiscal space through increased mobilization of domestic resources and more effective public spending; (b) strengthening of capacity to prepare for and implement effective public investments; and (c) measures aimed at improving the business climate, and promoting private sector development.
The medium-term macroeconomic framework is focused on an acceleration of economic growth. Inflation should remain below regional convergence threshold of 3 percent. The medium-term fiscal program targets a fiscal deficit of 4.6 percent of GDP on average during the three years covered by the program. While public spending will be redirected to investment, the authorities will pursue efforts aimed at protecting most vulnerable segments of the population through improved social protection and universal access to basic social services, as envisaged in the GAP. In addition, the government will provide support for income-generating activities through ongoing training, entrepreneurship, and microcredit for the financing of specific projects. While implementing their public investment program, the authorities are committed to ensuring the sustainability of public debt.

4
Policies and Reforms for 2017
The success of the ECF-supported program will hinge largely on the progress that will be made toward achieving fiscal targets. On this front, efforts will be made to boost revenue mobilization, while rationalizing public spending. Fiscal revenues are projected to increase to reach about 15.4 percent of GDP in 2017. To mobilize more revenues, a package of measures will be implemented, including the introduction of several new taxes in the 2017 Budget, the continued modernization of the tax and customs administrations in the context of the POSAF, and the acceleration of tax policy reforms. Based on the recommendations of a recent Fund TA mission, a strategy to recover tax arrears will be developed. Due consideration will also be given to tax policy measures recommended by other IMF TA missions and other partners to improve revenues, including the simplification of the personal income tax and updating of the legislation on transfer pricing.
A comprehensive analysis of tax expenditures will be carried out this year, with a view to designing a strategy aimed at containing and streamlining these expenditures. In the meantime, it is the authorities’ intention to eliminate tax expenditures that are no longer justified from an economic and social standpoint, or that do not have a legal basis. As provided in the 2017 Budget, the Minister of Finance will have the sole authority to grant tax expenditures that are not allowed by the existing codes. Furthermore, the 2017 Budget eliminates tax exemptions for power companies.
On the expenditure side, sustained efforts will be made to contain current spending. Thus, current expenditure as a share of GDP is expected this year to decrease by 0.7 percentage point compared to 2016. However, public spending is expected to increase by 3.3 percentage points of GDP to accommodate much-needed capital spending.
To address the significant deficiencies in the audit function in Benin, identified in the 2014 PEFA report, the Office of Analysis and Investigation has been entrusted with reorganizing the internal and external audit structures for the State. The summary reports of audits presented to the Council of Ministers will be made public and cases that call for judicial investigations will be turned over to the relevant judicial authorities.
The authorities believe that the microfinance sector can play a critical role in improving access to the financial system for small businesses. With the aim of maintaining their viability and credibility, the capacities of the supervisory and regulatory authorities of microfinance institutions (MFIs) will be strengthened, notably in rural areas.
The authorities will strive to strengthen the anti-corruption framework by addressing the deficiencies in the asset declaration regime. In this regard, some legislative amendments are envisaged to encourage assets declaration.

5
Conclusion
The Beninese authorities are requesting a three-year ECF arrangement to support the implementation of their economic program aimed at boosting the mobilization of domestic revenues, improving the quality and effectiveness of public spending, and strengthening governance and institutions. The policies and reform measures envisaged under the Fund- supported program will enable Benin to achieve sustained and inclusive growth with the aim of reducing poverty, while ensuring the sustainability of public finances and debt. In this light, we would appreciate Directors’ favorable consideration of their request for a three-year arrangement under the ECF.