imf country report no. 16/21 maltaimf country report no. 16/21 malta selected issues this selected...
TRANSCRIPT

© 2016 International Monetary Fund
IMF Country Report No. 16/21
MALTA SELECTED ISSUES
This Selected Issues paper on Malta was prepared by a staff team of the International
Monetary Fund as background documentation for the periodic consultation with the
member country. It is based on the information available at the time it was completed on
December 21, 2015.
Copies of this report are available to the public from
International Monetary Fund Publication Services
PO Box 92780 Washington, D.C. 20090
Telephone: (202) 623-7430 Fax: (202) 623-7201
E-mail: [email protected] Web: http://www.imf.org
Price: $18.00 per printed copy
International Monetary Fund
Washington, D.C.
January 2016
MALTA SELECTED ISSUES
Prepared By
European Department (In Consultation with Other Departments)
POTENTIAL OUTPUT IN MALTA: A RE-ASSESSMENT __________________________________ 2
A. Background _____________________________________________________________________________ 2
B. Methodology ____________________________________________________________________________ 3
C. Estimation Results _______________________________________________________________________ 4
D. Drivers of Potential Growth _____________________________________________________________ 5
E. What is Malta’s Growth Potential? _____________________________________________________ 10
F. Conclusions ____________________________________________________________________________ 11
REFERENCES ____________________________________________________________________________ 13
FIGURES
1. Potential Growth and Output Gap Estimates, 1996–2014 _______________________________ 4
2. Trends in Malta’s Labor Market, 2000–2014 _____________________________________________ 6
3. Tasks in Employment, 2000–2014 _______________________________________________________ 9
TABLE
1. Potential GDP Growth, 1996–2014 ______________________________________________________ 5
PENSION REFORM IN MALTA _________________________________________________________ 14
A. Background ___________________________________________________________________________ 14
B. Recent Pension Reforms in Advanced Countries and Implications for Malta __________ 18
C. Baseline, Simulations and Discussion _________________________________________________ 20
D. Sensitivity Analyses ___________________________________________________________________ 24
E. Concluding Remarks __________________________________________________________________ 25
REFERENCES ____________________________________________________________________________ 26
FIGURES
1. Recent Trends in Pension ______________________________________________________________ 15
2. Rising Spending Pressures in the Long Run ___________________________________________ 16
CONTENTS
December 21, 2015
MALTA
2 INTERNATIONAL MONETARY FUND
POTENTIAL OUTPUT IN MALTA: A RE-ASSESSMENT1
This note reassesses potential output and its components for Malta by applying a new multivariate filter approach. Potential growth has held up well since the global financial crisis and is expected to increase further as reforms of labor and energy markets are beginning to pay-off. However, raising potential growth further to bring Malta’s income level closer to EU levels would require additional reforms.
A. Background
1. Potential output is a critical input to the economic policy. Estimates of potential output can help gauge future growth and inflation prospects, and assess fiscal policy stance. Understanding its drivers—labor, capital accumulation, and TFP—can help inform discussions on policies needed to raise it.
2. This note reassesses Malta’s potential output given national account data revisions and the ongoing labor market changes. Potential output is re-estimated using a multivariate filter approach (MVF) that incorporates empirical relationships between actual and potential GDP, unemployment, and inflation (Blagrave et al, 2015). The MVF estimates are then compared to other standard approaches (Benes and Pérez Ruiz, 2013).
3. Estimates of potential growth have been frequently revised, suggesting considerable uncertainty around them (IMF, 2015). Uncertainty could relate to measurement errors or difficulty in identifying temporary demand factors even in the absence of structural breaks. Quantifying the impact of the crisis on each component of potential growth―labor, capital, and the total factor productivity (TFP)—is also difficult. Given this uncertainty, the MVF results are also compared to a range of estimates based on other standard approaches.
4. The analysis addresses the following questions: (i) How has potential output evolved during the last decade and a half?; (ii) What have been the main sources of potential growth and how has global financial crisis (GFC) affected them?; (iii) What is the likely trajectory of potential growth in the medium term (2015–20) and what is the scope for policies to enhance potential growth?
5. The note is organized as follows. Section B summarizes the MVF and other commonly used methodologies. Section C presents the results and benchmarks them against those obtained from other standard methodologies. Section D analyzes the evolution of potential growth drivers. Section E presents estimates potential growth in the medium term. The last section concludes.
1 Prepared by N. Budina and F. Grinberg. We thank participants at the seminar during the mission in Malta for useful comments and suggestions.

MALTA
INTERNATIONAL MONETARY FUND 3
B. Methodology
6. This note uses an MVF method, developed by the IMF’s Research Department.2 The MVF filter uses Bayesian techniques to estimate the relationship between cyclical unemployment—the deviation of the unemployment rate from the non-accelerating inflation rate of unemployment (NAIRU)—and inflation (Phillips curve), and the relationship between cyclical unemployment and the output gap (Okun’s law). The Research Department’s model uses first an MVF filter to estimate potential output and NAIRU, and then at the second stage production function approach to compute potential growth drivers— factor inputs, and total factor productivity (TFP), obtained as a residual. Estimated TFP developments can then be used to determine whether the filter yields reasonable outcomes.
7. The MVF estimates are then compared with results from the Hodrick-Prescott (HP) univariate filter and the European Commission’s production function (ECPF) approach.3
The HP univariate filter (Hodrick and Prescott, 1997) minimizes a loss function that increases in the distance between trend and actual GDP and the curvature of the trend function. The relative weight of the cyclical versus the structural component is determined by a smoothing parameter, encapsulating the judgment fed into the exercise.
The ECPF approach uses a production function approach to estimate potential output. Specifically, it uses Cobb-Douglas production technology to compute potential factor inputs (capital and labor) and trend TFP. Capital stock is estimated by the perpetuity inventory method. Potential labor input, defined in terms of hours worked, is estimated as follows: (i) trend labor force is estimated using the HP-filtered participation rate as a share of working age population; (ii) trend employment is estimated by applying the non-accelerating wage rate of unemployment (NAWRU) to the trend labor force,4 and (iii) trend hours worked is estimated as the product of HP-filtered average hours worked and trend employment. Trend TFP - reflecting a normal level of efficiency of factor inputs – is estimated by bivariate Kalman Filter and a Bayesian approach to account for the link between the TFP cycle and capacity utilization.
2 For more information see Blagrave and others, 2015 and Chapter 2 of the 2015 World Economic Outlook. 3 If wide swings in output tend to occur alongside wide swings in credit, an MVF filter with financial variables (MVF_FV) maybe more appropriate to use (Berger et al, 2015). In these cases, the filter will ignore wide credit swings when determining the level of potential output. 4 The NAWRU is calculated using a Kalman filter, based on a dynamic system of labor supply and demand equations, up to the second year of the forecasting horizon. Thereafter, the NAWRU is determined by a mechanical rule (it takes the value of the second year plus half of the annual change in the second year).
MALTA
4 INTERNATIONAL MONETARY FUND
C. Estimation Results
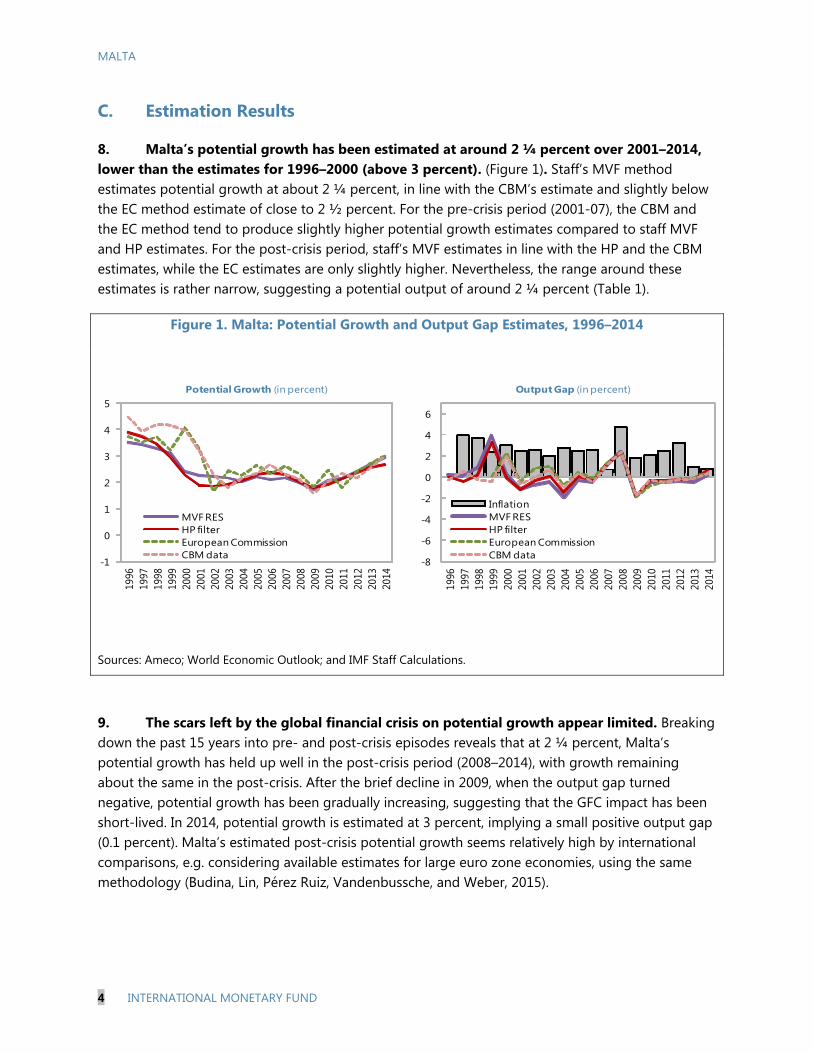
8. Malta’s potential growth has been estimated at around 2 ¼ percent over 2001–2014, lower than the estimates for 1996–2000 (above 3 percent). (Figure 1). Staff’s MVF method estimates potential growth at about 2 ¼ percent, in line with the CBM’s estimate and slightly below the EC method estimate of close to 2 ½ percent. For the pre-crisis period (2001-07), the CBM and the EC method tend to produce slightly higher potential growth estimates compared to staff MVF and HP estimates. For the post-crisis period, staff’s MVF estimates in line with the HP and the CBM estimates, while the EC estimates are only slightly higher. Nevertheless, the range around these estimates is rather narrow, suggesting a potential output of around 2 ¼ percent (Table 1).
Figure 1. Malta: Potential Growth and Output Gap Estimates, 1996–2014
Sources: Ameco; World Economic Outlook; and IMF Staff Calculations.
9. The scars left by the global financial crisis on potential growth appear limited. Breaking down the past 15 years into pre- and post-crisis episodes reveals that at 2 ¼ percent, Malta’s potential growth has held up well in the post-crisis period (2008–2014), with growth remaining about the same in the post-crisis. After the brief decline in 2009, when the output gap turned negative, potential growth has been gradually increasing, suggesting that the GFC impact has been short-lived. In 2014, potential growth is estimated at 3 percent, implying a small positive output gap (0.1 percent). Malta’s estimated post-crisis potential growth seems relatively high by international comparisons, e.g. considering available estimates for large euro zone economies, using the same methodology (Budina, Lin, Pérez Ruiz, Vandenbussche, and Weber, 2015).
-1
0
1
2
3
4
5
1996
1997
1998
1999
2000
2001
2002
2003
2004
2005
2006
2007
2008
2009
2010
2011
2012
2013
2014
MVF RES HP filterEuropean CommissionCBM data
Potential Growth (in percent)
-8
-6
-4
-2
0
2
4
6
1996
1997
1998
1999
2000
2001
2002
2003
2004
2005
2006
2007
2008
2009
2010
2011
2012
2013
2014
InflationMVF RES HP filterEuropean CommissionCBM data
Output Gap (in percent)
MALTA
INTERNATIONAL MONETARY FUND 5
-1.5
-1
-0.5
0
0.5
1
1.5
2
2.5
3
3.5
2001
2002
2003
2004
2005
2006
2007
2008
2009
2010
2011
2012
2013
2014
∆ Capital ∆ Trend Employment ∆ Trend TFP potential growth
Sources: Eurostat, Haver, Staff calculations
Potential Growth and Its Components(In percent)
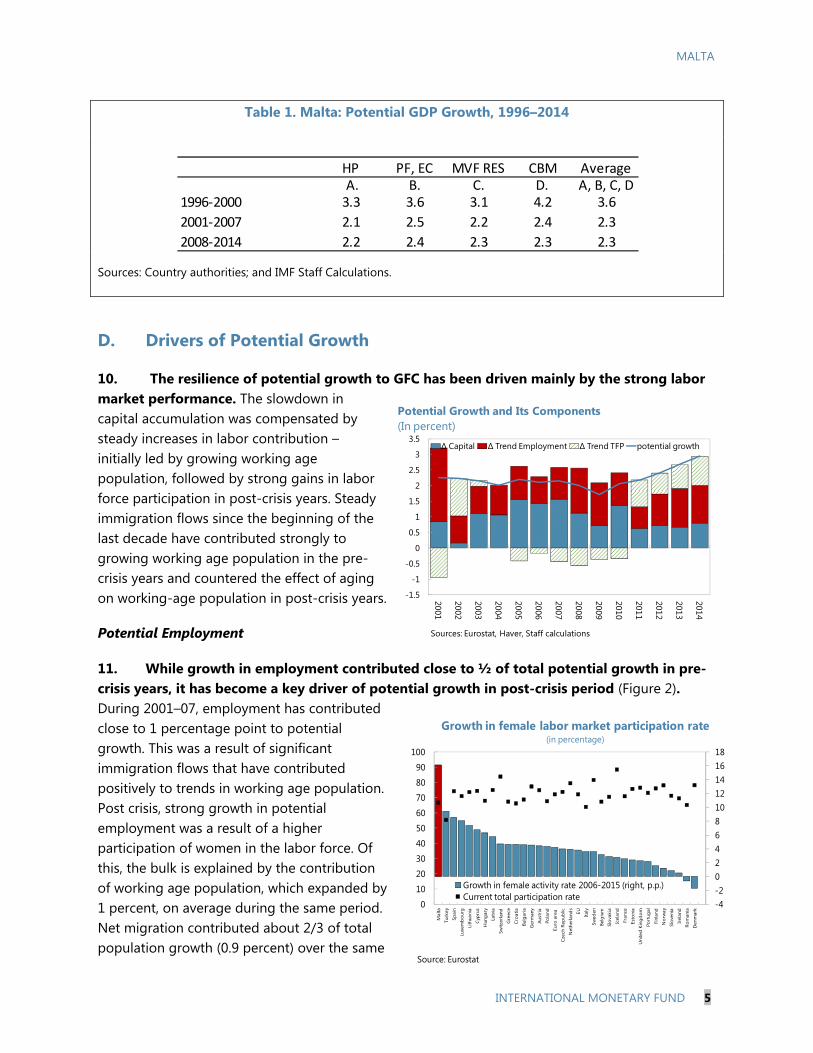
Table 1. Malta: Potential GDP Growth, 1996–2014
Sources: Country authorities; and IMF Staff Calculations.
D. Drivers of Potential Growth
10. The resilience of potential growth to GFC has been driven mainly by the strong labor market performance. The slowdown in capital accumulation was compensated by steady increases in labor contribution – initially led by growing working age population, followed by strong gains in labor force participation in post-crisis years. Steady immigration flows since the beginning of the last decade have contributed strongly to growing working age population in the pre-crisis years and countered the effect of aging on working-age population in post-crisis years.
Potential Employment
11. While growth in employment contributed close to ½ of total potential growth in pre-crisis years, it has become a key driver of potential growth in post-crisis period (Figure 2). During 2001–07, employment has contributed close to 1 percentage point to potential growth. This was a result of significant immigration flows that have contributed positively to trends in working age population. Post crisis, strong growth in potential employment was a result of a higher participation of women in the labor force. Of this, the bulk is explained by the contribution of working age population, which expanded by 1 percent, on average during the same period. Net migration contributed about 2/3 of total population growth (0.9 percent) over the same
-4-2024681012141618
0
10
20
30
40
50
60
70
80
90
100
Mal
ta
Turk
ey
Spai
n
Luxe
mb
ourg
Lith
uani
a
Cyp
rus
Hun
gary
Latv
ia
Switz
erla
nd
Gre
ece
Croa
tia
Bulg
aria
Ger
man
y
Aust
ria
Pola
nd
Euro
are
a
Cze
ch R
epub
lic
Net
herla
nds
EU Italy
Swed
en
Belg
ium
Slov
akia
Icel
and
Fran
ce
Esto
nia
Uni
ted
King
dom
Port
ugal
Finl
and
Nor
way
Slo
veni
a
Irela
nd
Rom
ania
Den
mar
k
Growth in female activity rate 2006-2015 (right, p.p.)Current total participation rate
Growth in female labor market participation rate (in percentage)
Source: Eurostat
HP PF, EC MVF RES CBM Average A. B. C. D. A, B, C, D
1996-2000 3.3 3.6 3.1 4.2 3.6
2001-2007 2.1 2.5 2.2 2.4 2.3
2008-2014 2.2 2.4 2.3 2.3 2.3

MALTA
6 INTERNATIONAL MONETARY FUND
period, while the contribution of net migration to working age population is likely to have been even higher.
12. Strong increases in labor force participation continued to contribute strongly to potential employment after the crisis. Malta’s participation increased by around 7 percent over 2008–2014, one of the highest in Europe, though starting from relatively low level. A part of this increase can be linked to policy reforms aiming at increasing female labor force participation that have been implemented during this period (CBM, 2015).
13. The remarkable increase in the contribution of potential employment is a result of increasing female participation. Over the past ten years, Malta registered the largest increase among EU Member States in the female participation rate (52.1 percent in 2014 from 36 percent in 2004). To put this into context, if female participation rates had remained constant in their 2000 level, by 2014 total labor supply would have been 13 percent lower and potential output level 9 percent lower. Together with the fall in female unemployment rate, better opportunities in the labor market have likely encouraged more women to leave inactivity.
Figure 2. Trends in Malta’s Labor Market, 2000–2014
Sources: Eurostat; and IMF Staff Calculations.

MALTA
INTERNATIONAL MONETARY FUND 7
Capital accumulation
14. The contribution of capital has slowed since the crisis. Capital accumulation has been the most important driver of potential growth in the pre- crisis years, contributing 1.1 percent on average over 2001–07. However, capital accumulation has slowed markedly, contributing only 0.9 percent to potential growth over 2008–14. The decline in private sector investment was more pronounced, falling considerably below the euro area average. However, investment has picked up in 2014, reflecting a large scale energy project to improve grid connectivity with Italy.
15. Investment dynamics reflects in part a structural shift towards less capital-intensive services. Malta has gone through significant structural changes, diversifying into new growth sectors, such as aviation services, pharmaceuticals and internet related services, leading to an increase of the share of services in value added by 10 percentage points since 2001. As a result, the capital intensity of the Maltese economy remains among the lowest in the EU.
16. Structural weaknesses, related to access to credit and high leverage, likely hinder in particular the SME investment (2014 AIV Staff Report). Access to credit remains constrained for a large fraction of SMEs. Malta is ranked at the bottom of high income countries (rank of 55) by the ease of getting credit according to WB Doing Business 2015. This likely hinders overall investment, particularly given the dominance of SMEs (more than 2/3 of total value added and about 4/5 of total employment). A significant fraction of SMEs use retained earnings or relatively more expensive funding instruments (e.g. bank overdrafts or credit lines) to fund investment (CBM 2014 Annual report, Box 1). Moreover, about 95 percent of SMEs are micro-enterprises that face significant difficulties in access to credit, related to lack of collateral and limited financial literacy (EC Malta Country report, 2015). Various initiatives to improve access
30
35
40
45
50
55
60
0
5
10
15
20
25
30
2000
2001
2002
2003
2004
2005
2006
2007
2008
2009
2010
2011
2012
2013
2014
Industry (exc constr) Construction Services (right)
Share of Value Added, Selected Sectors(in percent)
Source: Eurostat

MALTA
8 INTERNATIONAL MONETARY FUND
to finance have recently been undertaken, including the introduction of a credit register that will be administered by the Central Bank of Malta. A credit register will reduce informational asymmetries between lenders and borrowers improve SMEs’ access to finance and alleviate investment constraints.5 Moreover, this would also improve risk management and contribute to a better performing loan portfolio and lower the cost of capital.
17. The cost of credit, in particular to SMEs, remains relatively high, despite the recent monetary policy easing by the ECB. In 2014, about a quarter of survey respondents reported an increase in interest rates and only about a fifth reported a decline in interest rates, with the remaining reporting unchanged interest rates (the 2014 SAFE survey and Box 1). This suggests that a weak transmission of changes in policy rates to the retail rates charged by banks has weakened even further after the crisis in Malta (Micallef and Gauci, 2014; 2014 AIV Staff report).
18. The high share of NPLs contributes to the high lending rates. Following the global financial crisis, the share of non-performing loans in total gross loans have been on a rising trend, peaking at about 9 percent in 2014, but has declined slightly since then. Moreover, lengthy and inefficient insolvency procedures (estimated to take up to three years by the World Bank’s Doing Business report) discourage the NPL resolution.
Total Factor Productivity
19. The strong contribution of labor has compensated for weaker productivity performance. While Malta’s labor productivity growth has been comparable to that of the EU average in pre-crisis years, the level of labor productivity in Malta was still around 70 percent of the average for Western Europe in 2014. Nevertheless, the estimated TFP growth has turned positive and quite robust during the last four years.
5 For empirical estimates and a discussion of the importance of informational asymmetries in constraining firms’ investment performance in the Euro Area see Chapter 2 of Italy, 2015 Selected Issue Paper and Chapter 2 of Spain, 2015 Selected Issue Paper.
0
1
2
3
4
5
6
7
8
0
1
2
3
4
5
6
7
8
Jan-
08
Jul-0
8
Jan-
09
Jul-0
9
Jan-
10
Jul-1
0
Jan-
11
Jul-1
1
Jan-
12
Jul-1
2
Jan-
13
Jul-1
3
Jan-
14
Jul-1
4
Jan-
15
Jul-1
5
Lending Rates on Loans to NFCs1/
(Percent)
EA: Total Malta ECB Policy Rate
1/ Outstanding amounts; EA16, excluding Estonia, Latvia, and Lithuania.Source: Haver Analytics.
0
10
20
30
40
50
60
70
80
90
100
0
10
20
30
40
50
60
70
80
90
100
Turk
ey
Port
ugal
Gre
ece
Mal
ta
New
Zea
land
Cypr
us
Icel
and
Uni
ted
King
dom
Italy
Spai
n
Cana
da
Aust
ralia
Finl
and
Aust
ria
Swed
en
Switz
erla
nd
Den
mar
k
Ger
man
y
Fran
ce
Net
herla
nds
Irela
nd
Uni
ted
Stat
es
Belg
ium
Nor
way
Luxe
mbo
urg
Labor Productivity per Hour Worked, 2014 (In constant USD)
Source: Total Economy Database

MALTA
INTERNATIONAL MONETARY FUND 9
20. Dominance of micro firms may in part explain lower productivity. For manufacturing sector, there is some evidence of a positive relationship between firm size and TFP, where scale effects are important (Brandt, 2004). In addition, larger companies invest more in R&D and benefit more from ICT investments (Kumar et al., 1999, Pagano et al., 2003, Pilat, 2004). In particular, López-García and Sánchez (2010) found that microenterprises in Europe are, on average, 20 percent less productive than larger companies. At the same time, a structural shift to higher value added services sector in Malta may distort TFP estimates. Indeed, SMEs in Malta are more likely to innovate compared with the average for the EU (Box 1, 2014 CBM Annual Report).
21. Structural factors, such as inefficient public administration and judicial system can also constrain firm growth. Malta seems to rank poorly in terms of the quality of government bureaucracy, contract enforcement, access to finance and innovation capacity (World Economic Forum 2014–15 and EC Country Report, 2015). There are also severe shortcomings in the efficiency of the justice system—Malta ranks poorly in terms of the time needed to resolve civil, commercial and administrative court cases in the EU (The 2015 EU Justice Scoreboard). This suggests that reforms aiming to enhance efficiency of public administration and judicial system would be particularly important to improve conditions for firm growth.
22. Human capital could be another limiting factor. Despite some recent catch up, with higher upper secondary attainment rates among the younger cohorts, Malta’s education outcomes for total population are still below the EU average. Moreover, tertiary education enrollment rates are still low and drop-out rates are among the highest in the EU. Measures to boost tertiary education enrollment need to continue to reduce skills mismatches and improve the quality of labor (2014 Article IV).
Figure 3. Tasks in Employment, 2000–2014
Sources: Eurostat; and Authorities' data.
0102030405060708090
100
2000
2001
2002
2003
2004
2005
2006
2007
2008
2009
2010
2011
2012
2013
2014
Non routine, cognitive Routine, cognitiveNon routine, manual Routine, manual
Foreign Workers (EU)
0
20
40
60
80
100
2000
2001
2002
2003
2004
2005
2006
2007
2008
2009
2010
2011
2012
2013
2014
Non routine, cognitive Routine, cognitiveNon routine, manual Routine, manual
All Workers

MALTA
10 INTERNATIONAL MONETARY FUND
23. Skilled net migration inflows may have contributed to some in crease in the quality of labor. Net migration flows have been an important factor behind working age population growth, with their participation in total employment rising from about 2 to more than 10 percent between 2004 and 2014 (See Grech 2015). These foreign workers—and EU nationals in particular—tend to concentrate in service sectors and perform more complex, “non-routine cognitive” tasks, compared to those performed by the total workforce (See Jaimovich and Siu, 2012).6
24. Another factor that impacts negatively “the cost of doing business” is inefficiencies in energy provision. Malta’s high dependence on oil, combined with earlier inefficiencies in electricity generation and distribution resulted in relatively high cost of electricity. To address this bottleneck, efforts focused on the restructuring of the energy sector, including building an interconnector with Italy, a new gas-fired power plant and a conversion to gas of an existing power plan. Timely completion of these projects is essential for the expected benefits to materialize.
E. What is Malta’s Growth Potential?
25. Under current policies, potential growth is set to increase slightly in the medium term. Potential growth rate in the medium-term is estimated at around 3 percent, above the long-run historical average of about 2 ½ percent. The current energy investments are likely to lead to a small jump in the level of potential output over 15–16, and the completion of these projects likely enhance TFP
6 To the extent that our estimates do not account for the changes in the quality of human capital, the increase in measured tfp growth, in particularly during the last four years, could in part be explained by the sharp increase in highly skilled foreign workers from the EU.
1.1 0.91.2 1.0
1.11.1
1.31.3
-0.1
0.3
0.70.9
-0.5
0.0
0.5
1.0
1.5
2.0
2.5
3.0
3.5
-0.5
0.0
0.5
1.0
1.5
2.0
2.5
3.0
3.5
2001–2007 2008–2014 2015–2016 2017–2020
∆ Capital∆ Labor trend∆ TFP trendPotential Growth
Malta: Potential Growth (in percent)
Source: IMF Staff calculations.

MALTA
INTERNATIONAL MONETARY FUND 11
somewhat. The recent trend in female participation is expected to continue, leading to an increase in labor force participation rate by about 6 percentage points by 2020, from its 2014 level of around 66 percent. Population dynamics is expected to worsen, with population growth slightly positive (0.1 percent on average), compared to an annual average growth of 1.3 percent over 2000–2007 and 0.3 percent over 2008–2014. Projections assume that higher net migration flows, observed over the last four years will continue, therefore offsetting the impact of aging population. 7
26. Potential growth estimates are subject to uncertainty. Despite the impressive increase, female participation in Malta remains low compared to euro area average. However, if efforts to encourage participation of women and old-age workers were to increase participation rates to levels, comparable to EU average (75 percent of working age population) in 2020, the average annual potential growth would be higher by about 1/3 of a percentage point over 2015–2020 compared to the baseline.8 However, these projections are also subject to downside risks – for example, if net migration is to remain at its long term average (1600 migrants per year) and the additional increase in female participation does not materialize, the potential growth will be lower by about ½ of a percentage point.
F. Conclusions
27. This paper uses a multivariate filter approach to reassess potential output for Malta, given national account data revisions and the ongoing labor market changes. The analysis reveals that the impact of the global financial crisis on potential growth has been short-lived. Unlike in many other euro area economies, Malta’s post-crisis (2008–2014) potential growth is estimated to have increased slightly from pre-crisis years (2001–07).
28. What have been the key drivers behind these developments? The analysis of the sources of potential growth reveals that weak TFP growth performance and sizeable investment declines post-global financial crisis have been more than compensated by significant gains in potential employment.
7 Projections use population growth and labor force participation rates for ages 15 till 64, based on the EC Aging Report, but adjusted with the additional migrant flows observed in the last four years and adding the impact of additional labor market reforms on female labor force participation. See the 2015 Aging Group report, European Commission, Working group on Aging Populations and Sustainability. 8 This scenario is consistent with the CBM’s estimate of the impact of labor market reforms on potential growth over 2008–2014.
MALTA
12 INTERNATIONAL MONETARY FUND
Potential employment growth has been the key driver of potential growth in recent years, reflecting growing working age population (in part due to large migration inflows), and rising labor force participation, particularly among women, albeit starting from low levels.
Capital accumulation has been the most important factor in the pre-crisis years, but its contribution has declined since the crisis. While this may reflect in part a structural shift towards less capital-intensive services, structural weaknesses, related to access to credit, also hinder SME investment.
Post-crisis, total factor productivity growth have been weaker compared to the average for Western Europe though this weakness has been masked by the strong labor market performance. Structural factors – e.g. inefficient public administration and judicial system, and high cost of energy might have constrained firm growth.
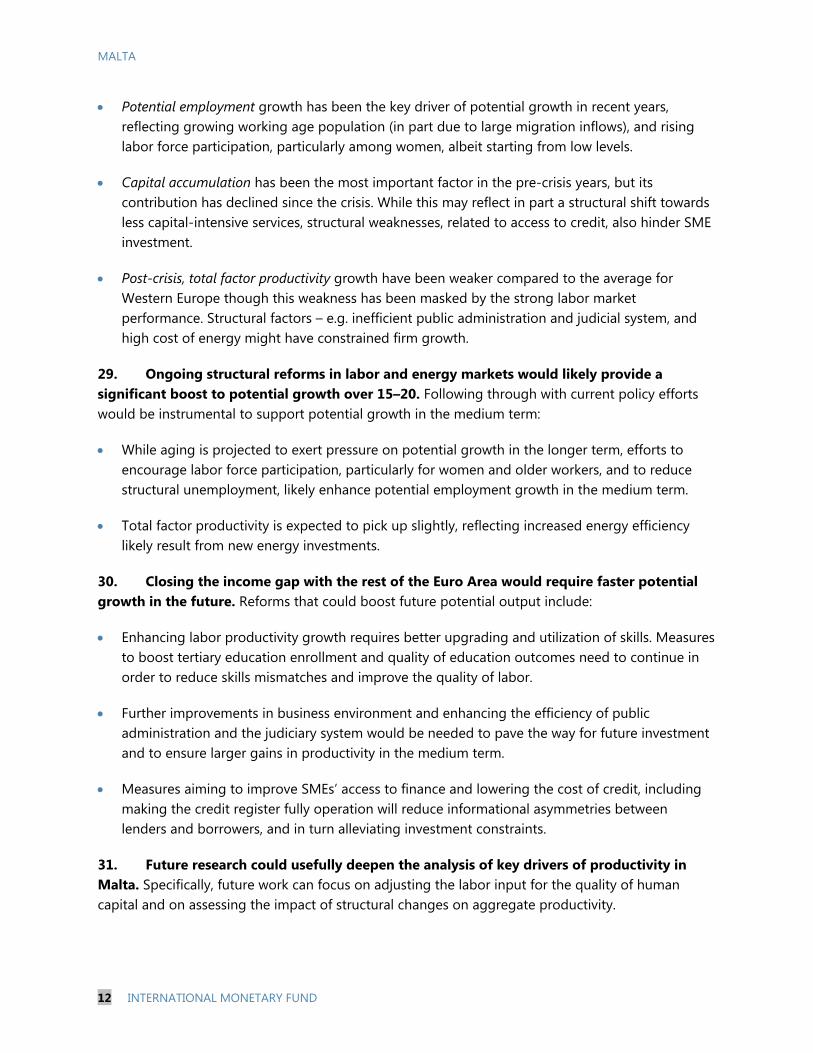
29. Ongoing structural reforms in labor and energy markets would likely provide a significant boost to potential growth over 15–20. Following through with current policy efforts would be instrumental to support potential growth in the medium term:
While aging is projected to exert pressure on potential growth in the longer term, efforts to encourage labor force participation, particularly for women and older workers, and to reduce structural unemployment, likely enhance potential employment growth in the medium term.
Total factor productivity is expected to pick up slightly, reflecting increased energy efficiency likely result from new energy investments.
30. Closing the income gap with the rest of the Euro Area would require faster potential growth in the future. Reforms that could boost future potential output include:
Enhancing labor productivity growth requires better upgrading and utilization of skills. Measures to boost tertiary education enrollment and quality of education outcomes need to continue in order to reduce skills mismatches and improve the quality of labor.
Further improvements in business environment and enhancing the efficiency of public administration and the judiciary system would be needed to pave the way for future investment and to ensure larger gains in productivity in the medium term.
Measures aiming to improve SMEs’ access to finance and lowering the cost of credit, including making the credit register fully operation will reduce informational asymmetries between lenders and borrowers, and in turn alleviating investment constraints.
31. Future research could usefully deepen the analysis of key drivers of productivity in Malta. Specifically, future work can focus on adjusting the labor input for the quality of human capital and on assessing the impact of structural changes on aggregate productivity.

MALTA
INTERNATIONAL MONETARY FUND 13
References
Benes, J., K. Clinton, R. Garcia-Saltos, M. Johnson, D. Laxton, P. Manchev and T. Matheson, 2010, “Estimating Potential Output with a Multivariate Filter,” IMF Working Paper 10/285 (Washington: International Monetary Fund).
Berger, H., T. Dowling, S. Lanau, W. Lian, M. Mrkaic, M. T. Sanjani, and P. Rabanal, forthcoming, “Steady As She Goes—Estimating Potential during Financial ‘Booms and Busts,’” IMF Working Paper (Washington: International Monetary Fund).
Blagarve, P., R. Garcia Saltos, D. Laxton, and F. Zhang, 2015, “A Simple Multivariate Filter for Estimating Potential Output,” IMF Working Paper, 17/79 (Washington: International Monetary Fund).
Budina, N., Huidan Lin, Esther Pérez Ruiz, Jérôme Vandenbussche, and Anke Weber, 2015, “Potential Output in France, Germany, and Spain: A Re-Assessment”, Chapter 3 of Spain 2015, Selected Issues Paper No. [15/233], International Monetary Fund, 2015.
European Commission, 2015, “Country Report Malta 2015”, Brussels, 26.2.2015, SWD (2015) 37.
Central Bank of Malta, 2015, “Assessing the Supply Side of the Maltese Economy using a Production Function Approach”, Report published in the Quarterly Review 2013:4.
Central Bank of Malta, 2014, Forty-seventh Annual Report and Statement of Accounts 2014.
Grech, Aaron G. (2015), “Understanding the Macroeconomic Impact of Migration in Malta”, Working Paper, Central Bank of Malta, http://www.centralbankmalta.org/file.aspx?f=11222
International Monetary Fund. 2015a. “Where Are We Headed? Perspectives on Potential Output.”
Jaimovich, Nir, and Henry E. Siu. “The Trend is the Cycle: Job Polarization and Jobless Recoveries”. No. w18334. National Bureau of Economic Research, 2012.
World Economic Outlook, Chapter 3, April 2015.
Micallef and Gauci, 2014 “Interest rate pass-through in Malta”, Quarterly Review 2014:1, Central Bank of Malta.
Micallef (2015), “Estimating the Impact of Structural Reforms to Increase the Female Participation Rate on Potential Output”, Policy Note, Central Bank of Malta.
Ministry of Finance, 2015, “Malta: Update of Stability Programme 2015–2018”
Ministry of Finance, 2015, “Malta: National Reform Programme”, April 2015.
MALTA
14 INTERNATIONAL MONETARY FUND
PENSION REFORM IN MALTA1
A. Background
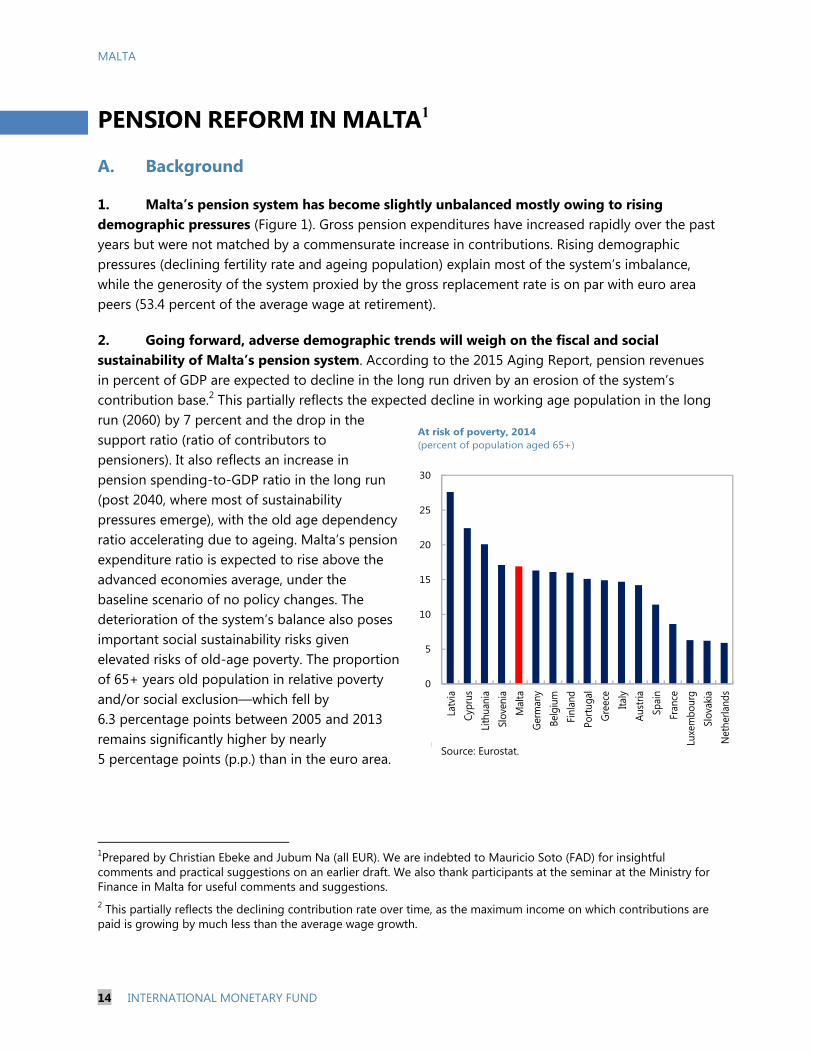
1. Malta’s pension system has become slightly unbalanced mostly owing to rising demographic pressures (Figure 1). Gross pension expenditures have increased rapidly over the past years but were not matched by a commensurate increase in contributions. Rising demographic pressures (declining fertility rate and ageing population) explain most of the system’s imbalance, while the generosity of the system proxied by the gross replacement rate is on par with euro area peers (53.4 percent of the average wage at retirement).
2. Going forward, adverse demographic trends will weigh on the fiscal and social sustainability of Malta’s pension system. According to the 2015 Aging Report, pension revenues in percent of GDP are expected to decline in the long run driven by an erosion of the system’s contribution base.2 This partially reflects the expected decline in working age population in the long run (2060) by 7 percent and the drop in the support ratio (ratio of contributors to pensioners). It also reflects an increase in pension spending-to-GDP ratio in the long run (post 2040, where most of sustainability pressures emerge), with the old age dependency ratio accelerating due to ageing. Malta’s pension expenditure ratio is expected to rise above the advanced economies average, under the baseline scenario of no policy changes. The deterioration of the system’s balance also poses important social sustainability risks given elevated risks of old-age poverty. The proportion of 65+ years old population in relative poverty and/or social exclusion—which fell by 6.3 percentage points between 2005 and 2013 remains significantly higher by nearly 5 percentage points (p.p.) than in the euro area.
1Prepared by Christian Ebeke and Jubum Na (all EUR). We are indebted to Mauricio Soto (FAD) for insightful comments and practical suggestions on an earlier draft. We also thank participants at the seminar at the Ministry for Finance in Malta for useful comments and suggestions. 2 This partially reflects the declining contribution rate over time, as the maximum income on which contributions are paid is growing by much less than the average wage growth.
0
5
10
15
20
25
30
Latv
iaCy
prus
Lith
uani
aSl
oven
iaM
alta
Germ
any
Belg
ium
Finl
and
Portu
gal
Gree
ceIta
lyAu
stria
Spai
nFr
ance
Luxe
mbo
urg
Slov
akia
Net
herla
nds
At risk of poverty, 2014(percent of population aged 65+)
EurostatSource: Eurostat.
MALTA
INTERNATIONAL MONETARY FUND 15
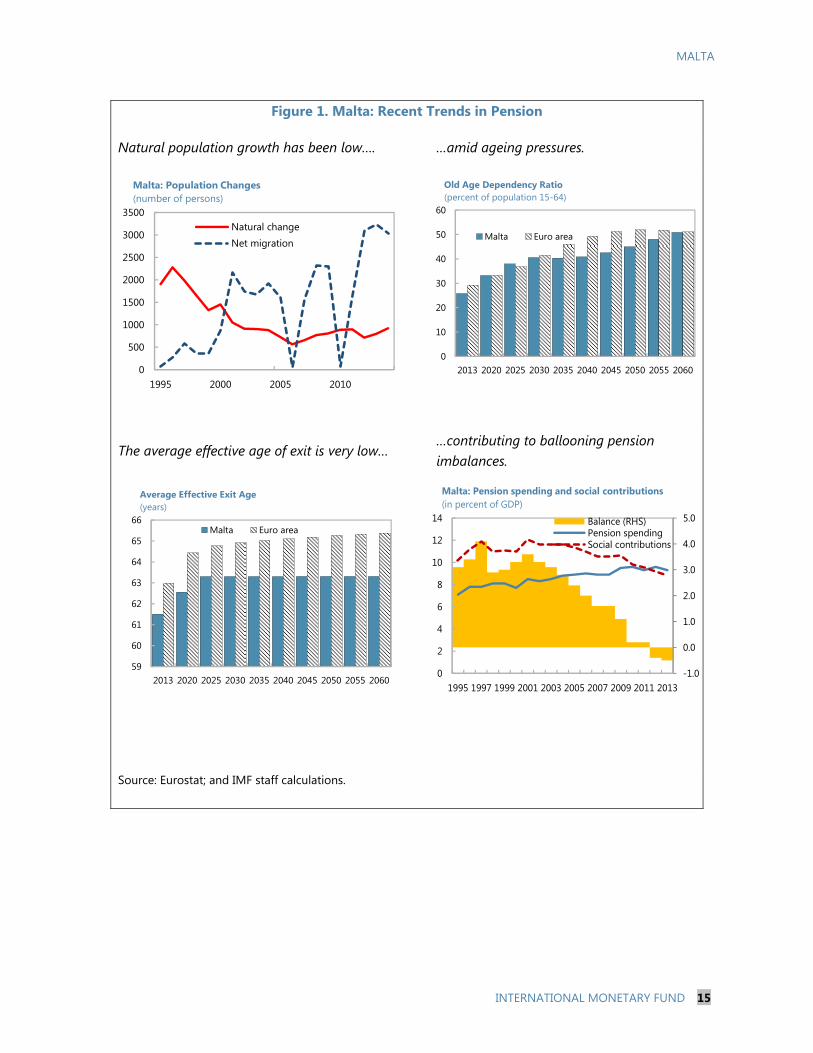
Figure 1. Malta: Recent Trends in Pension
Natural population growth has been low…. …amid ageing pressures.
The average effective age of exit is very low… …contributing to ballooning pension imbalances.
Source: Eurostat; and IMF staff calculations.
0
500
1000
1500
2000
2500
3000
3500
1995 2000 2005 2010
Natural changeNet migration
Malta: Population Changes(number of persons)
0
10
20
30
40
50
60
2013 2020 2025 2030 2035 2040 2045 2050 2055 2060
Malta Euro area
Old Age Dependency Ratio(percent of population 15-64)
59
60
61
62
63
64
65
66
2013 2020 2025 2030 2035 2040 2045 2050 2055 2060
Malta Euro area
Average Effective Exit Age(years)
-1.0
0.0
1.0
2.0
3.0
4.0
5.0
0
2
4
6
8
10
12
14
1995 1997 1999 2001 2003 2005 2007 2009 2011 2013
Balance (RHS)Pension spendingSocial contributions
Malta: Pension spending and social contributions(in percent of GDP)
MALTA
16 INTERNATIONAL MONETARY FUND
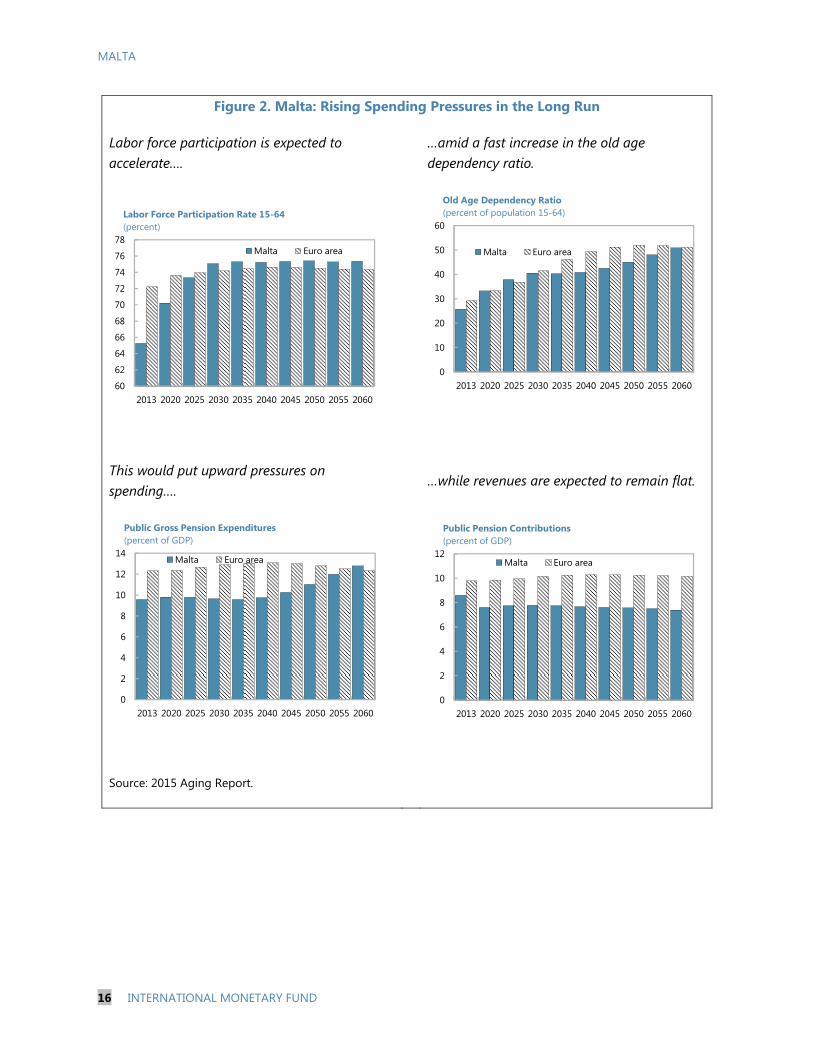
Figure 2. Malta: Rising Spending Pressures in the Long Run
Labor force participation is expected to accelerate….
…amid a fast increase in the old age dependency ratio.
This would put upward pressures on spending….
…while revenues are expected to remain flat.
Source: 2015 Aging Report.
0
2
4
6
8
10
12
14
2013 2020 2025 2030 2035 2040 2045 2050 2055 2060
Malta Euro area
Public Gross Pension Expenditures(percent of GDP)
0
2
4
6
8
10
12
2013 2020 2025 2030 2035 2040 2045 2050 2055 2060
Malta Euro area
Public Pension Contributions(percent of GDP)
60
62
64
66
68
70
72
74
76
78
2013 2020 2025 2030 2035 2040 2045 2050 2055 2060
Malta Euro area
Labor Force Participation Rate 15-64(percent)
0
10
20
30
40
50
60
2013 2020 2025 2030 2035 2040 2045 2050 2055 2060
Malta Euro area
Old Age Dependency Ratio(percent of population 15-64)

MALTA
INTERNATIONAL MONETARY FUND 17
3. Against this backdrop, a reform proposal has been laid out.3 The broad objectives of the reforms are to achieve economic and social sustainability of the system while encouraging retirement income diversification for the pensioners. Key aspects of the reform proposal include:4
Recalibrating credits to boost female labor force participation and tertiary education;
Removing the ceiling on the payment of contributions post-65 years and the retirement age (along with incentives for late exits);
Extending contribution period required to qualify for a full pension 5 and incentivizing people in the private sector to continue working by topping-up pension income by a percentage increase for any additional year.
Setting the guaranteed national minimum pension (GNMP) at the poverty threshold with an indexation mechanism accounting for wage growth and inflation to address risks of old-age poverty;
Replacing collective agreement based re-assessment for pension income with indexation mechanism and,
Linking the pensionable gross income to a selected number of “best” years over the past 15 years.6
4. The authorities have demonstrated action by taking onboard several proposals laid out by the PSG in the current 2016 budget. The measures aim at addressing both adequacy and sustainability concerns. Regarding the former, the minimum pension level is set to increase to 140 euros per week for persons with a full contributory period, while a pro rata will be given to persons who do not meet the criteria. In addition, persons contributing towards the state pension will be credited a number of contributions for child rearing and post-graduate studies. Pension sustainability is addressed with the increase in the contributory period from 40 to 41 years for
3 Actions were already taken by the authorities to address risks to the sustainability of the pension system. These include the measure to gradually increase the retirement age currently standing at 62 years to 65 years by 2027. 4 More details on the Pension Strategy Group proposals can be found at:
http://mfss.gov.mt/en/public-consultations/pensions/Documents/Pensions%20Report.pdf 5 The budget 2016 is already raising the contributory period from 40 to 41 years for persons born after 1968. 6 The Pensions Strategy Group is proposing to calculate the pensionable income on the best 3 years in last 15 years only with regards to those born 1952 to 1961 (who are currently on best 3 years in last 11, 12 or 13 years for employed persons and best 10 years in last 11,12 or 13 years for self-employed persons). As already legislated, those born from 1962 onwards would have their pensionable income calculated on best 10 years in 40 years for both employed and self-employed persons.
MALTA
18 INTERNATIONAL MONETARY FUND
persons born after 1968. The new measures also include topping up pension rate to incentivize late exits in the private sector.
5. The reform is opportune, especially given the combination of factors increasing the cost of inaction. While pension pressures are not imminent, the projected increase in expenditures likely weigh on growth. The expected deterioration of the system’s balance (under the baseline no-reform scenario) would weigh on public debt going forward, crowding out other productive investments or prompting an abrupt increase in payroll taxes, an area where Malta has benefited from lower taxation so far. Importantly, the increase in pension expenditures may prove significantly higher if optimistic assumption on the increase in labor force participation does not materialize. Therefore, the reforms provide a unique opportunity for Malta to adjust gradually, without creating distortions and preserving fairness across generations. For example, staff simulations indicate that for Malta, further significant reductions in pension expenditures could be achieved through an increase in the retirement age, a reform process which generally takes decades to be fully implemented. The success of such reforms which aim at delaying the exit from the labor market will depend to a great extent on the ability of older workers to continue in employment as pension ages go up. It will therefore be crucial to provide people with the necessary skills, and health and social support to maintain their employability as they age.
6. Staff calculations unveil significant sustainability gains from extending further the retirement age in the long run and avoiding indexing pensions to wages. Using a simplified pension expenditure accounting model, results suggest that further increasing the retirement age to 67 years will significantly stabilize pension expenditures in 2050 to current levels. This could help reduce pressures to drastically reduce the replacement rate or sharply increase revenues through labor taxes. Furthermore, the measure could help cope with the increase in minimum pension expenditures while complementing the increase in the contributory period. Avoiding wage indexation also helps to contain expenditure pressures, contributing to strengthen the long-run sustainability of the system.
7. The rest of the paper is organized as follows. The next section reviews other country examples of pension reforms to help put Malta’s reform proposals in perspective. Section C presents various simulations, such as additional efforts on the retirement age to fully stabilize pension expenditures and indexing pensions to inflation instead of a mix between nominal wages and inflation. Section D discusses the sensitivity of the projections to alternative demographic scenarios (net immigration and employment ratio). Section E concludes.
B. Recent Pension Reforms in Advanced Countries and Implications for Malta
8. Main reforms aimed at achieving the financial sustainability of the system can be broken down into three components: i) increasing the retirement age or extending the contribution period; ii) adjusting the benefit levels (including through a modification of the indexation mechanism, revised calculation of the pensionable income or direct cuts to benefits as in

MALTA
INTERNATIONAL MONETARY FUND 19
Greece); and iii) raising contribution rates.7 There is also a broad range of measures aimed at addressing specific demographic challenges, such as low female labor participation, declining natural rate of population change, and reforms focusing on realigning special pension schemes into the general system.
9. Most pension reforms focus on lengthening working lives to ensure sufficient pension entitlements and retirement income. According to the OECD (2013), measures adopted by countries have been of three main types: i) increases in the statutory retirement age and/or restricting the early retirement; ii) improved provision of financial incentives to work beyond retirement age, e.g. through work bonuses and increases in pension benefit at retirement as in France, Ireland, and Spain; and iii) less or no early retirement schemes. In the last decade, most of the 34 OECD countries have passed legislation that raises the retirement age or the contribution requirements that earn entitlement to full pension benefits. Many countries have raised the bar above 65 years of age to 67 and higher. Other types of reform that encourage late retirement include, for example, the removal of upper age limits for private pension compulsory contributions (e.g. in Australia)8, and the tightening of the access to early retirement (e.g. Belgium, Denmark, Spain). In this regard, provisions in the current reform proposal in Malta to incentivize late retirement are welcome and follow standard practice amongst advanced countries facing challenging demographic pressures. Malta has already committed to increase the retirement age to 65 years by 2027. Some countries have also changed the rules about the combination of earnings with pension receipts (e.g. Spain, Portugal, and United Kingdom). In some cases, it is not possible to work and draw a pension at the same time, leading several countries to ease the rules under certain conditions.
10. Reforms have also centered on pension indexation mechanisms to ensure pension adequacy for longer retirement periods. The Czech Republic, Greece, Hungary and Norway no longer index pensions to wage growth, while Austria, Portugal and Slovenia have frozen automatic adjustments for all but the lowest earners. Some countries have also demonstrated some flexibility in response to risks of rapid decline of benefit levels triggered by inflation-based indexations in a context of low inflation by freezing or changing temporarily indexation rules (Australia, Finland, and the U.S.). The Pension Strategy Group in Malta proposes to replace the current assessment process—where some pensioners are based on collective agreement— by an indexation mechanism based on a formula which sees pension annually increase by an indexation of 50 percent wages and 50 percent inflation or the full COLA whichever is the highest.9 The guaranteed national minimum 7 Increases in contribution rates are very often unpopular, prompting most countries to rule out increases in contribution rates explicitly or implicitly. However, some countries do have mechanisms in place to increase contribution (e.g. Canada, Germany, and Japan). There may be adverse economic effects coming from lowering incentives to work. 8 In Australia there has been an abolition of age limit (70 years) on compulsory contributions to private pension schemes in 2013. 9 At present in Malta, for a significant number of pensioners, pension benefits are aligned to an annual assessment of existing collective agreements whilst the pension income of all other pensioners is increased by the COLA. The PSG is of the view that this is socially unjust, as it provides no protection to workers who are not covered by the collective agreement.

MALTA
20 INTERNATIONAL MONETARY FUND
pension (GNMP) is also proposed to be set initially at the poverty threshold, with an annual increase between 2017 and 2026 by the full COLA plus any difference between the full COLA and the income level resulting from the application of an indexation of 50 percent wages and 50 percent inflation. Thereafter, according to the proposal, the GNMP will increase cumulatively on the basis of the full COLA plus any difference between the full COLA for that year and the change in the maximum pension (resulting from the 70/30 indexation mechanism).
11. Linking the retirement age to the life expectancy has been considered in some advanced countries. In Italy and Spain, pension age is due to increase in line with life expectancy after 2018 and 2019, respectively (see OECD, 2013). Automatic adjustment mechanisms appear to be attractive because they reduce the need for political action if and when circumstances change.
12. Benefit levels could be adjusted through changes in the reference salary used for pensionable earnings. Some countries moved away from a limited number of best or final years’ earnings to average lifetime earnings (Austria, Finland, Italy, Poland, Portugal, Norway, the Slovak Republic, and Sweden) or to longer assessment periods (France). As discussed in IMF (2014), this move tends to make the system more progressive, whereas using a limited number of years (best or final) often rewards workers who have the best or final years’ earnings higher than their lifetime average earnings. Moreover, in countries with large informal sectors, reference to a limited number of best years provides a large incentive to underreport earnings in earlier years and reinforce the system distortions. Malta is considering linking the pensionable gross income to a selected number of “best” years over the past 15 years before retirement.
C. Baseline, Simulations and Discussion
13. A simplified IMF staff model is used to project pension expenditure dynamics and assess the impact of some key reform options.10 The model uses a set of simplified assumptions and is based on the following identity of the pension expenditure (PE)-to-GDP:11
10 The Pension Expenditure Template developed by Expenditure Policy staff, Fiscal Affairs Department, at the International Monetary Fund has been used. This version includes the latest Aging Report baseline projections. 11 The template is suitable for mature systems in terms of coverage and benefits and is more appropriate for long-term- than short-term projections.

MALTA
INTERNATIONAL MONETARY FUND 21
PE PE 1 pensioners pop65 pop15-64GDPGDP pensioners pop65 pop15-64 workers
workersPE
PE pensioners pop65 1pensionersGDP workersGDP pop65 pop15-64
workers pop15-64
The first term represents the benefit generosity, the second term captures the benefit coverage, the third term shows the support ratio, and the fourth term is linked to the labor force participation rate (employment ratio).
14. There are several key assumptions behind the model, balancing accuracy and flexibility. Absent of reforms,12 pension spending is mostly driven by demographics. Second order interactions, including behavioral changes are not taken into account. The baseline projection depends on the 2015 Aging Report, using a different base to reflect the most recent data on pension expenditures in 2014. Pension expenditures simulations are then adjusted in the reform scenarios—for example, increasing retirement ages would change the eligibility ratio. The model is also flexible to accommodate a migration scenario for example, through a change in the old-age dependency ratio through net immigration patterns.
15. Staff calculations show an acceleration in the pension spending-to-GDP in the long-run. Pension spending is projected to increase from about 9 percent of GDP in 2014 to 10.3 percent in 2050. This represents a widening gap compared to the projection for other advanced economies. Higher spending is likely reflecting lower retirement age—compared with the advanced economies baseline of 67 years, and the worsening of the old age dependency ratio. The system’s coverage is also an issue with Malta’s posting a ratio of contributors to working age population of 59 percent, almost 10 percentage points lower than the advanced economies average. Factors that are contributing to contain pension expenditures under the baseline are the decline in eligibility rate—reflecting increases in the age of retirement and the steep increase in employment rates from 61 percent to 70 percent.
12 It is worth nothing that the baseline scenario includes the expected gradual increase in the retirement age to 65 years by 2027, and then remains unchanged thereafter.
MALTA
22 INTERNATIONAL MONETARY FUND
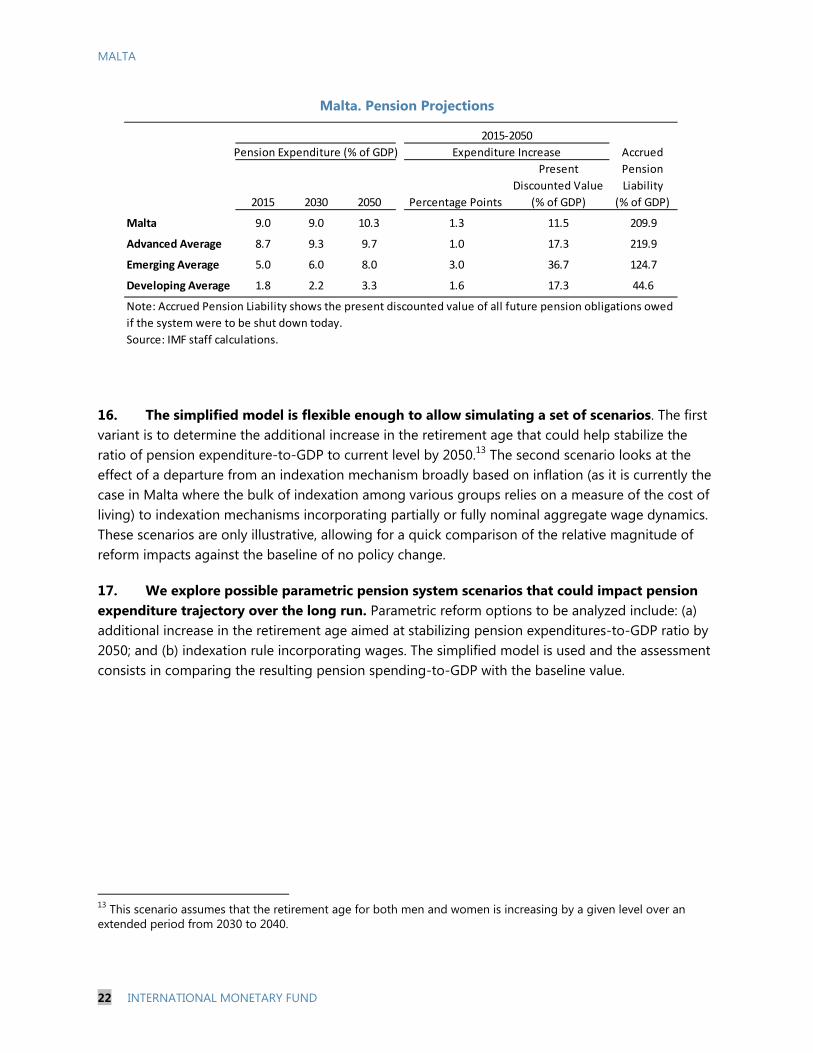
Malta. Pension Projections
16. The simplified model is flexible enough to allow simulating a set of scenarios. The first variant is to determine the additional increase in the retirement age that could help stabilize the ratio of pension expenditure-to-GDP to current level by 2050.13 The second scenario looks at the effect of a departure from an indexation mechanism broadly based on inflation (as it is currently the case in Malta where the bulk of indexation among various groups relies on a measure of the cost of living) to indexation mechanisms incorporating partially or fully nominal aggregate wage dynamics. These scenarios are only illustrative, allowing for a quick comparison of the relative magnitude of reform impacts against the baseline of no policy change.
17. We explore possible parametric pension system scenarios that could impact pension expenditure trajectory over the long run. Parametric reform options to be analyzed include: (a) additional increase in the retirement age aimed at stabilizing pension expenditures-to-GDP ratio by 2050; and (b) indexation rule incorporating wages. The simplified model is used and the assessment consists in comparing the resulting pension spending-to-GDP with the baseline value.
13 This scenario assumes that the retirement age for both men and women is increasing by a given level over an extended period from 2030 to 2040.
p j
Pension Expenditure (% of GDP) Expenditure Increase
2015 2030 2050 Percentage Points
Present
Discounted Value
(% of GDP)
Malta 9.0 9.0 10.3 1.3 11.5 209.9
Advanced Average 8.7 9.3 9.7 1.0 17.3 219.9
Emerging Average 5.0 6.0 8.0 3.0 36.7 124.7
Developing Average 1.8 2.2 3.3 1.6 17.3 44.6
Source: IMF staff calculations.
Note: Accrued Pension Liability shows the present discounted value of all future pension obligations owed
if the system were to be shut down today.
Accrued
Pension
Liability
(% of GDP)
2015-2050
MALTA
INTERNATIONAL MONETARY FUND 23
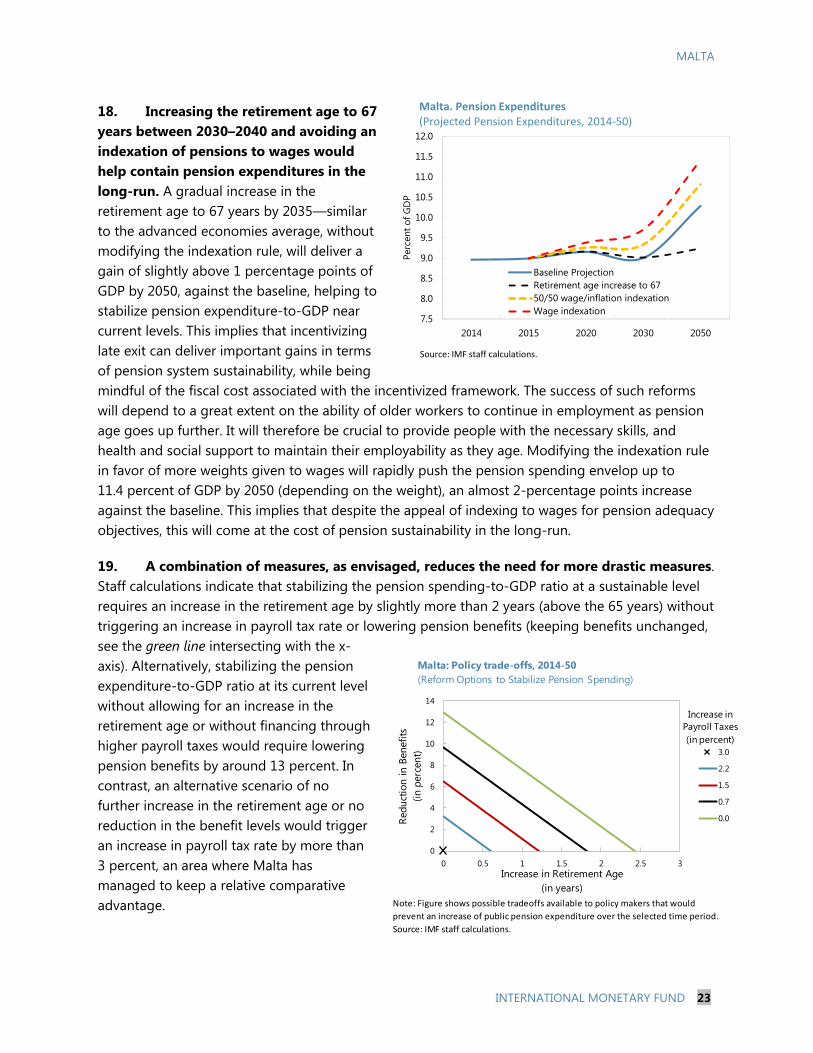
18. Increasing the retirement age to 67 years between 2030–2040 and avoiding an indexation of pensions to wages would help contain pension expenditures in the long-run. A gradual increase in the retirement age to 67 years by 2035—similar to the advanced economies average, without modifying the indexation rule, will deliver a gain of slightly above 1 percentage points of GDP by 2050, against the baseline, helping to stabilize pension expenditure-to-GDP near current levels. This implies that incentivizing late exit can deliver important gains in terms of pension system sustainability, while being mindful of the fiscal cost associated with the incentivized framework. The success of such reforms will depend to a great extent on the ability of older workers to continue in employment as pension age goes up further. It will therefore be crucial to provide people with the necessary skills, and health and social support to maintain their employability as they age. Modifying the indexation rule in favor of more weights given to wages will rapidly push the pension spending envelop up to 11.4 percent of GDP by 2050 (depending on the weight), an almost 2-percentage points increase against the baseline. This implies that despite the appeal of indexing to wages for pension adequacy objectives, this will come at the cost of pension sustainability in the long-run.
19. A combination of measures, as envisaged, reduces the need for more drastic measures. Staff calculations indicate that stabilizing the pension spending-to-GDP ratio at a sustainable level requires an increase in the retirement age by slightly more than 2 years (above the 65 years) without triggering an increase in payroll tax rate or lowering pension benefits (keeping benefits unchanged, see the green line intersecting with the x-axis). Alternatively, stabilizing the pension expenditure-to-GDP ratio at its current level without allowing for an increase in the retirement age or without financing through higher payroll taxes would require lowering pension benefits by around 13 percent. In contrast, an alternative scenario of no further increase in the retirement age or no reduction in the benefit levels would trigger an increase in payroll tax rate by more than 3 percent, an area where Malta has managed to keep a relative comparative advantage. Note: Figure shows possible tradeoffs available to policy makers that would
prevent an increase of public pension expenditure over the selected time period.
Source: IMF staff calculations.
0
2
4
6
8
10
12
14
0 0.5 1 1.5 2 2.5 3
Redu
ctio
n in
Ben
efits
(in p
erce
nt)
Increase in Retirement Age(in years)
3.0
2.2
1.5
0.7
0.0
Malta: Policy trade-offs, 2014-50(Reform Options to Stabilize Pension Spending)
Increase in Payroll Taxes(in percent)
7.5
8.0
8.5
9.0
9.5
10.0
10.5
11.0
11.5
12.0
2014 2015 2020 2030 2050
Perc
ent o
f GD
P
Baseline ProjectionRetirement age increase to 6750/50 wage/inflation indexationWage indexation
Malta. Pension Expenditures(Projected Pension Expenditures, 2014-50)
Source: IMF staff calculations.

MALTA
24 INTERNATIONAL MONETARY FUND
D. Sensitivity Analyses
20. Alternative paths of labor force participation rates or net immigration are modeled within staff framework. How much would pension expenditures increase (decrease) if a slower increase in labor force participation rate (or a more optimistic net immigration share of working age population) is assumed?14 The pension expenditure model is therefore amended to include an alternative scenario where the employment ratio rises but remains 5 percentage points lower than the 2015 Aging Report’s baseline scenario post-2025. This translates into a lower cumulative increase in the employment ratio over 2013–2060 (4.5 percentage points compared to 9.3 percentage points in the baseline). Regarding the net immigration alternative scenario, staff considers a double of the baseline yearly net immigration flows from 2013 onwards compared to the baseline average of yearly flows at 1.6 thousand net immigrants currently considered in the 2015 Aging Report. This suggests a stable flow of net immigration of a slightly about 3000 individuals. Net immigration is also assumed to reduce the old-age dependency ratio, as it mainly consists of working age population adding to the labor force.15 Should Malta succeeds in stabilizing a migration-to-population ratio and successfully absorb the labor force into the labor market, there would be some gains associated with the strengthening of the sustainability of the pension system.
21. Staff calculations highlight the sensitivity of pension spending trajectory to alternative labor force participation and net immigration scenarios. In particular, a much conservative assumption about the employment ratio in Malta in the long run leads to an increase in pension expenditures-to-GDP from by 4.2 percentage points of GDP between 2013‒2060 against a baseline increase of about 3.2 percentage points. Turning to the scenario of doubling net immigration flows, the expected level of pension expenditures-to-GDP by 2060 is about 1 percentage points lower than the
14 The labor market participation rate (of people aged 20–64) in Malta (69.0 percent) was below the EU-28 average in 2013 (76.5 percent), but it is projected to equal the EU-28 average in 2053 (79.9 percent). The participation rate of older workers (aged 55–64) in 2013 was lower (38.7 percent) than the EU-28 average (54.4 percent). Over the period 2013 to 2053, the participation rate of older workers is projected to increase by 26.4 p.p. to 65.0 percent in 2053. The percentage increase is higher than in the EU-28 (15.3 p.p.: from 54.4 percent in 2013 to 69.7 percent in 2053). According to the 2015 Ageing Report, employment rate (of people aged 20-64) is projected to increase from 65.0 percent in 2013 (EU-28: 68.4 percent) to 75.1 percent in 2053 (EU-28: 74.9 percent). Employment rate of older people (aged 55–64) is projected to change from 36.5 percent in 2013 to 61.0 percent in 2053 (EU-28: from 50.3 percent to 66.6 percent). 15 Under this scenario, the old age dependency ratio is lowered by 2 percentage points per year compared to the 2015 Aging Report’s baseline.
7.5
8.5
9.5
10.5
11.5
12.5
13.5
14.5
2013 2020 2025 2030 2035 2040 2045 2050 2055 2060
2015 Aging Report baseline
Downside labor participation scenario
Upside migration scenario
Malta. Pension Expenditures, 2013-60(in percent of GDP)
Sources: 2015 Aging Report and IMF staff calculations.
MALTA
INTERNATIONAL MONETARY FUND 25
baseline net immigration scenario. This is an important finding which highlights the dampening effect of net immigration of workers on pension expenditures in the long run, provided that the influx of additional workers is well absorbed by the labor market.
E. Concluding Remarks
22. The authorities’ efforts to move forward with the pension reform are commendable, given rising downside risks to the long-term social and financial sustainability of the system. Adverse demographic trends are weighing on Malta’s long term sustainability of its pension system. Elevated risk of old-age poverty is adding pressure on the social sustainability front, as the costs of delaying reform actions will become even larger and politically unfeasible if gross replacement rates have to fall to compensate for the system’s long-term imbalances. Delaying the reform could also trigger sharper fiscal adjustments ex post—in the form of raising taxes, cutting spending across the board or increasing debt, which could weigh on long term growth and resilience to macroeconomic shocks.
23. Fine-tuning the current reform proposals and aligning some of their aspects to international best practices will help strengthen the long run viability of the system. In this regard, staff welcome plans to incentivize late exits from the labor market and gradually increase the effective retirement age. These measures would benefit from a periodical reassessments going forward to better take into accounts adverse developments related to the pension outlook, including from unexpected behavioral, demographic and macroeconomic changes. Consideration could also be given to: i) ensuring that contributory years reflect life expectancy in the next assessment; ii) linking pensionable income to life time income with a fair valorization to ensure equity across groups; iii) ensuring that incentives lead indeed to an increase in the effective retirement age; and iv) avoiding indexation to wages, (v) expanding alternative sources of old-age disposable income including through equity releases, and private savings, (vi) incentivizing labor demand for seniors. In addition, measures to support female participation and education contained in the current proposal are better addressed transparently within the budget framework. The success of such reforms which aim at delaying the exit from the labor market will depend to a great extent on the ability of older workers to continue in employment as pension ages go up. It will therefore be crucial to provide people with the necessary skills, and health and social support to maintain their employability as they age.

MALTA
26 INTERNATIONAL MONETARY FUND
References
European Commission (2015), The 2015 Aging Report.
IMF (2014). Equitable and Sustainable Pensions: Challenges and Experience, International Monetary Fund.
OECD (2013), Pensions at a Glance 2013: OECD and G20 Indicators, OECD Publishing.
OECD (2014), OECD Pensions Outlook 2014, OECD Publishing.
OECD (2012), Putting Pensions on Auto-pilot, OECD Pensions Outlook 2012, OECD Publishing.
Pension Strategy Group (2015), Strengthening the Pension System, Ministry of the Family and Social Solidarity, Malta.