imf country report no. 16/172 republic of latvia · republic of latvia 2 international monetary...
TRANSCRIPT

© 2016 International Monetary Fund
IMF Country Report No. 16/172
REPUBLIC OF LATVIA SELECTED ISSUES PAPER
This Selected Issues paper on Republic of Latvia was prepared by a staff team of the
International Monetary Fund as background documentation for the periodic consultation
with the member country. It is based on the information available at the time it was
completed on May 17, 2016.
Copies of this report are available to the public from
International Monetary Fund Publication Services
PO Box 92780 Washington, D.C. 20090
Telephone: (202) 623-7430 Fax: (202) 623-7201
E-mail: [email protected] Web: http://www.imf.org
Price: $18.00 per printed copy
International Monetary Fund
Washington, D.C.
June 2016

REPUBLIC OF LATVIA SELECTED ISSUES
Approved By European Department
Prepared By Pragyan Deb and Maral Shamloo.
P
POST-CRISIS ADJUSTMENT IN LATVIA: EVIDENCE FROM FIRM LEVEL DATA ________ 3
A. The Macroeconomic Adjustment ______________________________________________________ 3
B. Sector and Firm Level Data _____________________________________________________________ 4
C. Was There a Sectoral Shift? ____________________________________________________________ 6
D. What Drove Firm Level Differences? ___________________________________________________ 8
E. Did Export Oriented Firms Benefit Differentially? ______________________________________ 11
F. Policy Implications ____________________________________________________________________ 13
FIGURES
1. Macroeconomic Adjustment ___________________________________________________________ 4
2. Trends by Industry _____________________________________________________________________ 7
3. Trends by Firm Size ____________________________________________________________________ 8
4. Gains in X-Efficiency ___________________________________________________________________ 11
5. Trends by Export Orientation __________________________________________________________ 12
6. Increase in TFP and Employment by Export Orientation _______________________________ 12
7. TFP: Contribution and Drivers _________________________________________________________ 13
TABLE
1. Orbis Data Coverage, 2005–14 _________________________________________________________ 5
ANNEXES
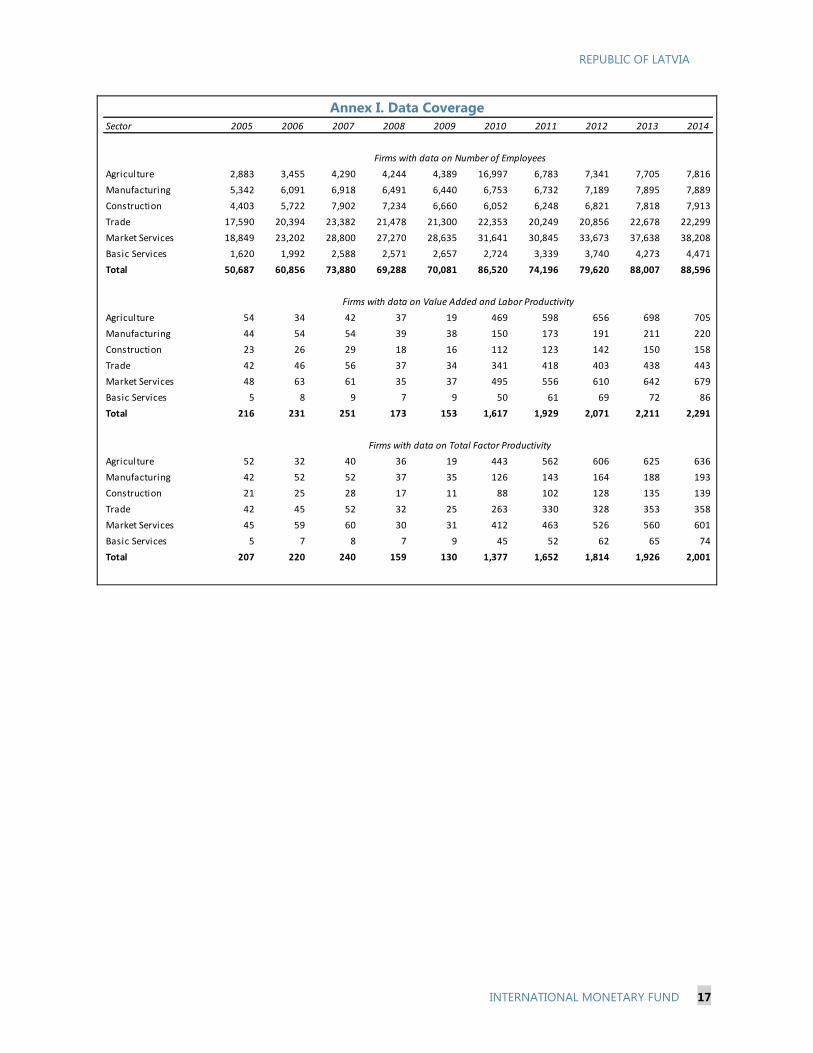
I. Data Coverage _________________________________________________________________________ 17
II. Difference in Means Result ____________________________________________________________ 18
References _______________________________________________________________________________ 19
CONTENTS
May 17, 2016
REPUBLIC OF LATVIA
2 INTERNATIONAL MONETARY FUND
ELUSIVE CREDIT GROWTH IN LATVIA: CAUSES AND REMEDIES _____________________20
A. Background ___________________________________________________________________________ 21
B. Why Has Credit Been Restrained? _____________________________________________________ 25
C. Lessons and Policy Implications _______________________________________________________ 30
BOXES
1. Institutional Responsibility for Supervisory and Macroprudential Policy in the Nordic-
Baltic Area _______________________________________________________________________________ 32
2. Policy Measures Intended to Encourage Credit Growth: Examples from Various
Jurisdictions _____________________________________________________________________________ 33
FIGURES
1. The Two Segments of the Banking Sector _____________________________________________ 22
2. The Financial Sector Repair Process is Coming to Completion ________________________ 23
3. Latvia Through the Credit Cycle _______________________________________________________ 24
4. Financial Condition ____________________________________________________________________ 25
5. Latvia’s Creditless Recovery ___________________________________________________________ 28
6. Cross-Sectional Developments in Credit ______________________________________________ 30
References _______________________________________________________________________________ 34
REPUBLIC OF LATVIA
INTERNATIONAL MONETARY FUND 3
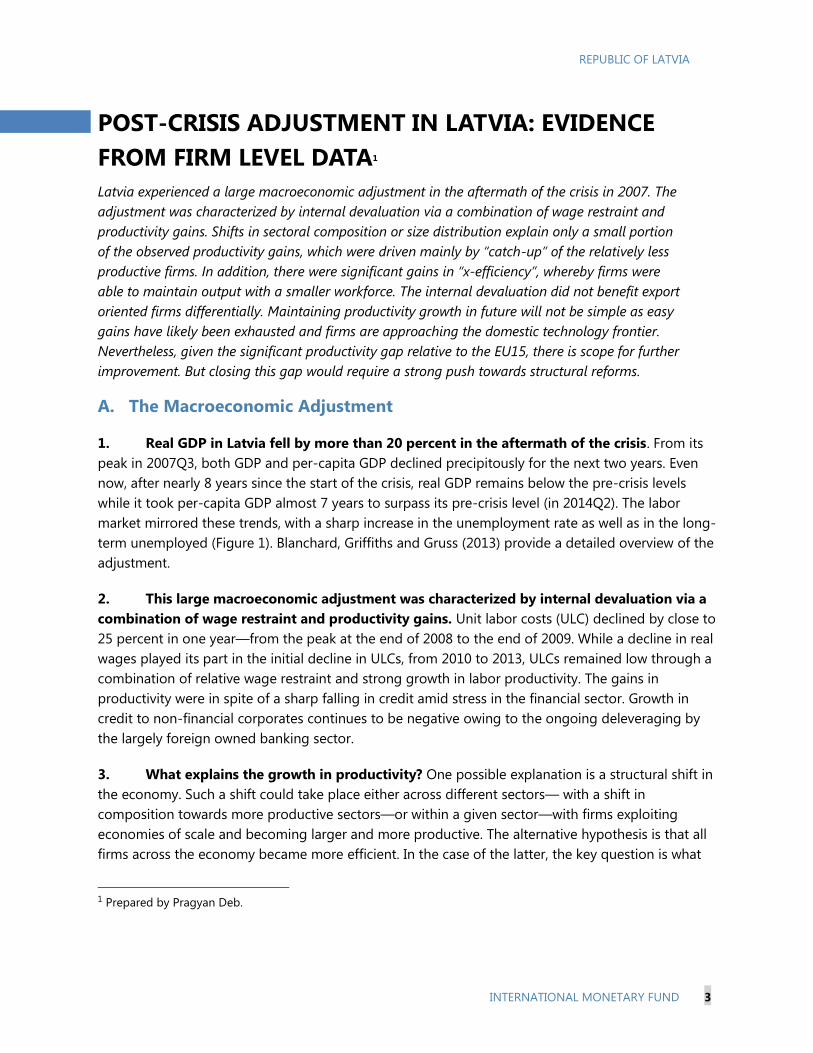
POST-CRISIS ADJUSTMENT IN LATVIA: EVIDENCE
FROM FIRM LEVEL DATA1
Latvia experienced a large macroeconomic adjustment in the aftermath of the crisis in 2007. The
adjustment was characterized by internal devaluation via a combination of wage restraint and
productivity gains. Shifts in sectoral composition or size distribution explain only a small portion
of the observed productivity gains, which were driven mainly by “catch-up” of the relatively less
productive firms. In addition, there were significant gains in “x-efficiency”, whereby firms were
able to maintain output with a smaller workforce. The internal devaluation did not benefit export
oriented firms differentially. Maintaining productivity growth in future will not be simple as easy
gains have likely been exhausted and firms are approaching the domestic technology frontier.
Nevertheless, given the significant productivity gap relative to the EU15, there is scope for further
improvement. But closing this gap would require a strong push towards structural reforms.
A. The Macroeconomic Adjustment
1. Real GDP in Latvia fell by more than 20 percent in the aftermath of the crisis. From its
peak in 2007Q3, both GDP and per-capita GDP declined precipitously for the next two years. Even
now, after nearly 8 years since the start of the crisis, real GDP remains below the pre-crisis levels
while it took per-capita GDP almost 7 years to surpass its pre-crisis level (in 2014Q2). The labor
market mirrored these trends, with a sharp increase in the unemployment rate as well as in the long-
term unemployed (Figure 1). Blanchard, Griffiths and Gruss (2013) provide a detailed overview of the
adjustment.
2. This large macroeconomic adjustment was characterized by internal devaluation via a
combination of wage restraint and productivity gains. Unit labor costs (ULC) declined by close to
25 percent in one year—from the peak at the end of 2008 to the end of 2009. While a decline in real
wages played its part in the initial decline in ULCs, from 2010 to 2013, ULCs remained low through a
combination of relative wage restraint and strong growth in labor productivity. The gains in
productivity were in spite of a sharp falling in credit amid stress in the financial sector. Growth in
credit to non-financial corporates continues to be negative owing to the ongoing deleveraging by
the largely foreign owned banking sector.
3. What explains the growth in productivity? One possible explanation is a structural shift in
the economy. Such a shift could take place either across different sectors— with a shift in
composition towards more productive sectors—or within a given sector—with firms exploiting
economies of scale and becoming larger and more productive. The alternative hypothesis is that all
firms across the economy became more efficient. In the case of the latter, the key question is what
1 Prepared by Pragyan Deb.

REPUBLIC OF LATVIA
4 INTERNATIONAL MONETARY FUND
drove the firm level gains in productivity and which type of firms benefitted the most. In particular,
since the macroeconomic adjustment took place via internal devaluation and hence greater external
competitiveness, did export oriented firms benefit differentially? Or was it a question of x-efficiency
– namely that firms were able to produce the same output with a lower workforce by making better
and more efficient use of resources?
Figure 1. Macroeconomic Adjustment
GDP fell by more than 20 percent and is yet to recover to
its pre-crisis peak…
…while unemployment mirrored the trends in real GDP.
The post-crisis period was characterized by growth in
labor productivity, coupled with wage restraint and hence
a sharp decline in unit labor costs.
Credit fell sharply amid stress in the financial sector and
growth in credit to non-financial corporate continues to be
negative.
B. Sector and Firm Level Data
4. Sector and firm level data is used to explore the factors driving aggregate productivity
trends. Aggregate trends mask divergent productivity developments amongst sectors and may be
driven by a change in the importance of different sectors. For example, all things being equal, an
increase in the share of a more productive sector in the economy is recorded as an improvement in
aggregate productivity, even if individual firms do not witness any improvements in productivity.
While such a shift is desirable in its own right, it has very different policy implications from a
70
75
80
85
90
95
100
105
110
2005 2007 2009 2011 2013 2015
GDP Index
Per-capita GDP Index
GDP and GDP per capita(Real GDP, 2007Q3=100)
Sources: Haver and IMF staff estimates.
0
5
10
15
20
25
2005 2007 2009 2011 2013 2015
Unemployed
Long-term Unemployed
Unemployment Rate(In percent of active population)
Sources: Haver and IMF staff estimates.
-20
-10
0
10
20
30
40
50
60
2005 2007 2009 2011 2013 2015
Credit to Non-financial Corporates(Year on year, percent)
Sources: Haver and IMF staff estimates.
70
75
80
85
90
95
100
105
110
115
120
125
2008 2009 2010 2011 2012 2013 2014 2015
Labor Productivity Real Wages ULC
Productivity and Wages(Index, 2008Q4=100)
Sources: Haver and IMF staff estimates.

REPUBLIC OF LATVIA
INTERNATIONAL MONETARY FUND 5
scenario where aggregate productivity is driven by individual firms becoming more productive. Data
available from Latvia’s Central Statistical Bureau is used to assess such sectoral productivity trends.
The data is aggregated across 6 broad sectors—agriculture and mining, manufacturing,
construction, trade, market services and basic services. Basic services covers public administration,
education and health services and other administrative and support services while market services
include transportation, accommodation, professional, ICT, financial and real estate services.
5. Firm level data provide additional insights into within-sector and firm specific drivers
of productivity. Earlier studies using aggregate data have documented the overall developments in
output, productivity and costs, but by design, these studies do not shed light on the firm level
drivers that underly the aggregate trends. Orbis, a worldwide database of primarily private company
information, provides firm level data for about 70 percent of firms (in terms of persons employed)
over the period 2010-2014 (see Annex I). Coverage varies across sectors, but even after dropping
observations with missing values2 for key variables such as value added, there is sufficient data from
2010 onwards, with over ten-thousand firm-year observations, for an analysis of the post-crisis
period (Table 1). Since Orbis data is in nominal terms, real values are obtained using industry level
value added and investment deflators available from Eurostat. The deflators were de-trended using
Christiano-Fitzgerald time-series filter (at 2 years), but yielded very similar results.
Table 1. Orbis Data Coverage, 2005–14
(Number of Firms)
6. Orbis data is used to estimate total factor productivity (TFP) at the firm level. Real
capital stock is derived from the book value of tangible fixed assets and depreciation using the
perpetual inventory method (see Gilhooly, 2009). Value added based TFP is calculated using two
factor inputs – real capital stock and number of employees. The index number variant of TFP is used
based on labor shares estimated at the two-digit NACE industry level. Other production function
based variants, both using simple ordinary least squares and those based on control functions such
as intermediate inputs (see Wooldridge, 2009) provide broadly similar results.
2 Following Gal (2013) some of the variables are imputed when missing. Specifically, when data on value added is
missing, it is imputed using EBITDA and cost of employees. In addition, total asset is used as a proxy when data on
(tangible) fixed asset is not available.
Industry 2005 2006 2007 2008 2009 2010 2011 2012 2013 2014
Agriculture 54 34 42 37 19 469 598 656 698 705
Manufacturing 44 54 54 39 38 150 173 191 211 220
Construction 23 26 29 18 16 112 123 142 150 158
Trade 42 46 56 37 34 341 418 403 438 443
Market Services 48 63 61 35 37 495 556 610 642 679
Basic Services 5 8 9 7 9 50 61 69 72 86
Total 216 231 251 173 153 1,617 1,929 2,071 2,211 2,291

REPUBLIC OF LATVIA
6 INTERNATIONAL MONETARY FUND
C. Was There a Sectoral Shift?
7. Industry share of value added and employment was largely stable, with some increase
in market services and construction and an offsetting decline in agriculture, trade and basic
services (Figure 2). The share of value added increased the most in construction (by close to
2 percent) followed by market services (around 0.5 percent). In terms of employment, the share of
construction increased by 1.5 percent while market services increased by close to 3 percent. The
share of manufacturing was largely stable at around 13 percent of value added and employment,
declining somewhat in terms of value added, but increasing in the share of employment. The share
of agriculture and mining, trade and basic services declined both in value added and employment,
with the decline more pronounced in terms of employment.
8. Labor Productivity and TFP increased to varying degrees across most industries. In
cumulative terms, construction (25 percent), agriculture (20 percent), basic services (16 percent) and
trade (12 percent) showed the largest increase in labor productivity, while manufacturing and
market services were largely flat, but positive. The picture was a little different for TFP, which takes
into account the use of capital resources. TFP increased the most in manufacturing (20 percent),
followed closely by construction (19 percent), trade (16 percent) and market services (12 percent).
TFP in agriculture and basic services was largely flat.
9. Shifts in sectoral composition had a small effect on the aggregate growth in labor
productivity and TFP. Labor productivity increased by roughly 10 percent in the aggregate
between 2010 and 2014. Using a hypothetical scenario in which the sectoral composition remains
the same as in 2010, the growth in labor productivity is only marginally lower. The contribution of
sectoral composition to the growth in labor productivity is estimated to be a little over 5 percent. A
similar counterfactual exercise for TFP results in a somewhat larger figure of around 16 percent of
the estimated growth.

REPUBLIC OF LATVIA
INTERNATIONAL MONETARY FUND 7
Figure 2. Trends by Industry
Value added shares’ were largely stable across industries
with some increase in construction and market services…
...which were more pronounced in terms of employment.
Labor productivity increased across all industries, but was
largely flat for manufacturing and market services.
TFP showed more variability, with manufacturing and
market services also registering an increase, but
agriculture and basic services flat.
10. There was little change in the share of value added and employment by firm size
(Figure 3). Eurostat’s annual structural business statistics (SBS) provide a breakdown of enterprises
by size class – micro enterprises with less than 10 persons employed; small enterprises with 10–49
persons employed; medium-sized enterprises with 50-249 persons employed; and large enterprises
with 250 or more persons employed. Although a majority of the workforce was employed in micro
and small enterprises, larger firms dominated in terms of value added. There was little change in this
pattern between 2010 and 2014.
11. Labor productivity and TFP increased across all size classes with a few notable
exceptions. Larger firms were more productive as expected. Labor productivity increased across all
firm sizes, but was essentially flat for micro firms. TFP on the other hand increased the most in
micro-firms and declined in the largest enterprises. Given the modest change in the structure of the
0
5
10
15
20
25
30
35
40
2010 2014 2010 2014 2010 2014 2010 2014 2010 2014 2010 2014
Agriculture Manufacturing Construction Trade Market Services Basic Services
Value Added by Industry(Share of total value added)
Sources: Central Statistical Bureau of Latvia; and IMF staff calculations.
0
5
10
15
20
25
30
2010 2014 2010 2014 2010 2014 2010 2014 2010 2014 2010 2014
Agriculture Manufacturing Construction Trade Market Services Basic Services
Employment by Industry(Share of total employment)
Sources: Central Statistical Bureau of Latvia; and IMF staff calculations.
0
5
10
15
20
25
30
2010 2014 2010 2014 2010 2014 2010 2014 2010 2014 2010 2014
Agriculture Manufacturing Construction Trade Market Services Basic Services
Labor Productivity by Industry(Real value added per worker, thousand 2010 euros)
Sources: Central Statistical Bureau of Latvia; and IMF staff calculations.
0
0.5
1
1.5
2
2.5
3
2010 2014 2010 2014 2010 2014 2010 2014 2010 2014 2010 2014
Agriculture Manufacturing Construction Trade Market Services Basic Services
Total Factor Productivity by Industry(Log real total factor productivity)
Sources: Orbis; and IMF staff calculations.

REPUBLIC OF LATVIA
8 INTERNATIONAL MONETARY FUND
economy with respect to size distribution, unsurprisingly the contribution of changes in size
distribution to aggregate labor productivity and TFP trends was negligible.
Figure 3. Trends by Firm Size
Larger firms are responsible for the bulk of value added… …but the majority of the workforce is employed in micro
and small enterprises.
Labor productivity is higher in larger firms and increased
across all size categories…
…TFP is also higher in large firms, but TFP declined during
the post-crisis period in the largest enterprises.
D. What Drove Firm Level Differences?
12. A difference-in-means approach is used to assess the relationship between the
increase in TFP and firm characteristics. Firms can be ranked according to the growth in
productivity between 2010 and 2013 and divided into three buckets. The averages of the top and
bottom buckets are then used to explore the differences in firm characteristics for firms belonging
to different groups, i.e. firms that saw the greatest increase in TFP vis-a-vis firms that saw the least
(see Annex II). The results below are presented in terms of a percentage of the average value (across
all firms) of the firm characteristic. The differences are also examined for statistical significance at the
5 percent level.
15
20
25
30
35
2010 2014 2010 2014 2010 2014 2010 2014
Micro Small Medium Large
Value Added by Size(Share of Total Value Added)
Sources: Eurostat Structural Business Statistics; and IMF staff calculations.
20
25
30
2010 2014 2010 2014 2010 2014 2010 2014
Micro Small Medium Large
Employment by Size(Share of Total Employement)
Sources: Eurostat Structural Business Statistics; and IMF staff calculations.
0
0.5
1
1.5
2
2.5
3
3.5
2010 2014 2010 2014 2010 2014 2010 2014
Micro Small Medium Large
Total Factor Productivity by Size(Log total factor productivity)
Sources: Orbis; and IMF staff calculations.
0
5
10
15
20
25
2010 2014 2010 2014 2010 2014 2010 2014
Micro Small Medium Large
Labor Productivity by Size(Real value added per worker, thousand 2010 euros)
Sources: Eurostat Structural Business Statistics; and IMF staff calculations.

REPUBLIC OF LATVIA
INTERNATIONAL MONETARY FUND 9
13. Less productive firms witnessed a greater increase in productivity during the
adjustment period. The firms that increased
productivity the most between 2010-2013 had
on average 30 percent lower TFP in 2010 relative
to the firms that saw a relatively smaller increase
in productivity. The figure was even larger at
over 60 percent in terms of labor productivity.
The differences were statistically significant. This
implies that there was an element of “catch-up”,
with relatively low productivity firms increasing
their productivity faster and coming closer to the
frontier (the relatively more productive firms).
14. This catch-up hypothesis is also borne out by other performance metrics, with
relatively “weaker” firms improving the most. Once again, firms that increased productivity the
most during the post-crisis period had on
average weaker performance metrics in 2010
and the differences were statistically significant.
The return on equity of such firms was less
than one-twentieth of the firms that showed
the least increase in TFP; the return on assets
was just above one-tenth and the profit margin
was less than a quarter. This implies that once
again it was the weakest firms that showed the
greatest increase in productivity as opposed to
the stronger firms pushing the productivity
frontier. It must however be noted that this analysis is based on firms that survived the crisis and
had data for both 2010 and 2013 – hence there exists an unavoidable survivorship bias in these
results.
15. Firm characteristics played a limited
role. While larger firms, both in terms of value
added and number of employees, improved their
TFP relatively more, the differences were not
statistically significant. However, more capital
intensive (greater share of capital stock to value
added) firms and firms with a lower average cost
of employees improved productivity relatively
more. The average cost of employees can be
considered a proxy for worker skill level, which
suggests that firms employing relatively lower
skilled workers saw greater improvements in TFP.
0
50
100
150
Total factor productivity Labor productivity
Firms that increased productivity the most (2010-2013) Firms that increased productivity the least (2010-2013)
Initial productivity(Percent of average firm productivity in 2010)
Sources: Orbis; and IMF staff calculations. Sources: Orbis; and IMF staff calculations.
Difference statistically significant
0
100
200
300
400
500
Return on equity Return on assets Profit margin
Firms that increased productivity the most (2010-2013) Firms that increased productivity the least (2010-2013)
Performance metrics(Percent of average indicator level in 2010)
Sources: Orbis; and IMF staff calculations. Sources: Orbis; and IMF staff calculations.
Difference statistically significant
0
50
100
150
Size (Value Added) Size (Number of
employees)
Capital intensity Average labor costs
Firms that increased productivity the most (2010-2013) Firms that increased productivity the least (2010-2013)
Firm characteristics(Percent of average indicator level in 2010)
Sources: Orbis; and IMF staff calculations. Sources: Orbis; and IMF staff calculations.
Difference statistically significant

REPUBLIC OF LATVIA
10 INTERNATIONAL MONETARY FUND
16. Financial constraints do not appear to have hampered productivity improvements.
Firms with greater TFP growth during the post-crisis period on average had significantly worse
current ratio, liquidity ratio and solvency ratio on
one hand and greater gearing on the other. Given
that credit conditions were extremely tight, with
overall credit to the corporate sector declining
over the entire period; it is conceivable that firms
were cut off from the credit market irrespective of
their financial ratios. However, it is somewhat
surprising that financially constrained firms were
able to make the necessary investments to
improve TFP, unless there was considerable slack
and sub-optimal use of resources in such firms.
17. Overall, there were significant gains in “x-efficiency”, whereby firms were able to
maintain output with a smaller workforce (Figure 4). This hypothesis can be investigated from
two angles. First, following the same difference-in-mean methodology as before, the group of firms
that increased productivity relatively more increased employment less. This result holds both for the
2010-2013 period as well as a slightly longer period of 2010-2014. In other words, these firms were
able to use their labor resources more efficiently and did not need to increase their workforce.
Conversely, ranking firms by new employment generated; the results show that firms that increased
employment relatively more saw lower gains in TFP compared with firms that did not aggressively
increase the size of their labor force. Thus, firms that improved TFP the most were the ones that
were able to better utilize their available resources and not the ones that were expanding and hiring
more workers.
0
50
100
150
Current ratio Liquidity ratio Solvency ratio Gearing
Firms that increased productivity the most (2010-2013) Firms that increased productivity the least (2010-2013)
Financial ratios(Percent of average indicator level in 2010)
Sources: Orbis; and IMF staff calculations. Sources: Orbis; and IMF staff calculations.
Difference statistically significant

REPUBLIC OF LATVIA
INTERNATIONAL MONETARY FUND 11
Figure 4. Gains in X-Efficiency
E. Did Export Oriented Firms Benefit Differentially?
18. Trade theory posits that adjustment through internal devaluation should benefit
export oriented firms differentially. Internal devaluation in Latvia occurred through a combination
of wage restraint and productivity gains, whereby unit labor costs fell relative to other trade
competitors during the adjustment. This should in principle differentially benefit export oriented
firms and industries, leading to an increase in share of such industries and a reallocation of
resources towards them. Data on share of exports for the manufacturing sector at 2-digit NACE
industry level, available from the Central Statistical Bureau, is used to test this hypothesis.
19. Contrary to expectations, export orientation did not play a major role (Figure 5).
Manufacturing industries are divided into three groups, with increasing levels of export orientation –
the share of foreign to total turnover. Contrary to expectations, the value added share of
manufacturing firms with least exposure to the non-domestic market increased, while those of
medium and high export orientation decreased. While this might partly be on account of lower
prices in the international markets, even for share of employment, the share of the most export
oriented firms decreased marginally, albeit the share of firms with medium export orientation
increased. Labor productivity only increased for low export oriented manufacturing firms and
decreased for firms with medium and high export orientation. TFP however increased for all
categories of manufacturing firms, irrespective of their export orientation. It must however be noted
that due to data constraints, this analysis uses two-digit industry export shares as a proxy for firm
export orientation. Therefore, it does not pick up differences in export orientation within a particular
(two-digit) industrial sector. Furthermore, the measure captures direct exports by manufacturing
firms and does not take into account exports via intermediaries such as wholesale warehouses.
20. Difference-in-means analysis using export orientation also finds no evidence of
differential benefits for export oriented firms (Figure 6). Although firms that increased
productivity the most were relatively more export oriented (both in 2010–2013 as well as 2010–2014
periods), the difference was not statistically significant. Furthermore, there is no evidence of a shift in
0
50
100
150
200
2010-2013 2010-2014
Firms that increased productivity the most Firms that increased productivity the least
Change in employment(Percent of average change in employment for all firms)
Sources: Orbis; and IMF staff calculations. Sources: Orbis; and IMF staff calculations.
Difference statistically significant
0
50
100
150
200
250
2010-2013 2010-2014
Firms that increased employment the most Firms that increased employment the least
Increase in productivity(Percent of average increase in TFP of all firms)
Sources: Orbis; and IMF staff calculations. Sources: Orbis; and IMF staff calculations.
Difference statistically significant

REPUBLIC OF LATVIA
12 INTERNATIONAL MONETARY FUND
labor resources towards relatively more export oriented firms, as the export orientation of firms that
increased employment the most was almost the same as firms that increased employment the least.
Figure 5. Trends by Export Orientation
Value added shares of medium and high export oriented
firms fell…
….although medium export oriented firms increased their
share in total employment.
Labor productivity increased for low export oriented
firms…
…and TFP increased most for those with least export
orientation.
Figure 6. Increase in TFP and Employment by Export Orientation
0
10
20
30
40
50
60
70
80
2010 2014 2010 2014 2010 2014
Low Medium High
Sources: Orbis; and IMF staff calculations.
Value Added by Export Orientation(Share of Total Value Added)
0
5
10
15
20
25
30
35
40
45
2010 2014 2010 2014 2010 2014
Low Medium High
Sources: Orbis; and IMF staff calculations.
Employment by Export Orientation(Share of total employment, percent)
0
20
40
60
80
100
120
2010 2014 2010 2014 2010 2014
Low Medium High
Sources: Orbis; and IMF staff calculations.
Labor Productivity by Export Orientation(Real value added per worker, thousand 2010 euros)
0
0.5
1
1.5
2
2.5
3
2010 2014 2010 2014 2010 2014
Low Medium High
Sources: Orbis; and IMF staff calculations.
Total Factor Productivity by Export Orientation(Log total factor productivity)
50
75
2010-2013 2010-2014
Firms that increased productivity the most Firms that increased productivity the least
Export orientation(Export share in 2010)
Sources: Orbis; and IMF staff calculations. Sources: Orbis; and IMF staff calculations.
Difference statistically significant
0
25
50
75
2010-2013 2010-2014
Firms that increased employment the most Firms that increased employment the least
Export orientation(Export share in 2010)
Sources: Orbis; and IMF staff calculations. Sources: Orbis; and IMF staff calculations.
Difference statistically significant

REPUBLIC OF LATVIA
INTERNATIONAL MONETARY FUND 13
F. Policy Implications
21. Growth in Latvia has been underpinned by strong gains in TFP, but maintaining this
may be challenging. Economic growth since 1995 has averaged 4.1 percent per year. Simple
growth accounting, using data available from the European Commissions’ AMECO database,
suggests that the bulk of this growth was driven by TFP growth of about 4 percent, much higher
than the other Baltics and the CEE average. Even during the post crisis period, TFP grew at an
average of 3.2 percent while growth averaged around 3.6 percent.
22. Productivity gains during the post-crisis period were driven by “catch-up” of the
relatively less productive firms (Figure 7). Real total factor productivity (in logs) increased by
around 10 percent for an average firm between 2010 and 2014, after controlling for sectoral
composition.3 However, this increase was driven by the relatively less productive firms. Dividing the
sample of firms into high and low productivity groups, based on the firms TFP in 2010, the TFP of
firms belonging to the low productivity group increased by over 35 percent, while those belonging
to the high productivity group declined marginally by around 3 percent. The dispersion between the
productivity of the two groups also declined – while in 2010, the average firm belonging to the low
productivity group was only half as productive as the firm belonging to the high productivity group,
the difference was less than one-fourth in 2014. This suggests that the observed growth in
aggregate TFP was driven by the relatively less productive firms that were able to able to “catch-up”
of with their more productive peers and move closer to the domestic technology frontier.
Figure 7. TFP: Contribution and Drivers
3 Firm level log real total factor productivity is regressed on a set of sector dummies to control differences in
productivity across sectors.
-2
-1
0
1
2
3
4
5
6
Den
mark
Belg
ium
Au
stri
a
No
rway
Hu
ng
ary
Fin
lan
d
Cze
ch
Slo
ven
ia
Bu
lgari
a
Ro
man
ia
Po
lan
d
Est
on
ia
Latv
ia
Lit
hu
an
ia
Irela
nd
EU
28
EA
19
Implied TFP growth contribution
Employment growth contribution
Capital growth contribution
Real GDP growth
Sources: European Commission, AMECO data base: and IMF staff calcualtions.Assumes labor share of income of 2/3 for all countries. No adjustment for cyclical position.
Selected Countries: GDP Growth and Factor Contributions(Annually, 1995-2015, percent or percentage points)
1.5
2
2.5
3
2010 2011 2013 2013 2014
Firms in high productivity group
Firms in low productivity group
All firms
Latvia: Total Factor Productivity by Groups(Groups based on total factor productivity in 2010,
log real total facor productivity controlling for sectoral composition)
Sources: Orbis; IMF staff calculations

REPUBLIC OF LATVIA
14 INTERNATIONAL MONETARY FUND
23. Still, Latvia has ample scope to raise productivity by pushing out the technology
frontier. Latvia’s labor productivity is only a third of the EU15 average, with agriculture doing
relatively better while labor in manufacturing
only a forth as productive. But closing this gap
would require a strong push towards structural
reforms by strengthening business
environment and decreasing regulatory
burden, improving state-owned enterprise
(SOE) governance, upgrading the legal system,
improving public infrastructure and attracting
FDI. Sustaining growth in the longer term will
require structural transformation, with an
enhanced emphasis on innovation and R&D
and more efficient use of labor resources by
incentivize human capital accumulation through improved vocational education and training and
lifelong learning.
Strengthening the business environment and enhancing state-owned enterprise (SoE)
governance are important elements of the reform agenda. SoEs are dominant in a variety of
network sectors, such as electricity, postal services, airlines, railways and telecom, potentially
creating barrier to entry and hurting business environment. Given Latvia’s size, many of these
represent natural monopolies, but
initiatives to foster competition by
unbundling services such as generation,
transmission and distribution in the energy
markets are welcome. Furthermore, the
OECD has identified many shortcomings to
the SoE frameworks (OECD, 2015a) with
non-transparent accountability and
shareholder power and a widespread public
perception that SoEs do not operate
effectively and efficiently relative to private
enterprises. Further simplification of license
and permit systems, removal of compulsory chamber membership of professional services and
reduction in the complexity of regulatory procedure can also strengthen business environment
(OECD, 2015b).
0
25
50
75
100
Total Agriculture Construction Manufacturing Services
Latvia Estonia Lithuania
Labor productivity(Relative to EU15, 2014)
Sources: Eurostat; and IMF staff calculatons.
25
50
75
100
Overall PMR Government
involvement in
network
sectors
Barriers in
network
sectors
State
involvement in
business
operation
Complexity of
regulatory
procedures
Administrative
burden on
startups
Barriers to
trade and
investment
LVA EST LUT
Product Market Restrictions(Relative to the frontier)
Sources: OECD; and IMF staff calculations.

REPUBLIC OF LATVIA
INTERNATIONAL MONETARY FUND 15
Improving the effectiveness and efficiency of the insolvency regime can bring significant
gains. Estimates suggest that better property rights and upgrading the legal system has the
potential to improve Latvia’s TFP by close to 20 percent (IMF, 2016). In this context, the recent
steps to strengthen the insolvency regime,
including the increase in the number of courts;
better specialization and allocation of judges;
subjecting insolvency administrators to
greater income disclosure; and stricter
supervision are a step in the right direction.
The length of proceedings and the backlog of
pending cases have fallen, while clearance
rates have risen. Nevertheless, banks continue
to report that insolvency procedures can be
lengthy and insolvency administrators
obstructive. Further progress in implementation is necessary to fully realize potential efficiency
gains, along with continued efforts to refine the framework further, strengthen the mechanism
for out-of-court settlement of disputes and arbitration and a general improvement in public
perception of the system. Efforts to combat the grey economy will also strengthen property
rights.
Better public infrastructure could help attract FDI and associated technological knowhow.
FDI and the presence of multinational firms can boost technology diffusion and increase
productivity through through demonstration
effects, increased competition, worker
mobility, and information sharing about
export markets (Javorcik, 2010). Latvia has
considerable scope to increase FDI, but the
lack of necessary infrastructure in ares such as
roads, railways, ports and energy can
constrain FDI inflows. Rail connectivity, both
cargo and passenger, is limited and the
infrastructure is outdated and incompatible
with European neighbours. While major roads
are well maintained and have improved in
quality due to EU financed investement, the majority of regional and local roads – that
constitute over 90 percent of the road network – are in a poor condition with limited funding for
maintainance. Data from the Ministry of Tansport suggests only a quarter of roads (in terms of
km) can be catergorized to be in good condition. Energy costs, particularly those related to
transmission and distribution are relatively high and links to the wider European gas and energy
markets are still being developed.
0
20
40
60
80
100
120
Cze
ch R
ep
. *
Ru
ssia
Turk
ey *
Ukra
ine
Ro
man
ia *
Lit
hu
an
ia *
Slo
ven
ia *
Po
lan
d *
Latv
ia *
Cro
ati
a
Hu
ng
ary
*
Slo
vakia
*
Bu
lgari
a
Est
on
ia *
Manufacturing
Finance & Real estate
Other services
Others
Stock of FDI(Percent of GDP, 2012 or earlier)
Sources: WIIW; and IMF Staff Calculations.
*Denotes countries without 2012 data; Latvia (2011); Hungary, Lithuania, Slovakia (2010); Czech Republic, Poland, Estonia (2009); Romania
(2008) and Slovenia (2007)
0
20
40
60
LTU
LVA
EST
SV
K
SV
N
PO
L
HU
N
CZ
E
HR
V
BG
R
RO
U
SR
B
ALB
MN
E
MK
D
RU
S
MD
A
UK
R
Turk
ey
Baltics CEE SEE-EU SEE-XEU CIS
Easing business regulation Lowering restrictions on FDI
Property rights Upgrading legal system
Potential Efficiency Gains from Structural Reforms(Potential improvement in TFP, percent)
Sources: Eurostat and IMF staff calculations.

REPUBLIC OF LATVIA
16 INTERNATIONAL MONETARY FUND
Sustained growth in the long term will require structural transformation and innovation.
Latvia’s share of high-technology exports is
small (9.2% in 2014) and R&D intensity
remains well below the EU average. The
commercialization potential of research is
low and there is insufficient cooperation
between research, education and industry
sectors, including a lack of knowledge and
technology transfer and commercialization
capacity in scientific institutions. The New
Industrial Policy and Smart Specialization
Strategy seek to address these deficiencies
but are in the initial stages of
implementation. Authorities have
ambitious goals of doubling R&D spending, from current 0.6 percent of GDP to 1.5 percent by
2020, largely through enhanced private sector spending supported by innovation and R&D
support schemes.
Finally, efficient use of labor resources and matching skill with the needs of the labor
market are critical for such structural transformation. Latvia already experiences significant
skill shortages and without concerted reforms,
this is likely to get worse as the labor force
dwindles, due to a low birth rate and emigration.
The authorities have developed an ambitious
reform agenda to build a more skilled workforce,
with a focus on science, technology, engineering,
and mathematics. Mechanism for the
reallocation of resources to serve the ongoing
and changing needs of the labor market will be
important along with policy initiatives to stem
emigration of skilled workers and encourage
skilled migrants to return to Latvia.
58
.9
56
.7
56
.5
53
.0
52
.1
50
.7
47
.0
44
.4
40
.5
38
.4
35
.6
35
.5
35
.3
35
.3
33
.3
32
.9
32
.8
29
.2
29
.1
28
.1
28
.1
27
.2
25
.7
25
.4
24
.0
22
.8
22
.7
21
.5
21
.3
14
.9
0
10
20
30
40
50
60
70
0
10
20
30
40
50
60
70
Au
stri
a
Fin
lan
d
Den
mark
Po
rtu
gal
Belg
ium UK
Germ
an
y
Sw
ed
en
Slo
ven
ia
Est
on
ia EU
Italy
Sp
ain
Fra
nce
Lu
xem
bo
urg
Irela
nd
Neth
erl
an
ds
Latv
ia
Hu
ng
ary
Lit
hu
an
ia
Cro
ati
a
CEE
Po
lan
d
Malt
a
Cyp
rus
Bu
lgari
a
Gre
ece
Czech
Rep
.
Slo
vakia
Ro
man
ia
Research and innovation
SME competitiveness
Education and training
EU Countries: Pro-growth ESIF Spending, 2014-201/
(Percent of total ESIF spending)
1/ Spending on thematic objectives 1 (research and innovation), 3 (SME competitiveness), and 10 (eductaion and training).
Sources: European Commission (https://cohesiondata.ec.europa.eu/); and IMF staff calculations.
-1.5
-1.0
-0.5
0.0
0.5
1.0
1.5
LTU
LVA
EST
PO
L
SV
K
HU
N
SV
N
CZ
E
BG
R
HR
V
RO
U
Turk
ey
Baltics CEE SEE-EU
Skill Shortage Index, 2000-14(High skill, difference from EU-15)
Oversupply
Shortage
Sources: Eurostat and IMF staff calculations.
REPUBLIC OF LATVIA
INTERNATIONAL MONETARY FUND 17
Annex I. Data Coverage
Sector 2005 2006 2007 2008 2009 2010 2011 2012 2013 2014
Agriculture 2,883 3,455 4,290 4,244 4,389 16,997 6,783 7,341 7,705 7,816
Manufacturing 5,342 6,091 6,918 6,491 6,440 6,753 6,732 7,189 7,895 7,889
Construction 4,403 5,722 7,902 7,234 6,660 6,052 6,248 6,821 7,818 7,913
Trade 17,590 20,394 23,382 21,478 21,300 22,353 20,249 20,856 22,678 22,299
Market Services 18,849 23,202 28,800 27,270 28,635 31,641 30,845 33,673 37,638 38,208
Basic Services 1,620 1,992 2,588 2,571 2,657 2,724 3,339 3,740 4,273 4,471
Total 50,687 60,856 73,880 69,288 70,081 86,520 74,196 79,620 88,007 88,596
Agriculture 54 34 42 37 19 469 598 656 698 705
Manufacturing 44 54 54 39 38 150 173 191 211 220
Construction 23 26 29 18 16 112 123 142 150 158
Trade 42 46 56 37 34 341 418 403 438 443
Market Services 48 63 61 35 37 495 556 610 642 679
Basic Services 5 8 9 7 9 50 61 69 72 86
Total 216 231 251 173 153 1,617 1,929 2,071 2,211 2,291
Agriculture 52 32 40 36 19 443 562 606 625 636
Manufacturing 42 52 52 37 35 126 143 164 188 193
Construction 21 25 28 17 11 88 102 128 135 139
Trade 42 45 52 32 25 263 330 328 353 358
Market Services 45 59 60 30 31 412 463 526 560 601
Basic Services 5 7 8 7 9 45 52 62 65 74
Total 207 220 240 159 130 1,377 1,652 1,814 1,926 2,001
Firms with data on Total Factor Productivity
Firms with data on Number of Employees
Firms with data on Value Added and Labor Productivity

REPUBLIC OF LATVIA
18 INTERNATIONAL MONETARY FUND
Annex II. Difference in Means Result
Firm Characteristic
(as percent of average)Top third Bottom third Difference t-stat
Total factor productivity 0.87 1.20 -0.33 -4.51
Labor productivity 0.45 1.22 -0.77 -6.47
Return on assets -0.62 2.42 -3.04 -11.68
Return on equity 0.08 1.66 -1.58 -5.44
Profit rargin -0.30 2.02 -2.32 -11.44
Size (Value Added) 0.72 0.51 0.21 0.58
Size (Number of employees) 0.69 0.52 0.17 0.75
Capital intensity 1.09 0.89 0.20 5.72
Average labor costs 0.74 0.95 -0.21 -1.87
Long term debt to total assets 2.95 0.01 2.94 1.01
Current ratio 0.78 1.17 -0.39 -2.12
Liquidity ratio 0.69 1.15 -0.46 -2.52
Solvency ratio 0.70 1.18 -0.48 -5.81
Gearing 1.14 0.86 0.28 1.82
Change in employment 0.33 1.52 -1.19 -2.50
Share of exports 1.07 1.03 0.05 0.52
Change in productivity, 2010-2013 -0.05 1.39 -1.44 -2.06
Total factor productivity 0.87 1.13 -0.26 -3.38
Labor productivity 0.52 1.50 -0.97 -5.76
Return on assets -0.35 2.16 -2.51 -10.20
Return on equity -0.02 1.64 -1.66 -5.34
Profit rargin -0.15 1.96 -2.11 -10.80
Size (Value Added) 0.70 0.55 0.16 0.73
Size (Number of employees) 0.98 0.51 0.47 1.72
Capital intensity 1.09 0.92 0.17 5.06
Average labor costs 0.87 1.05 -0.18 -1.53
Long term debt to total assets 2.78 0.22 2.56 0.93
Current ratio 0.82 1.23 -0.41 -2.10
Liquidity ratio 0.68 1.49 -0.81 -3.37
Solvency ratio 0.78 1.16 -0.38 -4.69
Gearing 1.12 0.92 0.20 1.16
Change in employment 0.53 1.41 -0.89 -2.12
Share of exports 1.04 0.98 0.06 0.65
Change in productivity, 2010-2014 -0.32 1.46 -1.78 -1.44
Change in Total Factor Productivity, 2010-2014
Change in Employment, 2010-2014
Change in Total Factor Productivity, 2010-2013
Change in Employment, 2010-2013

REPUBLIC OF LATVIA
INTERNATIONAL MONETARY FUND 19
References
Blanchard, Olivier, Griffiths, Mark, Gruss, Bertrand (2013) – Boom, Bust, Recovery: Forensics of the
Latvia Crisis. Brookings Papers on Economic Activity, Economic Studies Program, The Brookings
Institution, vol. 47, issue 2 (Fall), pp. 325–388
Gal, Peter N. (2013), “Measuring Total Factor Productivity at the Firm Level using OECD-ORBIS.”, No.
1049 OECD Publishing.
Gilhooly, Bob, (2009), Firm-level estimates of capital stock and productivity. Economic and Labour
Market Review, 3(5), 36–41.
IMF (2016), CESEE Convergence: How to Get Back on the Fast Track, European Regional Economic
Issues Report, April 2015
Javorcik, B., 2010, “Foreign Direct Investment and International Technology Transfer,” Encyclopedia
of Financial Globalization.
OECD (2015a), “Review of Latvia’s position relative to the OECD guidelines on corporate governance
of state-owned enterprises,” OECD Publishing.
OECD (2015b), “Policy areas for increasing productivity in Latvia economics,” OECD Economics
Department Working Papers, No 1255.
Wooldridge, Jeffrey M. (2009) "On estimating firm-level production functions using proxy variables
to control for unobservables." Economics Letters 104.3: 112–114.

REPUBLIC OF LATVIA
20 INTERNATIONAL MONETARY FUND
ELUSIVE CREDIT GROWTH IN LATVIA: CAUSES AND
REMEDIES1
Latvia’s creditless recovery has taken unusually long to turn compared to international
experience. Although lack of credit has not undermined recovery so far, support from the financial
sector will be crucial for its continuation going forward. This is particularly the case given the
model for growth, which is based on investment-driven improvements in productivity. While
demand factors explain subdued lending activity to larger, cash rich firms, supply factors are
likely more important for SMEs and households. The crisis continues to cast a shadow, with banks
cautious given past losses and bad experiences trying to recover collateral. Further, for smaller
firms and households lack of collateral or documentable income is a major obstacle for access to
credit. Firm implementation of the recent reforms to the courts and to insolvency procedures is
vital. Although lessons learned from the crisis should guide bank business models and supervisory
practices, it is important that excessive risk-aversion does not become embedded either. Further,
in a foreign-dominated banking sector, the business cycle of the home country should not
become an impediment to lending in the host country.
1. While the pre-crisis boom was supported by excessive bank credit, the recovery has
evolved despite its absence. In contrast to the period leading up to the crisis, the contribution of
the financial sector to economic growth remains weak. The credit-fueled domestic demand boom
prior to the crisis in Latvia ended in a severe recession, and a collapse in credit and domestic
demand. Although the economy has seen a strong turnaround, and a long period of financial sector
repair, resulting in a well-capitalized banking sector with access to liquidity, credit continues to
decline 5 years after economic growth has turned positive.
2. The absence of financial sector support to the economy raises concerns about its
sustainability. The recovery so far has been driven mainly by consumption rather than investment.
While companies have been able to self-finance investment in recent years, rising wage pressures
could start to limit this channel in future. Given this, growth in bank credit will be needed to fund
the investment necessary to support growth in the short run, and also to lay the ground for future
growth, including through productivity enhancing investments.
3. The aim of this paper is to examine possible factors contributing to lackluster credit
developments in Latvia. The Baltic Cluster Report (2014) examined possible causes for the
creditless recovery observed in the Baltic countries.2 Since then, credit flows have resumed in Estonia
and Lithuania, albeit meagerly, whereas credit continues to shrink in Latvia. We revisit the factors
analyzed in that report and how their contribution have evolved, focusing on the case of Latvia.
1 Prepared by Maral Shamloo
2 See Baltic Cluster Report, 2014, IMF Country Report No. ISCR/14/116.

REPUBLIC OF LATVIA
INTERNATIONAL MONETARY FUND 21
We consider the position of Latvia in its credit cycle and the role of its financial sector landscape in
the post-crisis financial conditions outturn.
A. Background
4. The financial sector in Latvia is dominated by commercial banks, with strong cross
border linkages to Nordic countries. Commercial banks’ assets accounted for almost 130 percent
of GDP at end-2015. Alternative sources of funding for corporates, such as access to debt and equity
capital markets are limited. Total stock market capitalization is close to 4 percent of GDP. The bond
market is dominated by government securities and corporate bond market remains small:
outstanding non-financial corporate debt is less than 1 percent of GDP, compared to government
securities which are close to 5 percent of GDP. Institutional investors are also scant. Thus, bank
lending is the main channel for access to credit for the majority of firms and households.
5. Latvia has a bifurcated banking sector, with the two segments following different
business models. The foreign bank presence in Latvia is strong. Out of the 27 commercial banks,
around half are foreign: 3 are subsidiaries from the Nordic region, and 10 are branches of foreign
banks. Foreign banks mainly deal with domestic clients and own the lion’s share of domestic lending
(around 81 percent). Domestic banks, on the other hand, rely mostly on non-resident deposits
(NRDs) and their assets are composed of highly liquid foreign assets (Figure 1).
6. The structure of the banking system gives rise to two sources of financial stability
concerns:
Deposit outflows from the NRD sector. NRD banks do not have a significant share of
domestic loan portfolio (around 13 percent as of February 2016) and enjoy higher liquidity ratios
than is typically associated with balance sheets characterized by retail and corporate loans (close
to 60 percent liquid assets). Nevertheless, deposit outflows remain a risk as NRDs are covered by
the state deposit guarantee scheme and thus represent a contingent fiscal liability. For instance,
they suffered a 30 percent outflow during 2008. Furthermore, since the financial crisis even the
most liquid advanced economy bond markets have seen episodes of liquidity flight, for instance
the taper tantrum (May 2013) or the bund tantrum (May 2015) and thus liquidity risk remains
even in the presence of more liquid securities on the asset side of the balance sheet. As a result
of these liquidity risks, and in line with staff recommendation, NRD banks face larger capital (up
to an additional 9.5 percent) and liquidity hurdles (up to 60 percent). Currently, non-resident
deposits form more than half of the deposit base in Latvia (Figure 1).
AML concerns. The authorities have stepped-up their efforts to address money laundering.
Specifically, they have widened their definition of Politically Exposed Persons (PEP) to address
recommendations made by the OECD’s Working Group on Bribery, and the Financial and Capital
Markets Commission (FCMC), in charge of bank supervision, has adopted a risk-based
supervision strategy. The FCMC has also employed external resources for in-depth audits of
banks’ procedures in order to impose minimum standards on risk monitoring systems of the

REPUBLIC OF LATVIA
22 INTERNATIONAL MONETARY FUND
0
10
20
30
40
50
60
70
80
90
100
Deposits Resident Loans
Market share of NRD and Foreign banks in Deposits and Loans in Latvia,
2015
NRD banks Nordic banks
30
35
40
45
50
55
60
2008
Q1
2008
Q4
2009
Q3
2010
Q2
2011
Q1
2011
Q4
2012
Q3
2013
Q2
2014
Q1
2014
Q4
2015
Q3
NRD to Total Deposits Share
banks. Staff encouraged the authorities to continue their efforts and to ensure that sufficient
resources are allocated to AML supervision.
7. The financial sector repair process, following the damage inflicted by the crisis, is now
largely complete. Latvia experienced an extraordinary credit boom in the period leading up to the
global financial crisis. At its height in 2006 Q3, credit growth reached almost 70 percent, and was
reflected in increasing household and corporate debt. The recession and the collapse in demand
that ensued saddled the banks with NPLs, peaking at 20 percent. The authorities undertook
restructuring of domestic banks, amended the legal framework for insolvency and made efforts to
strengthen market-based debt resolution. Banks undertook significant write-offs of bad loans; as a
result NPLs have decreased to 6 percent as of end 2015 (Figure 2).
Figure 1. The Two Segments of the Banking Sector
NRD banks preside over the majority of deposits, but a
small fraction of the loan portfolio…
… and face higher capital and liquidity requirements
NRDs have returned strongly since the crisis, though
some reversal is observed recently.
Nevertheless, on a nominal basis, they now form the
majority of deposits in the banking sector.
0
10
20
30
40
50
60
70
80
90
Foreign Domestic
Capital adequacy ratio Liquidity ratio
Liquidity and Capital
(In percent)
3
4
5
6
7
8
9
10
11
12
13
2008 2009 2010 2011 2012 2013 2014 2015
Original
Adjust for exchange rate
NRD Levels
(Billion of Euro)
Sources: FKTK; Haver; IMF staff calculations.

REPUBLIC OF LATVIA
INTERNATIONAL MONETARY FUND 23
Figure 2. The Financial Sector Repair Process is Coming to Completion
NPLs have fallen and the coverage ratio has soared Households and NFCs have delivered significantly since the
crisis…
… and their debt repayment capacity has improved. Nevertheless, the credit gap remains significantly negative.
Sources: Bank of Latvia, Eurostat, Haver Analytics, and IMF staff calculations.
8. Consistent with this narrative, indicators place Latvia at the late stages of its credit
cycle. Based on the methodology used in the October 2015 GFSR, Latvia is placed ahead of the Euro
Area as a whole in the credit cycle, but behind Japan and the United States. The long period of
balance sheet deleveraging and repair following the expansion years prior to the crisis would place
Latvia towards the end of the repair stage in the credit cycle. A measure of the credit gap, calculated
as percentage deviation of credit to GDP from its long-run trend, shows signs of bottoming out,
albeit at very depressed levels. NPLs, both for households and corporates have come down
significantly since 2011, and provisions to NPLs have soared. Furthermore, households and non-
0
10
20
30
40
50
60
0
10
20
30
40
50
60
Mar-
08
Aug
-08
Jan-0
9
Jun-0
9
No
v-09
Ap
r-10
Sep
-10
Feb
-11
Jul-
11
Dec-
11
May-
12
Oct
-12
Mar-
13
Aug
-13
Jan-1
4
Jun-1
4
No
v-14
Ap
r-15
Sep
-15
Loans to households (%GDP)
Loans to companies (%GDP)
Houshold and NFC deleveraging continues...
(Debt to GDP)
0
10
20
30
40
50
60
70
80
90
100
0
5
10
15
20
25
30
Mar-
08
Sep
-08
Mar-
09
Sep
-09
Mar-
10
Sep
-10
Mar-
11
Sep
-11
Mar-
12
Sep
-12
Mar-
13
Sep
-13
Mar-
14
Sep
-14
Mar-
15
Sep
-15
NPL of households
NPL of non-financial corporations
Provisions to NPLS (RHS)
NPLs and Provisions
(In percent)
0
20
40
60
80
100
0
100
200
300
400
500
600
700
2004 2006 2008 2010 2012 2014
Debt-to-income ratio of NFC
Debt-to-income ratio of HH (RHS)
Debt Repayment Capacity
(In percent)
-40
-30
-20
-10
0
10
20
30
40
50
60
70
2009Q1 2010Q1 2011Q1 2012Q1 2013Q1 2014Q1 2015Q1
Credit Gap
(Percent deviation of credit from its long-run trend)

REPUBLIC OF LATVIA
24 INTERNATIONAL MONETARY FUND
financial corporates are deleveraging and debt servicing capacity has increased significantly since
the crisis (Figure 3).
Figure 3. Latvia Through the Credit Cycle
Indicators place Latvia at the late stages of its credit cycle.
9. Furthermore, an index summarizing the financial conditions for Latvia suggests a slow
return to neutral conditions (Figure 4). Using a number of indicators of financial conditions (NPLs,
credit growth, profitability, house prices and funding ratios) we construct an index of financial
conditions.3 The FCI offers a useful tool for continuous surveillance of financial conditions, as it
summarizes information from several variables simultaneously. By construction, the FCI has a mean
of zero and variance of 1 over the sample (2007- 2015), and thus should be interpreted as changes
relative to the mean during this period. Higher values indicate looser financial conditions and lower
values indicator tighter conditions. Consistent with the narrative of credit cycle discussed above, the
FCI shows that financial conditions were at their easiest in 2007 but deteriorated rapidly and have
been very slow to return to neutral. FCIs are typically leading indicators of business cycle, whereas
credit growth is a lagging one. Therefore, the long period of FCI returning to normal is consistent
with the slow recovery in credit. Nevertheless, the FCI masks differences in the evolution of
underlying indicators. Whereas NPLs and bank profitability measures have improved dramatically,
credit growth is still far behind neutral levels.
10. Despite significant balance sheet progress, bank lending standards remain tight. While
banks systematically expect loosening of standards, in reality, the bank lending survey suggests that
3 Specifically, we take the first principal component of the variance-covariance matrix of the underlying indicators as
our FCI. Principal component analysis allows the primary drivers of a large dataset to be summarized in one index,
while abstracting from idiosyncratic movements. The FCI for Latvia explains over 75 percent of the covariance of the
data.
I. Expansion: 2003-06•Property prices increase
•Credit growth strong •NPLs low
II. Peak: 2007•Leverage peaks
•Property prices peak•LDR peaks
•Bank profitabitlity peaks
Latvia through the Credit Cycle
2016
2008
IV. Repair• Provisions to NPLs increases
•Leverage falls •Credit shrinkage stabilised
III. Downturn•Bank profitability declines
•Credit collapse•NPLs increase
2012

REPUBLIC OF LATVIA
INTERNATIONAL MONETARY FUND 25
0
1
2
3
4
5
6
2006 2007 2008 2009 2010 2011 2012 2013 2014 2015
Short-term loans
Long-term loans
Short-term loans, expected
Long-term loans, expected
Cumulative Changes in Lending Standards to NFC
(Positive values indicate a tightening)
lending standards have not eased since 2014 (Figure 4). 4 This is despite improvements in the
balance sheets of the banks, as well as general macroeconomic recovery. Banks cite lack of
collateral, short credit history and lack of documentable income (for mortgages) and risk
perceptions associated with firm or industry level outlook (for corporates) as the main reason
contributing to tight lending standards. Furthermore, in light of the crisis experience, banks have re-
evaluated their expectations of recovery of collateral, which has contributed to a part of the
tightening in standards that will take time to reverse.
Figure 4. Financial Condition
The FCI shows a gradual return to period averages… …yet, no loosening of standards has been observed since the crisis.
Sources: Bank of Latvia and IMF staff calculations.
B. Why Has Credit Been Restrained?
Latvia’s creditless recovery is not surprising, yet its duration is unusual. Creditless recoveries, where
credit growth remains elusive for an extended period of time, are widely understood to be common
after banking crises as they are associated with disruptions in credit supply (see for instance Abiad,
Dell Ariccia, and Bin, 2011, or Bijsterbosch and Dahlhaus, 2011). Such episodes are often preceded
by large output losses, banking crises, and high private sector indebtedness, all making Latvia a
likely candidate to experience a creditless recovery. Yet, credit contraction in Latvia has persisted for
an unusually long time. For instance, Bijsterbosch and Dahlhaus (2011) study 211 recoveries, out of
which only 12 experienced 3 consecutive years of negative credit growth. In Latvia, real credit has
shrunk for over 5 consecutive years, despite positive GDP growth over the same period. In
comparison, real credit contraction in Estonia and Lithuania ceased after 3 and 4 years, respectively
(Figure 5).
4 Latvijas Banka conducts the bank lending survey in cooperation with the European Central Bank (ECB), on a
quarterly basis. Prior to 2014, the BLS was conducted on a semi-annual basis.
-4
-3
-2
-1
0
1
2
3
4
5
6
7
2007Q
1
2007Q
3
2008Q
1
2008Q
3
2009Q
1
2009Q
3
2010Q
1
2010Q
3
2011Q
1
2011Q
3
2012Q
1
2012Q
3
2013Q
1
2013Q
3
2014Q
1
2014Q
3
2015Q
1
2015Q
3
Financial Condition Index

REPUBLIC OF LATVIA
26 INTERNATIONAL MONETARY FUND
Supply Side Factors
11. A credit crunch, or a reduction in the general availability of credit, can appear for
several reasons. Supply constraints leading to tighter conditions for obtaining credit could include
(i) shortages in capital or liquidity (or an increase in requirements), reducing lending capacity when
raising capital or liquidity is costly; (ii) an increase in risk aversion; (iii) absence of good collateral; iv)
uncertainty about borrowers’ creditworthiness, resulting in an increase in asymmetric information
between the borrower and the lender; and v) encumbered balance sheets, leading to bankers being
pre-occupied with working out bad loans as opposed to extending new ones.
12. Capital and liquidity do not seem to be binding constraints to lending in Latvia. As of
end-2015, banking system capital adequacy ratio was at 22.7 percent (CET1 of 19.7 percent) and
banking sector liquidity ratio stood above 65 percent. For those banks focused on residents, which
undertake most of the lending to the real economy, the CET1 stood even at a higher level of
26 percent (also see chart). Although capital does not seem to be a binding constraint, the more
prudent post-crisis regulatory regime, appropriately, has raised the cost of extending loans. Capital
requirements have risen significantly compared to the pre-crisis era, making the marginal cost of a
loan much higher to a bank. This is particularly the case in Sweden, home to two of the largest
subsidiaries in Latvia, where total capital requirements for the groups range between 19–25 percent
of RWA. This fact does not explain, however, why loan growth in Latvia has been slow compared to
peers in the Baltics where the same banks also operate.
13. Yet, the legacy of the crisis has meant that supply conditions remain tight. The high
level of losses realized during the crisis has increased banks’ risk aversion in two ways:
First, there was a general change in attitudes towards risks and a re-evaluation of the
credit-worthiness of certain classes of clients. Nordic banks suffered very large losses during
the crisis. Since then, their balance sheets have shrunk continuously and, in the case of the two
largest banks, they have withdrawn from all but very top-tier clients. In the same way that lax
attitudes towards risk prior to the crisis were extreme, this withdrawal could be an over-reaction,
a fact that is more difficult to reverse through policy action. Related, problems with collateral
recovery in default cases during the crisis, mean that lenders are now much more cautious about
new clients.
Second, the calibration of risk models mechanically implies tighter conditions for Latvia.
Given the limited data history used to calibrate the internal risk-based (IRB) models, the crisis
legacy in Latvia implies high projected probability of losses and loss given default. To the extent
that the same models are calibrated based on local data, the Latvian portfolios appear riskier
compared to the parent counterpart. As a result for some banks, centralized risk management
techniques have implied tighter lending standards in Latvia compared to home countries.
14. Structural factors further contribute to the tightness of credit standards. The significant
size of the gray economy means that a large number of firms (and individuals) may be effectively
excluded from seeking bank credit, as their “official” income is inadequate. As noted above, banks

REPUBLIC OF LATVIA
INTERNATIONAL MONETARY FUND 27
see the slow process of reclaiming their collateral as an impediment to lending to riskier borrowers.
Despite commendable progress in the insolvency framework reform, implementation lags. In
addition, administrators and judges could be better trained on specific issues related to insolvency.
15. The specific banking sector structure in Latvia may have also contributed to the
significant deleveraging and anemic credit growth that ensued. Lending by foreign banks, in
theory, should be more resilient to host country shocks, since the capital and liquidity position of
the parent is likely more correlated with the home country business cycle. In practice, however,
countries with more international banking linkages tend to see a larger contraction in lending, as
foreign banks could deleverage disproportionately from non-strategic stressed regions or markets
(April 2015 GFSR, Chapter 2). This result could be significant for Latvia as it only constitutes
2 percent of the Swedish banks’ assets (Figure 5).
16. Swedish banks’ lending is more
sensitive to GDP growth in the Baltics
compared to Sweden. We used bank
level data from Bankscope to compare
lending at the parent and the subsidiary
level for the two largest foreign banks
present in Latvia (Swedbank and SEB).
The data shows that loan growth is much
more sensitive to GDP growth in the
Baltics than it is in Sweden (Figure 5). As
a result, the reduction in net loans since
2008 has been significantly faster in the
Baltic subs compared to the parent. This
highly cyclical behavior of foreign banks
could reinforce the business cycle and the volatility of output and credit growth. The behavior is
similar for the subsidiaries of the two banks in Estonia and Lithuania. Furthermore, this behavior is
independent of the level of capitalization. In fact, subsidiaries, on average, enjoy higher levels of
capital compared to the overall group. These results are consistent with the findings of the GFSR
chapter, referred to above.
17. Domestic banks have not picked up the slack left by the foreign banks. Except for one
small domestic bank (less than 7 percent of total loans) who is gaining market share, domestic banks
are mostly concentrated on non-resident lending, which is growing more strongly than domestic
lending (Figure 6). The NRD sector’s lending to the domestic economy remains limited (13 percent
of total lending) and typically to special big-ticket projects such as luxury real estate. The specific
banking structure in Latvia implies that a large part of the economy, such as first time borrowers or
SMEs have limited access to credit. It also creates constraints on policy levers that can be used to
encourage credit growth.
18. Shared supervisory responsibility may also be contributing to the problem (Box 1). The
supervisory responsibility of Swedbank and SEB is shared between the home supervisor at the group
0
5
10
15
20
25
30
35
40
45
Sweden SEB Latvia Swedbank Latvia
CET1/RWA, as of 2015 Q4

REPUBLIC OF LATVIA
28 INTERNATIONAL MONETARY FUND
-14
-12
-10
-8
-6
-4
-2
0
2
Parent Latvia Lithuania Estonia
Average growth in Net Loans by Subsidiary
(2008-2015)
Swedbank SEB
-80
-60
-40
-20
0
20
40
60
80
100
120
-20 -15 -10 -5 0 5 10 15
Swedbank Lending Growth vs. GDP Growth
Sweden Latvia
Estonia Lithuania
level (Swedish FSA in the case of Swedish banks operating in Latvia) as well as the host supervisor
(FCMC) and SSM. Given the small size of the subs relative to the parent, this arrangement could
imply that for the two largest banks in Latvia the priorities of the group—and the home supervisor—
may override local considerations. This could particularly be the case at times when home and host
countries are at different points in their credit and business cycles. Currently, the Swedish FSA has
activated some of its macro-prudential levers, which is appropriate as credit growth remains strong
in Sweden, but less so for some of the host countries that the Swedish banks operate in. Although
some of these tools, such as the Counter Cyclical Buffer only apply to Swedish exposures, the overall
risk-off attitude could percolate through the group business model.
Figure 5. Latvia’s Creditless Recovery
Swedish banks have delevered more strongly in Latvia
compared to home or the rest of the Baltic…
…As a result, Latvia’s credit crunch has been deeper and
longer.
Lending of the subsidiaries is more sensitive to GDP growth, suggesting procyclical behavior by the banks.
40
50
60
70
80
90
100
110
2010 2011 2012 2013 2014 2015
Latvia Lithuania Estonia
Private Sector Credit to GDP
(SA, 2010=100)
Sources: Bank of Latvia, Central Bank of the Republic of Lithuania,
Bank of Estonia, and IMF staff calculations.
-60
-40
-20
0
20
40
60
80
100
-20 -15 -10 -5 0 5 10 15
Sweden Latvia
Estonia Lithuania
SEB Lending Growth vs. GDP Growth

REPUBLIC OF LATVIA
INTERNATIONAL MONETARY FUND 29
Demand side Factors
19. Monetary policy and general macroeconomic conditions are unlikely to be a drag on
demand for credit. Demand-side explanations for lack of credit include an increase in aggregate
uncertainty and a reduction in aggregate demand, (expectations of) tighter monetary conditions or
a reduction in asset prices and net wealth. These factors may have played a role in the rapid
deleveraging observed earlier in the recovery. But given the current monetary policy stance,
improving property prices, and strengthening balance sheets of households and companies, their
contribution has likely diminished over time.
20. Nevertheless, the crisis legacy and ongoing uncertainties have probably affected
attitudes towards borrowing. The large number of insolvencies during the crisis could have
affected private attitudes towards taking on debt. Anecdotal evidence suggests that the actual
duration of mortgage portfolios is significantly shorter than their time-to-maturity at origination, as
borrowers amortize much faster than they have to.5 As a point of comparison, Estonia and Lithuania
who did not see an increase in their NPLs to the same extent as Latvia, have seen credit returning
earlier (Figure 5). Also, ongoing uncertainties regarding economic prospects in key trading partners,
as well as geo-political risks, and delays in the arrival of EU structural funds may all act as a drag on
demand for new credit.
21. While net credit growth may still be negative, reallocation across sectors may be a
source of growth. Gross credit flows may go undetected when looking at net flows (see Claessens,
et al., 2008). As the economy shifts from a housing-fueled boom towards a more balanced growth
model, we would expect credit reallocation towards the more productive sectors. This reallocation
will be accompanied by growth given the differences in productivity between the different sectors.
Indeed this process has to a certain extent taken place in Latvia. The 26 percent reduction in overall
outstanding credit since end-2010 masks sectoral differences in credit allocation. Construction and
real estate sector has experienced a particularly strong deleveraging, and credit to these two sectors
constituted 36 percent of domestic corporate credit at end-2015, compared to 44 percent at end-
2010. In fact, excluding real estate sector and construction, year-on-year credit growth turned
positive in the final quarter of 2015 (Figure 6).
5 Although this fact may also signify that borrowers have cash flows beyond what they can document and present to
the bank at the time of loan origination.

REPUBLIC OF LATVIA
30 INTERNATIONAL MONETARY FUND
-12.0
-10.0
-8.0
-6.0
-4.0
-2.0
0.0
2.0
2011Q1 2011Q3 2012Q1 2012Q3 2013Q1 2013Q3 2014Q1 2014Q3 2015
Private sector credit growth, excluding real estate
Private sector credit growth
Sectoral Credit Growth
(In percent)
-25
-15
-5
5
15
25
2011Q1 2011Q3 2012Q1 2012Q3 2013Q1 2013Q3 2014Q1 2014Q3 2015
Resident Loans
Non-resident Loans
Resident vs. Non-resident Loan Growth
(In percent)
Figure 6. Cross-Sectional Developments in Credit
While loans to the domestic economy continue to shrink,
loans to non-residents have grown strongly,
Sectoral reallocation of credit may over-state the depth
of deleveraging outside the-real estate sector.
C. Lessons and Policy Implications
22. Emphasis on resuscitating credit growth is key to maintaining recovery. Creditless
recoveries tend to be weak and short-lived (see Kannan (2010), Abiad et al. (2008) and Claessens et
al. (2008)). Furthermore, investment makes a disproportionately lower contribution to growth in
such episodes compared to “normal” recoveries and productivity is adversely affected. This is
consistent with Latvia’s experience of low investment growth and an output growth driven by
consumption so far. Going forward, credit will be essential for investment growth needed to push
the productivity frontier and maintain competitiveness. As productivity gains achieved by shedding
labor run their course, any further gains in productivity will require investment in capital. In addition,
going forward, strong wage growth could limit the firms’ ability to finance investment through
retained profits. Absorption of the EU funds, a pillar for the investment growth projections of the
next few years, requires private co-financing, again underpinning the role of their access to credit.
Therefore, the financial sector will have to play its part in providing the credit needed to support
future investment.
23. Focus should be on facilitating access to credit for SMEs and first time borrowers,
where market failures are the largest. The SME sector is particularly credit constrained and
therefore, government programs such as loan guarantee schemes and subordinated loans designed
by the Single Development Institute (SDI) are particularly welcome and have so far been well
received. Historical experience shows that credit guarantee schemes can only be effective when
there are competent, financially sound banks, with adequate staff to effectively screen and monitor
SME loans. It is important that credit guarantees do not become a vehicle for misallocation of funds
to SMEs with little future, or to those that do not need it. The more effective schemes are (i) targeted
to those sectors that are most several financially constrained and (ii) operated on a commercial
basis, typically through an on-lending program via commercial banks. In this regard, the authorities’

REPUBLIC OF LATVIA
INTERNATIONAL MONETARY FUND 31
focus on areas where market failure is identified is welcome. Nevertheless, these programs do not
alleviate the problem for those firms or individuals that are part of the grey economy and hence
choose to under-report their income and are therefore excluded from access to credit.
24. Lending by Nordic subsidiaries could be better-attuned to Latvian conditions. There is
some evidence that centralized risk management by parent banks could be contributing to overly-
constrained lending in Latvia. Given Latvia’s recent crisis experience, and hence the higher
probabilities of default, and rates of loss given default, it may be that banks’ internal risk models
place too much weight on the recent historical episode, relative to current conditions. Indeed, after a
sharp tightening since the onset of the crisis, bank lending standards have not changed
substantially.6 Also, subsidiary level data suggests that Nordic banks’ lending is more volatile during
the business cycle in Latvia (and the rest of the Baltics) compared to the home country. Based on
this, staff urged the prudential authorities to review the results of a benchmarking exercise of banks’
risk models, conducted in cooperation with other competent authorities, to ensure they
appropriately capture risk, and that the crisis legacy and associated risk aversion does not unduly
constrain lending.
25. Further progress on institutional factors affecting credit is required. Ensuring uniformity
in quality of insolvency administration and improvements in the implementation of insolvency
reforms undertaken so far is vital for restoring the trust of the banking sector. The establishment of
a credit bureau this year is an important step forward for facilitating access to credit history, which
will particularly benefit first-time borrowers. The authorities should ensure that these bureaus can
become a “one-stop shop” where creditors will be able to access financial information about
potential borrowers. This will require granting the bureaus access to both positive and negative
data, such as the land register as well as information on court proceedings.
26. Experience of other jurisdictions in adopting policies to reignite credit could prove
helpful. Box 2 summarizes some of the policies adopted in various jurisdictions in order to support,
or revive the flow of credit. Among them are attempts to prevent discrimination against lending to
SMEs by, for instance, defining a lender code of conduct. For instance, the Bank of Ireland requires
lenders to publish on their website application procedures, as well as available government co-
financing programmers available to SMEs. Lenders are also required to provide their reasons in
writing for rejecting a loan and an appeal process on sound grounds exists for challenging the
bank’s decision. Awareness programs informing SMEs of options available to them for financing
have also been found effective internationally.
6 The Bank Lending Survey conducted by the Bank of Latvia, in cooperation with the ECB, is addressed to senior loan
officers, and asks about changes in lending standards in the past quarter and intentions for one quarter ahead.

REPUBLIC OF LATVIA
32 INTERNATIONAL MONETARY FUND
Box 1. Institutional Responsibility for Supervisory and Macroprudential
Policy in the Nordic-Baltic Area
Implementation of micro-prudential policy
The Nordic-Baltic region is one of the most financially integrated regions in the world. The banking sector in
this region is dominated by a small number of banks with large cross-border exposures. As a result, long-
standing supervisory colleges for Nordic banking groups have existed, coordinating supervisory plans, and
exchanging information regularly on risks, liquidity and capital adequacy. The colleges allow for coordination
of inputs to EBA and to EU-wide colleges in the EU. Recently, with the advent of SSM the colleges also
coordinate on their input to the Joint Supervisory Teams (JST) in the SSM.
The advent of the SSM has increased the need for close cooperation between all the relevant authorities.
The home countries of subsidiaries in EA countries such as Latvia remain outside the SSM, which presents
new challenges. Asset quality reviews and stress tests are done at various levels. Although subsidiaries of
Nordic Groups within the Euro Area are assessed according to SSM methodology, group-level assessment is
often based on the home authority methodology. With the implementation of CRD IV progress has been
made towards harmonization, yet differences still exist in the supervisory practices. In addition, a close level
of cooperation is essential in the region as it is often difficult to assess credit and liquidity risks on the basis
of entity due to strong cross-border linkages.
Implementation of macro-prudential policy
As is generally the case elsewhere, macro-prudential policy is a fairly new concept in the Nordic-Baltic area.
Following the financial crisis and recently with the introduction of the CRR/CRD IV, each Nordic-Baltic
country has by now taken decisions to formally designate a domestic authority or body in charge of macro-
prudential policy. Depending on the country, the authority could be vested with the central bank (Estonia,
Lithuania, Latvia), the supervisory authority (Sweden, Finland), or the government or an independent council
(Denmark, Norway and Sweden). Due to their strong ties, and different status in terms of membership in EU
and EA, there are important overlaps in jurisdiction. This is the case in spite of differences in the stages of
financial cycles across different countries in the region.
Various institutional memberships in the Nordic-Baltic region
Nordic-Baltic Macroprudential Forum (NBMF)
In 2011, the Nordic and Baltic countries formed the Nordic-Baltic Macro-prudential Forum (NBMF) as a high-
level platform for central banks and supervisory authorities in the Nordic-Baltic region to meet regularly, following the creation of the European Systemic Risk Board (ESRB) in 2010 which provides the same
platform at the European level. While the NBMF is an informal body with no decision-making authority, the
mandate of the Forum has been to discuss financial stability risks facing the Nordic-Baltic countries, and the
implementation of macro-prudential measures. The NBMF has also discussed a number of separate topics
such as the application of risk weights in the Nordic-Baltic area.

REPUBLIC OF LATVIA
INTERNATIONAL MONETARY FUND 33
Box 2. Policy Measures Intended to Encourage Credit Growth:
Examples from Various Jurisdictions
Credit-less recoveries have been a common feature among many countries following the financial
crisis particularly in Europe. From Italy to Greece, Slovenia to Spain, several countries saw credit retrench
long after output growth turned positive. In this section, we present some of the policies used in a number
of jurisdictions to resuscitate credit growth. We have focused on policies outside those that facilitate NPL
work-outs (out of court restructuring, specialized courts and judicial procedures, reforms of the insolvency
law), mainly because Latvia has made important progress in this regard and as a result NPLs now stand at
relatively healthy levels.
The supportive measures can be classified into two broad categories:
Government policies to improve bank credit intermediation
Credit guarantee schemes. Ireland and Greece used credit guarantees or subsidies on SME loans. In
Ireland, through the SME Credit Guarantee Scheme, the state provided aid of up to 20 percent of the value
of the loan to the banks. The Scheme was intended to address two distinct barriers to lending: i) inadequacy
of collateral; and ii) inadequacy of understanding of the novelty of a business model, market, sector or
technology. In Greece, the government teamed up with KfW, the German development bank, and the EIB to
distribute funds to SMEs through an on-lending program with the help of accredited Greek banks.
Credit mediation. Credit mediation schemes, such as those conducted by the Credit Review Office (CRO) in
Ireland, are available for SMEs whose demand for credit has been entirely or partially rejected by a financial
institution. Such schemes operate by either independently reviewing rejected credit applications, or by
acting as interlocutor between borrower and lender on a disputed credit decision. Credit mediation may be
particularly useful during at times when banks’ risk aversion has over-corrected in response to mounting
losses and deleveraging requirements. Similar bodies exist in bodies have been set up in France, Belgium,
Germany, Spain and the United Kingdom. As is the case with other forms of government intervention in the
credit market, the separation of the credit mediation body from political interference is crucial to its
successful operation.
Lending targets. In Ireland, the government put in place annual SME loan targets for the banks in which it
owned a stake. A similar policy was adopted in the UK, whereby the government came to an agreement with
a number of large commercial banks on lending targets to businesses and small firms.
Central bank and macro-prudential policies intended to improve bank credit intermediation
Cheap funding for lending. The Funding for Lending Scheme (FLS), set up by the Bank of England, was
designed to incentivize UK banks to boost their lending to the real economy by providing them with funding
for an extended period, with both the price and quantity of funding provided linked to their lending
performance.
Ceilings on the speed of deleveraging. The Bank of Slovenia introduced a macro-prudential instrument,
Gross Loan to Deposit Funding (GLTDF), aimed at slowing the reduction in loan to deposit ratio of the banks.
The instrument was intended to keep deleveraging at a sustainable pace and to ensure that the banks did
not transfer deposits from the non-banking sector abroad instead of re-circulating them as loans to the real
economy. The GLTDF imposed a floor on the ratio of the annual change in the gross stock of loans to the
annual change in the stock of deposits. The banks must comply with the requirements or else, apply
corrective measures.
Capital relief through adjustment of risk-weights. In the UK, the Bank of England used its supervisory
authority in the context of Pillar II to offer a capital offset for certain loans to SMEs. This macro-prudential
measure relieved the banks’ capital constraints for lending to the real economy.
REPUBLIC OF LATVIA
34 INTERNATIONAL MONETARY FUND
References
Abdul Abiad & Giovanni Dell'Ariccia & Bin Li, 2011. "Creditless Recoveries," IMF Working Papers
11/58, International Monetary Fund.
Bijsterbosch, Martin & Dahlhaus, Tatjana, 2011. "Determinants of credit-less recoveries," Working
Paper Series 1358, European Central Bank.
Stijn Claessens & M. Ayhan Kose & Marco E. Terrones, 2009. "What happens during recessions,
crunches and busts?," Economic Policy, CEPR;CES;MSH, vol. 24, pages 653-700, October.
Kannan, Prakash, 2010. "Credit Conditions and Recoveries from Recessions Associated with Financial
Crises," IMF Working Papers 10/83, International Monetary Fund.