imf country report no. 15/87 qatar · imf country report no. 15/87 qatar selected issues this...
TRANSCRIPT

© 2015 International Monetary Fund
IMF Country Report No. 15/87
QATAR SELECTED ISSUES
This Selected Issues paper for Qatar was prepared by a staff team of the International Monetary Fund as background documentation for the periodic consultation with the member country. It is based on the information available at the time it was completed on March 6, 2015. This Selected Issues paper has benefitted from discussions with staff from the Ministry of Finance, the Central Bank of Qatar, and the Ministry of Development and Statistics. The policy of publication of staff reports and other documents by the IMF allows for the deletion of market-sensitive information.
Copies of this report are available to the public from
International Monetary Fund Publication Services
PO Box 92780 Washington, D.C. 20090 Telephone: (202) 623-7430 Fax: (202) 623-7201
E-mail: [email protected] Web: http://www.imf.org Price: $18.00 per printed copy
International Monetary Fund
Washington, D.C.
March 2015

QATAR SELECTED ISSUES Approved By Juha Kähkönen
Prepared By Alberto Behar, Bahrom Shukurov, and Andrew Warner with support from Juan Carlos Flores and Sarah Knight.
STRENGTHENING FISCAL POLICY AND FISCAL FRAMEWORKS IN QATAR ___________ 4
A. Sustainable Fiscal Policy _________________________________________________________________ 4
B. Strengthening Fiscal Frameworks _____________________________________________________ 10
C. Conclusions ___________________________________________________________________________ 14 BOXES 1. Water Consumption in the GCC _________________________________________________________ 7 2. Korea’s Experience in Introducing Medium Term Budgeting __________________________ 12 FIGURES 1. Total Revenues, Expenditures and the Oil Price, FY2000-14 _____________________________ 4 2. Central Government Revenues, FY2000-13 ______________________________________________ 5 3. Government Expenditure, FY 2000-14 ___________________________________________________ 5 4. Government Expenditure in Percent of GDP, FY 2000-14 _______________________________ 5 TABLES 1. Costs of Low Energy and Water Prices in the GCC ______________________________________ 6 2. Illustrative Menu of Options for Fiscal Adjustment ____________________________________ 10 References _______________________________________________________________________________ 16
BREAKING DOWN QATAR’S RAPID GROWTH: INPUT GROWTH OR
PRODUCTIVITY OR BOTH? _____________________________________________________________ 17
A. Introduction ___________________________________________________________________________ 17
B. Output Growth and Input Growth _____________________________________________________ 17
C. Productivity ___________________________________________________________________________ 20
CONTENTS
March 6, 2015

QATAR
2 INTERNATIONAL MONETARY FUND
D. Towards productivity-led growth _____________________________________________________ 23
References _______________________________________________________________________________ 26 FIGURES 1. Qatar and Comparators: Real GDP Growth per Capita ________________________________ 18 2. Real per Capita GDP in 189 Countries, 1984-2013 ____________________________________ 18 3. GDP per Person, 1980-2013 ___________________________________________________________ 18 4. Government Investment and Output, 1994-2013 _____________________________________ 18 5. Estimated Capital Stock, 1981-2013 ___________________________________________________ 19 6. Estimated Capital Stock (non-hydro-economy), 1987-2013 ___________________________ 19 7. Non-hydro GDP and Labor Productivity, 1980-2013 __________________________________ 20 8. Labor Productivity by Sector, 2001-2013 ______________________________________________ 20 9. Impact of Slowing Input Growth on Output Growth __________________________________ 23 TABLES 1. The Rise in the Employment ___________________________________________________________ 20 2. Average Years of Schooling in the Population Over Age 25 ___________________________ 22 3. Average Growth Rates 2006/7-2013 __________________________________________________ 23 References _______________________________________________________________________________ 26 WHAT DRIVES INFLATION IN QATAR? ________________________________________________ 27
A. Background ___________________________________________________________________________ 27
B. Review of the Data ____________________________________________________________________ 28
C. Interpretation of the Results __________________________________________________________ 35 FIGURES
1. Inflation Rate in Qatar, 2003-14 _______________________________________________________ 27 2. Price Levels: Oil and Gas vs. Non-Oil and Gas, 1980-2013 _____________________________ 27 3. The Simple Association between Inflation and Migration is Stronger than other Popular Explanations _____________________________________________________________________ 29 4. Inflation and Real Estate Inflation, 2003-14 ___________________________________________ 30 5. Inflation of Selected Price Indices, 2003-14 ___________________________________________ 30 6. Fit of the Annual Inflation Model, 2002-14 ____________________________________________ 32 7. Performance of the Quarterly Model __________________________________________________ 35 TABLES 1. Population and Migration Estimates, 2000-14 ________________________________________ 31 2. Regression Results Explaining Annual Inflation in Qatar, 2002-2013 __________________ 32 3 Simple Inflation model _________________________________________________________________ 32 4. Accounting for the Variance in Inflation _______________________________________________ 33

QATAR
INTERNATIONAL MONETARY FUND 3
5. Regressions Explaining Quarterly Inflation in Qatar, 2002-2013 _______________________ 34
ANNEXES I. Descriptive Statistics ___________________________________________________________________ 37 II. Heat Map ______________________________________________________________________________ 38 III. Regression Tables _____________________________________________________________________ 39
References _______________________________________________________________________________ 40
QATAR
4 INTERNATIONAL MONETARY FUND
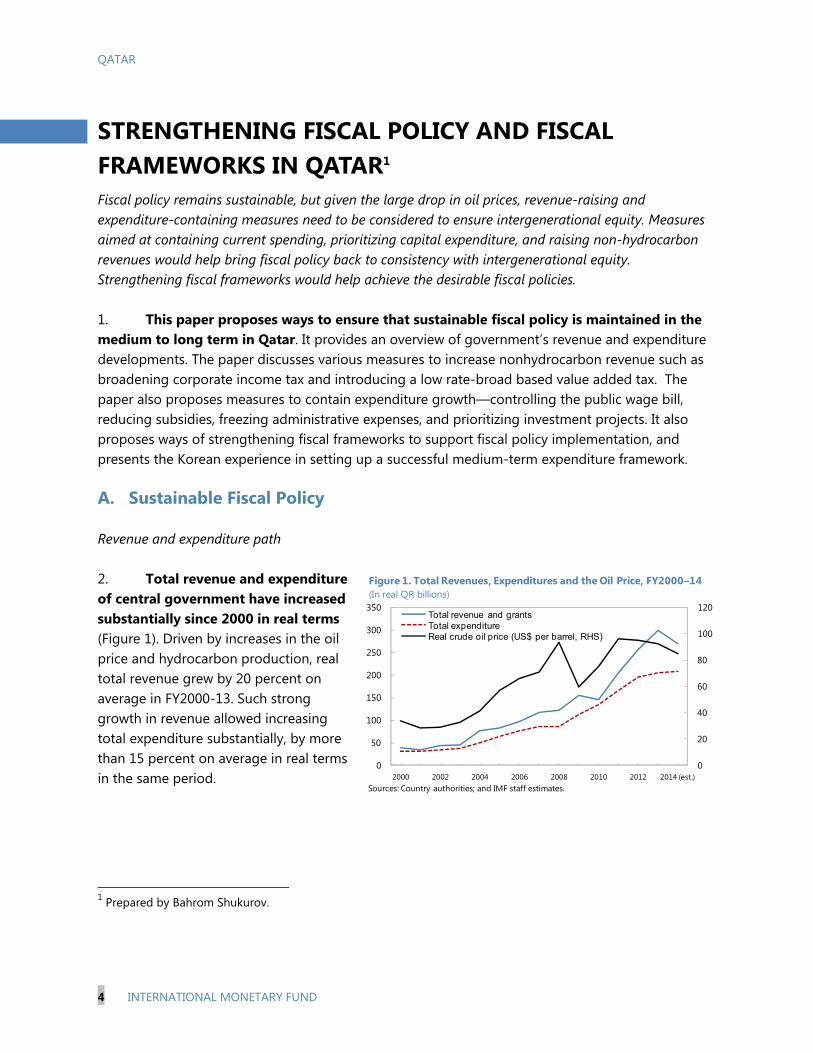
STRENGTHENING FISCAL POLICY AND FISCAL FRAMEWORKS IN QATAR1 Fiscal policy remains sustainable, but given the large drop in oil prices, revenue-raising and expenditure-containing measures need to be considered to ensure intergenerational equity. Measures aimed at containing current spending, prioritizing capital expenditure, and raising non-hydrocarbon revenues would help bring fiscal policy back to consistency with intergenerational equity. Strengthening fiscal frameworks would help achieve the desirable fiscal policies. 1. This paper proposes ways to ensure that sustainable fiscal policy is maintained in the medium to long term in Qatar. It provides an overview of government’s revenue and expenditure developments. The paper discusses various measures to increase nonhydrocarbon revenue such as broadening corporate income tax and introducing a low rate-broad based value added tax. The paper also proposes measures to contain expenditure growth—controlling the public wage bill, reducing subsidies, freezing administrative expenses, and prioritizing investment projects. It also proposes ways of strengthening fiscal frameworks to support fiscal policy implementation, and presents the Korean experience in setting up a successful medium-term expenditure framework. A. Sustainable Fiscal Policy Revenue and expenditure path 2. Total revenue and expenditure of central government have increased substantially since 2000 in real terms (Figure 1). Driven by increases in the oil price and hydrocarbon production, real total revenue grew by 20 percent on average in FY2000-13. Such strong growth in revenue allowed increasing total expenditure substantially, by more than 15 percent on average in real terms in the same period.
1 Prepared by Bahrom Shukurov.
0
20
40
60
80
100
120
0
50
100
150
200
250
300
350
2000 2002 2004 2006 2008 2010 2012 2014 (est.)
Total revenue and grantsTotal expenditureReal crude oil price (US$ per barrel, RHS)
Figure 1. Total Revenues, Expenditures and the Oil Price, FY2000–14 (In real QR billions)
Sources: Country authorities; and IMF staff estimates.
QATAR
INTERNATIONAL MONETARY FUND 5
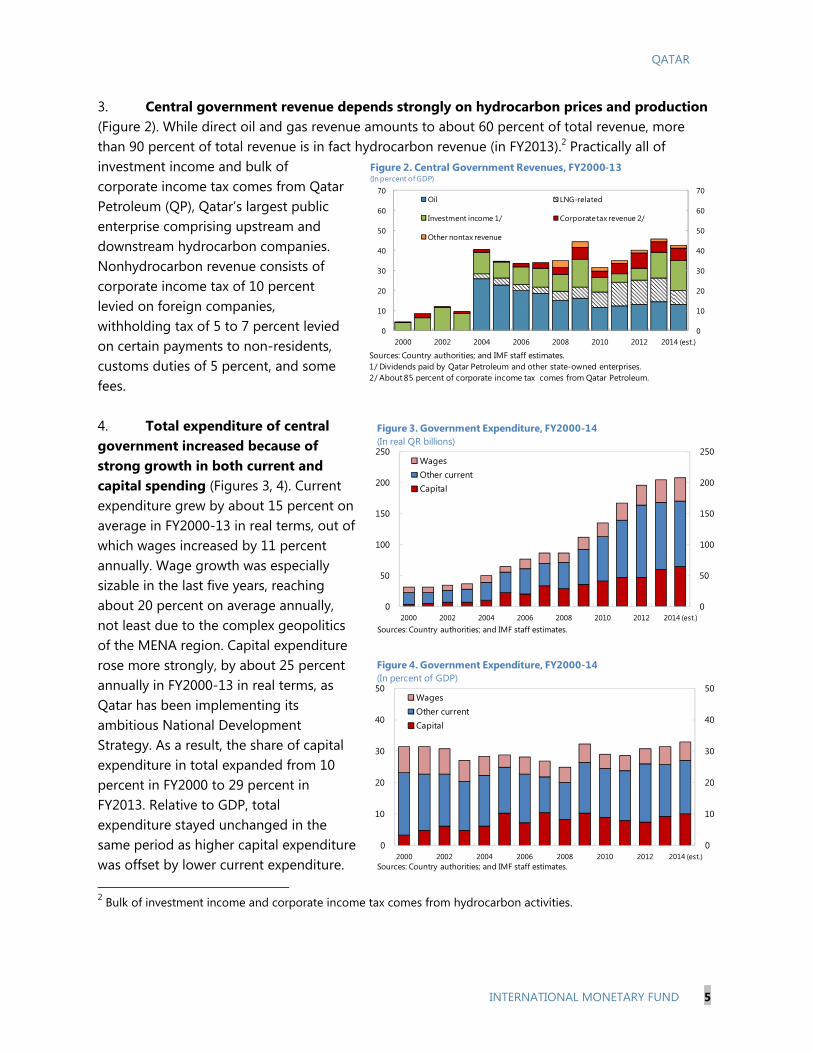
3. Central government revenue depends strongly on hydrocarbon prices and production (Figure 2). While direct oil and gas revenue amounts to about 60 percent of total revenue, more than 90 percent of total revenue is in fact hydrocarbon revenue (in FY2013).2 Practically all of investment income and bulk of corporate income tax comes from Qatar Petroleum (QP), Qatar’s largest public enterprise comprising upstream and downstream hydrocarbon companies. Nonhydrocarbon revenue consists of corporate income tax of 10 percent levied on foreign companies, withholding tax of 5 to 7 percent levied on certain payments to non-residents, customs duties of 5 percent, and some fees.
4. Total expenditure of central government increased because of strong growth in both current and capital spending (Figures 3, 4). Current expenditure grew by about 15 percent on average in FY2000-13 in real terms, out of which wages increased by 11 percent annually. Wage growth was especially sizable in the last five years, reaching about 20 percent on average annually, not least due to the complex geopolitics of the MENA region. Capital expenditure rose more strongly, by about 25 percent annually in FY2000-13 in real terms, as Qatar has been implementing its ambitious National Development Strategy. As a result, the share of capital expenditure in total expanded from 10 percent in FY2000 to 29 percent in FY2013. Relative to GDP, total expenditure stayed unchanged in the same period as higher capital expenditure was offset by lower current expenditure. 2 Bulk of investment income and corporate income tax comes from hydrocarbon activities.
0
50
100
150
200
250
0
50
100
150
200
250
2000 2002 2004 2006 2008 2010 2012 2014 (est.)
Figure 3. Government Expenditure, FY2000-14(In real QR billions)
WagesOther currentCapital
Sources: Country authorities; and IMF staff estimates.
0
10
20
30
40
50
0
10
20
30
40
50
2000 2002 2004 2006 2008 2010 2012 2014 (est.)
Figure 4. Government Expenditure, FY2000-14(In percent of GDP)
WagesOther currentCapital
Sources: Country authorities; and IMF staff estimates.
0
10
20
30
40
50
60
70
0
10
20
30
40
50
60
70
2000 2002 2004 2006 2008 2010 2012 2014 (est.)
Oil LNG-related
Investment income 1/ Corporate tax revenue 2/
Other nontax revenue
Figure 2. Central Government Revenues, FY2000-13(In percent of GDP)
Sources: Country authorities; and IMF staff estimates.1/ Dividends paid by Qatar Petroleum and other state-owned enterprises.2/ About 85 percent of corporate income tax comes from Qatar Petroleum.

QATAR
6 INTERNATIONAL MONETARY FUND
Subsidies
5. Low energy and fuel prices resulted in large subsidies, direct or implicit, as in other GCC countries (Table 1). On-budget subsidies in Qatar amounted to 2 percent of GDP in 2010; implicit energy subsidies are estimated at 3.5 percent (IMF, 2014).3 Water subsidies may also be sizable, as water consumption rates and technical losses are high in Qatar, as in other GCC countries (Box 1). Subsidy reforms so far were mainly raising retail gasoline and diesel prices (in 2011 and 2014), which are still way below international market levels (by about 50 percent compared to the US prices).
Table 1. Costs of Low Energy and Water Prices in the GCC
3 The on-budget subsidies data are available for 2004-2010 and derived from the GFS Yearbook. The split between food and energy subsidies is not available. The 3.5 percent of GDP in energy subsidies is estimated by the IMF for 2011. The 2014 IMF paper uses the international fuel price as the benchmark price to estimate the cost of subsidies (the country would generally incur an opportunity cost if it simply sold the fuel at the domestic production cost).
In percent of GDP 1/
Recent reforms
Bahrain 12.5 Industrial tariffs for gas in Bahrain were increased by 50 percent on January 1, 2012. Tariffs for electricity and water for non-domestic use were also raised (in October 2013).
Kuwait 7.0 A study on the impact of a differentiated electricity and water tariff structure has been completed in 2014. Subsidies on diesel have been discontinued.
Oman 6.2 Plans to double the feedstock gas prices by 2015. An energy sector study is ongoing, with a view to gradually reduce the overall fuel subsidy.
Qatar 3.5 Qatar raised the pump prices of gasoline by 25 percent and of diesel by 30 percent in January 2011. Diesel prices were again raised in May 2014, by 50 percent. Efforts are underway to improve desalination technologies and promote public awareness of sustainable use of energy.
Saudi Arabia 9.9 Saudi Arabia increased the average price of electricity sold to nonindividual users by 9.6 percent on July 1, 2010. Currently, to curb the rapid growth in energy consumption, the authorities are strengthening building and appliance energy efficiency standards, including in industry. Tighter vehicle emission standards and public transportation networks are planned over the medium-term.
United Arab Emirates 5.7 UAE increased gasoline prices in 2010 to the highest level in the GCC, but still below international prices. Abu Dhabi is developing a comprehensive electricity and water consumption strategy, which led to an increase in tariffs from January 2015. Dubai raised water and electricity tariffs by 15 percent in early 2011.
Sources: IMF; IEA; Country authorities; "Energy Subsidy Reform: Lessons and Implications", IMF, 2013;
"Subsidy Reform in the Middle Easit and North Africa", IMF, 2014; and Global Economy and Development at Brookings, 2013.
1/ For Kuwait and Oman, official budget amounts are shown. For Bahrain, the number includes on-budget and off-budget subsidies.
For Qatar, Saudi Arabia, and United Arab Emirates, the estimates of pre-tax subsidies are used (IMF, 2013).

QATAR
INTERNATIONAL MONETARY FUND 7
Box 1. Water Consumption in the GCC
On a per capita per annum (pcpa) basis, GCC countries consume about 65 percent more water than the world average — 816 cubic meters (m3) pcpa, versus 500 (m3) pcpa. Renewable resources, notably from rainfall and groundwater are in short supply, and these countries depend on desalinating seawater, which is energy intensive, imposing a cost on the economy and the environment. For example, Saudi Arabia and the United Arab Emirates (UAE) consume between 10 and 39 times the amount of renewable water available to them, depleting their aquifers at much faster rates than they can be replenished by rainfall. Only Oman comes close to having enough water from renewable sources to meet its domestic demand. Reflecting the average population growth of about 3 percent and a sizable influx of expatriates since 1970, per capita freshwater availability dropped substantially, from 680 cubic meters in1970 to 180 cubic meters in 2000. The water shortages are expected to deteriorate further, if population continues to grow at the same speed. To satisfy the growing demand, the GCC has been building and operating costly desalination plants. Desalination provides two-thirds or more of the potable water used in most of the GCC, but it carries enormous economic and environmental costs. Despite a considerable improvement in efficiency in the last decades, the cost to desalinate seawater is still a relatively expensive way of producing potable water. Moreover, seawater desalination is an energy-intensive process, accounting for 10–25 percent of energy consumption in the GCC on average (about 50 percent in Qatar). The desalination process has increased the temperature and salinity of the Gulf, with the latter estimated to have risen by around 2 percent over the last 20 years, with a negative impact on marine life and ecosystems. Inefficient agriculture, weak institutional arrangements, and poor management practices present a significant drain on water resources. Demand from the agriculture sector in the GCC constitutes up to 80 percent of total water demand (the sector enjoys quite a few privileges such as the absence of agricultural water tariffs and various incentive programs that result in excessive cultivation of water-intensive crops and depletion of groundwater). At the same time, agriculture contributes only a few percentage points of GDP to the GCC’s economies. There are also enormous irrigation losses, up to 40 percent. Some of the GCC countries are now trying to limit water overconsumption in agriculture (e.g. by encouraging local farmers to grow crops that need less water and phasing out projects to export wheat). Weak institutional arrangements and poor management practices are also contributing to wastefulness of water resources. On average, a little over 20 percent of domestic water is either lost to leakage or is not metered. Sizable subsidies finance the inefficient structure that results in high water consumption rates and presents fiscal risks in the long term. Qatar, Saudi Arabia, and the United Arab Emirates consume almost twice as much as the global average for water consumption, while other GCC countries are also above the global average. While data on water subsidies in the GCC are generally not available, they may reach up to a few percentage points of regional GDP. Rationalizing the water usage and reducing waste could reduce consumption substantially (up to 40 percent in Qatar, for example).
QATAR
8 INTERNATIONAL MONETARY FUND
Intergenerational equity 6. While fiscal policy was consistent with intergenerational equity until recently, with lower oil prices, the situation has changed. The significantly lower oil prices led to nonhydrocarbon deficits higher than the relevant intergenerational equity thresholds by about 5 percent of non-hydrocarbon GDP.4 The fiscal break-even oil price of general government is estimated to rise to $77 per barrel by FY2020, an indication of emerging risks associated with permanently low oil prices (the fiscal break-even price taking into account the returns and capital gains of the QIA is projected at $68 by FY2020). Existing fiscal buffers allow Qatar to implement policy adjustment in a gradual manner. Expenditure measures 7. Containing current spending and prioritizing capital expenditure would help achieve intergenerational equity, while buttressing fiscal sustainability. Policies should include the following:
Controlling the public wage bill. The authorities need to develop a clear medium-term strategy for the public wage bill and conduct civil service reviews to help identify and gradually eliminate non-essential positions. This would help keep wages broadly constant as a share of GDP going forward.
Freezing administrative expenses between FY2016 and 2020 would provide substantial savings in current expenditure (these expenses increased by 25 percent on average annually between FY2008 and 2012).
Reducing subsidies while gradually eliminating them altogether for producers. Raising electricity, water, and fuel prices, while protecting those in need, modernizing agriculture, collecting more renewable water, and improving allocation and stemming water losses through better regulation would help strengthen fiscal positions and/or increase priority expenditure such as education and health.
Prioritizing investment projects would also help control spending growth. Smooth spending path would reduce overheating risks in the short term and overcapacity risks in the medium term. Capital spending should be based on a careful scrutiny of public investment projects and not deviate from the resource envelope prepared by the new Public Investment
4 This analysis estimates the government spending path and related nonhydrocarbon deficits that deliver a constant real per capita annuity to finance budget spending after hydrocarbon revenues are exhausted. The calculations are made under plausible assumptions about the time horizon of hydrocarbon resource depletion, the real rate of return on financial assets, oil prices, inflation, and population growth.

QATAR
INTERNATIONAL MONETARY FUND 9
Management unit at the MOF.5
A contingency plan for spending, including for capital projects, is needed given the fiscal risks. Any reforms should be accompanied by a communication strategy and targeted mitigating measures to reduce implementation risks.
Revenue options 8. Parallel efforts to raise nonhydrocarbon revenues would strengthen sustainability and intergenerational equity. Two main principles should guide tax policy making in Qatar given its significant surpluses from hydrocarbon revenues. First, low tax rates and very broad bases generally would not affect investor and consumer behavior. This principle would also be consistent with economic diversification strategy. Second, a corporate income tax (CIT) with broader coverage, which could be achieved by including Qatari (and GCC) companies, would be seen as more equitable by foreign investors. In addition, a broadened CIT, if applied to unincorporated companies, could provide some progressivity in taxation and would lessen the need to introduce a general income tax on individuals. This measure is estimated to yield 2 percent of non-hydrocarbon GDP (Table 2). 9. The value added tax (VAT) would serve well as a low rate-broad base tax. VAT is generally viewed as the most stable revenue source, which has the least detrimental effects on investments. In such a macro-fiscal environment as in Qatar, a low rate, for example 5 percent, VAT could be considered. A broad-based consumption tax such as VAT would raise revenue proceeds at a low efficiency cost. At the same time, its equity implications would be relatively insignificant and tax administration would receive a significant and positive boost. The progress in this area depends on how soon VAT frameworks are agreed within the GCC, which are committed to implement a VAT in the medium term.6 10. Fees and charges for government-provided services should not be seen as a substitute for taxes. If fees are lower than the cost of government goods and services (other than public goods and services), raising those fees would be a welcome step. Raising fees for revenue generating purposes could, however, become a complex and inefficient process. A number of relevant shortcomings are as follows: (i) fees distort supply and demand by (for example) encouraging government to keep supplying goods and services it is not efficient at producing; (ii) fees are inequitable and not transparent; (iii) fees are generally more expensive to administer. In
5 New investment spending in the context of the Qatar National Vision 2030 and FIFA Cup 2022 is QR 600 billion over the next 10 years. 6 The GCC policy framework sets out the basic parameters under which countries are to develop their VAT, including for intra-GCC trade, but considerable flexibility is left to countries in the policy and administrative design of their national VAT. Each country is expected to enact its own VAT legislation.

QATAR
10 INTERNATIONAL MONETARY FUND
addition, the only way to tax private transactions would be to extend fees to private contract – for example, in the form of stamp duties. The alternative to the fee system would be to introduce a single-rate transaction tax on provision of all goods and services, whether by government or private entities (e.g. VAT).
Impact of fiscal measures
11. These illustrative revenue and expenditure options could result in substantial savings in the medium term. Freezing administrative expenses and removing water and electricity subsidies could generate savings of about 4.5 percent of non-hydrocarbon GDP in the medium term. Applying the CIT of 10 percent to Qatari and GCC companies and introducing a 5 percent VAT could yield another 3.5 percent of non-hydrocarbon GDP (Table 2).
Table 2. Illustrative Menu of Options for Fiscal Adjustment
B. Strengthening Fiscal Frameworks 12. Qatar has taken steps in the past towards introducing a medium-term budget framework (MTBF), but with limited success. The MTBF was supposed to focus on a 3-year period, with the budget approval done on an annual basis for the upcoming fiscal year. However, the MTBF in Qatar has remained a stand-alone, internal document and has not been integrated in the regular budget process. Given the lack of a strong budget framework, expenditures were repeatedly raised from planned levels during the fiscal year (with current spending being the driving force). Spending and revenue outcomes have typically been far above the initial budget allocations due to low oil price assumptions (e.g. $65 in the last three fiscal years). Moreover, supplementary spending decisions have often been made on an ad-hoc basis.
Estimated gains 1/ Comments
Revenues 3.5
CIT 2.0 Applying the CIT of 10 percent to Qatari and GCC companies
VAT 1.5 Introducing a 5 percent VAT
Expenditures 4.5
Administrative expenses 3.5 Freezing administrative expenses between 2016-2020
Water and electricity subsidies 1.0 Removal of water and electricity subsidies
1/ In percent of non-hydrocarbon GDP.
Source: Staff estimates.
QATAR
INTERNATIONAL MONETARY FUND 11
13. To accelerate budget reforms and ensure their effective implementation, the new Minister of Finance has revamped the MOF’s organizational structure and initiated a more rigorous approach to reform implementation.7
The Macro-Fiscal Unit (MFU) has been established in the MOF as part of the new Research and Studies Department (RSD). The MFU’s tasks are to conduct macroeconomic modeling and forecasting, which will be used by the Public Budget Department (PBD) and the newly created Public Investment Management Department (PIMD) in preparing annual and medium-term budgets. The Statistics unit, another unit of the RSD, will build and regularly update a database of fiscal and economic data.
Another crucial component of budget reforms—the introduction of the Government Finance Management Information System (GFMIS)—started in 2013 and is expected to be completed in the second quarter of 2015. The GFMIS will connect all spending institutions with the MOF to transparently allocate, use, control, and monitor public resources in all ministries. It will strengthen many areas of public finance management, including public investment, governance, risk, and compliance management. The Statistics unit is expected to start supplying GFS 2001 fiscal data to the MFU at end-2015.
The MOF has started to develop performance-based budgeting to align government spending with the government’s goals emphasizing the link between planning, funding, and the expected results in terms of outcomes. MOF issued a budget circular (on a pilot basis) with instructions for the Ministry of Health to prepare its performance-based budgets until FY 2016. Going forward, the performance-based budgeting will be applied to all ministries, which will be required to provide performance indicators for outcomes achieved under approved budgets. To facilitate this process, the MOF has established a Performance-Based Budget Committee and Task Force in coordination with other ministries to lead the design and implementation of the State of Qatar performance-based budget framework.
To facilitate the reforms, the Fiscal Policy Committee has been established in the Ministry of Finance, headed by the Minister.
14. Korea’s experience in introducing medium-term budgeting can identify useful policy lessons. As in Qatar, there were no imminent serious fiscal issues in Korea. Rather, there was widespread perception in the country of the need of budget reforms. Supported by top policy makers, Korea successfully introduced the MTEF in 2004 to incorporate longer term perspectives into the regular budget process. The Korean case highlights the importance of (i) having strong support for a MTEF from top decision makers; (ii) finding ways of integrating a MTEF into the budget process; and (iii) building capacity of relevant stakeholders (Box 2).
7 Korean experience suggests that while macroeconomic momentum is important to start budget reforms, it is not sufficient for proper implementation of those reforms. The support of top policy makers significantly boosts the implementation of budget reforms.

QATAR
12 INTERNATIONAL MONETARY FUND
Box 2. Korea’s Experience in Introducing Medium Term Budgeting1
The Korean case is interesting because there were no urgent serious fiscal issues to commence the reforms. The medium-term expenditure reform (MTEF) was initiated because of a strong demand for budget reform agenda from a new administration and widespread perception in civil society organizations and public officials of the need for PFM reform. The MTEF was introduced to incorporate longer term perspectives such as increasing government debt, aging population, and increasing social welfare spending, into annual budget process.
The MTEF or “National Fiscal Management Plan” (NFMP) was introduced in Korea in 2004 and has been successfully implemented since then.² The reform package consisted of MTEF, top-down budgeting, performance-oriented budgeting, and an integrated financial management information system. The Ministry of Strategy and Finance (MSF) prepares macroeconomic projections for the next four years; line ministries provide cost estimates of their programs and submit their own medium-term fiscal plans. Based on these, the MSF develops the first draft of the NFMP that covers major policy directions, the fiscal aggregates, and tentative ceilings for line ministries. The Fiscal Strategy Cabinet Meeting is then held to finalize the spending ceilings for line ministries. Subsequently, guidelines to budget preparation are issued to line ministries, which develop budget requests for submission to the MSF. Following negotiation between line ministries and the MSF, the NFMP and budget draft are finalized. Each NFMP covers five years: the current year, the budget year, and three following years. The NFMP is a rolling document, which is revised every year.
The Korean case provides three main policy implications for MTEF reform.
First, strong support from top decision makers is crucial for MTEF to cover the entire government. In the Korean case, the support of top decision makers sustained the medium-term budgeting reform until the institutionalization of MTEF in the National Assembly was achieved.
Second, a MTEF must be integrated into the budget process. In the Korean case, the link between the MTEF and annual budgeting was top-down budgeting. This implies that the MSF had an important task of preparing credible spending ceilings with the active involvement of the central budget office, which is responsible for annual budgets. As Korean reformers realized, a MTEF developed without the cooperation of the budget office is unlikely to maintain credible spending ceilings. As a result, a MTEF may not be integrated into annual budgeting in practice.
Third, enhancing the capacity of line ministries was essential to fully realizing the benefits of a MTEF. With the reform, line ministries’ budget divisions required the capacity to develop ministerial budget drafts, aligned with government-wide priorities. To strengthen the ministerial budget divisions, the MSF upgraded the teams’ status and added personnel. Successful medium-term budgeting reforms usually require plans for building the capacity of stakeholders that will implement the reforms.
1 Based on Achieving Medium-Term Expenditure Framework Reform, a Case Study of Korea, The World Bank Policy Research Working Paper, 2013.
² An earlier attempt at a MTEF took place in Korea in 2001 focusing on integrating the existing medium-term plan into a regular budget process and aligning resources with the policy directions of the government. This attempt failed mostly because of lack of support from top policy makers.

QATAR
INTERNATIONAL MONETARY FUND 13
15. The paper proposes the following phases of strengthening a medium-term budgeting approach in Qatar.
First phase (to be completed by mid-2015). The MFU would prepare a top-down resource envelope, or in other words the medium-term fiscal framework (MTFF), which is basically a macroeconomic framework projecting revenues, expenditures, nonhydrocarbon balances, and debt projections and risk assessment. The MFU would also prepare a medium-term fiscal strategy document that would serve as the basis for annual budget preparation, translating the MTFF into a statement on fiscal policy priorities. Fiscal risk analysis indicating the sensitivity of fiscal plans to different macroeconomic, hydrocarbon sector, and contingent liabilities’ assumptions would also be part of this document. The authorities are on track to complete this phase on time.
Second phase (to be completed by end-2016). The authorities would match a top-down resource envelope with a bottom-up estimation of the costs of existing policy (or in other words preparing the MTBF). The PBD would engage in bottom-up reviews by scrutinizing sector policies aiming at integrating the bottom-up sector programs with the top-down resource envelope. At the end of this phase, a MTBF would be fully functioning and integrated in the annual budget process.
Third phase (to be completed by end-2017). Once the MTBF is fully-functioning, the authorities would gradually turn it into a performance-based medium-term expenditure framework (MTEF). As mentioned above, the MOF has already embarked on developing performance-based budgeting. This work should continue in parallel with the first two phases of budget reforms proposed above. This will result in enhanced capacity of line ministries and will facilitate the completion of the fourth (final) phase of reforms. At this phase, budget funding will be linked to results (shifting the focus from controlling inputs to controlling outcomes and allocating resources according to the results achieved by programs). Sectoral ministries and agencies should have medium-term sector strategies in place, which need to be regularly updated, and thus will need to develop competency in policy analysis and performance management.
16. A MTBF would result in improved fiscal discipline and greater predictability and credibility of the budget, while a subsequent MTEF would ensure resources are better allocated. Strengthening fiscal discipline is especially important in the context of an ongoing large investment program. Avoiding frequent mid-year budget amendments would help anchor fiscal policy and support macroeconomic stability. A strong MTBF would provide a disciplining device to help build buffers and resilience when hydrocarbon prices are high, while providing more clarity about the government’s fiscal policy intentions. The formulation of the MTBF would also provide a helpful platform for a political discourse over the appropriate spending and savings levels. A MTEF would lead to better resource allocation through linking policy, planning, and budgeting, and therefore, more efficient use of public finances.
QATAR
14 INTERNATIONAL MONETARY FUND
17. It is important that the medium-term budgeting is fully integrated in the regular budget process. In practice, achieving such integration is challenging and a MTBF/MTEF can remain a stand-alone document. For a MTBF/MTEF to successfully integrate in the regular budget process, credible top-down resource envelope will need to be developed (during the first phase as mentioned above), while close coordination among the relevant departments at the MOF would be essential. It will also be important that to solve any budget issues line ministries communicate with the MOF through a relevant sector team, rather than going directly to different units and departments. 18. Strong Public Finance Management (PFM) systems and increased guidance by flexible fiscal rules are also important components of the needed budget reforms. These include firm expenditure controls and timely and reliable fiscal reporting based on international standards. Preparing for an adoption of some flexible fiscal rules could delink spending decisions from volatile revenues (e.g. the structural balance rule, or the nonhydrocarbon primary balance rule, or the expenditure rule).8 Expanding fiscal coverage to include extra-budgetary revenues and expenditures, state-owned enterprises and other government-related entities would help better assess the impact of public sector spending on the economy. Greater transparency of fiscal accounts is also essential: an accurate assessment of the Qatar’s fiscal position is difficult given limited disclosure of financial transactions and no official information on the size of the sovereign wealth fund.
C. Conclusions
19. Fiscal policy remains sustainable, but given the large drop in oil prices, revenue-raising and expenditure-containing measures need to be considered to ensure intergenerational equity. Driven by increases in the oil price and hydrocarbon production, total revenue and expenditure of central government have increased substantially since 2000, presenting risks for fiscal sustainability in the medium to long term, especially in the context of low hydrocarbon prices. Measures aimed at containing current spending, prioritizing capital expenditure, and raising non-hydrocarbon revenues would help bring fiscal policy back to consistency with intergenerational equity. The proposed measures include controlling the public wage bill, freezing administrative expenses, reducing subsidies, and prioritizing investment projects. Broadening CIT to include Qatari (and GCC) companies and introducing a low rate-broad based consumption tax such as VAT could also be considered. 20. The paper proposes several phases of strengthening a medium-term budgeting approach in Qatar. During the first phase (by mid-2015), the MFU would prepare a top-down resource envelope, or a MTFF, and a medium-term fiscal strategy document with fiscal risk analysis, translating the MTFF into a statement on fiscal policy priorities. The second phase (by end-2016),
8 For policy options in this area, see, for example, Towards Stronger Fiscal Policy and Institutions in the GCC, IMF staff paper prepared for the 2012 GCC Annual Meeting of Ministers of Finance and Central Bank Governors.

QATAR
INTERNATIONAL MONETARY FUND 15
would cover the preparation of a fully functioning MTBF. At the end of this phase, a MTBF would be integrated in the annual budget process, resulting in improved fiscal discipline and greater predictability of the budget. During the third phase (by end-2017), the authorities would gradually turn the MTBF into a MTEF, with budget funding linked to results leading to better allocation of resources. Sectoral ministries and agencies would develop competency in policy analysis and performance management. Strong PFM systems and increased guidance by flexible fiscal rules are crucial components of these budget reforms.

QATAR
16 INTERNATIONAL MONETARY FUND
References
Achieving Medium-term Expenditure Framework Reform, A Case Study of Korea, Policy Research Working Paper, World Bank, January 2013 Achieving a sustainable water sector in the GCC: Managing supply and demand, building institutions; PWC, 2014. Energy Subsidy Reform: Lessons and Implications, IMF, 2013 Fiscal Policy in Qatar, Selected Issues Paper, IMF, January 2012 Medium-term Budget Framework in Qatar, Selected Issues Paper, IMF, December 2012 Qatar National Development Strategy 2011-2016 Regional Economic Outlook, Middle East and Central Asia, IMF, October 2014 Subsidy Reform in the Middle East and North Africa, IMF, 2014 Towards Stronger Fiscal Policy and Institutions in the GCC; IMF staff paper prepared for the 2012 Annual Meeting of Ministers of Finance and Central Bank Governors of the GCC Water Resources in the GCC Countries: An Overview; Water Resources Management 14: 59–75, 2000.
QATAR
INTERNATIONAL MONETARY FUND 17
BREAKING DOWN QATAR’S RAPID GROWTH: INPUT GROWTH OR PRODUCTIVITY OR BOTH?1 Qatar has recorded impressive rates of output growth, but inputs such as employment and the capital stock have grown almost as fast, leaving little or no productivity gains. Looking forward, declining population growth and investment rates imply a fall in GDP growth unless productivity accelerates. Measures to support productivity growth include enhanced public investment efficiency, human capital development, and further progress in improving the business environment. A. Introduction
1. This paper assesses the relative contributions of inputs and productivity to Qatar’s recent growth performance. Qatar’s hydrocarbon and non-hydrocarbon GDP have grown rapidly. However, immigration has expanded the labor force and government capital projects have increased the capital stock. Faced with the prospect of declining population growth and investment, the sustainability of future growth merits scrutiny. This paper contributes to the analysis by describing the contributions of input growth to output growth. It assesses what role, if any, has been played by productivity growth and discusses which policies could help raise it.
2. The structure of the paper is as follows: Section B compares Qatar’s headline GDP growth performance with that of other fast-growing countries before describing increases in the population and capital stock. Section C adjusts for rises in the employment-to-population ratio and human capital stock in order to calculate changes in labor productivity and in total factor productivity. Section D offers an indication of what slowing input growth would imply for GDP growth while suggesting policies that could help raise productivity growth.
B. Output Growth and Input Growth
3. Qatar is in a small club of fast-growing economies. In 2008, the Commission on Growth and Development identified thirteen economies that had achieved an average annual GDP growth rate of 7 percent for 25 years or more, including Hong Kong (China), Malaysia, Singapore, and Oman.2 The year the report was published (Growth Commission, 2008), Qatar attained this threshold, reaching an average of 7 percent in the years 1984 to 2008. Extending this to 1984 to 2013, growth was 7¾ percent per year. In the non-hydrocarbon sector, Qatar’s annual growth was 8¼ percent over the same period – comfortably exceeding the 7 percent threshold.
1 Prepared by Alberto Behar and Andrew Warner with excellent research assistance from Juan Carlos Flores. 2 Other economies include Botswana, Brazil, China, Indonesia, Japan, Republic of Korea, Malta, Taiwan Province of China, and Thailand. India and Vietnam were anticipated to achieve this threshold shortly after publication. Oman averaged 7 percent growth per year from 1960 to 1999.

QATAR
18 INTERNATIONAL MONETARY FUND
4. Growth in per capita terms was much lower. Qatar’s population grew by almost 7 percent per year over the same period. Thus Qatar’s per capita GDP grew by about 1 percent per year in years 1984 to 2013. For selected comparators that the Growth Commission identified, including Oman, per capita GDP grew faster. Saudi Arabia and Dubai (United Arab Emirates) also had low or negative per capita GDP growth (Figure 1). When broadening the comparators to all countries, Qatar’s per capita GDP growth places it in the lowest third of all countries world-wide (Figure 2).
5. GDP per-capita growth in the past 10 years has been more rapid in the non-hydrocarbon sector than in Oil and Gas. Sales of Natural Gas surged in 1997 as the production from Qatar’s North Field came on line (Figure 3). This caused total GDP to grow by 30 percent in 1997. The rise in non-hydrocarbon GDP dates from around 2004, as major construction projects began to be implemented, boosting GDP in Construction, Transportation and Storage, Hotels, Banking and Finance, and Government.
6. Government spending has affected output through the demand channel thanks to special supply conditions. Qatar is a geographically small economy that is highly dependent on inputs from abroad. Since Qatar imports labor at globally-determined international wage rates and capital at given world prices, it faces less-binding supply constraints than other countries. The surge in oil-financed aggregate demand, particularly in the past decade, has boosted output a la Keynes but not for Keynesian reasons, as there is little economic slack in a traditional sense. Supply
-2-1012345678
-2-1012345678
Qatar Hong Kong
Malaysia Oman Singapore Saudi Arabia
Dubai 1/
1984-2013 Country specific since start of boom
Figure 1. Qatar and Comparators: Real GDP Growth per Capita(Simple average)
Sources: Country authorities; and IMF staff calculations.1/ Data from 1999.
-10
0
10
20
30
40
50
60
0
5
10
15
20
25
30
1994 1997 2000 2003 2006 2009 2012
Overall GDP
Non-oil GDP
Government investment (rhs)
Sources: Country authorities; and IMF staff calculations.
Figure 4. Government Investment and Output, 1994-2013(Annual percent change, 3-year moving average)
Singapore
HongKong
Malaysia
Oman
UnitedKingdom
Norway
UnitedStates
Qatar 1.1Saudi Arabia
U.A.E.-4
-2
0
2
4
6
8
10
12
14
-4
-2
0
2
4
6
8
10
12
14
Sources: World Development Indicators, World Bank; and IMF staff calculations.
Figure 2. Real per Capita GDP in 189 Countries, 1984–2013(Average annual percent change)
0
20
40
60
80
100
120
0
20
40
60
80
100
120
1980 1983 1986 1989 1992 1995 1998 2001 2004 2007 2010 2013
Hydrocarbon
Non-hydrocarbon
Figure 3. GDP per Person, 1980–2013(Thousand 2004 Riyals)
QATAR
INTERNATIONAL MONETARY FUND 19
constraints have emerged primarily in land equipped with conveniences such as water and sewerage connections and electricity. Qatar has experienced some bouts with high inflation when immigration has been so fast as to put pressure on available land and suitable housing.
7. Spending on public investment itself creates GDP growth immediately, but should be distinguished from the productivity effects of these investments. Government investment accelerated markedly to a peak in 2007 and generally remains high (Figure 4). This pattern coincided with the pattern for both overall and non-hydrocarbon GDP growth. However, the correlation between GDP growth and government investment spending has been a contemporaneous association reflecting the contribution of investment to aggregate demand. Any impacts in boosting productivity in other sectors would come after the structures are completed, and should operate with a lag of many years since it takes years for investments to be completed. Thus the evidence that the association is contemporaneous supports the demand effect of the investment and not necessarily the effect on productivity.
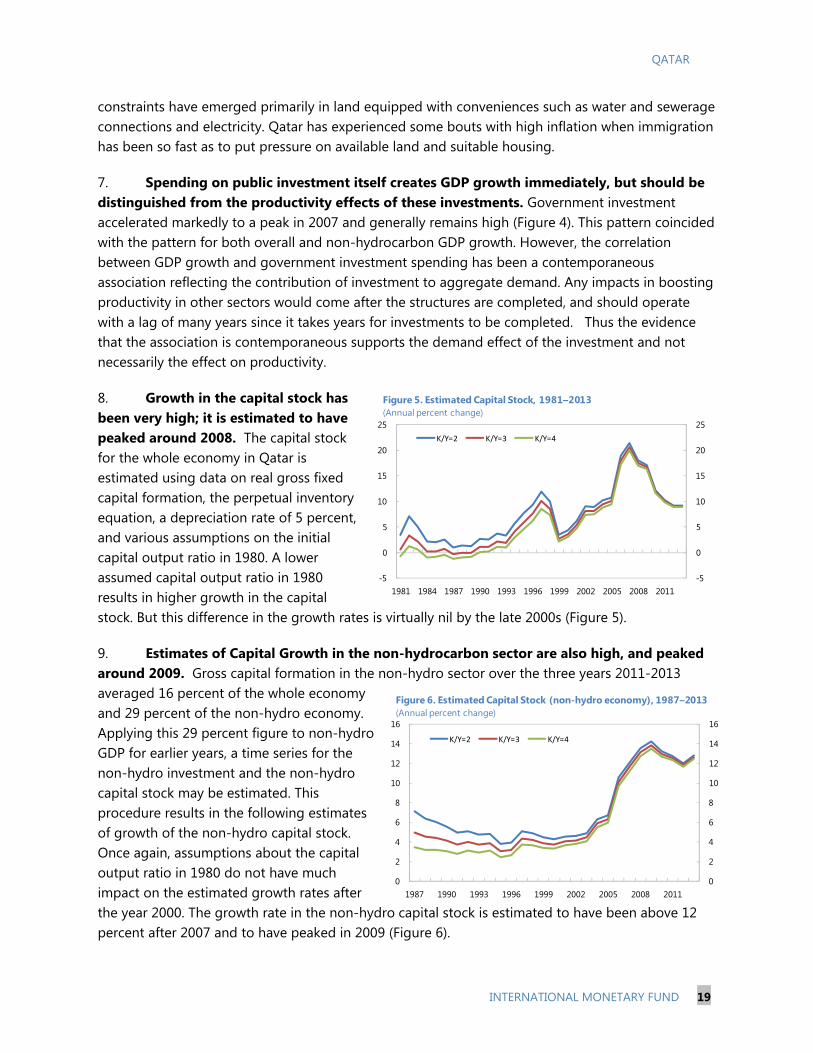
8. Growth in the capital stock has been very high; it is estimated to have peaked around 2008. The capital stock for the whole economy in Qatar is estimated using data on real gross fixed capital formation, the perpetual inventory equation, a depreciation rate of 5 percent, and various assumptions on the initial capital output ratio in 1980. A lower assumed capital output ratio in 1980 results in higher growth in the capital stock. But this difference in the growth rates is virtually nil by the late 2000s (Figure 5).
9. Estimates of Capital Growth in the non-hydrocarbon sector are also high, and peaked around 2009. Gross capital formation in the non-hydro sector over the three years 2011-2013 averaged 16 percent of the whole economy and 29 percent of the non-hydro economy. Applying this 29 percent figure to non-hydro GDP for earlier years, a time series for the non-hydro investment and the non-hydro capital stock may be estimated. This procedure results in the following estimates of growth of the non-hydro capital stock. Once again, assumptions about the capital output ratio in 1980 do not have much impact on the estimated growth rates after the year 2000. The growth rate in the non-hydro capital stock is estimated to have been above 12 percent after 2007 and to have peaked in 2009 (Figure 6).
-5
0
5
10
15
20
25
-5
0
5
10
15
20
25
1981 1984 1987 1990 1993 1996 1999 2002 2005 2008 2011
K/Y=2 K/Y=3 K/Y=4
Figure 5. Estimated Capital Stock, 1981–2013(Annual percent change)
0
2
4
6
8
10
12
14
16
0
2
4
6
8
10
12
14
16
1987 1990 1993 1996 1999 2002 2005 2008 2011
K/Y=2 K/Y=3 K/Y=4
Figure 6. Estimated Capital Stock (non-hydro economy), 1987–2013(Annual percent change)

QATAR
20 INTERNATIONAL MONETARY FUND
C. Productivity
10. Migration of workers has been the driving force behind high population growth and caused the employment-population ratio to rise dramatically. Qatar’s population rose from approximately 650 000 in 2001 to 1.9 million in 2013.3 The employment-to-population ratio rose from 48 percent in 2001 to 68 percent in 2007 and more than 85 percent in 2013. As a result, growth in GDP per worker has been slower than growth in GDP per population (Table 1). This is illustrated in the case of the non-hydrocarbon sector, which appears to be growing fast in per-capita terms but not in per-worker terms (Figure 7).
11. Labor productivity in the non-hydrocarbon sectors has fluctuated in recent years without showing a clear upward trend. Labor productivity in manufacturing declined between 2001 and 2009 before rebounding in 2012 and then declining slightly in 2013 (Figure 8). Labor productivity in construction has fluctuated around a low level since 2001. Labor productivity in Trade, Hotels and Restaurants rose between 2001 and 2006, but has remained roughly constant since 2006. Measured labor productivity in Government rose sharply after 2012; but this simply measures the rise in the average salary in the public sector.4
3 Reported data are annual averages. 4 Labor productivity is measured by value-added divided by employment (VA/L) and value-added in turn is the sum of total payments to labor plus profits (VA=wL+Profits). Therefore labor productivity is also the sum of the average wage plus profits per worker (VA/L=w+Profits/L).Hence in sectors such as government where profits are low or zero, VA/L may be considered a measure of the average wage or salary in the public sector. Employment data comes from
(continued)
Table 1. The Rise in the Employment Population Ratio
Year Population ('000)Economically Active ('000)
Employment Population Ratio
2000 616.722001 648.75 312.81 48.2%2002 682.432003 717.762004 760.942005 888.452006 1,041.73 531.45 51.0%2007 1,226.21 827.80 67.5%2008 1,448.44 1,168.07 80.6%2009 1,638.83 1,262.26 77.0%2010 1,700.002011 1,768.00 1,271.07 71.9%2012 1,838.72 1,341.19 72.9%2013 1,912.27 1,539.33 80.5%
0
20
40
60
80
100
120
140
160
180
0
20
40
60
80
100
120
140
160
180
1980 1983 1986 1989 1992 1995 1998 2001 2004 2007 2010 2013
Labor productivity, non oil and gas
GDP per person, non oil and gas
Figure 7. Non-hydro GDP and Labor Productivity, 1980–2013(Thousand 2004 Riyals per worker or person)
0
50
100
150
200
250
300
350
400
450
500
0
50
100
150
200
250
300
350
400
450
500
2001 2003 2005 2007 2009 2011 2013
ConstructionManufacturingTrade, HotelsGovernmentHousehold ServiceSocial Services
Figure 8. Labor Productivity by Sector, 2001–2013(Constant 2004 thousands Qatari Riyal per employee)

QATAR
INTERNATIONAL MONETARY FUND 21
12. A possible explanation for low labor productivity is the shift of labor to the construction sector, as construction has lower-than-average productivity. Construction employment as a share of the total did rise dramatically between 2001 and 2008, from just under 20 percent to over 45 percent. But it has declined since 2008, to about 37 percent in 2013. Hence the shift to construction may account for low productivity growth between 2001 and 2008, but not between 2008 and 2013.
13. However, when employment shares are held fixed, the overall picture on labor productivity trends is not substantially different. The employment share in construction was at its lowest in 2001 and highest in 2008. When total labor productivity is re-calculated using constant labor force shares (either 2001 shares or 2008 shares), the overall picture is the same: declining labor productivity between 2001 and 2008, and constant labor productivity between 2001 and 2013. Given that labor productivity rose in the government sector, which is equivalent to the average wage in government rising, this means that labor productivity in the market sectors declined between 2001 and 2013.
14. Schooling Attainment continues to grow in Qatar and accelerated after 2005. Human capital can also increase output per worker. Research using data for 2005 or before concluded that Qatar had relatively low levels of educational attainment for its level of GDP (IMF, 2011). Updated data for 2010 however from the original source indicates a faster increase between 2005 and 2010 (Table 2). While the average years of schooling in the population age 25 or over increased by 2 percent per year between 2000 and 2005 (from 6.42 to 7.10), it increased by 3.5 percent per year between 2005 and 2010 (7.10 to 8.45). Following Hall and Jones (1999), this is translated into a human capital index using returns of schooling data in Psacharopoulos (1994). Between 2005 and 2010, the human capital index in Qatar grew at an average annual rate of 2.46 percent per year from 2.34 to 2.64.
the data on the economically active population by sector from the labor force surveys. Labor productivity data are thus only available for years in which there was a survey.

QATAR
22 INTERNATIONAL MONETARY FUND
Table 2. Average Years of Schooling in the Population Over Age 25
15. Total factor productivity measures how efficiently all inputs are used in production. Building on the earlier analysis of output per worker (labor productivity), total factor productivity (TFP) growth is a measure of how productivity of all inputs combined has evolved. Estimates of TFP growth are based on the equation:
(1 )( )Y A K L Hg g g g g
In which Ag is total factor productivity growth, Kg is growth in the physical capital stock, Lg is growth in the number of workers, and Hg is growth in human capital. 0.5 to keep the estimates comparable to IMF (2011).5 Table 3 shows the estimates separately for the whole economy and the non-hydrocarbon economy between 2006/7 and 2013. An average for the years 2006 and 2007 was used as a starting point because 2006 was an unusually high year for labor productivity.
16. TFP growth was negative over the period 2006/7-2013, as rapid output growth did not keep pace with even faster input growth. For the whole economy, output grew at an average annual rate of 12.26 percent; physical capital 13.16 percent; employment 14.46 percent; and human capital 2.46 percent; for an estimated TFP growth of -2.78 percent (Table 3). Given that some analysts do not include human capital in TFP calculations, note that if human capital growth were not included TFP growth would instead have been -1.55 percent. Turning to the non-hydrocarbon
5 The conclusions are robust to the choice of this parameter within plausible ranges. Lower values of α would translate to slightly lower productivity growth because K L Hg g g .
1950 10 0.54 0.42 0.09 1.05 1.151955 14 0.69 0.53 0.13 1.35 1.201960 19 0.93 0.72 0.19 1.85 1.281965 31 1.23 0.95 0.26 2.43 1.381970 50 1.65 1.27 0.34 3.26 1.551975 80 1.89 1.43 0.38 3.70 1.641980 112 2.30 1.70 0.41 4.41 1.781985 206 2.63 1.91 0.44 4.97 1.891990 279 2.87 2.06 0.44 5.38 1.961995 312 3.18 2.29 0.47 5.94 2.082000 370 3.37 2.51 0.55 6.42 2.182005 523 3.61 2.83 0.67 7.10 2.342010 582 5.01 2.81 0.63 8.45 2.64
YearPopulation
25+(1000s)
Avg. Years of Primary
Schooling
Avg. Years of
Secondary Schooling
Avg. Years of Tertiary
Schooling
Avg. Years of
Total Schooling
Human Capital Index

QATAR
INTERNATIONAL MONETARY FUND 23
economy, our estimates are that TFP growth was -0.39 percent or 0.84 percent (if human capital growth was not used in the calculation). Therefore, whether one looks at labor productivity growth or TFP growth, both estimates suggest that productivity growth in Qatar in recent years has been low.
Table 3. Average Growth Rates 2006/7-2013 (In Percent)
D. Towards productivity-led growth
17. Hydrocarbon output growth is projected to be low, leaving the non-hydrocarbon sector as the main contributor to growth going forward. Reflecting a voluntary gas investment moratorium and maturing crude oil fields, hydrocarbon output is expected to be broadly flat over the medium term. The authorities are executing a $200 billion infrastructure program to advance economic diversification and view preparation for the FIFA 2022 World Cup as an intermediate step in their long term plan to lay the foundation for sustained growth in the non-hydrocarbon sector.
18. Lower input growth implies lower GDP growth going forward. The United Nations6 has projected population growth to slow to a standstill, and the Qatari leadership has pointed in particular to high population growth and high immigration as something they do not wish to continue indefinitely.7 Government spending plans indicate investment will peak this decade, which our calculations suggest would result in a slowdown
6 http://www.escwa.un.org/popin/members/qatar.pdf 7 See Qatar National Vision 2030
Non-hydrocarbon
Economy
Total Economy
Output Growth 13.67 12.26Capital Growth 12.43 13.16Employment Growth 13.23 14.46Human Capital Growth 2.46 2.46
Labor Productivity Growth 0.45 -2.19TFP Growth (with Human Capital) -0.39 -2.78TFP Growth (without Human Capital) 0.84 -1.55
-10
-8
-6
-4
-2
0
-10
-8
-6
-4
-2
0
Non-hydrocarbon Economy Total Economy
Capital
Labor
Source: IMF staff calculations.1/ Simulated medium-term impact on GDP growth of fall in employment and government investment growth to zero by 2020, relative to 2006/7-2013 average.
Figure 9. Impact of Slowing Input Growth on Output Growth 1/(Percent)
QATAR
24 INTERNATIONAL MONETARY FUND
in the pace of growth in the capital stock to about 9 percent in 2020. In our simple framework, this reduction in input growth implies a fall in medium-term output growth of about 9 percent from the 2006/7-2013 averages (Figure 9).8 Consistent with this, the baseline forecast is a deceleration of growth to about 4 percent in 2020.
19. Productivity and human capital growth accelerations could compensate. So far, the combined contributions of TFP and human capital growth have been negligible. If TFP growth rises and the provision of human capital accelerates, some of this reduction in growth may be mitigated. Some recent improvements in project selection and execution could lead to longer-lasting TFP growth, but this would represent a break from the past. Redoubled efforts would be needed to generate productivity and human capital accelerations:
Boosting investment efficiency to raise the productivity of physical capital. As government investment will remain significant in the near future, one big opportunity to improve public capital productivity is to strengthen public investment selection and management. Although comparable to GCC peers, the efficiency of Qatar’s public investment appears to be lagging behind resource-rich advanced economies. Qatar has launched important reforms by establishing a new public investment management department at the Ministry of Finance. The critical tasks of this department should include (a) obtaining objective information to better estimate the returns of the public investments, and (b) ensuring that expenditure decisions react to this information properly. Such steps form a key component of a package of measures to improve the public investment management process, the medium-term budget framework, and other fiscal institutions (See the previous Selected Issues Paper and the Qatar 2014 Article IV Selected Issues Paper).
Increasing the quantity and quality of human capital. Although Qatar’s increase in the average years of schooling has been impressive by global standards, the increase did not quite match those of the United Arab Emirates, Bahrain, and Saudi Arabia, where schooling attainment still exceeded that of Qatar in 2010. It is also important to distinguish between the quantity and quality of education. The Trends in International Mathematics and Science Study (TIMSS) database indicates that, despite signs of notable improvement, Qatar still ranks below global norms in terms of tests in primary school. Although there is no automatic and guaranteed link between educational attainment and productivity, further investments to increase enrollments and improve the quality of educational curricula may be an important avenue for increasing productivity. Given the reliance on foreign labor, further measures to target those foreign workers possessing scarce skills should be explored.
8 GDP growth is positive despite zero public investment growth mostly because the capital stock continues to grow. Investment growth of zero still leads to growth in the capital stock if investment as a share of GDP is sufficiently large to compensate for depreciation in the existing capital stock. As a further stark example, growth rates of zero in the labor force and the capital stock would reduce their contribution to output growth by more than 12 percent, leaving output growth close to zero.

QATAR
INTERNATIONAL MONETARY FUND 25
Other measures could also support productivity growth. Specific measures to raise productivity include simplifying business administration to encourage entrepreneurship, improving contract enforcement to facilitate lending, increasing labor market mobility for foreigners to improve the quality of matches between workers and vacancies, and addressing logistics bottlenecks to reduce storage costs and waiting times.
QATAR
26 INTERNATIONAL MONETARY FUND
References
Commission on Growth and Development (2008), “The Growth Report: Strategies for Sustained Growth and Inclusive Development”, World Bank, Washington. Hall, Robert E. and Charles I. Jones “Why do Some Countries Produce so much More Output per Workers than Others?” The Quarterly Journal of Economics, February 1999. International Monetary Fund (2014), “Qatar: Selected Issues I: Assessing Efficiency of Qatar Public Investment”, IMF Country Report 14/109. (Washington, International Monetary Fund). International Monetary Fund (2011), Staff Report for the 2010 Article IV Consultation, IMF Country Report No. 11/64 March 2011 Psacharopoulos, George, ‘‘Returns to Investment in Education: A Global Update,’’ World Development, XXII (1994), 1325–1343.

QATAR
INTERNATIONAL MONETARY FUND 27
WHAT DRIVES INFLATION IN QATAR?1 In Qatar double digit inflation has given way to single digit inflation in recent years, prompting differing views about the driving forces. This paper test many views against each other and finds that the evidence supports a simple and slightly non-standard inflation model in which migration and global forces play key roles. Going forward, inflation monitoring should focus on rates of migration and population growth, global inflation trends, as well as domestic credit growth. A. Background 1. Qatar faces a mix of possible inflationary and deflationary trends. Currently inflation is fairly low (2¾ percent per year as of December 2014) but there are underlying economic forces that could move it in either direction. Inflationary forces related to the public infrastructure program are reflected in the strong increases in the housing and rental prices. Deflationary forces include the decline in commodity and energy prices, especially over the last six months, and the overall deceleration of inflation in key markets such as the European Union. 2. Qatar has previous experience with double digit inflation. Since the economic boom in Qatar commenced after 2002 the inflation rate has at times reached high levels – for example 14.7 percent per year in the first quarter of 2007 (figure 1). This inflationary episode followed many years in which the price level was fairly constant (figure 2).
3. This backdrop places a premium on understanding how various factors affect inflation in Qatar. Over the past ten years, inflation has been linked in various writings to many factors. These include the currency peg of the Riyal to the US dollar, as a depreciating dollar is feared to raise prices of euro-denominated imports, changes in global food and energy prices, high government spending, and even the stance of US monetary policy (CNN February 2008), as cuts in
1 Prepared by Andrew Warner. Annex II was contributed by Juan Carlos Flores.
-15
-10
-5
0
5
10
15
20
-15
-10
-5
0
5
10
15
20
2003 2004 2005 2006 2007 2008 2009 2010 2011 2012 2013 2014
Figure 1. Inflation Rate in Qatar, 2003–14(In percent)
0
50
100
150
200
250
300
0
50
100
150
200
250
300
1980 1983 1986 1989 1992 1995 1998 2001 2004 2007 2010 2013
Oil and gas deflator
Non-Oil GDP deflator
Figure 2. Price Levels: Oil and Gas vs Non-Oil-and-Gas, 1980–2013(Index 2004=100)
QATAR
28 INTERNATIONAL MONETARY FUND
US interest rates were alleged to put pressure on the Qatari authorities to cut domestic interest rates and boost domestic aggregate demand.2 In Qatar, the media focus on global prices, the exchange rate, high government spending and high rents as the causes of inflation. Some academic analysts have stressed the role of global commodity and food prices, and the exchange rate. Garriga and Armesto (2008) cite the non-traded model to argue that inflation in Qatar should come down to two forcing variables: the US/Euro exchange rate and Oil prices: “A falling dollar contributes to inflation in dollar-pegged economies by raising the domestic-currency prices of tradable goods (such as manufactured goods and many types of food). Rising oil prices make individuals wealthier and encourage them to buy more tradable goods as well as non-tradable goods (such as houses and land), increasing the relative prices of goods and services produced within the country.” Kandil and Morsy (2011) claim that inflation should be a function of six variables; oil prices, government spending, inflation of trading partners, the nominal exchange rate, food prices and the business cycle. 4. Given the large number of factors alleged to affect inflation, there is a need for a model and empirical testing to determine which are truly important. This paper presents tests of various explanations for inflation against one another using both annual data and quarterly data. It finds results that obtain consistently in both kinds of data. Instead of some of the popular explanations for inflation, it finds that the migration rate, putting pressure on land and housing prices, has been a key driver of inflation along with global inflation and, to some degree, the rate of domestic credit growth. Several other common explanations for inflation are rejected in favor of these variables. B. Review of the Data 5. The price level in the economy outside the Oil and Gas sector first started to rise significantly in 2002. As is apparent in figure 2, the rise in the non-hydrocarbon price deflator began in 2002. A traditional framework that can account for this is the non-traded model which predicts that a rise in oil prices should be inflationary, other things constant, because it raises demand for non-traded goods and increases its equilibrium relative price. If nominal traded prices are fixed by world prices, this rise will increase overall inflation. The evidence appears to confirm this broad prediction because, as figure 2 shows, the price level in the rest of the economy, the so called non-hydrocarbon economy, first started to rise at about the same time as the price of oil started to rise in 2003-4.
2 http://edition.cnn.com/2008/BUSINESS/01/31/qatar.economy/index.html?iref=24hours

QATAR
INTERNATIONAL MONETARY FUND 29
Figure 3. The Simple Association between Inflation and Migration is Stronger than other Popular Explanations
6. However, quarterly inflation is not strongly associated with changes in global commodity prices. Although there is a positive long-term association between the price level of hydrocarbon GDP and the price level of the rest of GDP (figure 2), short run changes are not strongly associated. Crude oil prices and global food prices have fluctuated at high frequencies in recent years but the simple association with Qatar’s quarterly CPI inflation is not visually strong (figure 3,A and B). 7. Credit growth was positively associated with inflation in some periods, but there were times when the two appeared unrelated. Credit growth coincides with the 2006-2008 inflation acceleration (figure 3, C), but there are periods of fast credit growth (2003-2004, or 2012-2013) that are not associated with acceleration in inflation. Thus credit and monetary growth appears to correlate with inflation in some periods but not in all periods. The lack of a relation may occur in
-25
-20
-15
-10
-5
0
5
10
15
20
-25
-20
-15
-10
-5
0
5
10
15
20
2002 2004 2005 2007 2008 2010 2011 2013
CPI inflation
Crude oil price inflation
A. Inflation and Crude Oil Price Inflation, 2002–14(Percent per year)
-15
-10
-5
0
5
10
15
20
-15
-10
-5
0
5
10
15
20
2002 2004 2005 2007 2008 2010 2011 2013
CPI inflation
Global food price inflation
B. Inflation and Global Food Price Inflation, 2002–14(Percent per year)
-20
-10
0
10
20
30
40
50
60
70
-20
-10
0
10
20
30
40
50
60
70
2003 2008 2013
CPI inflation
Credit growth
C. Inflation and Credit Growth, 2003–14(Percent per year)
-15
-10
-5
0
5
10
15
20
-15
-10
-5
0
5
10
15
20
2002 2006 2010 2014
CPI inflation
In-Migration rate
D. Inflation and Migration, Annual Data, 2002–14(Percent)
Sources: Qatar Statistics Authority; and Haver Analytics.
QATAR
30 INTERNATIONAL MONETARY FUND
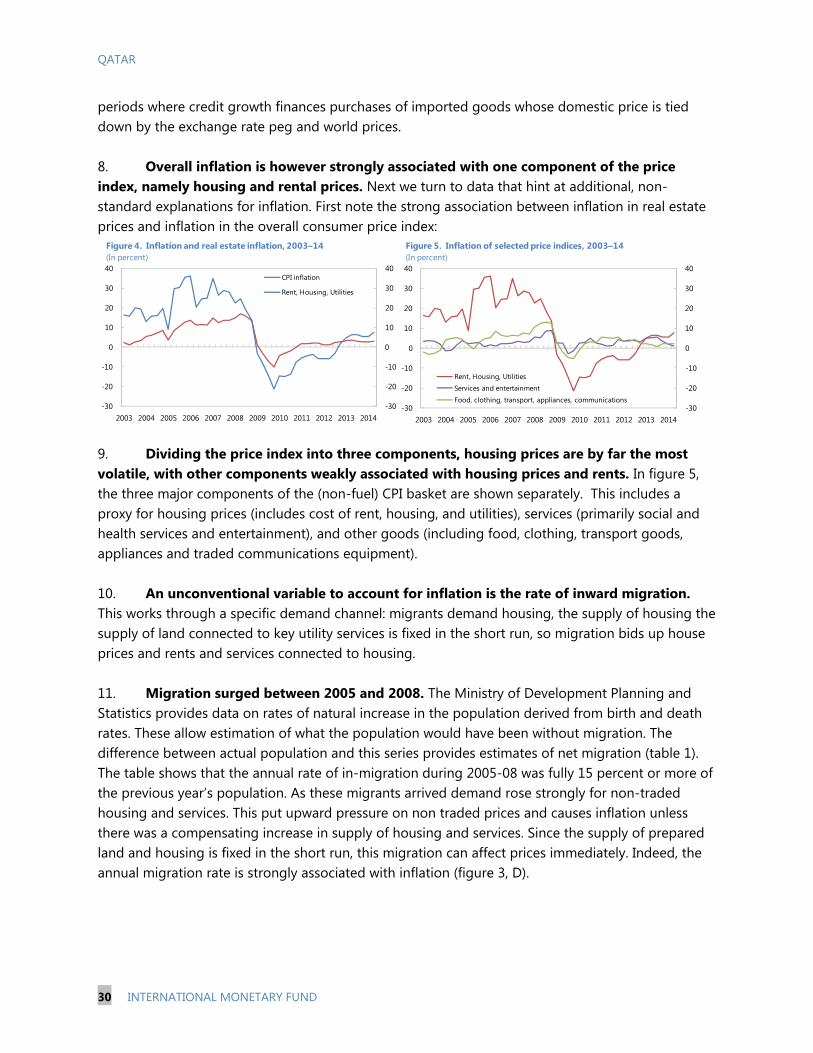
periods where credit growth finances purchases of imported goods whose domestic price is tied down by the exchange rate peg and world prices. 8. Overall inflation is however strongly associated with one component of the price index, namely housing and rental prices. Next we turn to data that hint at additional, non-standard explanations for inflation. First note the strong association between inflation in real estate prices and inflation in the overall consumer price index:
9. Dividing the price index into three components, housing prices are by far the most volatile, with other components weakly associated with housing prices and rents. In figure 5, the three major components of the (non-fuel) CPI basket are shown separately. This includes a proxy for housing prices (includes cost of rent, housing, and utilities), services (primarily social and health services and entertainment), and other goods (including food, clothing, transport goods, appliances and traded communications equipment). 10. An unconventional variable to account for inflation is the rate of inward migration. This works through a specific demand channel: migrants demand housing, the supply of housing the supply of land connected to key utility services is fixed in the short run, so migration bids up house prices and rents and services connected to housing. 11. Migration surged between 2005 and 2008. The Ministry of Development Planning and Statistics provides data on rates of natural increase in the population derived from birth and death rates. These allow estimation of what the population would have been without migration. The difference between actual population and this series provides estimates of net migration (table 1). The table shows that the annual rate of in-migration during 2005-08 was fully 15 percent or more of the previous year’s population. As these migrants arrived demand rose strongly for non-traded housing and services. This put upward pressure on non traded prices and causes inflation unless there was a compensating increase in supply of housing and services. Since the supply of prepared land and housing is fixed in the short run, this migration can affect prices immediately. Indeed, the annual migration rate is strongly associated with inflation (figure 3, D).
-30
-20
-10
0
10
20
30
40
-30
-20
-10
0
10
20
30
40
2003 2004 2005 2006 2007 2008 2009 2010 2011 2012 2013 2014
CPI inflation
Rent, Housing, Utilities
Figure 4. Inflation and real estate inflation, 2003–14(In percent)
-30
-20
-10
0
10
20
30
40
-30
-20
-10
0
10
20
30
40
2003 2004 2005 2006 2007 2008 2009 2010 2011 2012 2013 2014
Rent, Housing, UtilitiesServices and entertainment
Food, clothing, transport, appliances, communications
Figure 5. Inflation of selected price indices, 2003–14(In percent)

QATAR
INTERNATIONAL MONETARY FUND 31
Table 1. Population and Migration Estimates, 2000-14
Empirical Tests using Annual Data
12. In regressions using annual data, migration and advanced country inflation perform better than M1 growth and oil price inflation. Major candidates for variables to affect inflation include money growth, global inflation, oil price growth, migration and global GDP growth. A regression testing the significance of these variables in explaining annual CPI inflation shows that the M2 money supply growth and crude oil price inflation are not statistically significant and are defeated by the migration and advanced country inflation variables. Inflation also appears to be associated with advanced country GDP growth.
Population
Population From
Natural Increase
Migration Estimate
Rate of Migration
(1) (2) (3) = (1) - (2) (3) / (1,t-1)
2000 616.72 595.89 20.83 3.6%2001 648.75 627.17 21.58 3.5%2002 682.43 659.28 23.15 3.6%2003 717.76 693.46 24.30 3.6%2004 760.94 728.42 32.52 4.5%2005 888.45 770.89 117.56 15.4%2006 1,041.73 898.99 142.74 16.1%2007 1,226.21 1,053.62 172.59 16.6%2008 1,448.44 1,239.13 209.31 17.1%2009 1,458.48 1,463.71 -5.23 -0.4%2010 1,520.32 1,473.85 46.47 3.2%2011 1,590.45 1,536.34 54.10 3.6%2012 1,703.48 1,607.21 96.27 6.1%2013 1,908.93 1,721.44 187.50 11.0%2014 2,095.04 1,929.05 165.99 8.7%

QATAR
32 INTERNATIONAL MONETARY FUND
Table 2. Regression Results Explaining Annual Inflation in Qatar, 2002-2013 (Dependent variable is annual percent change in the CPI)
13. Advanced country GDP growth appears to affect inflation but this result is probably mislabeled, as it works as a dummy for the year 2009. The second regression in table 2 shows that when 2009 is removed from the sample, this variable loses its explanatory power. Thus advanced country GDP growth has no estimated impact on Qatar inflation outside of 2009. Given that 2009 was an eventful year, this variable could be picking up much else besides the growth rate, such as temporary expectations of a collapse in the global economy. Since 2009 was arguably a special year, further regressions simply use the 2009 dummy variable as a control rather than continuing with the advanced country growth variable. 14. A parsimonious model of inflation includes only three variables. Putting the preceding results together, a simple, but well-fitting, model for inflation in Qatar includes world inflation, migration, and the 2009 dummy variable (Table 3). This 3-variable model achieves a higher adjusted R2 than the original five-variable model and fits the data closely (figure 6).
Variables Full Sample Without 2009
Migration Rate 0.386 0.383(2.45) (2.26)
Inflation in Advanced Countries 0.070 0.070(3.21) (3.00)
Percent Change in Average Crude Oil Price Index -0.032 -0.027(-1.77) (-0.97)
Growth in M1 -0.002 -0.002(-0.05) (-0.05)
Growth in Advanced Countries 0.012 0.010(3.28) (1.09)
Observations 13 12R-squared 0.959 0.929Robust t-statistics in parentheses*** p<0.01, ** p<0.05, * p<0.1
Table 3. Simple Inflation model
-15
-10
-5
0
5
10
15
-15
-10
-5
0
5
10
15
2002 2003 2004 2005 2006 2007 2008 2009 2010 2011 2012 2013 2014
Actual Inflation
Fitted values from model
Figure 6. Fit of the Annual Inflation Model, 2002–14(Percent)
Variables Full Sample
Migration Rate 0.402(3.09)
Inflation in Advanced Countries 0.070(4.22)
Y2009 -0.085(-4.23)
Observations 13R-squared 0.951Robust t-statistics in parentheses*** p<0.01, ** p<0.05, * p<0.1

QATAR
INTERNATIONAL MONETARY FUND 33
15. Tests reject several additional variables in favor of this model. As shown in table A1, this model was tested against a number of other variables. These include credit growth, M1 growth, M2 growth, nominal consumption growth, global Oil price inflation, Global food price inflation, and two measures of the business cycle, the deviation of GDP growth from trend and the deviation of Non-Oil and Gas GDP from trend. Each of these additional variables proved insignificant when tested against the three variables in the benchmark model. 16. Simulations suggest that variation in migration and advanced-country inflation each account for approximately half of the variation in inflation over 2002-2013. The influence of an explanatory variable depends on both the size of the estimated coefficient and the variability of the variable. As indicated in the table below, the variability of the migration variable, as measured by the standard deviation over the sample period, was 0.061. When multiplied by the estimated coefficient of 0.403, variation in this variable explains 2.5 percentage points of variation in inflation. The same calculation for advanced-country inflation shows that it explains 3.2 percentage points of variation in inflation. The sum of these two impacts, 0.057, is a large share of the overall variation of inflation of 0.068, as measured by its standard deviation.
Table 4. Accounting for the Variance in Inflation
Empirical Tests using Quarterly Data
17. The same model was estimated with quarterly data; the data reject lagged impacts in favor of a simpler specification. Variables that are available on a quarterly basis since 2003 include inflation, oil price growth, nominal effective exchange rate growth, credit growth, money supply growth, advanced country inflation and GDP growth. The migration data were converted from annual to quarterly by interpolating and smoothing the annual data. A regression was first estimated using the same two variables that proved significant in the annual regressions, migration and advanced country inflation, yet this time including lags to allow for delayed effects given the higher frequency data. The migration variable was so highly correlated with its first lag that the regression was unable to estimate the separate impacts – a classic case of multicolinearity. The regression also strongly preferred the contemporaneous rather than the first lag of the advanced-country inflation variable. Further lags were tested but were not significant. Notably, the 2009 dummy is not required to fit the data well.
Dependent Variable: Inflation Std. Dev. 0.068
Independent Variables: Estimated Coef. Std. Dev. Impact(1) (2) (1)*(2)
Migration Rate 0.403 0.061 0.025
A.C. Inflation 6.961 0.005 0.0320.057
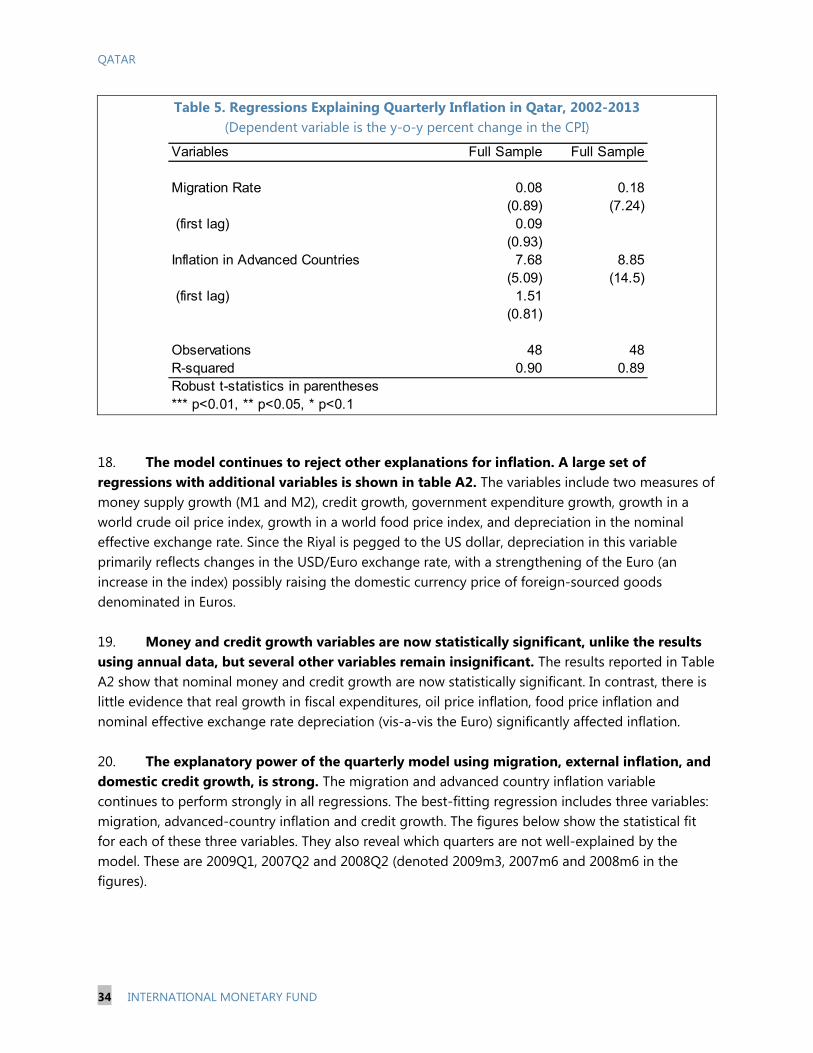
QATAR
34 INTERNATIONAL MONETARY FUND
Table 5. Regressions Explaining Quarterly Inflation in Qatar, 2002-2013 (Dependent variable is the y-o-y percent change in the CPI)
18. The model continues to reject other explanations for inflation. A large set of regressions with additional variables is shown in table A2. The variables include two measures of money supply growth (M1 and M2), credit growth, government expenditure growth, growth in a world crude oil price index, growth in a world food price index, and depreciation in the nominal effective exchange rate. Since the Riyal is pegged to the US dollar, depreciation in this variable primarily reflects changes in the USD/Euro exchange rate, with a strengthening of the Euro (an increase in the index) possibly raising the domestic currency price of foreign-sourced goods denominated in Euros. 19. Money and credit growth variables are now statistically significant, unlike the results using annual data, but several other variables remain insignificant. The results reported in Table A2 show that nominal money and credit growth are now statistically significant. In contrast, there is little evidence that real growth in fiscal expenditures, oil price inflation, food price inflation and nominal effective exchange rate depreciation (vis-a-vis the Euro) significantly affected inflation. 20. The explanatory power of the quarterly model using migration, external inflation, and domestic credit growth, is strong. The migration and advanced country inflation variable continues to perform strongly in all regressions. The best-fitting regression includes three variables: migration, advanced-country inflation and credit growth. The figures below show the statistical fit for each of these three variables. They also reveal which quarters are not well-explained by the model. These are 2009Q1, 2007Q2 and 2008Q2 (denoted 2009m3, 2007m6 and 2008m6 in the figures).
Variables Full Sample Full Sample
Migration Rate 0.08 0.18(0.89) (7.24)
(first lag) 0.09(0.93)
Inflation in Advanced Countries 7.68 8.85(5.09) (14.5)
(first lag) 1.51(0.81)
Observations 48 48R-squared 0.90 0.89Robust t-statistics in parentheses*** p<0.01, ** p<0.05, * p<0.1

QATAR
INTERNATIONAL MONETARY FUND 35
Figure 7. Performance of the Quarterly Model
C. Interpretation of the Results 21. The model offers a succinct interpretation of Qatar’s inflation history. Inflation was driven to abnormally high levels during 2004-2006 because of the high rates of inward migration prompted by the surge in capital spending and construction starting around 2004. The sharp drop in inflation in 2009 was lead by a decline in the growth rate of housing prices. House price growth turned negative in early 2009 and migration rates plummeted about the same time. Both events were likely a reaction to the sharp decline in global economic prospects during autumn 2008. As uncertainty around what would happen to global economic conditions after 2009 dissipated (in particular the risk that there would be a global depression with possibly negative rates of inflation), domestic inflationary pressures re-emerged. However, capital accumulation and housing construction had been occurring over time so that supply shortages were much less binding at the end of the decade than they had been at the middle of the decade. Rates of migration have declined and advanced country inflation is also lower. Hence the new equilibrium after 2011 shows lower inflation than during 2004-2006 when supply bottlenecks were more binding. 22. Oil price changes appear to be a fundamental cause of inflation but not a proximate cause of inflation. Variables such as oil prices may indeed be inflationary in an ultimate sense; they just do not operate as the immediate, proximate cause of inflation. The wealth that hired the migrants ultimately came from oil and gas revenue. However given that income can be saved, the spending increases that trigger inflation do not have to coincide quarter by quarter with changes in the oil price.
coef = .13546743, (robust) se = .01593783, t = 8.5
e(
inflc
pi |
X)
e( migr | X )-23.1944 29.0218
-6.24421
5.60291
2003m9
2003m6
2003m12
2010m3
2004m6
2004m3
2010m62010m9
2004m9
2002m12
2009m62003m3
2011m12
2011m92010m12
2012m3
2009m9
2004m12
2011m6
2012m62009m12
2007m9
2005m3
2012m92005m12
2011m3
2009m3
2008m12
2007m6
2005m9
2006m3
2006m9
2007m3
2006m12
2007m12
2006m6
2008m3
2005m62012m12
2008m6
2008m9
2013m3 2014m92014m6
2014m3
2013m122013m6
2013m9
coef = 8.1589511, (robust) se = .57334559, t = 14.23
e( in
flcp
i | X
)
e( acinfl | X )-1.02122 1.01123
-10.0485
8.45724
2009m9
2009m12
2010m3
2009m6
2010m6
2013m3
2012m6
2012m92014m32012m122013m9
2010m9
2013m62012m3
2008m3
2013m12
2010m12
2009m3
2011m12
2008m12
2014m92014m6
2008m6
2007m9
2011m6
2011m3
2011m9
2003m122008m9
2006m12
2003m92003m62007m12
2004m3
2007m6
2003m3
2006m9
2006m3
2007m32005m12
2006m6
2002m12
2005m6
2005m9
2004m6
2005m3
2004m92004m12
coef = .08838995, (robust) se = .019825, t = 4.46
e( in
flcp
i | X
)
e( pcdc | X )-21.4395 27.2271
-6.36881
4.79108
2013m122014m6
2013m92014m9
2013m6
2004m12
2014m32005m6
2004m9
2003m3
2002m12
2011m3
2005m9
2005m3
2004m6
2011m62013m3
2006m6
2004m3
2006m3
2011m92010m12
2012m122006m9
2009m3
2003m12
2003m6
2009m12
2008m9
2005m12
2009m6
2007m3
2009m92006m12
2010m9
2011m12
2012m3
2012m9
2008m6
2012m62010m6
2007m12
2003m9
2007m6
2008m12
2010m3
2008m3
2007m9
time
inflcpi Fitted values
12 60
-10
17.1
Partial plot, inflation and migration, 2003–14 Partial plot, inflation and advanced country inflation, 2003–14
Partial plot, inflation and credit growth, 2003–14 Fit of the Quarterly Model, 2003–14

QATAR
36 INTERNATIONAL MONETARY FUND
23. Credit and money growth trigger inflation only under certain conditions. Large exogenous increases in credit and money that create nominal growth in demand that is faster than growth in aggregate supply will be inflationary. This kind of autonomous credit growth may simply not have happened in the time period under examination. Instead the credit growth we observe in the sample could have financed the migration increase, as some of that spending may have been financed by credit (one can see positive association between migration and credit growth in part of the sample but not all). But this means that the credit growth was endogenous and not causal. Finally, some of the credit growth probably financed purchases of imports (investment goods) and did not fall on non-traded goods and services and hence did not show up as a driver of inflation. 24. Other variables may be inflationary but did not change over the sample period. A third category of variables, notably the nominal effective exchange rate, did not change substantially during the sample period. It may not show up as inflationary simply because it was not altered during the sample. This does not mean that it is unimportant for inflation; it was a lever that was not deployed. 25. Looking forward, inflationary pressures have generally declined, predicting lower inflation, but renewed inflation from land and housing pressures remains a risk. The model suggests that the important sources of inflation in Qatar include inflation overall in the rest of the world rather than inflation in very specific prices such as food or energy, and second, fast population growth driven my high rates of migration, and to a lesser extent domestic credit growth. Lower rates of global inflation and lower rates of migration (compared to the mid-2000s) foretell lower inflation going forward. Nevertheless, migration rates have picked up in recent years and so have real estate prices, suggesting that this is an important area for surveillance. 26. The models findings can be useful in devising a simple inflation early warning exercise for Qatar (Annex II). Besides the usual variables reflecting growth and detailed CPI and PPI components, policymakers should pay enhanced attention to population and migration data, as well as the dynamics of credit and money to discern future inflation trends. At present, the early warning table reveals the contrast between domestic developments, which are largely inflationary given strong population growth, and the global environment, which will tend to reduce Qatar’s inflation given the sharp drop in the international commodity prices and advanced economy inflation.

QATAR
INTERNATIONAL MONETARY FUND 37
Annex I. Descriptive Statistics
Variable Obs Mean Std. Dev. Min Max
Inflation 13 0.048 0.068 -0.100 0.137Migration Rate 13 0.084 0.061 -0.004 0.171Inflation in Advanced Countries 13 0.016 0.005 0.008 0.022Growth in M1 13 0.282 0.206 0.044 0.793Growth in M2 13 0.254 0.173 0.086 0.734
Growth in Credit (public anc private sector combined) 13 0.262 0.174 0.020 0.566Percent Change in Average Crude Oil Price Index (/100) 13 0.180 0.341 -0.536 0.803Growth in Consumption Spending 12 21.945 14.278 6.103 42.708Percent Change in Global Food price Index (/100) 13 0.066 0.140 -0.184 0.283Deviation of GDP Growth from Trend 11 0.000 0.069 -0.096 0.129
Deviation of Non-Oil Non-Gas GDP Growth from Trend 11 0.000 0.101 -0.091 0.257
Table A1. Descriptive Statistics of Data Used in Annual Regressions

Annex II. Heat Map
Jan Feb Mar Apr May Jun Jul Aug Sep Oct Nov Dec Jan Feb Mar Apr May Jun Jul Aug Sep Oct Nov Dec Jan Feb Mar Apr May Jun Jul Aug Sep Oct Nov Dec
Economic ActivityReal GDPNon-oil GDPConstruction GDPPopulation 4.3 4.4 5.6 5.9 5.4 6.0 7.1 8.6 8.4 2.0 7.1 7.5 8.2 8.9 8.3 8.5 9.3 11.3 9.8 10.5 10.3 15.2 12.1 11.4 5.9 10.4 11.6 10.8 10.7 12.3 2.1 11.4 7.5 9.5 9.7 9.3Wages
Consumer and Producer PricesCPI 1.2 1.2 1.2 1.1 1.1 1.6 2.2 2.3 2.6 2.6 2.6 2.6 3.2 3.2 3.6 3.7 3.5 3.4 3.1 2.8 2.7 2.8 2.8 2.5 2.5 2.7 2.6 2.8 3.4 2.8 3.1 3.8 3.6 3.0 3.0 2.9
Rent, Fuel, and Energy -5.9 -6.2 -5.7 -6.2 -5.9 -5.0 -3.9 -3.4 -1.6 0.6 1.9 2.8 4.4 4.8 5.5 6.2 6.5 6.7 6.4 6.7 6.1 6.2 5.6 4.8 4.8 5.8 5.7 6.3 7.0 7.4 7.6 7.9 8.1 8.2 7.6 7.3Food, Beverages and Tobacco 3.1 3.5 3.4 3.8 3.7 3.7 3.7 5.5 5.8 4.1 3.1 1.5 2.9 2.6 2.5 2.3 2.4 2.3 1.9 1.7 0.7 2.6 2.6 3.1 1.6 1.8 1.0 0.6 0.0 -0.6 -0.8 1.2 0.9 -0.6 0.1 -0.4Transport and Communications 2.3 2.5 2.0 1.3 0.9 3.1 3.7 3.1 2.3 1.4 1.7 1.9 2.0 0.9 1.9 2.5 2.7 1.1 0.7 -0.1 0.5 1.7 1.9 1.6 1.7 1.6 1.6 1.2 2.6 1.4 1.8 2.5 2.7 1.7 1.5 1.2Entertainment, Recreation, and Culture 5.0 4.9 5.5 6.3 7.3 6.8 6.1 7.0 5.9 5.8 5.8 5.3 7.5 7.6 8.7 8.2 7.0 8.1 9.3 8.4 9.1 4.5 4.4 5.2 2.8 3.2 2.1 2.7 3.1 1.2 0.8 1.2 0.2 1.0 1.5 0.4
PPI n.a. n.a. 19.5 n.a. n.a. 3.5 n.a. n.a. 0.6 n.a. n.a. 4.2 n.a. n.a. -0.9 n.a. n.a. -3.1 n.a. n.a. 3.3 n.a. n.a. 3.5 1.4 -1.0 -0.4 0.6 3.1 4.1 0.8 -2.8 -7.6 -13.3 -18.3 n.a.Electricity and Water n.a. n.a. 0.5 n.a. n.a. 4.2 n.a. n.a. 4.9 n.a. n.a. 7.2 n.a. n.a. 7.3 n.a. n.a. 5.7 n.a. n.a. 4.5 n.a. n.a. 7.5 4.5 1.8 0.5 0.2 -1.7 -3.3 0.0 -0.8 -3.4 -4.0 -2.9 n.a.Cement and Glass Products n.a. n.a. -1.3 n.a. n.a. -0.6 n.a. n.a. 0.8 n.a. n.a. -0.2 n.a. n.a. 1.9 n.a. n.a. 1.5 n.a. n.a. -0.1 n.a. n.a. 0.3 -0.1 1.6 -0.2 0.3 1.2 1.1 2.4 1.6 1.8 2.6 0.1 n.a.
Real Estate Price Index 17.2 6.6 5.6 7.4 6.5 3.4 5.6 10.6 22.6 28.9 24.4 27.3 12.5 14.8 22.1 20.0 20.0 20.1 20.7 14.8 12.5 16.3 17.5 12.3 29.0 34.7 36.5 42.1 34.8 42.9 34.7
Fiscal SectorTotal Expenditures (rolling annual average)
Banks and Financial MarketsM2 10.8 8.5 12.1 4.6 10.8 5.3 12.1 21.1 18.5 20.2 29.7 22.9 30.8 36.7 37.4 44.3 34.0 38.6 16.0 16.9 20.4 14.6 15.6 19.6 17.7 18.4 15.9 8.9 9.6 4.8 8.8 13.5 8.6 13.3 12.0 10.6Total Domestic Credit Growth 24.3 30.3 31.1 34.9 40.9 35.7 38.0 32.1 31.9 25.4 27.4 26.6 30.6 22.2 24.4 22.3 17.9 15.5 15.2 13.6 13.0 16.5 12.3 11.8 14.1 17.0 14.5 12.3 9.8 11.3 7.1 9.0 12.4 6.1 6.1 10.0Private Credit Growth 21.6 16.4 15.2 13.4 13.5 13.4 15.5 14.3 12.5 13.8 11.5 13.5 14.7 13.7 16.8 17.4 14.9 13.6 13.5 13.8 16.2 14.3 14.0 13.5 15.4 16.2 11.2 14.4 16.2 15.5 13.5 14.6 17.0 16.2 16.9 20.3Credit Growth by Sector:
Real Estate 72.0 49.5 44.7 40.3 34.2 33.9 36.1 28.0 7.0 5.9 7.8 12.3 10.5 7.5 7.7 1.1 -1.6 -3.7 -2.4 1.6 1.2 1.8 -1.0 -0.2 -3.7 -2.2 -1.3 8.6 10.1 7.4 6.4 3.7 7.0 7.5 8.3 11.4Consumption 22.0 19.0 20.9 17.6 25.5 18.6 12.8 -13.7 -10.8 10.1 -1.4 4.5 -1.6 0.7 8.0 2.7 -4.5 0.1 6.0 41.6 43.4 20.4 21.7 12.9 20.4 18.7 7.3 14.2 23.4 17.4 15.6 14.5 14.5 10.4 14.7 23.5Contractors -14.1 24.7 23.3 22.7 9.1 7.9 17.3 14.8 14.2 19.3 12.8 2.0 4.3 7.8 5.5 11.0 20.8 21.7 30.0 25.0 24.4 32.4 41.4 41.0 43.5 47.2 51.8 47.6 47.3 42.3 32.2 33.8 41.0 29.4 30.9 30.2Services -17.9 -12.8 -13.9 -17.0 -15.3 -11.3 7.7 12.3 2.0 10.9 15.8 20.3 48.7 37.6 48.0 94.1 75.9 85.1 51.6 39.8 57.7 35.6 35.5 45.2 45.5 55.6 36.4 15.4 28.9 22.1 19.5 29.2 28.1 22.0 14.7 19.7General Trade 10.5 -13.7 -15.9 -13.1 -13.2 -9.6 -9.7 -0.2 40.3 35.1 35.3 23.8 28.2 23.0 20.6 18.4 21.5 13.2 13.1 10.1 7.4 -0.4 -0.2 8.2 12.4 16.2 18.8 20.1 9.6 15.7 15.5 9.3 21.6 35.2 38.7 33.9
Liquidity in the Banking System (QR billions) 7.7 7.3 8.9 13.3 12.9 11.5 16.0 13.0 14.0 12.5 13.5 13.5 14.1 14.5 10.5 13.6 16.5 9.6 5.2 3.0 11.4 10.2 9.9 6.2 25.5 18.3 18.4 13.9 13.4 14.2 14.4 16.5 15.5 12.4 12.0 11.6Stock Prices -2.0 10.3 4.0 1.8 0.5 -2.8 -1.2 1.6 1.4 -0.6 -2.2 -4.8 1.8 -2.5 -2.4 -0.3 9.8 14.2 17.0 13.4 12.9 15.1 23.5 24.2 27.9 38.0 35.7 46.1 48.2 23.9 32.7 41.4 42.9 37.2 23.0 18.4
Effective Exchange RatesNominal 1.0 0.6 2.5 4.0 5.4 6.8 7.3 7.1 2.8 1.8 2.0 -0.2 -0.2 1.8 2.6 2.5 1.9 0.3 0.8 0.7 2.1 1.2 1.2 1.8 2.0 1.1 -1.0 -1.3 -1.7 -1.2 -1.9 -0.5 1.7 4.2 5.3 6.6Real -0.1 -0.8 1.1 2.6 4.2 6.1 7.2 7.3 3.1 2.1 2.5 0.5 0.8 3.0 4.1 4.4 3.6 1.6 1.7 1.5 3.0 2.1 2.0 2.6 2.8 1.9 -0.1 -0.6 -0.9 -0.2 -0.6 1.1 3.1 5.5 6.6 8.1
ExternalBrent Oil Price 15.3 15.1 9.2 -2.1 -3.4 -16.0 -11.4 3.0 2.3 2.3 -0.7 1.5 1.7 -2.7 -12.6 -14.7 -6.8 7.9 4.4 -2.1 -1.6 -2.2 -1.5 0.9 -4.7 -6.6 -1.7 4.9 6.5 8.5 -0.7 -8.1 -12.8 -20.3 -27.4 -43.8Food (World) -11.0 -11.0 -6.3 -9.3 -9.8 -7.8 1.6 1.5 3.2 7.3 7.4 10.3 10.1 7.1 3.7 3.3 8.7 9.9 -0.4 -5.7 -7.4 -4.9 -5.1 -3.5 -5.4 -3.5 1.3 2.8 -1.3 -5.1 -6.0 -4.8 -6.1 -8.0 -5.8 -8.5Advanced Economies CPI 2.4 2.4 2.2 2.0 1.6 1.5 1.2 1.4 1.6 1.8 1.5 1.5 1.4 1.6 1.2 1.0 1.2 1.5 1.7 1.5 1.3 1.1 1.4 1.5 1.5 1.2 1.5 2.1 2.2 2.2 2.1 1.9 1.8 1.7 1.4 1.0
9.3 13.916.9 6.0 11.3 13.8 4.916.9 16.9 16.9
30.0 20.4 15.5 n.a.-9.5 7.5 18.3 21.4 29.3
n.a.13.4 10.4 11.8 10.821.4 14.5
16.4 8.1 6.5
11.1 13.5
n.a.18.58.1 9.5 9.0 9.5 13.1 13.4 13.0 15.0
n.a.
Q3 Q4
5.38.3 9.27.2
8.9
Q2
6.1 6.54.2 7.4 6.2 5.711.0 11.312.4
6.012.0
2012 2013
6.8 5.9
2014Q3 Q4Q1 Q2Q1 Q2 Q3 Q4 Q1
QATAR
38 IN
TERNATIO
NAL M
ON
ETARY FUN
D

QATAR
INTERNATIONAL MONETARY FUND 39
Annex III. Regression Tables
Table A3. Regression results explaining Annual Inflation in Qatar 2002-2013 (dependent variable is annual percent change in the CPI)
VARIABLES (1) (2) (3) (4) (5) (6) (7) (8) (9)
Migration Rate 0.403** 0.278 0.407** 0.365** 0.414** 0.376** 0.401** 0.307** 0.331*
(3.093) (1.713) (2.674) (2.539) (2.766) (2.487) (2.892) (2.529) (2.355)
Inflation in Advanced Countries 6.961*** 6.218*** 6.874** 6.590*** 6.079** 7.272*** 6.970*** 7.011*** 7.258***
(4.223) (3.631) (3.193) (3.729) (2.383) (3.848) (3.981) (4.598) (4.025)
Dummy for 2009 -0.085*** -0.090*** -0.084*** -0.088*** -0.084*** -0.080** -0.085*** -0.096*** -0.094***
(-4.227) (-4.510) (-3.702) (-4.180) (-3.690) (-3.306) (-3.917) (-5.412) (-4.374)
Growth in Credit (public anc private sector combined) 0.067
(1.233)
Growth in M1 0.002
(0.069)
Growth in M2 0.030
(0.730)
Growth in Consumption Spending 0.000
(0.463)
Percent change in average crude oil price index -0.008
(-0.409)
Percent change in global Food price index -0.003
(-0.084)
Deviation of GDP growth from trend 0.095
(1.307)
Deviation of Non-Oil Non-Gas GDP growth from trend 0.002
(0.024)
-0.089*** -0.084*** -0.089*** -0.088*** -0.083** -0.091*** -0.089*** -0.078*** -0.084**
(-4.310) (-4.098) (-3.973) (-4.094) (-3.050) (-4.115) (-4.044) (-3.926) (-3.328)
Observations 13 13 13 13 12 13 13 11 11
R-squared 0.951 0.959 0.951 0.954 0.952 0.952 0.951 0.975 0.967
t-statistics in parentheses
*** p<0.01, ** p<0.05, * p<0.1
Table A4. Regression results explaining Quarterly Inflation in Qatar 2002-2013 (dependent variable is percent change in the CPI, yoy)
(1) (2) (3) (4) (5) (6) (7) (8)
VARIABLES
Migration Rate 0.176*** 0.178*** 0.150*** 0.135*** 0.194*** 0.173*** 0.175*** 0.176***
(7.245) (8.121) (6.502) (8.500) (7.936) (6.714) (7.183) (6.883)
Inflation in Advanced Countries 8.856*** 7.742*** 8.140*** 8.159*** 8.269*** 8.863*** 8.858*** 8.853***
(14.500) (9.869) (11.464) (14.230) (12.601) (14.505) (14.438) (13.842)
Growth in M1 0.041**
(2.299)
Growth in M2 0.049**
(2.182)
Growth in Credit (public anc private sector combined) 0.088***
(4.459)
Growth in Government Expenditures (2004 prices) 0.021
(0.548)
Percent change in average crude oil price index -6.396
(-0.594)
Percent change in global Food price index -3.558
(-0.166)
Depreciation of the nominal effective exchange rate -0.642
(-0.051)
Constant -13.709*** -13.196*** -13.229*** -13.914*** -13.599*** -13.595*** -13.688*** -13.713***
(-16.529) (-15.122) (-15.090) (-17.326) (-14.412) (-15.099) (-16.107) (-16.681)
Observations 48 48 48 48 45 48 48 48
R-squared 0.892 0.903 0.901 0.921 0.901 0.894 0.892 0.892Robust t-statistics in parentheses
*** p<0.01, ** p<0.05, * p<0.1

QATAR
40 INTERNATIONAL MONETARY FUND
References
Carlos Garriga and Michelle T. Armesto A Stronger Dollar Raises Inflation in the Gulf Federal Reserve Bank of St. Louis, Economic Synopsis, 2008 Kandil, Magda and Hanan Morsey, Determinants of Inflation in GCC, Middle East Development Journal, Vol. 3, No. 2 (2011) 141–158.