imf country report no. 14/329 turkey · turkey staff report for the 2014 article iv consultation...
TRANSCRIPT

© 2014 International Monetary Fund
IMF Country Report No. 14/329
TURKEY 2014 ARTICLE IV CONSULTATION—STAFF REPORT; PRESS RELEASE; AND STATEMENT BY THE EXECUTIVE DIRECTOR FOR TURKEY
Under Article IV of the IMF’s Articles of Agreement, the IMF holds bilateral discussions with members, usually every year. In the context of the 2014 Article IV consultation with Turkey, the following documents have been released and are included in this package: The Staff Report prepared by a staff team of the IMF for the Executive Board’s
consideration on November 21, 2014, following discussions that ended on September 24, 2014, with the officials of Turkey on economic developments and policies. Based on information available at the time of these discussions, the staff report was completed on November 3, 2014.
An Informational Annex prepared by the IMF.
A Press Release summarizing the views of the Executive Board as expressed during its November 21, 2014 consideration of the staff report that concluded the Article IV consultation with Turkey.
A Statement by the Executive Director for Turkey.
The document listed below has been or will be separately released. Selected Issues Paper
The policy of publication of staff reports and other documents allows for the deletion of market-sensitive information.
Copies of this report are available to the public from
International Monetary Fund Publication Services
PO Box 92780 Washington, D.C. 20090 Telephone: (202) 623-7430 Fax: (202) 623-7201
E-mail: [email protected] Web: http://www.imf.org Price: $18.00 per printed copy
International Monetary Fund
Washington, D.C.
December 2014
TURKEY STAFF REPORT FOR THE 2014 ARTICLE IV CONSULTATION
KEY ISSUES Context: Turkey’s economy has grown on average by 6 percent annually since 2010, but this has come at the expense of a persistently large external deficit making the economy sensitive to changes in external financing conditions. Inflation is high and above the authorities’ target, and real policy interest rates remain negative. The exchange rate continues to be stronger than suggested by fundamentals.
Challenges: Policies should focus on rebalancing the economy, reducing the external deficit—by boosting savings rather than decreasing investment—and lowering inflation to preserve competitiveness. Over the medium term, implementation of the ambitious structural reform agenda is critical to raising potential growth. Key policy recommendations: Fiscal policy should be tighter, raising domestic savings by increasing the primary surplus by 2 percent of GDP by 2017. Renewing the focus of monetary policy on the inflation target, by setting and sustaining a positive real policy interest rate.
Expanding the (macro)prudential toolkit to contain risks to financial stability, in particular the banking system’s wholesale external foreign exchange funding. Traction of past Fund advice: The authorities and staff agree that the external imbalance should be reduced, and that this should be done while preserving investment. They also concur that lowering inflation is a key objective. Moreover, to preserve financial stability, the authorities introduced well-targeted macroprudential measures to slow the rise in household leverage and encourage banks to increase core funding. They plan to tackle structural issues through the 10th Development Plan. However, the authorities believe risks are lower than what staff believes and that the economy has enough buffers to withstand reasonable shocks. Thus fiscal and monetary policies would remain more accommodative than recommended by staff.
November 3, 2014
TURKEY
2 INTERNATIONAL MONETARY FUND
Approved By Philip Gerson and Mark Flanagan
Discussions for the 2014 Article IV consultation were held in Ankara and Istanbul during September 11–24, 2014. The mission comprised Messrs. Ramirez Rigo (head), Impavido, Mikkelsen, and Tieman (all EUR), Mr. Flores Curiel (FAD), Ms. Tambunlertchai (SPR), Mr. Seshadri (Senior Resident Representative), and Mr. Çeçen (Senior Economist, Resident Representative Office). Mr. Gerson (EUR) and Mr. Gökçen (OED) joined some of the meetings. The mission met with Deputy Prime Minister for Economic and Financial Affairs Mr. Babacan, Central Bank Governor Mr. Başçı, Acting Undersecretary of Treasury Mr. Dağdaş, other senior public officials, and representatives from the private sector. Ms. Mahadewa and Ms. Chen assisted in the preparation of the staff report.
CONTENTS
CONTEXT: HIGH GROWTH, PERSISTENT IMBALANCES _______________________________________ 4
OUTLOOK: CYCLICAL REBALANCING, MODEST MEDIUM-TERM PROSPECTS ________________ 7
RISKS: CAPITAL FLOWS __________________________________________________________________________ 8
THE POLICY AGENDA: REDUCE IMBALANCES, BOOST SAVINGS ____________________________ 12
A. Fiscal Policy—Reduce Stimulus, Increase Savings _____________________________________________ 12
B. Monetary Policy—Close the Credibility Gap ___________________________________________________ 16
C. Financial Sector and Macroprudential Policies—Preserve Resilience __________________________ 19
D. Structural Policies—Boost Productivity and Raise Private Sector Savings _____________________ 24
STAFF APPRAISAL ______________________________________________________________________________ 25 BOXES 1. Turkey’s External Sector__________________________________________________________________________6 2. The External Imbalance: Buffers and Policy Space _____________________________________________ 10 3. Risk Assessment Matrix ________________________________________________________________________ 11 4. Policy Options to Reduce the External Imbalance _____________________________________________ 13 5. The 2015–17 Medium-Term Program _________________________________________________________ 15 6. The Credibility Gap ____________________________________________________________________________ 17 7. Recent Evolution of Banking Sector Profitability _______________________________________________ 20 8. Containing Wholesale Foreign Exchange Funding in the Banking Sector ______________________ 22
TURKEY
INTERNATIONAL MONETARY FUND 3
FIGURES 1. Recent Developments _________________________________________________________________________ 35 2. Monetary Policy and Financial Markets ________________________________________________________ 36 3. Fiscal Stance ___________________________________________________________________________________ 37 4. Financial Sector ________________________________________________________________________________ 38 5. Households and Corporates ___________________________________________________________________ 39 6. Turkey vs. Peers ________________________________________________________________________________ 40 TABLES 1. Selected Economic Indicators, 2009–15 _______________________________________________________ 28 2. Medium-Term Scenario, 2009–19 _____________________________________________________________ 29 3. Summary of Balance of Payments, 2009–19 ___________________________________________________ 30 4. External Financing Requirements and Sources, 2009–19 ______________________________________ 31 5. Public Sector Finances, 2009–19 _______________________________________________________________ 32 6a.Banking System at a Glance, 2009–14 _________________________________________________________ 33 6b.Banking System at a Glance, 2009–14_________________________________________________________ 34 ANNEXES I. Public Debt Sustainability ______________________________________________________________________ 41 II. External Debt Sustainability ____________________________________________________________________ 49 III. External Stability Report Country Pages _______________________________________________________ 52 IV. Recent Macro-Prudential Measures __________________________________________________________ 54
TURKEY
4 INTERNATIONAL MONETARY FUND
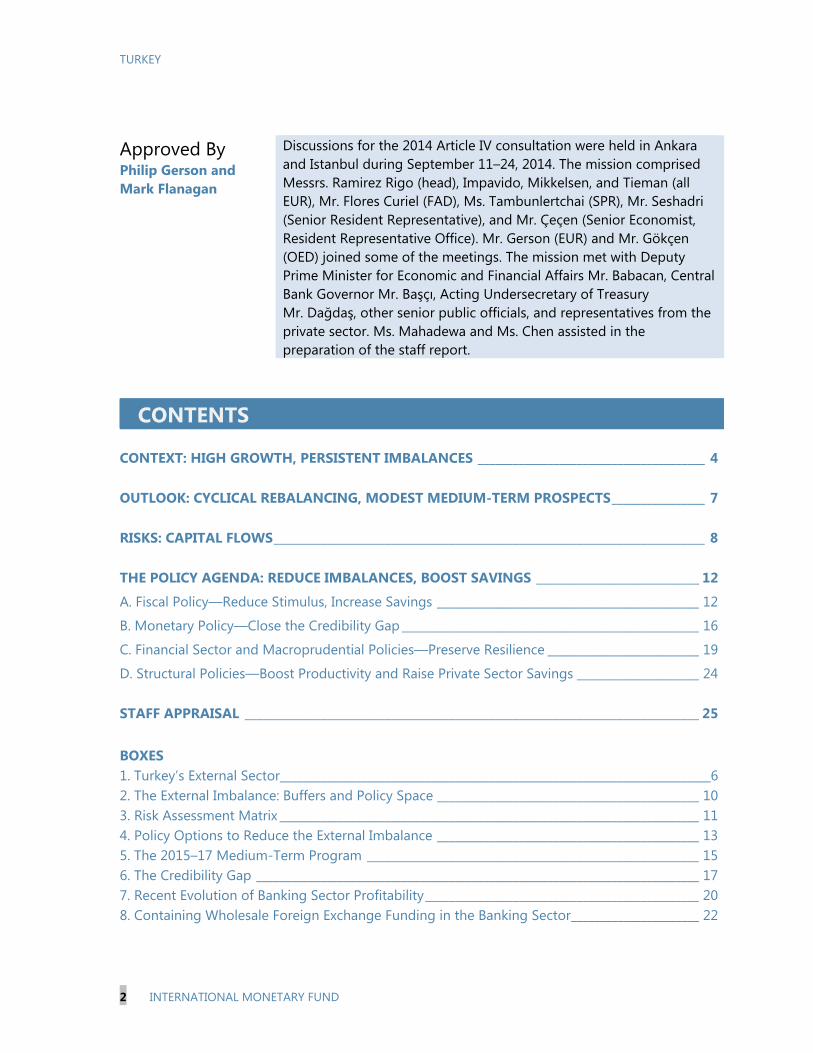
CONTEXT: HIGH GROWTH, PERSISTENT IMBALANCES 1. Strong growth has been accompanied by a persistently large current account deficit and high inflation. Driven mostly by domestic demand growth, Turkey has managed to rebound strongly after the global financial crisis, growing at 9 percent per year on average in 2010–11, but it has since been growing more modestly. The authorities’ policies and large capital inflows have supported domestic demand. However, average inflation has been 7.9 percent with an average current account deficit of 7½ percent of GDP during the period 2010–13. While there was some rebalancing in 2012, this proved short-lived owing to policy loosening. Last year, GDP grew 4.1 percent and the current account deficit widened to 7.9 percent of GDP, financed mostly by short-term debt-creating inflows, while inflation ended the year at 7.4 percent, once again above the 5 percent target.
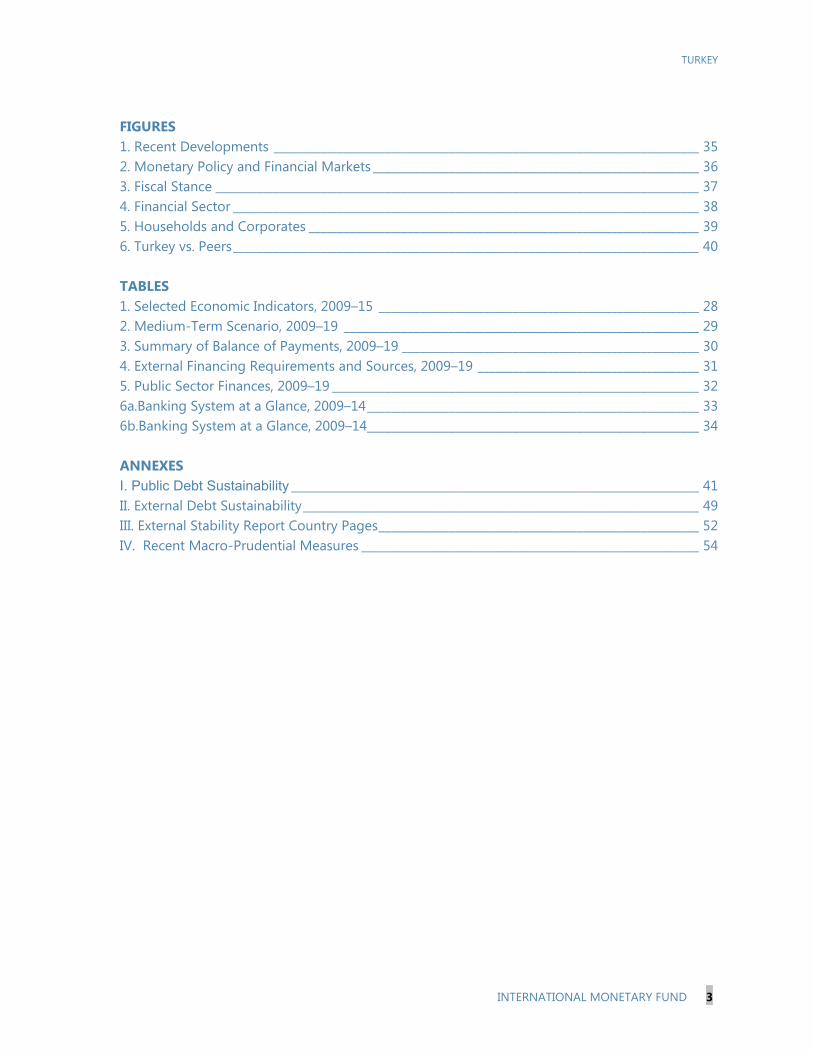
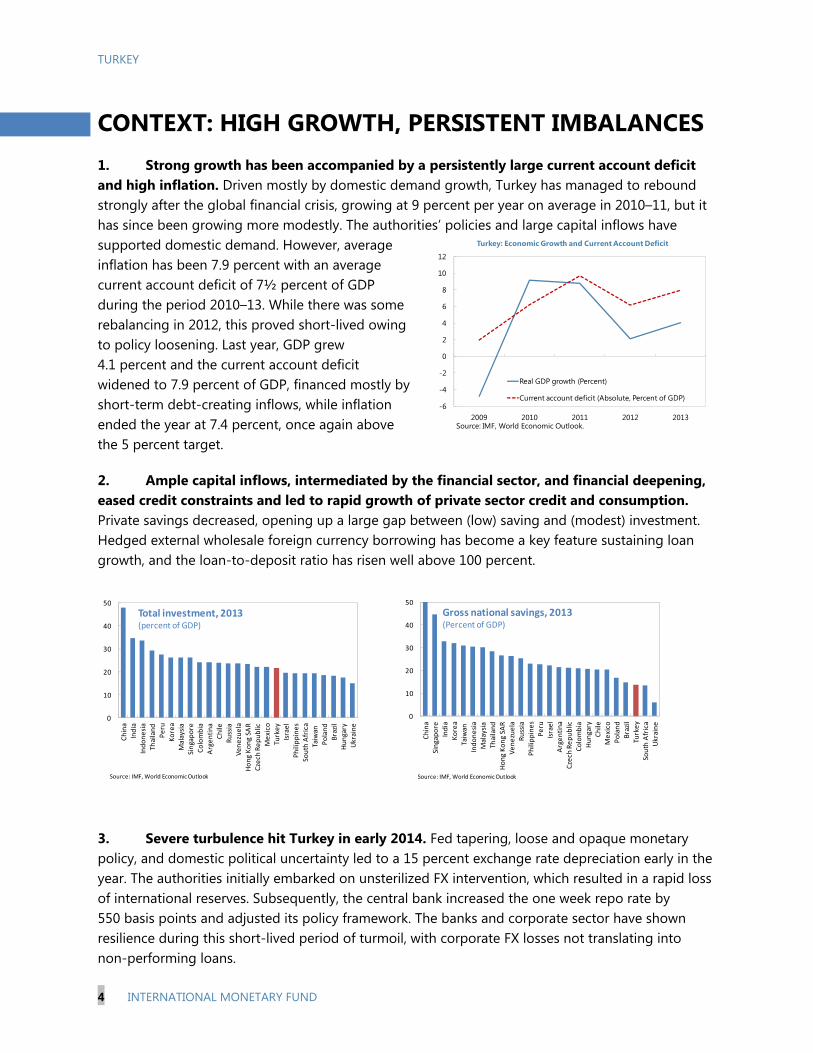
2. Ample capital inflows, intermediated by the financial sector, and financial deepening, eased credit constraints and led to rapid growth of private sector credit and consumption. Private savings decreased, opening up a large gap between (low) saving and (modest) investment. Hedged external wholesale foreign currency borrowing has become a key feature sustaining loan growth, and the loan-to-deposit ratio has risen well above 100 percent.
3. Severe turbulence hit Turkey in early 2014. Fed tapering, loose and opaque monetary policy, and domestic political uncertainty led to a 15 percent exchange rate depreciation early in the year. The authorities initially embarked on unsterilized FX intervention, which resulted in a rapid loss of international reserves. Subsequently, the central bank increased the one week repo rate by 550 basis points and adjusted its policy framework. The banks and corporate sector have shown resilience during this short-lived period of turmoil, with corporate FX losses not translating into non-performing loans.
-6
-4
-2
0
2
4
6
8
10
12
2009 2010 2011 2012 2013
Turkey: Economic Growth and Current Account Deficit
Real GDP growth (Percent)
Current account deficit (Absolute, Percent of GDP)
Source: IMF, World Economic Outlook.
0
10
20
30
40
50
Ch
ina
Ind
iaIn
do
ne
sia
Thai
lan
d
Pe
ru
Ko
rea
Mal
aysi
aSi
nga
po
re
Co
lom
bia
Arg
en
tin
a
Ch
ile
Ru
ssia
Ve
ne
zue
la
Ho
ng
Ko
ng
SAR
Cze
ch R
ep
ub
lic
Me
xico
Turk
ey
Isra
el
Ph
ilip
pin
es
Sou
th A
fric
a
Taiw
an
Po
lan
d
Bra
zil
Hu
nga
ry
Ukr
ain
e
Total investment, 2013(percent of GDP)
Source: IMF, World Economic Outlook
0
10
20
30
40
50
Ch
ina
Sin
gap
ore
Ind
ia
Ko
rea
Taiw
an
Ind
on
esi
aM
alay
sia
Thai
lan
d
Ho
ng
Ko
ng
SAR
Ve
ne
zue
laR
uss
ia
Ph
ilip
pin
es
Pe
ru
Isra
el
Arg
en
tin
a
Cze
ch R
ep
ub
lic
Co
lom
bia
Hu
nga
ry
Ch
ileM
exi
co
Po
lan
d
Bra
zil
Turk
ey
Sou
th A
fric
a
Ukr
ain
e
Gross national savings, 2013(Percent of GDP)
Source: IMF, World Economic Outlook
TURKEY
INTERNATIONAL MONETARY FUND 5
4. Reducing inflation and the external deficit is essential to contain the risk that shocks could force an abrupt adjustment in the future. Inflation remains too high, and staff projects that the current account deficit will remain between 5½–6 percent of GDP on current policies. Reflecting in part the large share of short-term external debt, gross external financing requirements will exceed a quarter of GDP per year (Annex II). The net foreign asset position, which has already deteriorated by about 25 percentage points of GDP since 2008, will also weaken further. The current account deficit remains 2½–5 percent of GDP higher than warranted by fundamentals and optimal policy settings. Thus, the estimated real effective exchange rate misalignment is 10–20 percent (Annex III and Box 1). These trends are not sustainable, and if they are not redressed, Turkey could sooner or later suffer a sharp adjustment.
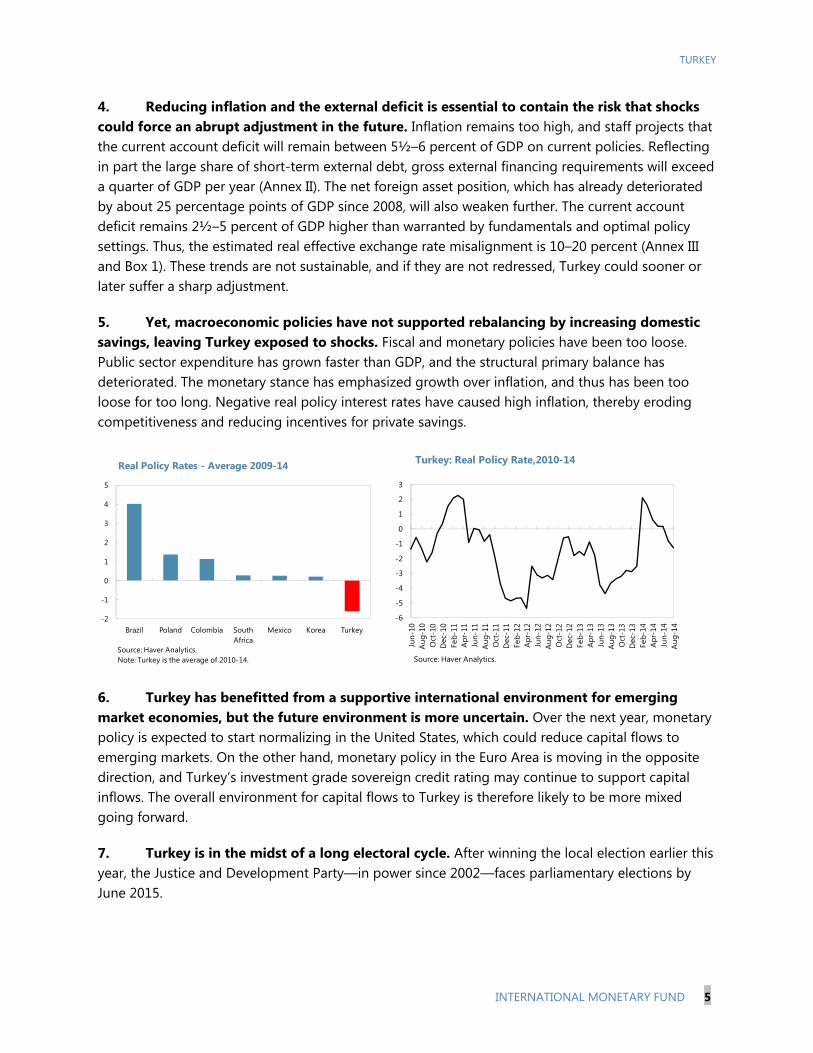
5. Yet, macroeconomic policies have not supported rebalancing by increasing domestic savings, leaving Turkey exposed to shocks. Fiscal and monetary policies have been too loose. Public sector expenditure has grown faster than GDP, and the structural primary balance has deteriorated. The monetary stance has emphasized growth over inflation, and thus has been too loose for too long. Negative real policy interest rates have caused high inflation, thereby eroding competitiveness and reducing incentives for private savings.
6. Turkey has benefitted from a supportive international environment for emerging market economies, but the future environment is more uncertain. Over the next year, monetary policy is expected to start normalizing in the United States, which could reduce capital flows to emerging markets. On the other hand, monetary policy in the Euro Area is moving in the opposite direction, and Turkey’s investment grade sovereign credit rating may continue to support capital inflows. The overall environment for capital flows to Turkey is therefore likely to be more mixed going forward.
7. Turkey is in the midst of a long electoral cycle. After winning the local election earlier this year, the Justice and Development Party—in power since 2002—faces parliamentary elections by June 2015.
-2
-1
0
1
2
3
4
5
Brazil Poland Colombia South Africa
Mexico Korea Turkey
Real Policy Rates - Average 2009-14
Source: Haver Analytics.Note: Turkey is the average of 2010-14.
-6
-5
-4
-3
-2
-1
0
1
2
3
Jun-
10A
ug-1
0O
ct-1
0D
ec-1
0Fe
b-11
Apr
-11
Jun-
11A
ug-1
1O
ct-1
1D
ec-1
1Fe
b-12
Apr
-12
Jun-
12A
ug-1
2O
ct-1
2D
ec-1
2Fe
b-13
Apr
-13
Jun-
13A
ug-1
3O
ct-1
3D
ec-1
3Fe
b-14
Apr
-14
Jun-
14A
u g-1
4
Turkey: Real Policy Rate,2010-14
Source: Haver Analytics.
TURKEY
6 INTERNATIONAL MONETARY FUND
Box 1. Turkey’s External Sector In 2013, Turkey’s current account deficit worsened to 7.9 percent of GDP driven by strong private domestic demand and re-stocking of gold. Over the past 5 years, the current account deficit has averaged 6.4 percent of GDP, with large fluctuations in the recent years. Weaker domestic demand conditions and decreased gold imports in 2014 point to another episode of external rebalancing. The deficit is expected to narrow to 5.8 percent of GDP by year-end.
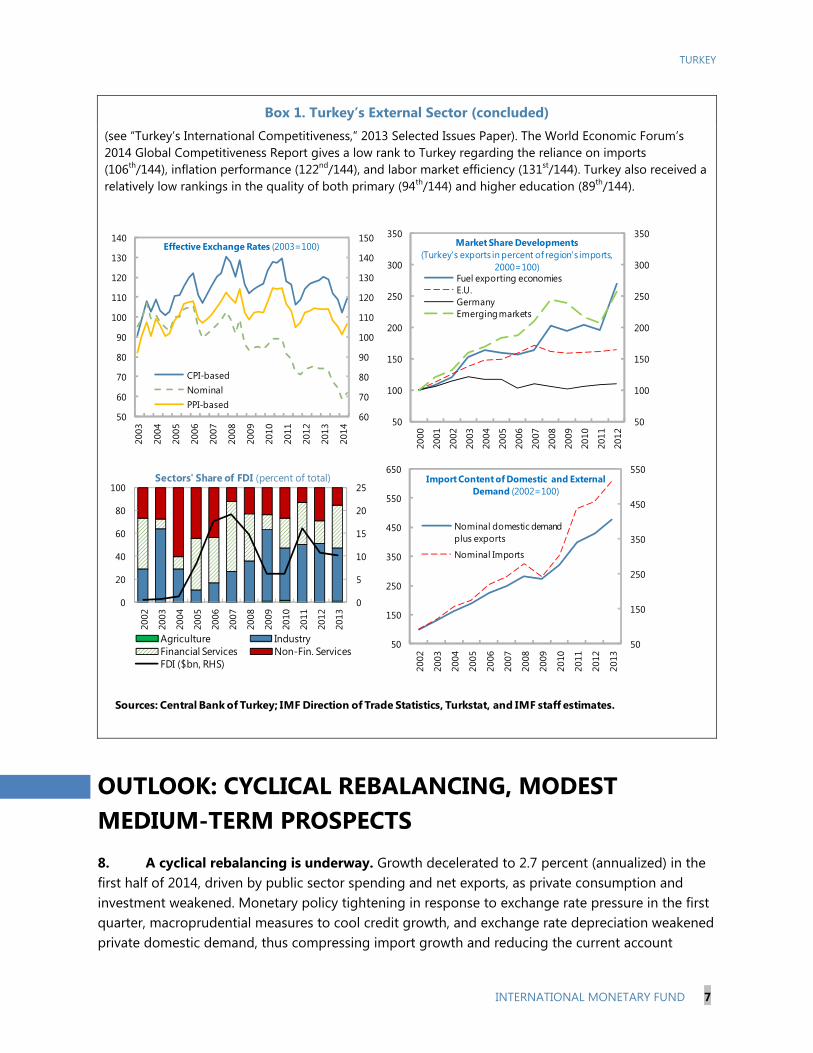
Exports to the MENA region moderated. The share of export to the region fell from 32.2 percent of total in 2012 to 27.9 percent in 2013, partly due to diminished gold re-exporting activities. Iraq remains the most important export market in the region, and the second largest export destination for Turkey (after Germany), accounting for 8 percent of total exports. Conflicts in several MENA countries in 2014 are expected to negatively impact Turkey’s trade with the region. And although there are signs that exports to traditional European partners are beginning to pick up, the recovery is expected to be slow due to the region’s subdued economic recovery.
Real effective exchange rates (REERs) depreciated in the second half of 2013. CPI- and PPI-based REERs fell by 10 and 9 percent, respectively, compared to end-2012. The REERs continued to depreciate in the first quarter of 2014, but due to high inflation and currency appreciation, have since re-appreciated to levels seen in the 3rd quarter of 2013.
In staff’s view, the overvaluation of the REER is in the 10–20 percent range—consistent with a current account gap of 2½–5 percent of GDP (Annex III). This gap reflects staff’s view that the current account norm for a fast-growing emerging market economy such as Turkey is likely to be higher than the model-estimated -0.9 percent of GDP. At the same time, the gap is larger than in last year’s assessment due to the current account deterioration in 2013. In 2014, slowing domestic demand has lowered the current account deficit, and hence the current account gap. However, as the real effective exchange rate has depreciated just 5 percent compared to the average in 2013, staff continues to see the exchange rate overvaluation in the 10–20 percent range.
The REER overvaluation contributes to Turkey’s external competitiveness gap. The positive inflation differentials with trading partners and trade competitors continue to weigh on Turkey’s competitiveness. The recent bout of nominal exchange rate depreciation has helped contain the REER overvaluation, but not enough to outweigh price increases and deliver a sustained competitiveness gain. While the nominal exchange rate has fallen by 13 percent since end-2011, the current CPI- and PPI-based REERs are at about the same levels as at end-2011.
Low FDI provides another view on Turkey’s competitiveness challenge. In 2013, Turkey saw a total FDI inflow of 1.6 percent of GDP, below the average of 2.5 percent of GDP for its G-20 emerging-market peers. The share of FDI in the tradable sector, which had been gaining grounds in previous years, receded back to 47 percent of total, on account of greater FDI into financial services. The low FDI into Turkey may partly reflect the trend decline in FDI flows into most emerging markets since 2009. At the same time, Turkey’s high inflation, volatile growth, and structural bottlenecks likely play key roles in impeding FDI
TURKEY
INTERNATIONAL MONETARY FUND 7
Box 1. Turkey’s External Sector (concluded) (see “Turkey’s International Competitiveness,” 2013 Selected Issues Paper). The World Economic Forum’s 2014 Global Competitiveness Report gives a low rank to Turkey regarding the reliance on imports (106th/144), inflation performance (122nd/144), and labor market efficiency (131st/144). Turkey also received a relatively low rankings in the quality of both primary (94th/144) and higher education (89th/144).
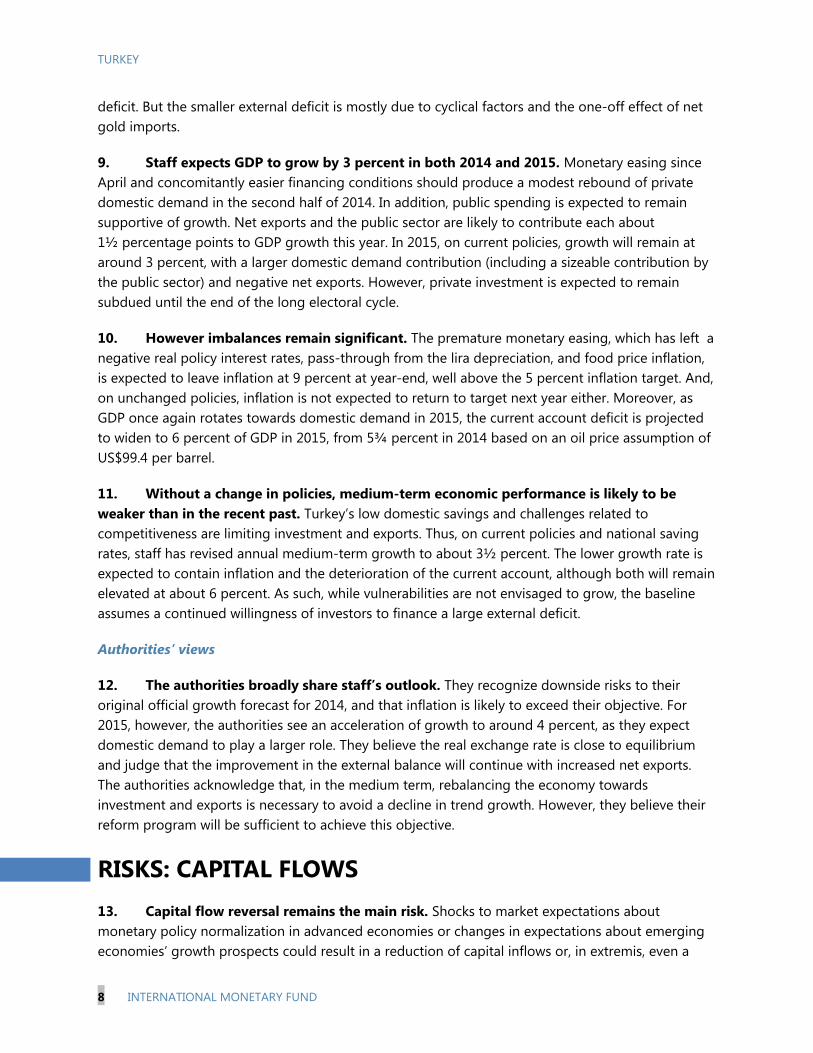
OUTLOOK: CYCLICAL REBALANCING, MODEST MEDIUM-TERM PROSPECTS 8. A cyclical rebalancing is underway. Growth decelerated to 2.7 percent (annualized) in the first half of 2014, driven by public sector spending and net exports, as private consumption and investment weakened. Monetary policy tightening in response to exchange rate pressure in the first quarter, macroprudential measures to cool credit growth, and exchange rate depreciation weakened private domestic demand, thus compressing import growth and reducing the current account
50
100
150
200
250
300
350
50
100
150
200
250
300
350
2000
2001
2002
2003
2004
2005
2006
2007
2008
2009
2010
2011
2012
Market Share Developments(Turkey's exports in percent of region's imports,
2000=100)Fuel exporting economiesE.U.GermanyEmerging markets
50
150
250
350
450
550
50
150
250
350
450
550
650
2002
2003
2004
2005
2006
2007
2008
2009
2010
2011
2012
2013
Import Content of Domestic and External Demand (2002=100)
Nominal domestic demand plus exports
Nominal Imports
60
70
80
90
100
110
120
130
140
150
50
60
70
80
90
100
110
120
130
140
2003
2004
2005
2006
2007
2008
2009
2010
2011
2012
2013
2014
Effective Exchange Rates (2003=100)
CPI-basedNominalPPI-based
0
5
10
15
20
25
0
20
40
60
80
100
2002
2003
2004
2005
2006
2007
2008
2009
2010
2011
2012
2013
Sectors' Share of FDI (percent of total)
Agriculture IndustryFinancial Services Non-Fin. ServicesFDI ($bn, RHS)
Sources: Central Bank of Turkey; IMF Direction of Trade Statistics, Turkstat, and IMF staff estimates.
TURKEY
8 INTERNATIONAL MONETARY FUND
deficit. But the smaller external deficit is mostly due to cyclical factors and the one-off effect of net gold imports.
9. Staff expects GDP to grow by 3 percent in both 2014 and 2015. Monetary easing since April and concomitantly easier financing conditions should produce a modest rebound of private domestic demand in the second half of 2014. In addition, public spending is expected to remain supportive of growth. Net exports and the public sector are likely to contribute each about 1½ percentage points to GDP growth this year. In 2015, on current policies, growth will remain at around 3 percent, with a larger domestic demand contribution (including a sizeable contribution by the public sector) and negative net exports. However, private investment is expected to remain subdued until the end of the long electoral cycle.
10. However imbalances remain significant. The premature monetary easing, which has left a negative real policy interest rates, pass-through from the lira depreciation, and food price inflation, is expected to leave inflation at 9 percent at year-end, well above the 5 percent inflation target. And, on unchanged policies, inflation is not expected to return to target next year either. Moreover, as GDP once again rotates towards domestic demand in 2015, the current account deficit is projected to widen to 6 percent of GDP in 2015, from 5¾ percent in 2014 based on an oil price assumption of US$99.4 per barrel.
11. Without a change in policies, medium-term economic performance is likely to be weaker than in the recent past. Turkey’s low domestic savings and challenges related to competitiveness are limiting investment and exports. Thus, on current policies and national saving rates, staff has revised annual medium-term growth to about 3½ percent. The lower growth rate is expected to contain inflation and the deterioration of the current account, although both will remain elevated at about 6 percent. As such, while vulnerabilities are not envisaged to grow, the baseline assumes a continued willingness of investors to finance a large external deficit.
Authorities’ views
12. The authorities broadly share staff’s outlook. They recognize downside risks to their original official growth forecast for 2014, and that inflation is likely to exceed their objective. For 2015, however, the authorities see an acceleration of growth to around 4 percent, as they expect domestic demand to play a larger role. They believe the real exchange rate is close to equilibrium and judge that the improvement in the external balance will continue with increased net exports. The authorities acknowledge that, in the medium term, rebalancing the economy towards investment and exports is necessary to avoid a decline in trend growth. However, they believe their reform program will be sufficient to achieve this objective.
RISKS: CAPITAL FLOWS 13. Capital flow reversal remains the main risk. Shocks to market expectations about monetary policy normalization in advanced economies or changes in expectations about emerging economies’ growth prospects could result in a reduction of capital inflows or, in extremis, even a
TURKEY
INTERNATIONAL MONETARY FUND 9
sudden stop. A sharp decrease in inflows would result in a large compression of absorption to close the external deficit and lead to a recession. As imbalances remain large, and the buffers present in the economy are diminishing, the impact could be more pronounced than the 2009 recession (Box 2). In this environment, loose macroeconomic policies to maintain fast growth—which will slow the reduction of the external imbalance and lower credibility—increase risks. And even if the recent gradual adjustment of the external imbalance were to continue, a meaningful reduction in the large external financing needs will take several years, during which vulnerability to volatility in capital flows will remain significant.
14. Other risks center on slower European growth, geopolitical issues, and the strength of the policy framework (Box 3). Lower than anticipated growth in Europe would hurt demand in Turkey’s main export market. The economic spillovers to Turkey from conflicts in Syria and Iraq have negatively impacted exports. The effects of tensions between Ukraine and Russia have thus far been limited, but if they were to lead to generalized risk aversion in financial markets, the impact could become significant. A sharp increase in oil prices would have an immediate pronounced effect on Turkey’s import bill, further widening the external gap.
Authorities’ views
15. The authorities agree with staff on the risks, but see them as less likely to materialize and believe buffers are sufficient. In their view, gradual monetary policy normalization in advanced economies is accurately priced in by markets, and any abrupt volatility along the way is likely to be temporary. They point to the sharp 2009 recession and the economic turbulence at the beginning of 2014 to illustrate that the Turkish economy is flexible and has sufficient buffers to cope. The authorities assess the corporate and banking sectors balance sheets as robust. These strengths, combined with a strong public sector position and flexible exchange rate, would in their view allow for an adequate macroeconomic policy response and prevent systemic distress. While slower European growth is a concern, the authorities point out that exports to Europe grew in the first half of 2014, a period when European growth was low too. And even though exports to Iraq have decreased sharply, the authorities expect a rebound in the remainder of the year. Finally, they believe investor sentiment remains favorable towards Turkey, and that the recently announced monetary easing in the Euro Area will be supportive of flows to emerging markets.

TURKEY
10 INTERNATIONAL MONETARY FUND
Box 2. The External Imbalance: Buffers and Policy Space
The external deficit is expected to remain elevated throughout the forecast horizon. This box discusses the evolution of balance sheets, buffers and policy space since 2008.
Balance sheets are more stretched…
From 2008 to 2013, current account deficits have weakened the net international investment position. Banks rely more on external funding, which amounted to 18 percent of GDP by the end of 2013 compared to 5½ percent five years earlier. This has not been accompanied by a similar increase in external assets but instead by an increase in domestic credit to the private sector. Banks’ FX exposure has not increased because on-balance sheet open positions are hedged off-balance sheet and because much of the domestic corporate sector credit expansion has been in FX. Non-financial corporates’ FX borrowing from banks increased to 18 percent of GDP in 2013 from around 5 percent in 2008 with a corresponding increase in non-financial corporates’ net open FX position. Households continue to hold more FX assets than liabilities as FX lending to household is prohibited.
…buffers remain but are smaller…
Banks, corporates, and households have become more leveraged. Corporates have less equity to absorb potential losses from currency depreciation, to which they are increasingly exposed. Banks’ direct FX exposure is limited but indirect exposure has risen through credit risk from their FX lending to non-financial corporates. At the same time, their capital buffers have declined since 2008, although they remain well-above the regulatory minimum. Household leverage has increased to over 50 percent of disposable income, due to high consumer credit growth.
…and policy space is more limited than in 2008.
While gross international reserves have increased from 2008 to 2013, this is due to banks’ FX reserves. Net FX reserves (those directly available for intervention) have declined. Also, with a negative real policy rate there is no monetary policy space compared to 2008 when the real rate was around 6½ percent. However, even though the structural fiscal position has deteriorated, there is fiscal space as government debt is low at around 36 percent of GDP, an improvement since 2008.
Vulnerability indicators
Buffers
Policy Space
Note: Orange (green) indicates increased (reduced) vulnerability.
2008 2013
-60-40-200
NIIP (% of GDP)
2008 2013
0 5 10 15
Banks' external liabilites (% of GDP)
2008 2013
0 50 100
Loans/Deposits Ratio
2008 2013
0 5 10 15
NFC FX liabilities from banks (% of GDP)
2008 2013
0 5 10 15 20
NFC net open FX position (% of GDP)
2008 2013
0 2 4 6 8 10
Households' net FX asset positions (% of GDP)
20082013
0 5 10 15
Banks' Capital Adequacy Ratio (% of RWAs)
20082013
0 10 20 30 40
Banks' Liquid Assets (% of total assets)
20082013
0 20 40
Corporate Equity (% of total assets)
2008 2013
0 20 40 60
HH Leverage (% of disp. income)
20082008
GrossNet
20132013
0 20 40 60
CBRT reserves (% of ST debt)
20082013
0 2 4 6
Real Effective Policy Rate (difference from US)
20082013
0 10 20 30 40
Government Debt (% of GDP)
TURKEY
INTERNATIONAL MONETARY FUND 11
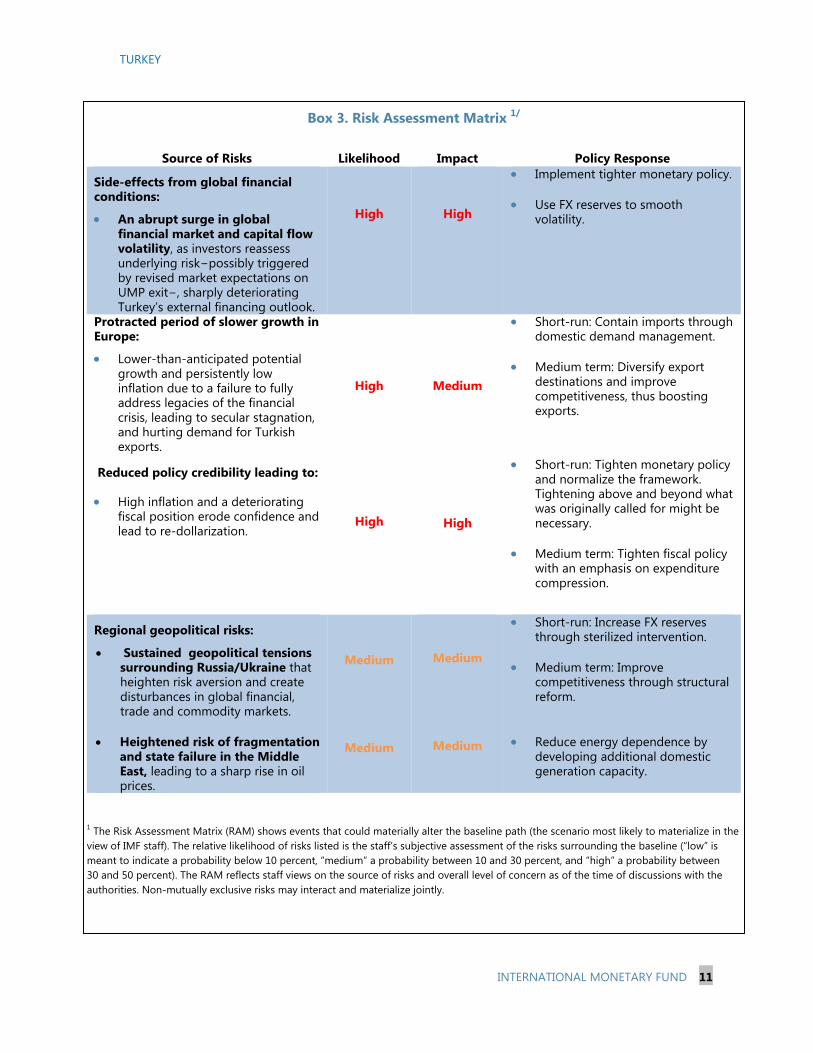
Box 3. Risk Assessment Matrix 1/
Source of Risks Likelihood Impact Policy Response
Side-effects from global financial conditions:
An abrupt surge in global financial market and capital flow volatility, as investors reassess underlying risk−possibly triggered by revised market expectations on UMP exit−, sharply deteriorating Turkey’s external financing outlook.
High
High
Implement tighter monetary policy.
Use FX reserves to smooth volatility.
Protracted period of slower growth in Europe:
Lower-than-anticipated potential growth and persistently low inflation due to a failure to fully address legacies of the financial crisis, leading to secular stagnation, and hurting demand for Turkish exports.
High Medium
Short-run: Contain imports through domestic demand management.
Medium term: Diversify export destinations and improve competitiveness, thus boosting exports.
Reduced policy credibility leading to:
High inflation and a deteriorating fiscal position erode confidence and lead to re-dollarization.
High
High
Short-run: Tighten monetary policy and normalize the framework. Tightening above and beyond what was originally called for might be necessary.
Medium term: Tighten fiscal policy with an emphasis on expenditure compression.
Regional geopolitical risks:
Sustained geopolitical tensions surrounding Russia/Ukraine that heighten risk aversion and create disturbances in global financial, trade and commodity markets.
Heightened risk of fragmentation and state failure in the Middle East, leading to a sharp rise in oil prices.
Medium
Medium
Medium
Medium
Short-run: Increase FX reserves through sterilized intervention.
Medium term: Improve competitiveness through structural reform.
Reduce energy dependence by
developing additional domestic generation capacity.
1 The Risk Assessment Matrix (RAM) shows events that could materially alter the baseline path (the scenario most likely to materialize in the view of IMF staff). The relative likelihood of risks listed is the staff’s subjective assessment of the risks surrounding the baseline (“low” is meant to indicate a probability below 10 percent, “medium” a probability between 10 and 30 percent, and “high” a probability between 30 and 50 percent). The RAM reflects staff views on the source of risks and overall level of concern as of the time of discussions with the authorities. Non-mutually exclusive risks may interact and materialize jointly.
TURKEY
12 INTERNATIONAL MONETARY FUND
THE POLICY AGENDA: REDUCE IMBALANCES, BOOST SAVINGS The macroeconomic policy mix should focus on bringing down the external imbalance and lowering inflation to reduce vulnerabilities and preserve competitiveness. The preferred adjustment is through higher domestic savings to preserve investment (Box 4). Current macroeconomic policies do not support such adjustment. Staff hence advises tighter fiscal and monetary policies in the near term to achieve higher domestic savings and lower inflation, while using macroprudential policies to preserve financial sector resilience. To the extent that fiscal policy is tighter, the burden on monetary policy would be reduced. The current international environment provides a potentially brief window of opportunity for such adjustment, which should therefore not be delayed.
A. Fiscal Policy—Reduce Stimulus, Increase Savings
16. In 2014, the budget primary surplus target is likely to be missed. Although, due to high inflation, growth of central government revenues is in line with the budget forecast despite weaker domestic demand, expenditures have been allowed to grow above the budget ceilings. Total primary revenues have increased by 10 percent y-o-y through August and are projected to increase by 9 percent in 2014, exceeding the budget forecast by about 0.2 percent of GDP, largely due high inflation and one-offs. 1 Central government primary spending has grown by 13½ percent y-o-y through August, compared with a budget target of 7.4 percent for the year, which will lead to an overrun in primary expenditure of about 1 percent of GDP. On a net basis, the central government primary balance is therefore likely to miss the budget target by about 0.2 percent of GDP. In the broader non-financial public sector, the deviation from the authorities’ plan is expected to be somewhat higher as a result of a weaker than planned performance of state-owned enterprises (SOEs) due to delayed adjustments in regulated energy prices, enacted in October.
17. The structural deficit remains large, although debt sustainability is not a concern (Annex I). Despite relatively strong headline fiscal indicators, the structural deficit remains large at about 3 percent of GDP this year. Non-discretionary central government primary spending remains about two-thirds of total expenditure. Between 2006 and 2013, central government primary spending has grown by 5.4 percentage points of GDP, more than the 3 percentage point of GDP decline in interest spending. Over this period, buoyant revenues—mainly taxes on consumption and imports—have kept the budget balance from deteriorating. However, this masks a widening structural deficit2, as consumption and imports, which are relatively revenue-rich, will have to decline when the economy rebalances towards exports and investment. This could limit fiscal policy space in a downturn, even with debt below 36 percent of GDP.
1 Privatization revenues are below the line and not accounted in the fiscal balances quoted above. However, in Turkey the law allows for excess privatization revenues to be spent freely and hence they are financing sources for additional spending. 2 The structural deficit calculation is based on an absorption gap approach.

TURKEY
INTERNATIONAL MONETARY FUND 13
Box 4. Policy Options to Reduce the External Imbalance
Turkey’s large current account deficit is the result of low national savings of around 14 percent of GDP, some 6 percentage points below investment. Using the IMF’s Global Integrated Monetary and Fiscal Model (GIMF) this box analyzes different approaches to reducing the external imbalance. It concludes that a combination of increased private and public savings would yield the best results. This contrasts with recent developments, where investment has been curtailed by one-off monetary policy tightening and a higher country risk premium.
Four approaches are analyzed. These are i) a 2 percent of GDP permanent increase in private savings (e.g., through setting up a second pillar pension system or prefunding severance payments); ii) a 2 percent of GDP permanent increase in public savings (through lower transfers, lower public consumption, and increased VAT); iii) a 2 percentage point increase in the monetary policy rate for one year; and iv) an increase in the country risk premium (an initial 4 percent increase that gradually falls to ½ percent), which might follow from a protracted failure to adjust policies.
Relative to the baseline, GDP falls in the first year of the adjustment in all four scenarios. Tighter monetary policy has the largest immediate negative impact on GDP of about 2½ percent. A higher country risk premium has a persistent negative impact on GDP (of about 2 percent) as it permanently reduces investment. Higher private or public savings have limited negative impacts with increased private savings increasing GDP in the long run.
Tighter monetary policy and a higher country risk premium affect private investment negatively. The increased country risk premium leads to 10 percent lower investment for three years after which it settles at a 4 percent lower level in the longer run. Tighter monetary policy reduces investment temporarily by about 4 percent. Increased private and public savings affect investment only moderately with a slight positive effect from increased private savings.
Tighter monetary policy has limited effects on the current account. Monetary policy tightening has a positive impact on the current account through import contraction as private domestic demand slows. However, it will also have negative effects as the higher interest rate leads to exchange rate appreciation. The net effect is a limited (less than ½ percent of GDP) and short lived improvement in the current account.
Increased private or public savings reduce the external imbalance. Policies to increase public and private savings improve the current account by 1 percent of GDP in the short run and 1½-2 percent of GDP in the longer run, entirely through higher national savings. A higher country risk premium also leads to an immediate current account improvement of 2 percent of GDP due to a sharp (5 percent) temporary depreciation. However, this is driven by lower private investment with negative growth consequences both in the short and long run.
-12
-8
-4
0
4
2013 2014 2015 2016 2017 2018 2019 2020 2021 2022 2023 2024 2025
Higher private savingsHigher public savingsMontary tighteningHigher country risk premium
Private investment(Percent deviation from baseline)
-5.0
-2.5
0.0
2.5
2013 2014 2015 2016 2017 2018 2019 2020 2021 2022 2023 2024 2025
Higher private savingsHigher public savingsMontary tighteningHigher country risk premium
GDP(Percent deviation from baseline)
-5.0
-2.5
0.0
2.5
5.0
2013 2014 2015 2016 2017 2018 2019 2020 2021 2022 2023 2024 2025
Higher private savingsHigher public savingsMontary tighteningHigher country risk premium
REER depreciation(Percent deviation from baseline)
-2
-1
0
1
2
3
2013 2014 2015 2016 2017 2018 2019 2020 2021 2022 2023 2024 2025
Higher private savingsHigher public savingsMontary tighteningHigher country risk premium
Current accout(Percent of GDP; deviation from baseline)
TURKEY
14 INTERNATIONAL MONETARY FUND
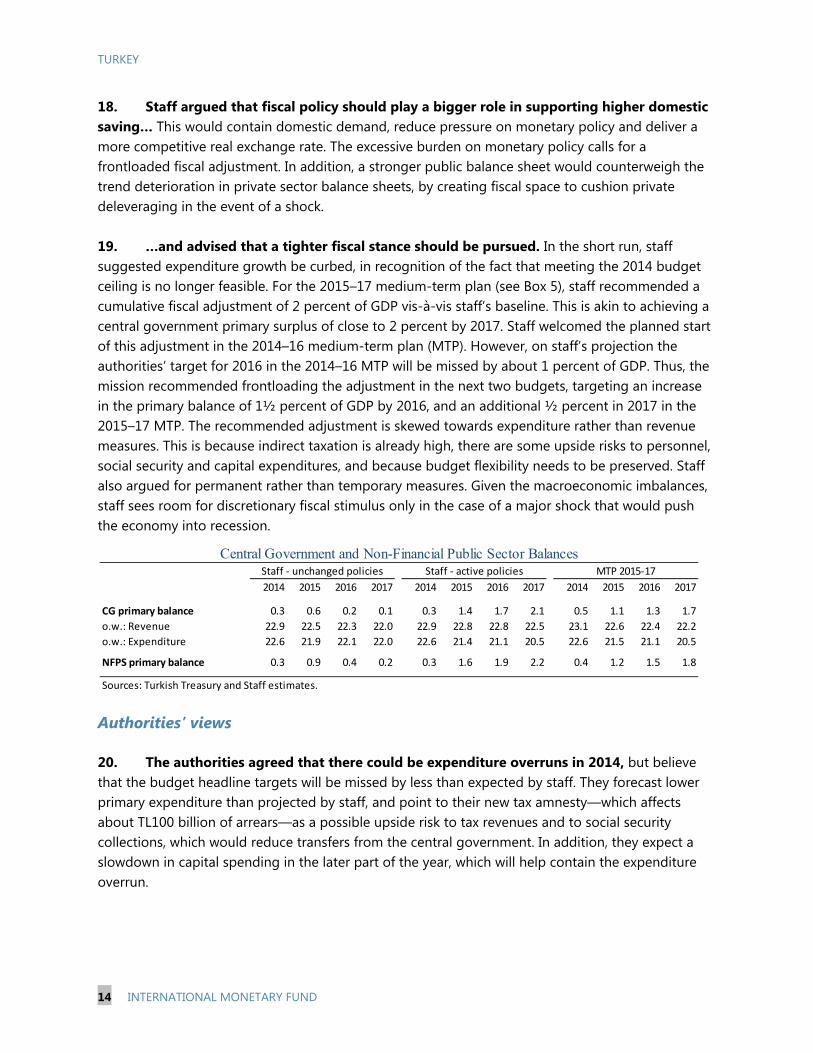
18. Staff argued that fiscal policy should play a bigger role in supporting higher domestic saving… This would contain domestic demand, reduce pressure on monetary policy and deliver a more competitive real exchange rate. The excessive burden on monetary policy calls for a frontloaded fiscal adjustment. In addition, a stronger public balance sheet would counterweigh the trend deterioration in private sector balance sheets, by creating fiscal space to cushion private deleveraging in the event of a shock. 19. …and advised that a tighter fiscal stance should be pursued. In the short run, staff suggested expenditure growth be curbed, in recognition of the fact that meeting the 2014 budget ceiling is no longer feasible. For the 2015–17 medium-term plan (see Box 5), staff recommended a cumulative fiscal adjustment of 2 percent of GDP vis-à-vis staff’s baseline. This is akin to achieving a central government primary surplus of close to 2 percent by 2017. Staff welcomed the planned start of this adjustment in the 2014–16 medium-term plan (MTP). However, on staff’s projection the authorities’ target for 2016 in the 2014–16 MTP will be missed by about 1 percent of GDP. Thus, the mission recommended frontloading the adjustment in the next two budgets, targeting an increase in the primary balance of 1½ percent of GDP by 2016, and an additional ½ percent in 2017 in the 2015–17 MTP. The recommended adjustment is skewed towards expenditure rather than revenue measures. This is because indirect taxation is already high, there are some upside risks to personnel, social security and capital expenditures, and because budget flexibility needs to be preserved. Staff also argued for permanent rather than temporary measures. Given the macroeconomic imbalances, staff sees room for discretionary fiscal stimulus only in the case of a major shock that would push the economy into recession.
Authorities’ views
20. The authorities agreed that there could be expenditure overruns in 2014, but believe that the budget headline targets will be missed by less than expected by staff. They forecast lower primary expenditure than projected by staff, and point to their new tax amnesty—which affects about TL100 billion of arrears—as a possible upside risk to tax revenues and to social security collections, which would reduce transfers from the central government. In addition, they expect a slowdown in capital spending in the later part of the year, which will help contain the expenditure overrun.
2014 2015 2016 2017 2014 2015 2016 2017 2014 2015 2016 2017
CG primary balance 0.3 0.6 0.2 0.1 0.3 1.4 1.7 2.1 0.5 1.1 1.3 1.7
o.w.: Revenue 22.9 22.5 22.3 22.0 22.9 22.8 22.8 22.5 23.1 22.6 22.4 22.2
o.w.: Expenditure 22.6 21.9 22.1 22.0 22.6 21.4 21.1 20.5 22.6 21.5 21.1 20.5
NFPS primary balance 0.3 0.9 0.4 0.2 0.3 1.6 1.9 2.2 0.4 1.2 1.5 1.8
Sources: Turkish Treasury and Staff estimates.
Central Government and Non-Financial Public Sector BalancesMTP 2015-17Staff - unchanged policies Staff - active policies
TURKEY
INTERNATIONAL MONETARY FUND 15
Box 5. The 2015–17 Medium-Term Program
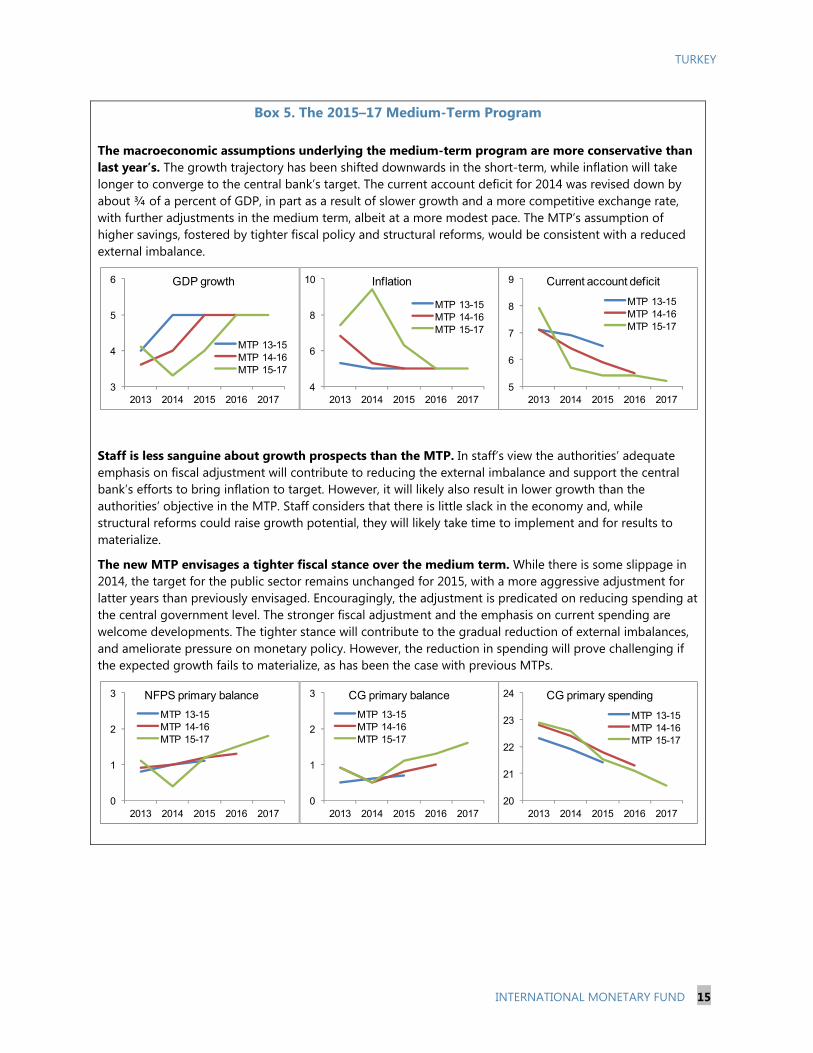
The macroeconomic assumptions underlying the medium-term program are more conservative than last year’s. The growth trajectory has been shifted downwards in the short-term, while inflation will take longer to converge to the central bank’s target. The current account deficit for 2014 was revised down by about ¾ of a percent of GDP, in part as a result of slower growth and a more competitive exchange rate, with further adjustments in the medium term, albeit at a more modest pace. The MTP’s assumption of higher savings, fostered by tighter fiscal policy and structural reforms, would be consistent with a reduced external imbalance.
Staff is less sanguine about growth prospects than the MTP. In staff’s view the authorities’ adequate emphasis on fiscal adjustment will contribute to reducing the external imbalance and support the central bank’s efforts to bring inflation to target. However, it will likely also result in lower growth than the authorities’ objective in the MTP. Staff considers that there is little slack in the economy and, while structural reforms could raise growth potential, they will likely take time to implement and for results to materialize.
The new MTP envisages a tighter fiscal stance over the medium term. While there is some slippage in 2014, the target for the public sector remains unchanged for 2015, with a more aggressive adjustment for latter years than previously envisaged. Encouragingly, the adjustment is predicated on reducing spending at the central government level. The stronger fiscal adjustment and the emphasis on current spending are welcome developments. The tighter stance will contribute to the gradual reduction of external imbalances, and ameliorate pressure on monetary policy. However, the reduction in spending will prove challenging if the expected growth fails to materialize, as has been the case with previous MTPs.
3
4
5
6
2013 2014 2015 2016 2017
MTP 13-15MTP 14-16MTP 15-17
GDP growth
4
6
8
10
2013 2014 2015 2016 2017
MTP 13-15MTP 14-16MTP 15-17
Inflation
5
6
7
8
9
2013 2014 2015 2016 2017
MTP 13-15MTP 14-16MTP 15-17
Current account deficit
0
1
2
3
2013 2014 2015 2016 2017
MTP 13-15MTP 14-16MTP 15-17
NFPS primary balance
0
1
2
3
2013 2014 2015 2016 2017
MTP 13-15MTP 14-16MTP 15-17
CG primary balance
20
21
22
23
24
2013 2014 2015 2016 2017
MTP 13-15MTP 14-16MTP 15-17
CG primary spending
TURKEY
16 INTERNATIONAL MONETARY FUND
21. The authorities agreed with staff that higher public savings are needed in the medium term. Although they see no need to increase the primary surplus on grounds of debt sustainability, they believe a stronger public sector position is needed to help reduce the external imbalance and rebuild fiscal buffers. They also broadly share the view that containing expenditure is the key to improving the structural balance. Thus, they aim to increase the primary surplus towards 2 percent of GDP in the next three years, starting with about 1 percent of GDP adjustment in the 2015 budget. In addition, they have adjusted energy prices so as to eliminate losses in the SOE sector.
B. Monetary Policy—Close the Credibility Gap
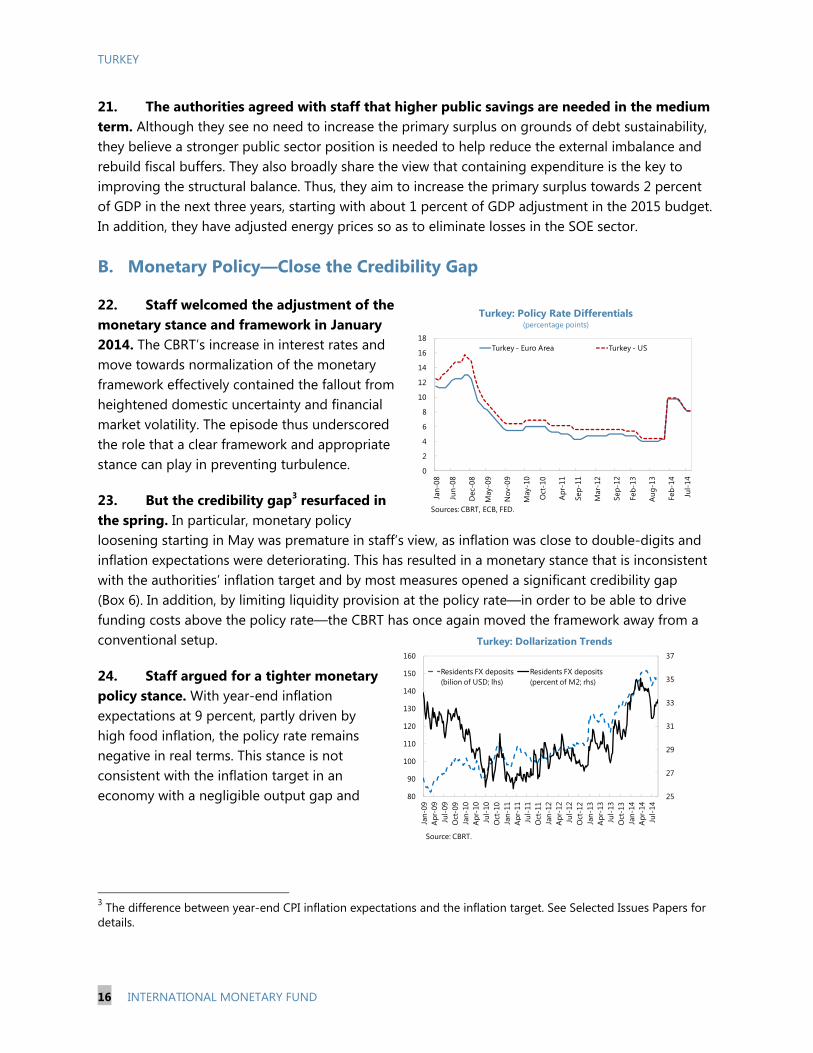
22. Staff welcomed the adjustment of the monetary stance and framework in January 2014. The CBRT’s increase in interest rates and move towards normalization of the monetary framework effectively contained the fallout from heightened domestic uncertainty and financial market volatility. The episode thus underscored the role that a clear framework and appropriate stance can play in preventing turbulence.
23. But the credibility gap3 resurfaced in the spring. In particular, monetary policy loosening starting in May was premature in staff’s view, as inflation was close to double-digits and inflation expectations were deteriorating. This has resulted in a monetary stance that is inconsistent with the authorities’ inflation target and by most measures opened a significant credibility gap (Box 6). In addition, by limiting liquidity provision at the policy rate—in order to be able to drive funding costs above the policy rate—the CBRT has once again moved the framework away from a conventional setup.
24. Staff argued for a tighter monetary policy stance. With year-end inflation expectations at 9 percent, partly driven by high food inflation, the policy rate remains negative in real terms. This stance is not consistent with the inflation target in an economy with a negligible output gap and
3 The difference between year-end CPI inflation expectations and the inflation target. See Selected Issues Papers for details.
0
2
4
6
8
10
12
14
16
18
Jan-
08
Jun-
08
Dec
-08
May
-09
Nov
-09
May
-10
Oct
-10
Apr
-11
Sep-
11
Mar
-12
Sep-
12
Feb-
13
Aug
-13
Feb-
14
Jul-
14
Turkey - Euro Area Turkey - US
Turkey: Policy Rate Differentials(percentage points)
Sources: CBRT, ECB, FED.
25
27
29
31
33
35
37
80
90
100
110
120
130
140
150
160
Jan-
09A
pr-0
9Ju
l-09
Oct
-09
Jan-
10A
pr-1
0Ju
l-10
Oct
-10
Jan-
11A
pr-1
1Ju
l-11
Oct
-11
Jan-
12A
pr-1
2Ju
l-12
Oct
-12
Jan-
13A
pr-1
3Ju
l-13
Oct
-13
Jan-
14A
pr-1
4Ju
l-14
Residents FX deposits(bilion of USD; lhs)
Residents FX deposits(percent of M2; rhs)
Turkey: Dollarization Trends
Source: CBRT.
TURKEY
INTERNATIONAL MONETARY FUND 17
credit growth running at 18 percent. Missing the inflation target in the last three out of four years, with outcomes above the top end of the +/-200bps band around the target, has led to a significant deterioration in the capacity for the CBRT to anchor inflation expectations in the face of transitory price shocks. Thus, staff called for an increase in the policy interest rate to reach a positive real level, which should be sustained to bring both inflation and expectations to target. The rate increase would serve as an important signal that the central bank prioritizes inflation, and would aid in the resumption of the de-dollarization trend of the economy.
25. In addition, staff called for full normalization of the monetary policy framework. Normalizing the framework by committing to providing full liquidity at the policy rate would facilitate communication and help improve monetary transmission. Together with the advocated rate increase it would serve the CBRT’s credibility.
25
27
29
31
33
35
37
80
90
100
110
120
130
140
150
160
Jan-
09A
pr-0
9Ju
l-09
Oct
-09
Jan-
10A
pr-1
0Ju
l-10
Oct
-10
Jan-
11A
pr-1
1Ju
l-11
Oct
-11
Jan-
12A
pr-1
2Ju
l-12
Oct
-12
Jan-
13A
pr-1
3Ju
l-13
Oct
-13
Jan-
14A
pr-1
4Ju
l-14
Residents FX deposits(bilion of USD; lhs)
Residents FX deposits(percent of M2; rhs)
Turkey: Foreign Exchange Deposits
Source: CBRT.
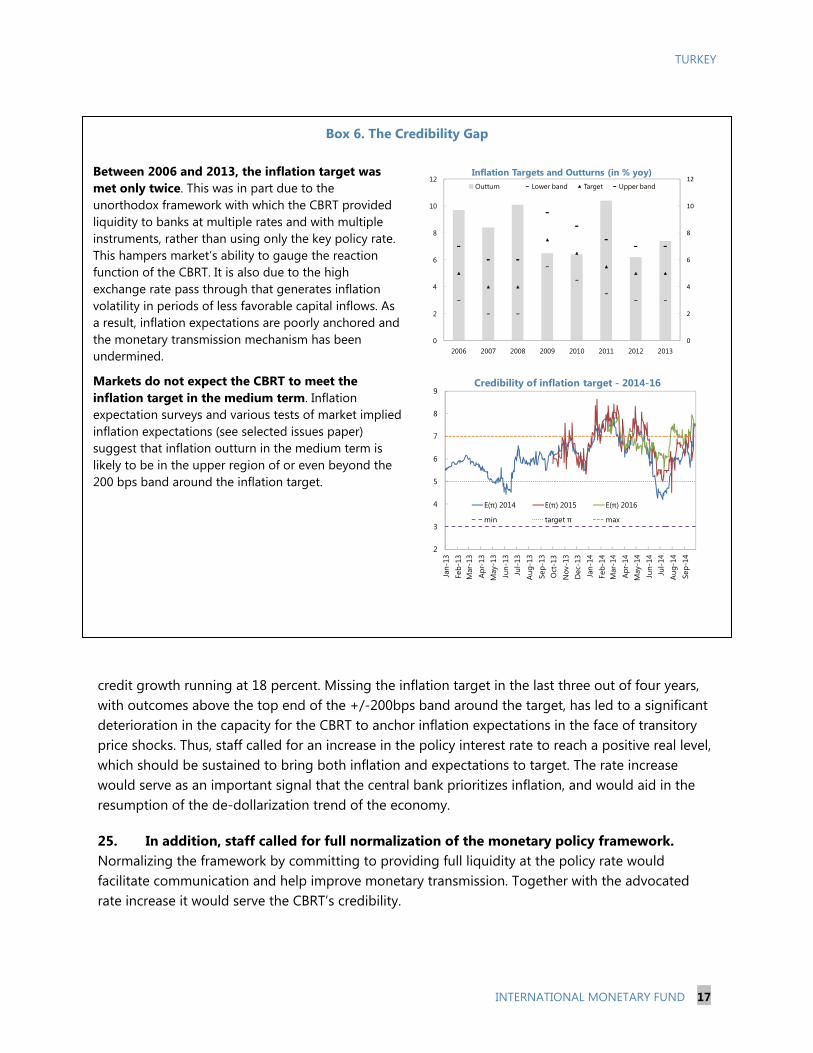
Box 6. The Credibility Gap Between 2006 and 2013, the inflation target was met only twice. This was in part due to the unorthodox framework with which the CBRT provided liquidity to banks at multiple rates and with multiple instruments, rather than using only the key policy rate. This hampers market’s ability to gauge the reaction function of the CBRT. It is also due to the high exchange rate pass through that generates inflation volatility in periods of less favorable capital inflows. As a result, inflation expectations are poorly anchored and the monetary transmission mechanism has been undermined.
Markets do not expect the CBRT to meet the inflation target in the medium term. Inflation expectation surveys and various tests of market implied inflation expectations (see selected issues paper) suggest that inflation outturn in the medium term is likely to be in the upper region of or even beyond the 200 bps band around the inflation target.
0
2
4
6
8
10
12
0
2
4
6
8
10
12
2006 2007 2008 2009 2010 2011 2012 2013
Inflation Targets and Outturns (in % yoy)Outturn Lower band Target Upper band
2
3
4
5
6
7
8
9
Jan-
13Fe
b-13
Mar
-13
Apr
-13
May
-13
Jun-
13Ju
l-13
Aug
-13
Sep-
13O
ct-1
3N
ov-1
3D
ec-1
3Ja
n-14
Feb-
14M
ar-1
4A
pr-1
4M
ay-1
4Ju
n-14
Jul-
14A
ug-1
4Se
p-14
E(π) 2014 E(π) 2015 E(π) 2016
min target π max
Credibility of inflation target - 2014-16
TURKEY
18 INTERNATIONAL MONETARY FUND
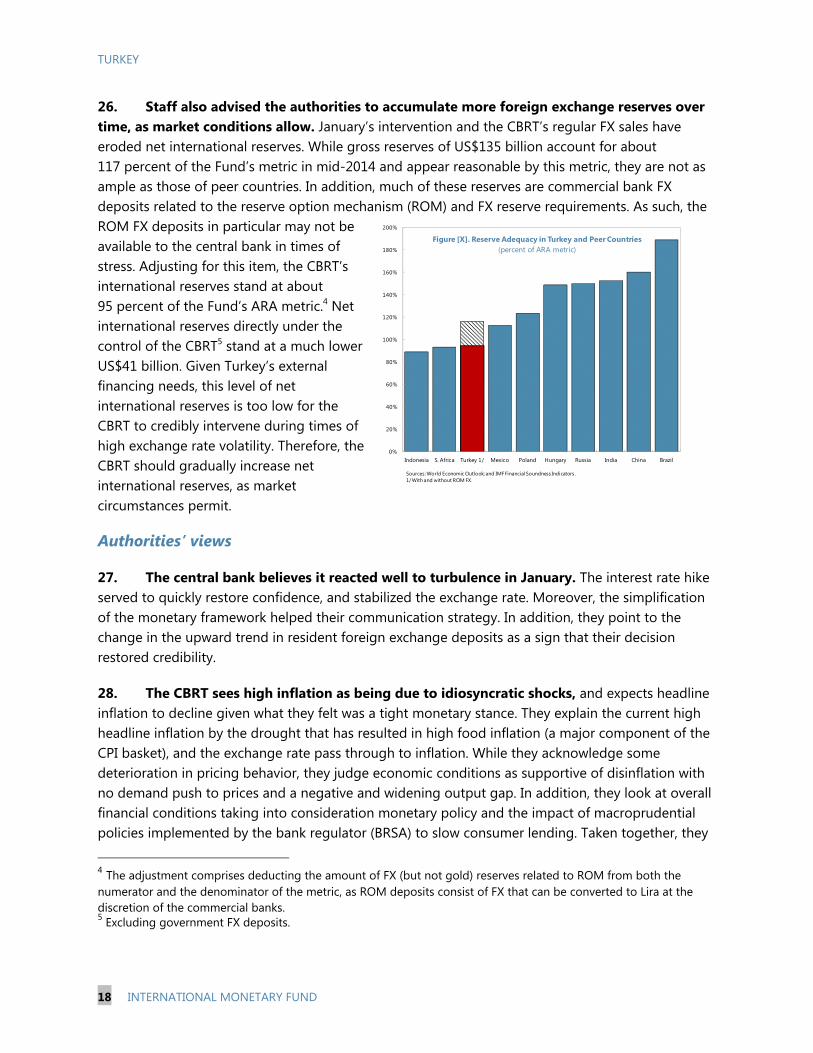
26. Staff also advised the authorities to accumulate more foreign exchange reserves over time, as market conditions allow. January’s intervention and the CBRT’s regular FX sales have eroded net international reserves. While gross reserves of US$135 billion account for about 117 percent of the Fund’s metric in mid-2014 and appear reasonable by this metric, they are not as ample as those of peer countries. In addition, much of these reserves are commercial bank FX deposits related to the reserve option mechanism (ROM) and FX reserve requirements. As such, the ROM FX deposits in particular may not be available to the central bank in times of stress. Adjusting for this item, the CBRT’s international reserves stand at about 95 percent of the Fund’s ARA metric.4 Net international reserves directly under the control of the CBRT5 stand at a much lower US$41 billion. Given Turkey’s external financing needs, this level of net international reserves is too low for the CBRT to credibly intervene during times of high exchange rate volatility. Therefore, the CBRT should gradually increase net international reserves, as market circumstances permit.
Authorities’ views
27. The central bank believes it reacted well to turbulence in January. The interest rate hike served to quickly restore confidence, and stabilized the exchange rate. Moreover, the simplification of the monetary framework helped their communication strategy. In addition, they point to the change in the upward trend in resident foreign exchange deposits as a sign that their decision restored credibility.
28. The CBRT sees high inflation as being due to idiosyncratic shocks, and expects headline inflation to decline given what they felt was a tight monetary stance. They explain the current high headline inflation by the drought that has resulted in high food inflation (a major component of the CPI basket), and the exchange rate pass through to inflation. While they acknowledge some deterioration in pricing behavior, they judge economic conditions as supportive of disinflation with no demand push to prices and a negative and widening output gap. In addition, they look at overall financial conditions taking into consideration monetary policy and the impact of macroprudential policies implemented by the bank regulator (BRSA) to slow consumer lending. Taken together, they
4 The adjustment comprises deducting the amount of FX (but not gold) reserves related to ROM from both the numerator and the denominator of the metric, as ROM deposits consist of FX that can be converted to Lira at the discretion of the commercial banks. 5 Excluding government FX deposits.
0%
20%
40%
60%
80%
100%
120%
140%
160%
180%
200%
Indonesia S. Africa Turkey 1/ Mexico Poland Hungary Russia India China Brazil
Figure [X]. Reserve Adequacy in Turkey and Peer Countries(percent of ARA metric)
Sources: World Economic Outlook; and IMF Financial Soundness Indicators .1/ With and without ROM FX.

TURKEY
INTERNATIONAL MONETARY FUND 19
believe overall set of policies are restrictive for the real economy and that this will help bring inflation to target. Moreover, they expect that product market reforms to limit food inflation will contribute to disinflation over the medium term.
29. Finally, the central bank deems the pace of accumulation of international reserves appropriate. They explained the stock of reserves would suffice to withstand balance of payments stresses akin to those experienced in the recent past. While they see a need for higher net reserves, they are satisfied with the pace of accumulation through EXIM bank loans.
C. Financial Sector and Macroprudential Policies—Preserve Resilience
30. The banking sector remains well-capitalized. The impact of exchange rate depreciation and higher interest rates on non-performing loans (NPLs) has been limited. The ratio of NPLs to total loans currently stands at 2.8 percent, although NPLs are slightly higher in recent vintages. Banks were largely able to pass January’s interest rate increase on to their customers, thus their net interest margin remained at around 2 percent. Lower credit growth did dent banks’ profitability, bringing return on equity down to 12½ percent (Box 7). System wide capital adequacy remains above 16 percent, well above regulatory minima. Moreover, capital is almost entirely tier 1. Similarly, the banks’ liquidity adequacy ratios (either at one week or one month maturity, total or FX only) show liquid assets cover more than 100 percent of short term liabilities despite conservative assumptions on the amount of deposits “at risk of flight.” The authorities’ stress tests show a system resilient to significant shocks.
31. Still, banks’ wholesale external foreign exchange funding has risen rapidly throughout the banking system, presenting rollover risk. The sector’s loan-to-deposit (LtD) ratio stands at 114 percent, with the ratio at 84 and 131 percent for foreign (FX) and local currency respectively. Wholesale external funding in FX is, on the margin, financing the expansion of local currency lending. Driven by the interest rate differential, this exposure has risen from US$61 billion in 2009 to US$137 billion at the end of the first quarter of 2014, US$85 billion of which is at short maturity. Banks hedge the exchange rate risk associated with this funding, mainly off balance sheet, and hence the net open FX position of the sector is not large at 0.1 percent of GDP. Still, in case of a reversal of market sentiment, the rollover (refinancing) risk and hence FX liquidity risk associated with the gross exposure is significant. Should these risks materialize, banks’ ROM (and possibly FX reserve requirement deposits) with the CBRT could be used to partially cover the FX liquidity needs.
0
5
10
15
20
25
0
1
2
3
4
5
6
2009
Q1
2009
Q2
2009
Q3
2009
Q4
2010
Q1
2010
Q2
2010
Q3
2010
Q4
2011
Q1
2011
Q2
2011
Q3
2011
Q4
2012
Q1
2012
Q2
2012
Q3
2012
Q4
2013
Q1
2013
Q2
2013
Q3
2013
Q4
2014
Q1
2014
Q2
Non-Performing Loans in percent of total loans (lhs)Capital Adequacy Ratio (rhs)
Source: BRSA.
Capital Adequacy Ratio and Non-Performing Loans(percent)
TURKEY
20 INTERNATIONAL MONETARY FUND
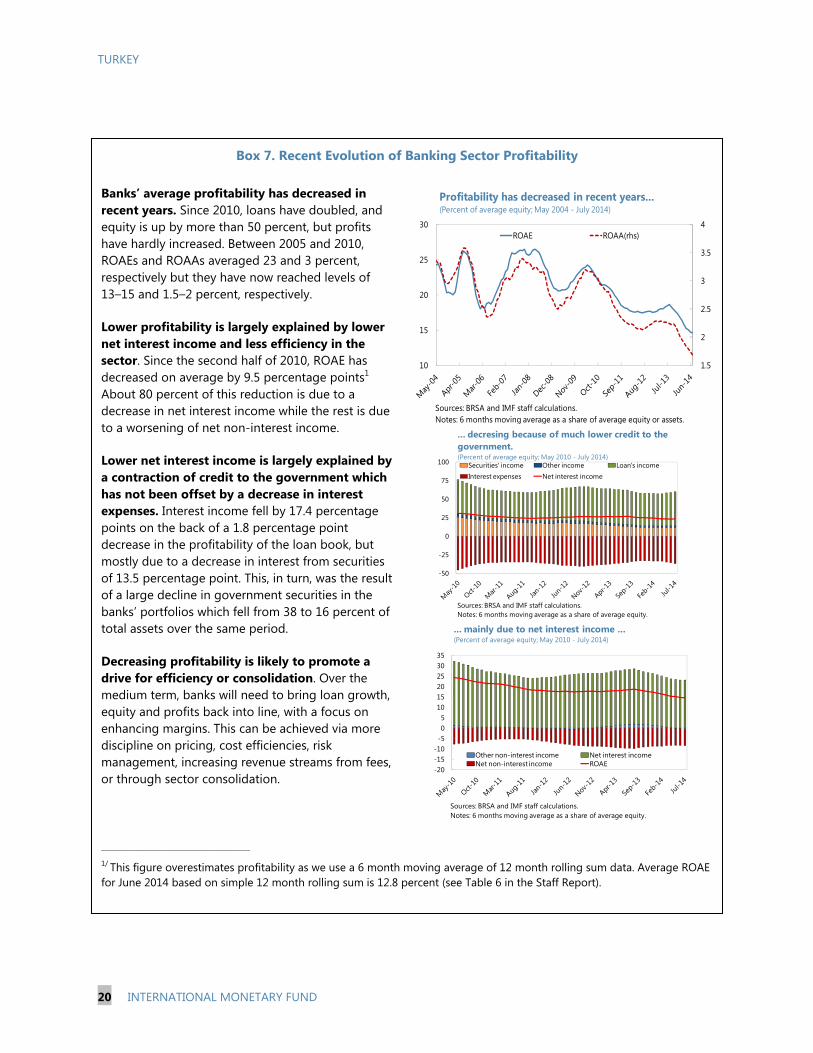
Box 7. Recent Evolution of Banking Sector Profitability Banks’ average profitability has decreased in recent years. Since 2010, loans have doubled, and equity is up by more than 50 percent, but profits have hardly increased. Between 2005 and 2010, ROAEs and ROAAs averaged 23 and 3 percent, respectively but they have now reached levels of 13–15 and 1.5–2 percent, respectively.
Lower profitability is largely explained by lower net interest income and less efficiency in the sector. Since the second half of 2010, ROAE has decreased on average by 9.5 percentage points1 About 80 percent of this reduction is due to a decrease in net interest income while the rest is due to a worsening of net non-interest income.
Lower net interest income is largely explained by a contraction of credit to the government which has not been offset by a decrease in interest expenses. Interest income fell by 17.4 percentage points on the back of a 1.8 percentage point decrease in the profitability of the loan book, but mostly due to a decrease in interest from securities of 13.5 percentage point. This, in turn, was the result of a large decline in government securities in the banks’ portfolios which fell from 38 to 16 percent of total assets over the same period.
Decreasing profitability is likely to promote a drive for efficiency or consolidation. Over the medium term, banks will need to bring loan growth, equity and profits back into line, with a focus on enhancing margins. This can be achieved via more discipline on pricing, cost efficiencies, risk management, increasing revenue streams from fees, or through sector consolidation.
______________________________________________________
1/ This figure overestimates profitability as we use a 6 month moving average of 12 month rolling sum data. Average ROAE for June 2014 based on simple 12 month rolling sum is 12.8 percent (see Table 6 in the Staff Report).
1.5
2
2.5
3
3.5
4
10
15
20
25
30ROAE ROAA(rhs)
Profitability has decreased in recent years...(Percent of average equity; May 2004 - July 2014)
Sources: BRSA and IMF staff calculations.Notes: 6 months moving average as a share of average equity or assets.
-50
-25
0
25
50
75
100 Securities' income Other income Loan's incomeInterest expenses Net interest income
Sources: BRSA and IMF staff calculations.Notes: 6 months moving average as a share of average equity.
... decresing because of much lower credit to the government.(Percent of average equity; May 2010 - July 2014)
-20-15-10
-505
101520253035
Other non-interest income Net interest incomeNet non-interest income ROAE
... mainly due to net interest income ...(Percent of average equity; May 2010 - July 2014)
Sources: BRSA and IMF staff calculations.Notes: 6 months moving average as a share of average equity.

TURKEY
INTERNATIONAL MONETARY FUND 21
32. Banks also remain indirectly exposed to exchange rate risk through foreign exchange lending to non-financial corporates. Driven in part by tax and prudential policies encouraging moving FX lending onshore, these loans have increased to some US$151 billion in July 2014 from less than US$40 billion in 2008.6 However, prudential regulations limit indirect foreign exchange rate risk by limiting these loans to firms with exports receipts and larger companies with greater access to financial hedging and FX assets. A recent micro-based study by the central bank indeed suggests part of this net open position is hedged by exports receipts. Some US$27 billion in FX-indexed loans, however, is not subject to the same regulations, even though they carry similar risks. Prudential regulation prohibits household credit in FX.
33. Staff complimented the authorities on the implementation of measures to slow consumer credit growth and strengthening of stress tests. After tightening credit card limits and increasing provisioning rates in the Fall of 2013, the authorities implemented further limits on installment purchases effective February 2014 (Annex IV). As a consequence, consumer credit growth has slowed from almost 40 to 18 percent (13-week moving average, annualized) in the year to August 2014. Staff is further encouraged by the authorities’ plan to introduce general debt-to-income limits for consumer lending. Staff also welcomed significant improvements in stress testing methodologies. Staff also argued that maintaining a level playing field is essential for supervision, and to preserve confidence.
34. To preserve financial stability, additional macroprudential measures targeting banks’ wholesale external FX financing could be considered. Specifically, to slow FX leverage in the banking system, the authorities could, after a comprehensive quantitative impact study, consider a menu of options (Box 8).7 Such policies—which have been successfully implemented in other countries (see selected issues paper)—would contribute to a gradual decrease of FX leverage in the banking system, thus preserving its resilience. At the same time these measures would likely slow the growth in FX lending to companies. While these policies would indirectly affect domestic demand, staff cautioned they are not a substitute for tighter macroeconomic policies.
35. In addition, the mission suggested other possible measures to reduce incentives for the non-financial corporate sector to take on exchange rate risk. Staff argued that since FX lending to unhedged corporations is riskier than Lira loans, higher risk weights (i.e., requiring additional capital charges) and/or additional provisioning on FX loans could be considered. Staff advocated that the prudential treatment (in particular eligibility requirements) of FX-indexed lending be brought into line with that of FX lending, as the risks are the same.
6 While offshore FX borrowing is not prohibited, in 2013, the authorities introduced a levy of up to 3 percent of principal on such borrowing. 7 The authorities decided to start remunerating (as of November 2014) banks’ required reserves in TRL as a way to reduce their incentives to leverage in cheaper foreign exchange funds (see Annex IV).
TURKEY
22 INTERNATIONAL MONETARY FUND
60
70
80
90
100
110
120
130
140
150
10
12
14
16
18
20
22
24
Jan-
10
Apr
-10
Jul-
10
Oct
-10
Jan-
11
Apr
-11
Jul-
11
Oct
-11
Jan-
12
Apr
-12
Jul-
12
Oct
-12
Jan-
13
Apr
-13
Jul-
13
Oct
-13
Jan-
14
Apr
-14
Jul-
14
Wholesale LTD TL (rhs)
FX wholesale funding doubled to extend Lira loans.(Percent; January 2010 - July 2014)
Sources: BRSA and IMF staff calculations.Notes: Wholesale funding is defined as total liabilities minus deposit as a share in total assets.
-60
-40
-20
0
20
40
60
-60
-40
-20
0
20
40
60
Jan-
08
Jul-
08
Feb
-09
Aug
-09
Mar
-10
Sep
-10
Ap
r-11
Oct
-11
Ma
y-1
2
No
v-12
Jun-
13
Jan-
14
Jul-
14
Net Open positionTotalOn balance sheetOff balance sheet
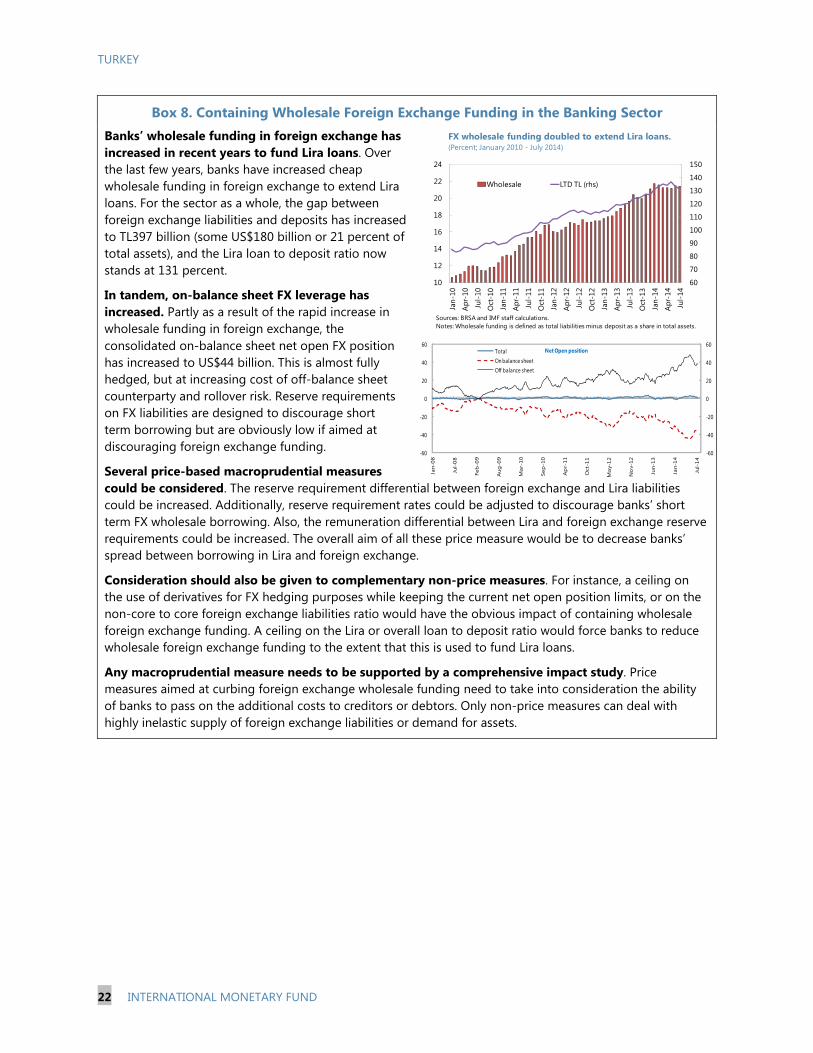
Box 8. Containing Wholesale Foreign Exchange Funding in the Banking Sector Banks’ wholesale funding in foreign exchange has increased in recent years to fund Lira loans. Over the last few years, banks have increased cheap wholesale funding in foreign exchange to extend Lira loans. For the sector as a whole, the gap between foreign exchange liabilities and deposits has increased to TL397 billion (some US$180 billion or 21 percent of total assets), and the Lira loan to deposit ratio now stands at 131 percent.
In tandem, on-balance sheet FX leverage has increased. Partly as a result of the rapid increase in wholesale funding in foreign exchange, the consolidated on-balance sheet net open FX position has increased to US$44 billion. This is almost fully hedged, but at increasing cost of off-balance sheet counterparty and rollover risk. Reserve requirements on FX liabilities are designed to discourage short term borrowing but are obviously low if aimed at discouraging foreign exchange funding.
Several price-based macroprudential measures could be considered. The reserve requirement differential between foreign exchange and Lira liabilities could be increased. Additionally, reserve requirement rates could be adjusted to discourage banks’ short term FX wholesale borrowing. Also, the remuneration differential between Lira and foreign exchange reserve requirements could be increased. The overall aim of all these price measure would be to decrease banks’ spread between borrowing in Lira and foreign exchange.
Consideration should also be given to complementary non-price measures. For instance, a ceiling on the use of derivatives for FX hedging purposes while keeping the current net open position limits, or on the non-core to core foreign exchange liabilities ratio would have the obvious impact of containing wholesale foreign exchange funding. A ceiling on the Lira or overall loan to deposit ratio would force banks to reduce wholesale foreign exchange funding to the extent that this is used to fund Lira loans.
Any macroprudential measure needs to be supported by a comprehensive impact study. Price measures aimed at curbing foreign exchange wholesale funding need to take into consideration the ability of banks to pass on the additional costs to creditors or debtors. Only non-price measures can deal with highly inelastic supply of foreign exchange liabilities or demand for assets.
TURKEY
INTERNATIONAL MONETARY FUND 23
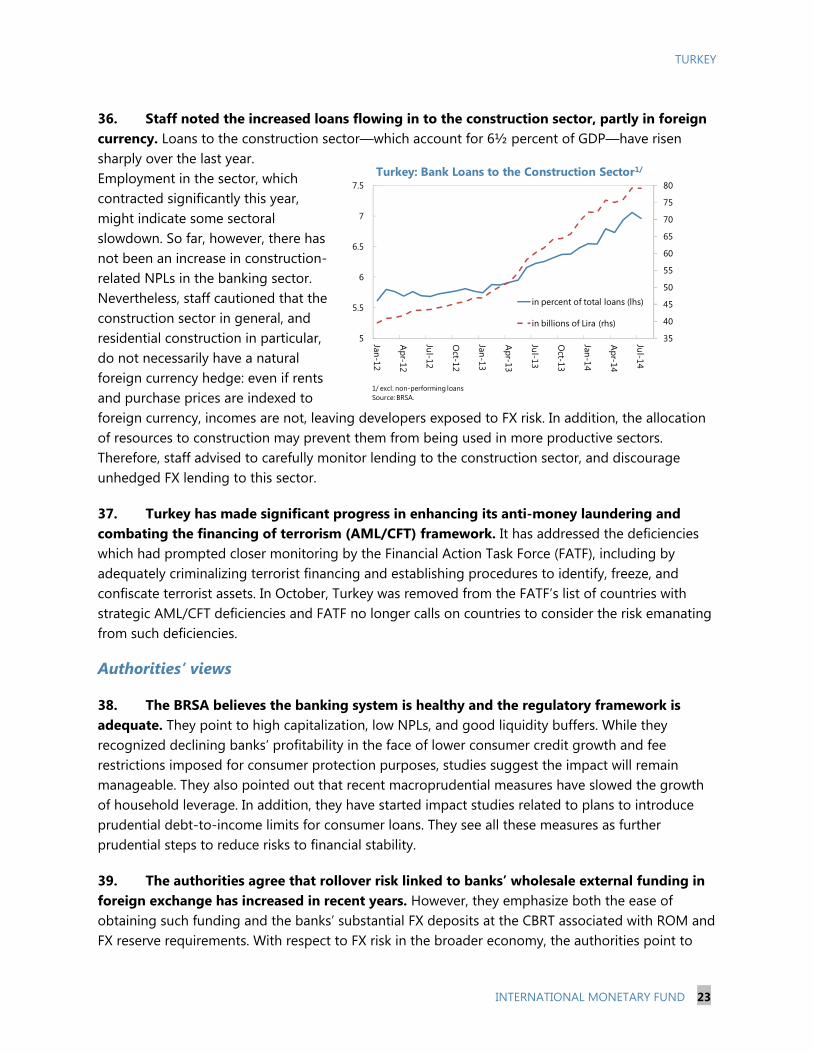
36. Staff noted the increased loans flowing in to the construction sector, partly in foreign currency. Loans to the construction sector—which account for 6½ percent of GDP—have risen sharply over the last year. Employment in the sector, which contracted significantly this year, might indicate some sectoral slowdown. So far, however, there has not been an increase in construction-related NPLs in the banking sector. Nevertheless, staff cautioned that the construction sector in general, and residential construction in particular, do not necessarily have a natural foreign currency hedge: even if rents and purchase prices are indexed to foreign currency, incomes are not, leaving developers exposed to FX risk. In addition, the allocation of resources to construction may prevent them from being used in more productive sectors. Therefore, staff advised to carefully monitor lending to the construction sector, and discourage unhedged FX lending to this sector.
37. Turkey has made significant progress in enhancing its anti-money laundering and combating the financing of terrorism (AML/CFT) framework. It has addressed the deficiencies which had prompted closer monitoring by the Financial Action Task Force (FATF), including by adequately criminalizing terrorist financing and establishing procedures to identify, freeze, and confiscate terrorist assets. In October, Turkey was removed from the FATF’s list of countries with strategic AML/CFT deficiencies and FATF no longer calls on countries to consider the risk emanating from such deficiencies.
Authorities’ views
38. The BRSA believes the banking system is healthy and the regulatory framework is adequate. They point to high capitalization, low NPLs, and good liquidity buffers. While they recognized declining banks’ profitability in the face of lower consumer credit growth and fee restrictions imposed for consumer protection purposes, studies suggest the impact will remain manageable. They also pointed out that recent macroprudential measures have slowed the growth of household leverage. In addition, they have started impact studies related to plans to introduce prudential debt-to-income limits for consumer loans. They see all these measures as further prudential steps to reduce risks to financial stability.
39. The authorities agree that rollover risk linked to banks’ wholesale external funding in foreign exchange has increased in recent years. However, they emphasize both the ease of obtaining such funding and the banks’ substantial FX deposits at the CBRT associated with ROM and FX reserve requirements. With respect to FX risk in the broader economy, the authorities point to
35
40
45
50
55
60
65
70
75
80
5
5.5
6
6.5
7
7.5
Jan-12
Apr-12
Jul-12
Oct-12
Jan-13
Apr-13
Jul-13
Oct-13
Jan-14
Apr-14
Jul-14
in percent of total loans (lhs)
in billions of Lira (rhs)
Turkey: Bank Loans to the Construction Sector1/
1/ excl. non-performing loansSource: BRSA.
TURKEY
24 INTERNATIONAL MONETARY FUND
their micro-based study that suggests many of the corporates borrowing in FX are naturally hedged, and to anecdotal evidence suggesting some of the loans are also covered by FX collateral. At this time, the BRSA does not see a need for additional macroprudential measures targeted at banks’ wholesale external foreign exchange funding, pointing out this funding does not translate to domestic FX lending. Overall, the authorities see their prudential and macroprudential policies as an integral part of their macroeconomic management toolkit, to be used in pursuit of rebalancing the economy. Finally, the authorities were pleased with FATF’s recognition of their efforts to improve the AML/CFT framework.
D. Structural Policies—Boost Productivity and Raise Private Sector Savings
40. The authorities plan several initiatives to improve competitiveness. These center on the business environment, energy dependence, informality, the labor market, and education. To improve the business environment, the authorities adopted a new commercial code in 2012. Large-scale privatizations of the energy distribution networks and the expansion of renewable and nuclear electricity generation will contain energy imports over the medium term. Measures to decrease informality will also improve competitiveness by leveling the playing field for the formal sector and improving incentives to invest in human and physical capital. The national employment strategy aims to facilitate the use of part-time and temporary labor in the formal market, thereby further fighting informality and increasing labor participation.
41. Staff agrees with the authorities that structural reforms are critical, but prioritization and implementation is critical. Policy changes have boosted participation in voluntary private pension funds. Staff saw additional private and public pension reform as a potential avenue to increase private sector savings in the medium term. In addition, given staff’s assessment that Turkey’s exchange rate is overvalued, the authorities’ focus should be on reforms that reduce the competitiveness gap. Staff proposed that more could be done to boost progress in the authorities’ priority policy areas. The business climate could be further improved by simplifying licensing, regulation, tax administration and compliance, to enhance efficiency and predictability. Improving the efficiency and consistency of the judiciary should also facilitate the business climate. Informality and labor market functioning could be improved by reducing the labor wedge and simplifying the taxation of labor—specifically by adopting the draft income tax reform and reducing the relatively high cost of pension and severance premia for part-time workers. Reforms to increase educational outcomes could boost productivity and employment.
Authorities’ views
42. The authorities agree that the structural reform agenda is critical to close the competitiveness gap and realize Turkey’s economic potential. They point to the 10th Development Plan as clear evidence of a bold and well-targeted set of structural reforms. It strives to reduce energy dependence by boosting renewable, nuclear, domestic source based electricity generation and increasing energy efficiency. Labor force participation is to be increased and the functioning of labor markets improved through changes to the labor code, enhanced child care facilities, better

TURKEY
INTERNATIONAL MONETARY FUND 25
education, and tax incentives for employment. Debt financing will be discouraged by offering incentives for companies to rely on equity. Together, these measures are expected to increase domestic savings and reduce the external imbalance. The Development Plan has been approved by parliament and the authorities are in the process of drafting coordinated implementation plans. Still, they aim to start implementation of key steps only after the 2015 parliamentary elections.
STAFF APPRAISAL 43. Turkey’s economy has grown by an impressive 6 percent on average since 2010. The economy recovered swiftly from the great financial crisis and unemployment dropped to its lowest level in the last decade. More recently, the authorities effectively contained the fallout from heightened domestic uncertainty and financial market volatility. However, rapid growth has come with high inflation and a large external deficit. These imbalances are holding back growth potential and increasing risks, and need to be addressed with carefully sequenced macroeconomic policies and structural reforms.
44. Growth is set to continue, albeit at a more moderate pace. In 2014, GDP is expected to grow by 3 percent, driven by public sector support, net exports, and a mild revival of private domestic demand in the later part of the year. However, inflation will exceed the central bank’s target once again, reflecting premature monetary easing, and the current account deficit—although decreasing—will remain elevated.
45. Without a change in policies, future economic performance is likely to be weaker than that of the recent past. Turkey’s low domestic savings and competitiveness challenges limit investment and exports. Thus, on current policies and national saving rates, annual economic growth is expected to slow to about 3½ percent in the medium term. This lower growth rate would likely limit inflation and the deterioration of the current account deficit. But it would also mean that Turkey’s income convergence with advanced economies would be slow, potentially leaving Turkey in a middle income trap.
46. The financial system remains well-capitalized. Capital adequacy ratios are high on average, and mostly based on high quality capital. Nonperforming loans are low and well provisioned. However, banks are increasingly reliant on—for now—ample and cheap external wholesale funding in foreign exchange. In tandem, banks have increased their indirect foreign exchange risk through foreign currency lending to non-financial corporations.
47. The main risk to the outlook is a sharp decrease in capital inflows. Turkey’s external gross financing needs of more than 25 percent of GDP leave the country exposed to sudden shifts in capital flows, which could lead to an abrupt and costly adjustment of the real economy. Risks are compounded by the fact that, as leverage has increased in the private sector, buffers to withstand shocks have diminished. The longer imbalances are allowed to increase, and the slower the
TURKEY
26 INTERNATIONAL MONETARY FUND
authorities are to create additional policy space to respond to shocks, the more costly such adjustments will become.
48. In the near term, the macroeconomic policy mix has to play a bigger role in rebalancing the economy and addressing imbalances. Turkey’s growth is constrained by its dependence on consumption, slow export growth, and sizable investment needs, against the backdrop of a large external deficit. The challenge of rebalancing the economy can only be met by implementing a stronger macroeconomic policy mix, especially until the authorities’ structural agenda begins to bear fruit.
49. The authorities are commended for their proposed fiscal adjustment in the next three years to help reduce the external imbalance and relieve pressure on monetary policy. Government non-interest current expenditure has been growing faster than the economy and policy has been too stimulative. Moreover the structural balance has been deteriorating in recent years, although debt sustainability is not a concern. Thus, the authorities’ new 2015–17 medium-term plan correctly aims to increase the primary surplus towards 2 percent of GDP by 2017. Moreover, their stated intention to achieve this adjustment through expenditure reductions would help strengthen the structural balance. In addition, the tighter fiscal stance would reduce the burden on monetary policy to meet the inflation target and would also result in a more competitive real exchange rate. This would help rebalance the economy away from consumption, support private investment, and improve the competitiveness of the tradable sector. Also, a stronger public sector position would create additional policy space to react to shocks as private sector balance sheets become more stretched.
50. The monetary stance needs to be consistent with the inflation target and the framework normalized. The current policy rate is not compatible with reducing inflation to the 5 percent target. Thus the monetary stance needs to be tightened and sustained to anchor expectations and lower inflation to the targeted rate. The monetary effort needed to achieve the inflation target would be smaller if the fiscal stance were tighter. In addition, normalizing the policy framework would facilitate communication, as was apparent in January 2014, and help improve monetary transmission.
51. Although gross international reserves are adequate, it would be prudent to increase net reserves. The level of gross reserves is in line with international standards, although they are not ample and are still below levels seen in peer countries. Net reserves are low, however, thus providing limited buffers in case of prolonged periods of exchange rate volatility. The central bank should therefore gradually bolster its net international reserves through sterilized interventions, as market conditions permit.
52. The strength of the banking sector must be preserved. Maintaining the standards of supervision and ensuring a level playing field are essential. The authorities are also encouraged to consider expanding their prudential and macro prudential toolkit to maintain financial stability. In order to curb rollover and foreign exchange risk in the economy, the authorities could, after conducting a careful impact analysis, introduce further measures that encourage banks to reduce
TURKEY
INTERNATIONAL MONETARY FUND 27
wholesale foreign exchange funding and reduce incentives for the corporate sector to borrow in foreign exchange. Yet such policies would not be a substitute for tighter macroeconomic policies. Moreover, prudential measures (in particular eligibility criteria) applied to foreign exchange-indexed lending should be brought in line with those applied to straight foreign exchange loans, as the risks associated with both types of loans are the same.
53. For the medium term, the structural reform policy agenda needs to be revitalized. Macroeconomic policies can support rebalancing and preserve financial stability in the near term, but improved medium-term growth will depend on progress with structural reforms aimed at enhancing Turkey’s economic potential. Thus, staff encourages the authorities to accelerate the ambitious reform program included in the 10th Development Plan. The priority should be to implement policies that encourage higher private sector savings, and promote lower energy dependence.
54. It is recommended that the next Article IV Consultation with Turkey be held on the standard 12-month cycle.
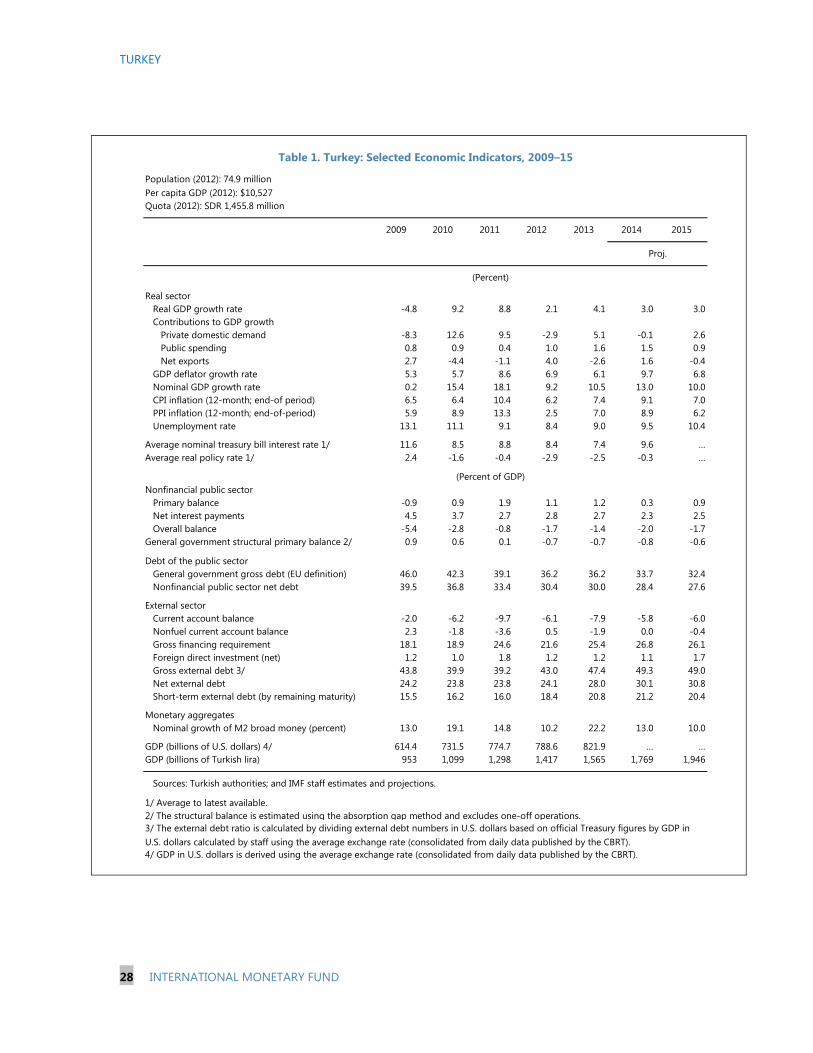
TURKEY
28 INTERNATIONAL MONETARY FUND
Population (2012): 74.9 millionPer capita GDP (2012): $10,527Quota (2012): SDR 1,455.8 million
2009 2010 2011 2012 2013 2014 2015
Real sectorReal GDP growth rate -4.8 9.2 8.8 2.1 4.1 3.0 3.0Contributions to GDP growth
Private domestic demand -8.3 12.6 9.5 -2.9 5.1 -0.1 2.6Public spending 0.8 0.9 0.4 1.0 1.6 1.5 0.9Net exports 2.7 -4.4 -1.1 4.0 -2.6 1.6 -0.4
GDP deflator growth rate 5.3 5.7 8.6 6.9 6.1 9.7 6.8Nominal GDP growth rate 0.2 15.4 18.1 9.2 10.5 13.0 10.0CPI inflation (12-month; end-of period) 6.5 6.4 10.4 6.2 7.4 9.1 7.0PPI inflation (12-month; end-of-period) 5.9 8.9 13.3 2.5 7.0 8.9 6.2Unemployment rate 13.1 11.1 9.1 8.4 9.0 9.5 10.4
Average nominal treasury bill interest rate 1/ 11.6 8.5 8.8 8.4 7.4 9.6 …Average real policy rate 1/ 2.4 -1.6 -0.4 -2.9 -2.5 -0.3 …
Nonfinancial public sectorPrimary balance -0.9 0.9 1.9 1.1 1.2 0.3 0.9Net interest payments 4.5 3.7 2.7 2.8 2.7 2.3 2.5Overall balance -5.4 -2.8 -0.8 -1.7 -1.4 -2.0 -1.7
General government structural primary balance 2/ 0.9 0.6 0.1 -0.7 -0.7 -0.8 -0.6
Debt of the public sectorGeneral government gross debt (EU definition) 46.0 42.3 39.1 36.2 36.2 33.7 32.4Nonfinancial public sector net debt 39.5 36.8 33.4 30.4 30.0 28.4 27.6
External sectorCurrent account balance -2.0 -6.2 -9.7 -6.1 -7.9 -5.8 -6.0Nonfuel current account balance 2.3 -1.8 -3.6 0.5 -1.9 0.0 -0.4Gross financing requirement 18.1 18.9 24.6 21.6 25.4 26.8 26.1Foreign direct investment (net) 1.2 1.0 1.8 1.2 1.2 1.1 1.7Gross external debt 3/ 43.8 39.9 39.2 43.0 47.4 49.3 49.0Net external debt 24.2 23.8 23.8 24.1 28.0 30.1 30.8Short-term external debt (by remaining maturity) 15.5 16.2 16.0 18.4 20.8 21.2 20.4
Monetary aggregatesNominal growth of M2 broad money (percent) 13.0 19.1 14.8 10.2 22.2 13.0 10.0
GDP (billions of U.S. dollars) 4/ 614.4 731.5 774.7 788.6 821.9 … …GDP (billions of Turkish lira) 953 1,099 1,298 1,417 1,565 1,769 1,946
Sources: Turkish authorities; and IMF staff estimates and projections.
1/ Average to latest available.2/ The structural balance is estimated using the absorption gap method and excludes one-off operations.
4/ GDP in U.S. dollars is derived using the average exchange rate (consolidated from daily data published by the CBRT).
Table 1. Turkey: Selected Economic Indicators, 2009–15
Proj.
(Percent)
(Percent of GDP)
3/ The external debt ratio is calculated by dividing external debt numbers in U.S. dollars based on official Treasury figures by GDP in U.S. dollars calculated by staff using the average exchange rate (consolidated from daily data published by the CBRT).
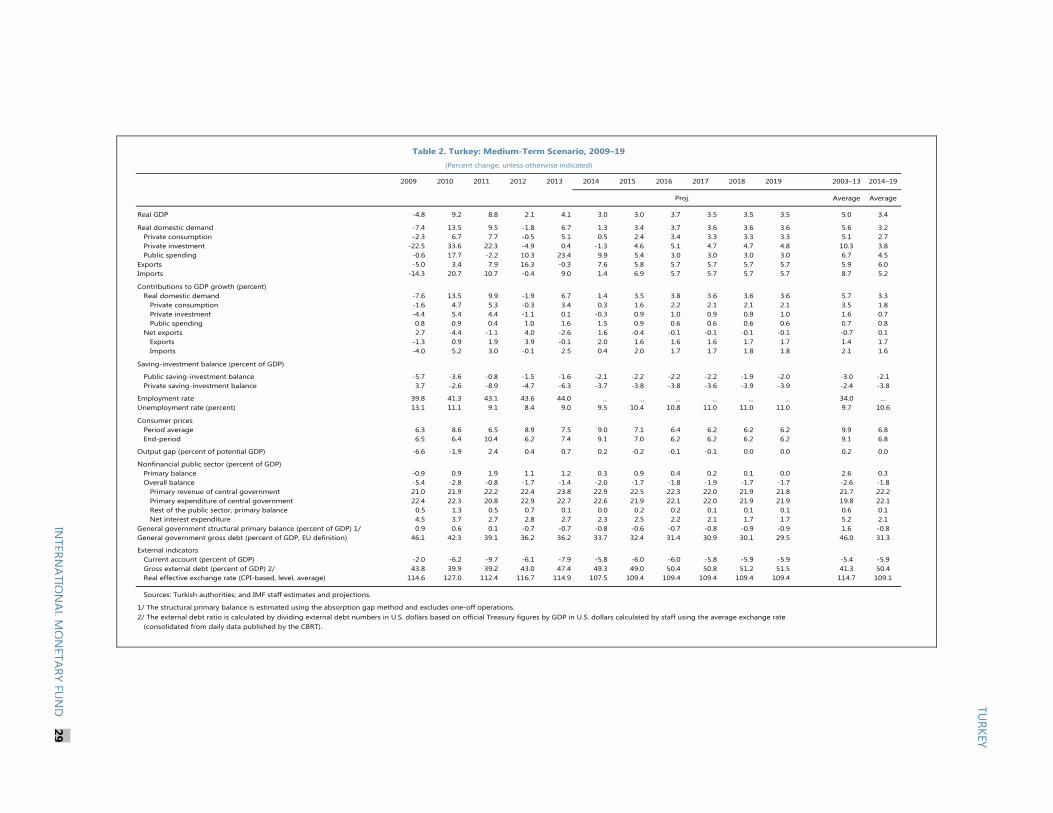
2009 2010 2011 2012 2013 2014 2015 2016 2017 2018 2019 2003–13 2014–19
Average Average
Real GDP -4.8 9.2 8.8 2.1 4.1 3.0 3.0 3.7 3.5 3.5 3.5 5.0 3.4
Real domestic demand -7.4 13.5 9.5 -1.8 6.7 1.3 3.4 3.7 3.6 3.6 3.6 5.6 3.2Private consumption -2.3 6.7 7.7 -0.5 5.1 0.5 2.4 3.4 3.3 3.3 3.3 5.1 2.7Private investment -22.5 33.6 22.3 -4.9 0.4 -1.3 4.6 5.1 4.7 4.7 4.8 10.3 3.8Public spending -0.6 17.7 -2.2 10.3 23.4 9.9 5.4 3.0 3.0 3.0 3.0 6.7 4.5
Exports -5.0 3.4 7.9 16.3 -0.3 7.6 5.8 5.7 5.7 5.7 5.7 5.9 6.0Imports -14.3 20.7 10.7 -0.4 9.0 1.4 6.9 5.7 5.7 5.7 5.7 8.7 5.2
Contributions to GDP growth (percent)Real domestic demand -7.6 13.5 9.9 -1.9 6.7 1.4 3.5 3.8 3.6 3.6 3.6 5.7 3.3
Private consumption -1.6 4.7 5.3 -0.3 3.4 0.3 1.6 2.2 2.1 2.1 2.1 3.5 1.8Private investment -4.4 5.4 4.4 -1.1 0.1 -0.3 0.9 1.0 0.9 0.9 1.0 1.6 0.7Public spending 0.8 0.9 0.4 1.0 1.6 1.5 0.9 0.6 0.6 0.6 0.6 0.7 0.8
Net exports 2.7 -4.4 -1.1 4.0 -2.6 1.6 -0.4 -0.1 -0.1 -0.1 -0.1 -0.7 0.1Exports -1.3 0.9 1.9 3.9 -0.1 2.0 1.6 1.6 1.6 1.7 1.7 1.4 1.7Imports -4.0 5.2 3.0 -0.1 2.5 0.4 2.0 1.7 1.7 1.8 1.8 2.1 1.6
Saving-investment balance (percent of GDP)
Public saving-investment balance -5.7 -3.6 -0.8 -1.5 -1.6 -2.1 -2.2 -2.2 -2.2 -1.9 -2.0 -3.0 -2.1Private saving-investment balance 3.7 -2.6 -8.9 -4.7 -6.3 -3.7 -3.8 -3.8 -3.6 -3.9 -3.9 -2.4 -3.8
Employment rate 39.8 41.3 43.1 43.6 44.0 ... ... ... ... ... ... 34.0 …Unemployment rate (percent) 13.1 11.1 9.1 8.4 9.0 9.5 10.4 10.8 11.0 11.0 11.0 9.7 10.6
Consumer pricesPeriod average 6.3 8.6 6.5 8.9 7.5 9.0 7.1 6.4 6.2 6.2 6.2 9.9 6.8End-period 6.5 6.4 10.4 6.2 7.4 9.1 7.0 6.2 6.2 6.2 6.2 9.1 6.8
Output gap (percent of potential GDP) -6.6 -1.9 2.4 0.4 0.7 0.2 -0.2 -0.1 -0.1 0.0 0.0 0.2 0.0
Nonfinancial public sector (percent of GDP)Primary balance -0.9 0.9 1.9 1.1 1.2 0.3 0.9 0.4 0.2 0.1 0.0 2.6 0.3Overall balance -5.4 -2.8 -0.8 -1.7 -1.4 -2.0 -1.7 -1.8 -1.9 -1.7 -1.7 -2.6 -1.8
Primary revenue of central government 21.0 21.9 22.2 22.4 23.8 22.9 22.5 22.3 22.0 21.9 21.8 21.7 22.2Primary expenditure of central government 22.4 22.3 20.8 22.9 22.7 22.6 21.9 22.1 22.0 21.9 21.9 19.8 22.1Rest of the public sector, primary balance 0.5 1.3 0.5 0.7 0.1 0.0 0.2 0.2 0.1 0.1 0.1 0.6 0.1Net interest expenditure 4.5 3.7 2.7 2.8 2.7 2.3 2.5 2.2 2.1 1.7 1.7 5.2 2.1
General government structural primary balance (percent of GDP) 1/ 0.9 0.6 0.1 -0.7 -0.7 -0.8 -0.6 -0.7 -0.8 -0.9 -0.9 1.6 -0.8General government gross debt (percent of GDP, EU definition) 46.1 42.3 39.1 36.2 36.2 33.7 32.4 31.4 30.9 30.1 29.5 46.0 31.3
External indicatorsCurrent account (percent of GDP) -2.0 -6.2 -9.7 -6.1 -7.9 -5.8 -6.0 -6.0 -5.8 -5.9 -5.9 -5.4 -5.9Gross external debt (percent of GDP) 2/ 43.8 39.9 39.2 43.0 47.4 49.3 49.0 50.4 50.8 51.2 51.5 41.3 50.4Real effective exchange rate (CPI-based, level, average) 114.6 127.0 112.4 116.7 114.9 107.5 109.4 109.4 109.4 109.4 109.4 114.7 109.1
1/ The structural primary balance is estimated using the absorption gap method and excludes one-off operations.
(consolidated from daily data published by the CBRT).
Table 2. Turkey: Medium-Term Scenario, 2009–19
(Percent change, unless otherwise indicated)
Proj.
Sources: Turkish authorities; and IMF staff estimates and projections.
2/ The external debt ratio is calculated by dividing external debt numbers in U.S. dollars based on official Treasury figures by GDP in U.S. dollars calculated by staff using the average exchange rate
TURKEY
INTERN
ATION
ALM
ON
ETARYFU
ND
29

TURKEY
30 INTERNATIONAL MONETARY FUND
2009 2010 2011 2012 2013 2014 2015 2016 2017 2018 2019
Current account balance -12.1 -45.4 -75.1 -48.5 -65.1 -47.6 -51.9 -54.8 -56.0 -60.0 -63.6
Trade balance (incl. shuttle trade), net -24.9 -56.4 -89.1 -65.3 -80.0 -65.4 -69.9 -72.7 -75.4 -78.7 -82.3Exports of goods 109.6 120.9 143.4 163.2 163.4 173.6 181.3 191.5 202.9 215.5 228.1Imports of goods -134.5 -177.3 -232.5 -228.6 -243.4 -239.0 -251.2 -264.2 -278.3 -294.2 -310.4
of which Fuel imports -29.9 -38.5 -54.1 -60.1 -55.9 -53.9 -55.2 -57.9 -60.6 -63.8 -67.2
Services, net 18.6 16.7 20.2 22.6 23.1 25.1 26.2 27.8 29.5 31.5 33.4Credit 35.7 36.3 40.7 43.1 46.6 49.7 52.2 55.2 58.4 62.1 65.7
of which tourism receipts 23.0 22.6 25.1 25.3 28.0 0.0 0.0 0.0 0.0 0.0 0.0Debit -17.1 -19.6 -20.5 -20.5 -23.5 -24.6 -26.0 -27.4 -28.9 -30.6 -32.3
Income, net -8.3 -7.2 -7.9 -7.2 -9.4 -8.0 -8.9 -10.9 -11.6 -14.3 -16.2Credit 5.2 4.5 4.0 5.0 4.5 4.3 4.8 6.3 8.4 10.0 11.2Debit -13.5 -11.7 -11.8 -12.2 -13.9 -12.3 -13.7 -17.2 -20.0 -24.3 -27.4
of which interest -13.3 -11.5 -11.6 -11.9 -13.5 -11.9 -13.2 -16.6 -19.4 -23.7 -26.8
Private transfers, net 1.2 1.0 1.0 0.9 0.5 0.5 0.5 0.7 1.3 1.3 1.3Official transfers, net 1.2 0.6 0.8 0.6 0.6 0.2 0.2 0.2 0.2 0.2 0.2
Capital and financial account balance, excl. reserves 9.2 57.3 64.1 68.3 72.2 42.6 51.9 54.8 56.0 60.0 63.6Direct investment, net 1/ 7.1 7.6 13.8 9.2 9.8 9.1 14.9 18.1 20.5 23.5 25.6Portfolio investment, net 0.2 16.1 22.0 40.8 23.7 17.1 19.5 20.8 22.7 23.9 27.3
of which government eurobonds, net 1.8 4.1 2.5 4.8 4.6 4.8 4.7 4.9 4.6 4.9 5.0Other investment, net 1.9 33.7 28.4 18.4 38.8 16.4 17.6 15.9 12.8 12.6 10.7
of which short-term borrowings -3.7 13.4 9.4 7.5 13.0 3.4 6.3 2.5 2.6 0.7 0.8of which banks -2.8 12.0 6.9 4.9 11.8 3.1 5.6 2.0 2.1 0.2 0.2of which other sector -0.9 1.4 2.5 2.6 1.2 0.3 0.7 0.4 0.5 0.5 0.6
Errors and omissions 3.1 0.9 9.1 1.1 2.8 6.2 0.0 0.0 0.0 0.0 0.0
Overall balance, excl. reserves 0.1 12.8 -1.8 20.8 9.9 1.3 0.0 0.0 0.0 0.0 0.0
(percent of GDP)Current account balance -2.0 -6.2 -9.7 -6.1 -7.9 -5.8 -6.0 -6.0 -5.8 -5.9 -5.9Nonfuel current account balance 2.3 -1.8 -3.6 0.5 -1.9 0.0 -0.4 -0.5 -0.3 -0.5 -0.5Trade account balance (incl. shuttle trade) -4.0 -7.7 -11.5 -8.3 -9.7 -8.0 -8.1 -8.0 -7.8 -7.7 -7.6Capital and financial account balance 1.5 7.8 8.3 8.7 8.8 5.2 6.0 6.0 5.8 5.9 5.9Overall balance 0 2 0 3 1 0 0 0 0 0 0
(percent year-on-year)Export volume growth -5.4 3.2 5.5 16.8 -0.2 8.0 5.8 5.7 5.7 5.7 5.7Export value growth -18.3 8.1 17.1 12.1 1.8 6.3 4.6 5.6 6.0 6.2 5.9Import volume growth -15.4 20.2 10.1 0.0 9.4 0.6 6.9 5.7 5.7 5.7 5.7Import value growth -28.5 29.9 28.5 -1.6 7.2 -1.3 5.2 5.2 5.4 5.7 5.5Change in terms of trade 2.1 -3.1 -4.9 -2.5 4.1 0.2 0.5 0.4 0.6 0.4 0.3
Gross foreign reserves (CBRT) 2/In billions of U.S. dollars 74.8 86.1 88.4 119.4 130.3 135.3 135.3 135.3 135.3 135.3 135.3Net international reserves 57.3 63.4 51.9 53.4 47.1 47.2 47.2 47.2 47.2 47.2 47.2
Debt service ratio 3/ 39.8 34.8 26.6 24.7 25.4 22.6 23.2 23.3 23.4 24.2 24.7
Sources: Turkish authorities; and IMF staff estimates and projections.
1/ Including privatization receipts. 2/ The change in gross reserves in 2012 is likely to significantly exceed the overall BOP financing surplus, due to gold transactions between
domestic banks and the central bank which are not recorded in the BOP. 3/ Interest and amortization payment of medium- and long-term debt in percent of export receipts.
(Billions of U.S. dollars)
Table 3. Turkey: Summary of Balance of Payments, 2009–19
Proj.
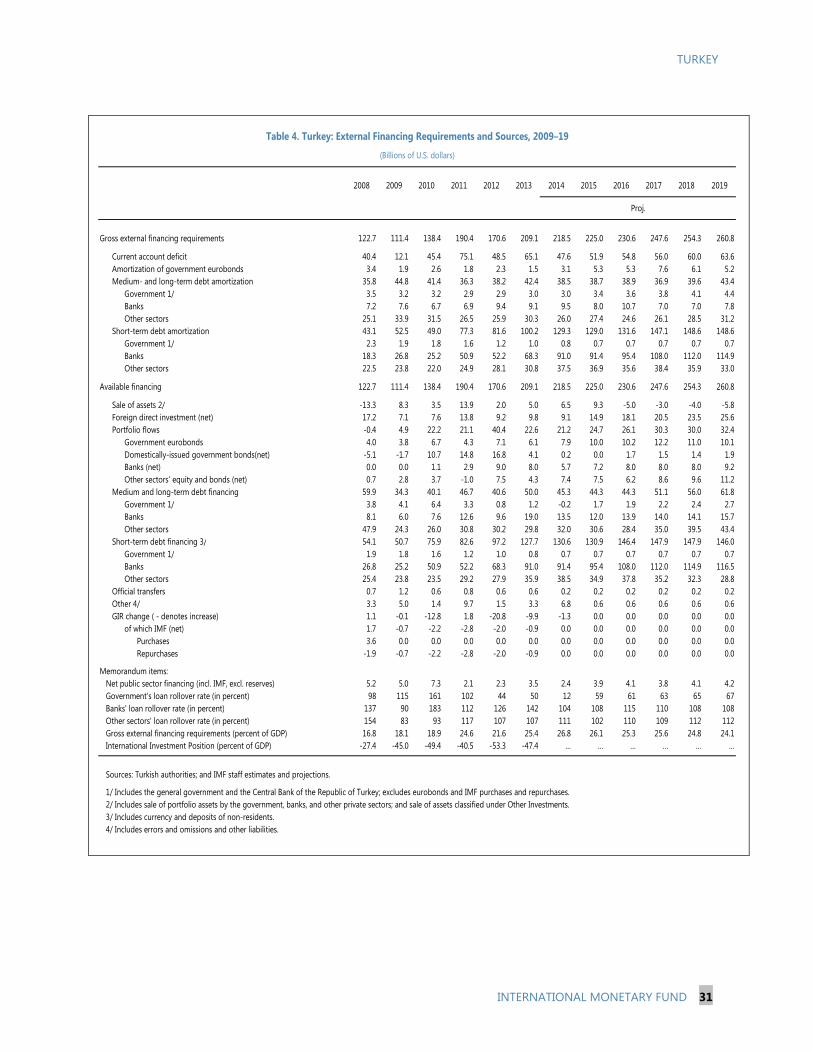
TURKEY
INTERNATIONAL MONETARY FUND 31
2008 2009 2010 2011 2012 2013 2014 2015 2016 2017 2018 2019
Gross external financing requirements 122.7 111.4 138.4 190.4 170.6 209.1 218.5 225.0 230.6 247.6 254.3 260.8
Current account deficit 40.4 12.1 45.4 75.1 48.5 65.1 47.6 51.9 54.8 56.0 60.0 63.6Amortization of government eurobonds 3.4 1.9 2.6 1.8 2.3 1.5 3.1 5.3 5.3 7.6 6.1 5.2Medium- and long-term debt amortization 35.8 44.8 41.4 36.3 38.2 42.4 38.5 38.7 38.9 36.9 39.6 43.4
Government 1/ 3.5 3.2 3.2 2.9 2.9 3.0 3.0 3.4 3.6 3.8 4.1 4.4Banks 7.2 7.6 6.7 6.9 9.4 9.1 9.5 8.0 10.7 7.0 7.0 7.8Other sectors 25.1 33.9 31.5 26.5 25.9 30.3 26.0 27.4 24.6 26.1 28.5 31.2
Short-term debt amortization 43.1 52.5 49.0 77.3 81.6 100.2 129.3 129.0 131.6 147.1 148.6 148.6Government 1/ 2.3 1.9 1.8 1.6 1.2 1.0 0.8 0.7 0.7 0.7 0.7 0.7Banks 18.3 26.8 25.2 50.9 52.2 68.3 91.0 91.4 95.4 108.0 112.0 114.9Other sectors 22.5 23.8 22.0 24.9 28.1 30.8 37.5 36.9 35.6 38.4 35.9 33.0
Available financing 122.7 111.4 138.4 190.4 170.6 209.1 218.5 225.0 230.6 247.6 254.3 260.8
Sale of assets 2/ -13.3 8.3 3.5 13.9 2.0 5.0 6.5 9.3 -5.0 -3.0 -4.0 -5.8Foreign direct investment (net) 17.2 7.1 7.6 13.8 9.2 9.8 9.1 14.9 18.1 20.5 23.5 25.6Portfolio flows -0.4 4.9 22.2 21.1 40.4 22.6 21.2 24.7 26.1 30.3 30.0 32.4
Government eurobonds 4.0 3.8 6.7 4.3 7.1 6.1 7.9 10.0 10.2 12.2 11.0 10.1Domestically-issued government bonds(net) -5.1 -1.7 10.7 14.8 16.8 4.1 0.2 0.0 1.7 1.5 1.4 1.9Banks (net) 0.0 0.0 1.1 2.9 9.0 8.0 5.7 7.2 8.0 8.0 8.0 9.2Other sectors' equity and bonds (net) 0.7 2.8 3.7 -1.0 7.5 4.3 7.4 7.5 6.2 8.6 9.6 11.2
Medium and long-term debt financing 59.9 34.3 40.1 46.7 40.6 50.0 45.3 44.3 44.3 51.1 56.0 61.8Government 1/ 3.8 4.1 6.4 3.3 0.8 1.2 -0.2 1.7 1.9 2.2 2.4 2.7Banks 8.1 6.0 7.6 12.6 9.6 19.0 13.5 12.0 13.9 14.0 14.1 15.7Other sectors 47.9 24.3 26.0 30.8 30.2 29.8 32.0 30.6 28.4 35.0 39.5 43.4
Short-term debt financing 3/ 54.1 50.7 75.9 82.6 97.2 127.7 130.6 130.9 146.4 147.9 147.9 146.0Government 1/ 1.9 1.8 1.6 1.2 1.0 0.8 0.7 0.7 0.7 0.7 0.7 0.7Banks 26.8 25.2 50.9 52.2 68.3 91.0 91.4 95.4 108.0 112.0 114.9 116.5Other sectors 25.4 23.8 23.5 29.2 27.9 35.9 38.5 34.9 37.8 35.2 32.3 28.8
Official transfers 0.7 1.2 0.6 0.8 0.6 0.6 0.2 0.2 0.2 0.2 0.2 0.2Other 4/ 3.3 5.0 1.4 9.7 1.5 3.3 6.8 0.6 0.6 0.6 0.6 0.6GIR change ( - denotes increase) 1.1 -0.1 -12.8 1.8 -20.8 -9.9 -1.3 0.0 0.0 0.0 0.0 0.0
of which IMF (net) 1.7 -0.7 -2.2 -2.8 -2.0 -0.9 0.0 0.0 0.0 0.0 0.0 0.0Purchases 3.6 0.0 0.0 0.0 0.0 0.0 0.0 0.0 0.0 0.0 0.0 0.0Repurchases -1.9 -0.7 -2.2 -2.8 -2.0 -0.9 0.0 0.0 0.0 0.0 0.0 0.0
Memorandum items:Net public sector financing (incl. IMF, excl. reserves) 5.2 5.0 7.3 2.1 2.3 3.5 2.4 3.9 4.1 3.8 4.1 4.2Government's loan rollover rate (in percent) 98 115 161 102 44 50 12 59 61 63 65 67Banks' loan rollover rate (in percent) 137 90 183 112 126 142 104 108 115 110 108 108Other sectors' loan rollover rate (in percent) 154 83 93 117 107 107 111 102 110 109 112 112Gross external financing requirements (percent of GDP) 16.8 18.1 18.9 24.6 21.6 25.4 26.8 26.1 25.3 25.6 24.8 24.1International Investment Position (percent of GDP) -27.4 -45.0 -49.4 -40.5 -53.3 -47.4 … … … … … …
Sources: Turkish authorities; and IMF staff estimates and projections.
1/ Includes the general government and the Central Bank of the Republic of Turkey; excludes eurobonds and IMF purchases and repurchases.2/ Includes sale of portfolio assets by the government, banks, and other private sectors; and sale of assets classified under Other Investments.3/ Includes currency and deposits of non-residents.4/ Includes errors and omissions and other liabilities.
Proj.
(Billions of U.S. dollars)
Table 4. Turkey: External Financing Requirements and Sources, 2009–19
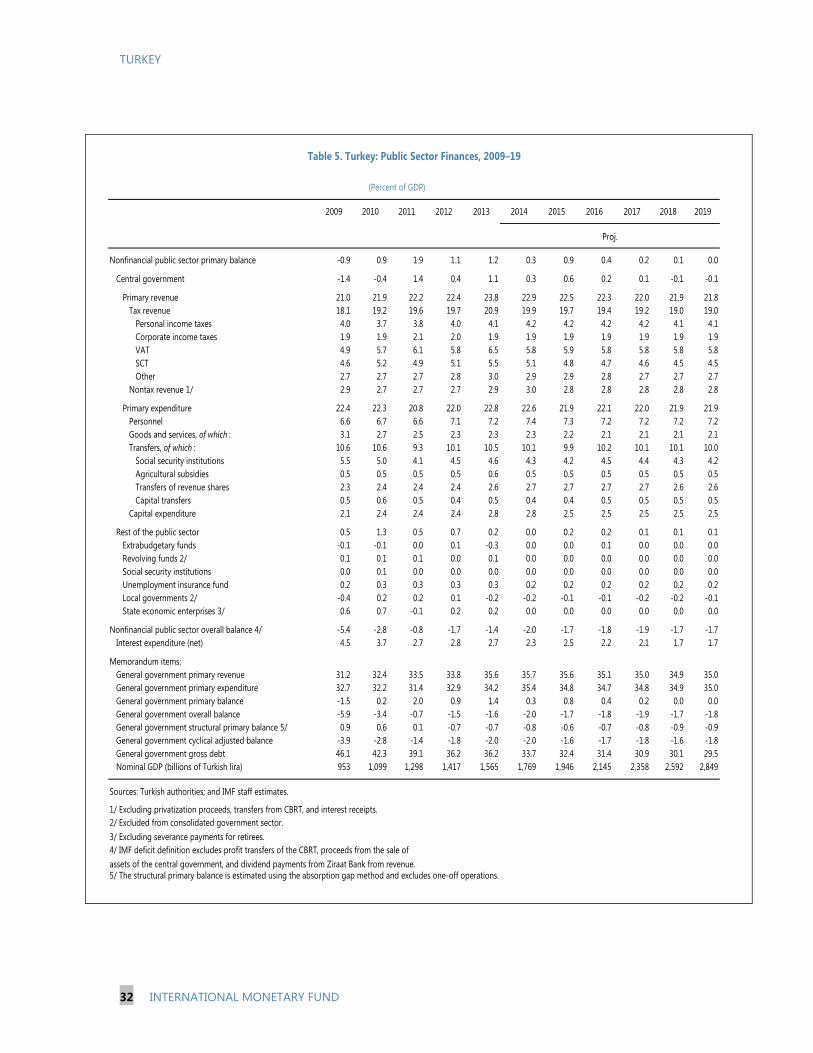
TURKEY
32 INTERNATIONAL MONETARY FUND
2009 2010 2011 2012 2013 2014 2015 2016 2017 2018 2019
Nonfinancial public sector primary balance -0.9 0.9 1.9 1.1 1.2 0.3 0.9 0.4 0.2 0.1 0.0
Central government -1.4 -0.4 1.4 0.4 1.1 0.3 0.6 0.2 0.1 -0.1 -0.1
Primary revenue 21.0 21.9 22.2 22.4 23.8 22.9 22.5 22.3 22.0 21.9 21.8Tax revenue 18.1 19.2 19.6 19.7 20.9 19.9 19.7 19.4 19.2 19.0 19.0 Personal income taxes 4.0 3.7 3.8 4.0 4.1 4.2 4.2 4.2 4.2 4.1 4.1 Corporate income taxes 1.9 1.9 2.1 2.0 1.9 1.9 1.9 1.9 1.9 1.9 1.9 VAT 4.9 5.7 6.1 5.8 6.5 5.8 5.9 5.8 5.8 5.8 5.8 SCT 4.6 5.2 4.9 5.1 5.5 5.1 4.8 4.7 4.6 4.5 4.5 Other 2.7 2.7 2.7 2.8 3.0 2.9 2.9 2.8 2.7 2.7 2.7Nontax revenue 1/ 2.9 2.7 2.7 2.7 2.9 3.0 2.8 2.8 2.8 2.8 2.8
Primary expenditure 22.4 22.3 20.8 22.0 22.8 22.6 21.9 22.1 22.0 21.9 21.9Personnel 6.6 6.7 6.6 7.1 7.2 7.4 7.3 7.2 7.2 7.2 7.2Goods and services, of which : 3.1 2.7 2.5 2.3 2.3 2.3 2.2 2.1 2.1 2.1 2.1Transfers, of which : 10.6 10.6 9.3 10.1 10.5 10.1 9.9 10.2 10.1 10.1 10.0
Social security institutions 5.5 5.0 4.1 4.5 4.6 4.3 4.2 4.5 4.4 4.3 4.2Agricultural subsidies 0.5 0.5 0.5 0.5 0.6 0.5 0.5 0.5 0.5 0.5 0.5Transfers of revenue shares 2.3 2.4 2.4 2.4 2.6 2.7 2.7 2.7 2.7 2.6 2.6Capital transfers 0.5 0.6 0.5 0.4 0.5 0.4 0.4 0.5 0.5 0.5 0.5
Capital expenditure 2.1 2.4 2.4 2.4 2.8 2.8 2.5 2.5 2.5 2.5 2.5
Rest of the public sector 0.5 1.3 0.5 0.7 0.2 0.0 0.2 0.2 0.1 0.1 0.1Extrabudgetary funds -0.1 -0.1 0.0 0.1 -0.3 0.0 0.0 0.1 0.0 0.0 0.0Revolving funds 2/ 0.1 0.1 0.1 0.0 0.1 0.0 0.0 0.0 0.0 0.0 0.0Social security institutions 0.0 0.1 0.0 0.0 0.0 0.0 0.0 0.0 0.0 0.0 0.0Unemployment insurance fund 0.2 0.3 0.3 0.3 0.3 0.2 0.2 0.2 0.2 0.2 0.2Local governments 2/ -0.4 0.2 0.2 0.1 -0.2 -0.2 -0.1 -0.1 -0.2 -0.2 -0.1State economic enterprises 3/ 0.6 0.7 -0.1 0.2 0.2 0.0 0.0 0.0 0.0 0.0 0.0
Nonfinancial public sector overall balance 4/ -5.4 -2.8 -0.8 -1.7 -1.4 -2.0 -1.7 -1.8 -1.9 -1.7 -1.7Interest expenditure (net) 4.5 3.7 2.7 2.8 2.7 2.3 2.5 2.2 2.1 1.7 1.7
Memorandum items:General government primary revenue 31.2 32.4 33.5 33.8 35.6 35.7 35.6 35.1 35.0 34.9 35.0General government primary expenditure 32.7 32.2 31.4 32.9 34.2 35.4 34.8 34.7 34.8 34.9 35.0General government primary balance -1.5 0.2 2.0 0.9 1.4 0.3 0.8 0.4 0.2 0.0 0.0General government overall balance -5.9 -3.4 -0.7 -1.5 -1.6 -2.0 -1.7 -1.8 -1.9 -1.7 -1.8General government structural primary balance 5/ 0.9 0.6 0.1 -0.7 -0.7 -0.8 -0.6 -0.7 -0.8 -0.9 -0.9General government cyclical adjusted balance -3.9 -2.8 -1.4 -1.8 -2.0 -2.0 -1.6 -1.7 -1.8 -1.6 -1.8General government gross debt 46.1 42.3 39.1 36.2 36.2 33.7 32.4 31.4 30.9 30.1 29.5Nominal GDP (billions of Turkish lira) 953 1,099 1,298 1,417 1,565 1,769 1,946 2,145 2,358 2,592 2,849
Sources: Turkish authorities; and IMF staff estimates.
5/ The structural primary balance is estimated using the absorption gap method and excludes one-off operations.
4/ IMF deficit definition excludes profit transfers of the CBRT, proceeds from the sale of assets of the central government, and dividend payments from Ziraat Bank from revenue.
Table 5. Turkey: Public Sector Finances, 2009–19
(Percent of GDP)
Proj.
1/ Excluding privatization proceeds, transfers from CBRT, and interest receipts.2/ Excluded from consolidated government sector.3/ Excluding severance payments for retirees.

TURKEY
INTERNATIONAL MONETARY FUND 33
2009 2010 2011 2012 2013 2014Q2 1/
Balance Sheet
Total Assets 87.6 91.6 93.8 96.7 110.7 103.5
o/w Gross Loans 41.2 47.9 52.6 56.1 66.9 63.5
Liabilities 75.9 79.4 82.7 83.9 98.3 91.3
o/w Deposits 54.0 56.2 53.6 54.5 60.4 55.1
Shareholders' Equity 11.6 12.2 11.1 12.8 12.4 12.1
Off-Balance Sheet
Commitments 46.8 79.6 111.4 121.4 103.9 95.3
Contingencies 14.1 14.9 16.8 17.0 21.3 19.8
Asset Quality Percent
NPLs / Gross Loans 5.3 3.7 2.7 2.9 2.7 2.8
Provisions / Gross NPLs 83.6 83.8 79.4 75.2 76.4 74.8
Credit growth 6.9 33.9 29.9 16.4 31.8 16.1
Profitability
Net Interest Income / Interest Bearing Assets (av) 2/ 11.8 9.1 8.2 9.1 7.6 16.7
Cost / Income (Efficiency) 26.2 29.7 31.7 30.9 34.5 30.8
ROAA 2.6 2.5 1.7 1.8 1.6 3.5
ROAE 22.9 20.1 15.5 15.7 14.2 27.5
Funding and Liquidity
Loan-to-Deposit ratio 76.3 85.2 98.2 102.9 110.7 115.3
Loan-to-Deposit ratio (FX) 60.3 77.4 84.1 82.0 83.8 85.2
Non-Core / Core Liabilities 3/ 40.5 41.3 54.3 53.6 62.6 65.5
Non-Core / Core Liabilities (FX) 3/ 51.7 66.8 87.2 90.8 103.4 106.7
Leverage Ratio 4/ 8.0 7.2 5.8 5.4 5.4 5.6
Liquid Assets / Assets 27.2 28.2 26.2 26.0 24.3 23.9
Assets / Liabilities (3 months, int. sensitive) 79.6 72.5 71.5 80.1 78.3 74.4
Capital Adequacy
CAR 20.6 19.0 16.5 17.9 15.3 16.3
T1R 18.6 17.0 14.9 15.1 13.0 14.0
RWA / Assets 67.0 72.0 78.4 80.1 84.3 83.7
FX Risk
FX Assets / FX Liabilities (on-balance sheet) 5/ 93.4 92.9 92.2 94.0 91.0 89.7
NOP / Regulatory Capital 0.5 0.1 0.4 2.0 -0.6 2.0
Unhedged NOP / Regulatory Capital -14.9 -15.6 -21.3 -14.0 -28.9 -30.4
Miscellaneous
Nominal GDP (TL billion) 1/ 953 1,099 1,298 1,417 1,565 1,769
Deposit Interest Rate (Percent) 8.8 7.9 10.0 7.2 8.1 9.1
Loan Interest Rate (Percent) 17.1 12.3 14.2 15.3 11.8 14.9
Sources: Banking Regulation and Supervison Agency, and IMF staff calculation.1/ Current year data are annualized.2/ Net of NPL provisions.3/ Core liabilities include deposits and shareholders' equity.4/ T1 Capital over average balance sheet assets, net of specific provisions, and off-balance sheets exposures.5/ Including FX-indexed assets and liabilities.
(Percent of GDP)
Table 6a. Turkey: Banking System at a Glance 2009–14
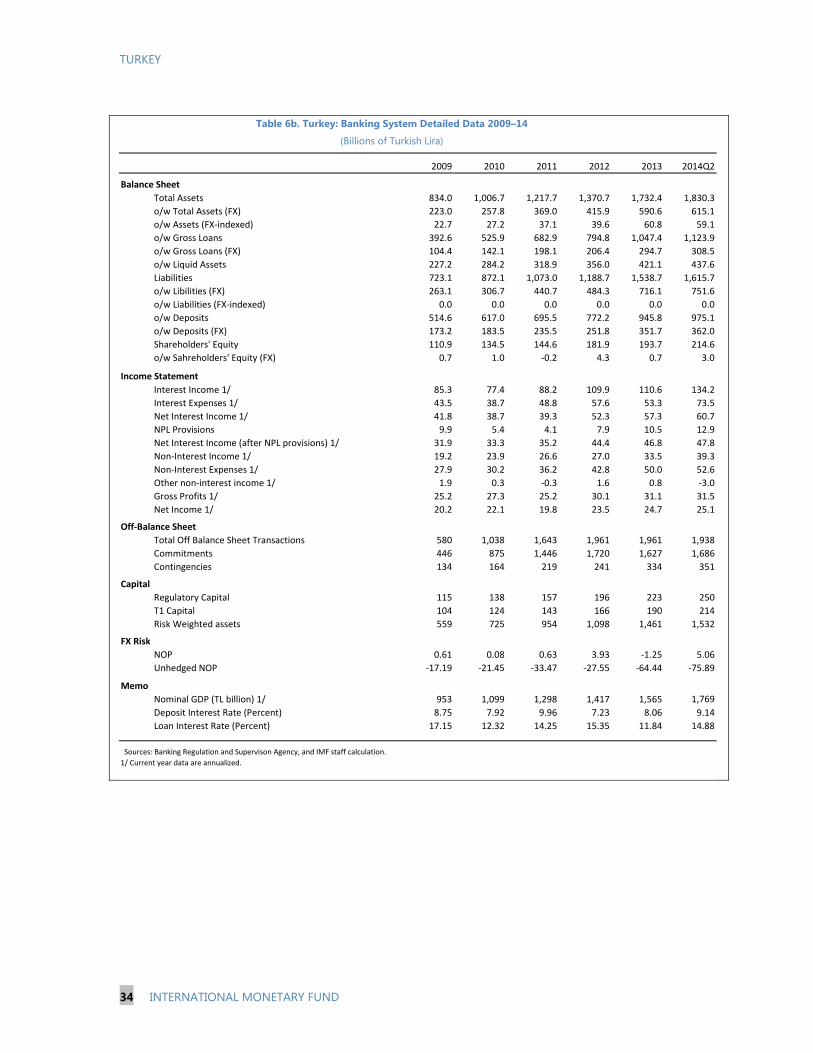
TURKEY
34 INTERNATIONAL MONETARY FUND
2009 2010 2011 2012 2013 2014Q2
Balance Sheet
Total Assets 834.0 1,006.7 1,217.7 1,370.7 1,732.4 1,830.3
o/w Total Assets (FX) 223.0 257.8 369.0 415.9 590.6 615.1
o/w Assets (FX-indexed) 22.7 27.2 37.1 39.6 60.8 59.1
o/w Gross Loans 392.6 525.9 682.9 794.8 1,047.4 1,123.9
o/w Gross Loans (FX) 104.4 142.1 198.1 206.4 294.7 308.5
o/w Liquid Assets 227.2 284.2 318.9 356.0 421.1 437.6
Liabilities 723.1 872.1 1,073.0 1,188.7 1,538.7 1,615.7
o/w Libilities (FX) 263.1 306.7 440.7 484.3 716.1 751.6
o/w Liabilities (FX-indexed) 0.0 0.0 0.0 0.0 0.0 0.0
o/w Deposits 514.6 617.0 695.5 772.2 945.8 975.1
o/w Deposits (FX) 173.2 183.5 235.5 251.8 351.7 362.0
Shareholders' Equity 110.9 134.5 144.6 181.9 193.7 214.6
o/w Sahreholders' Equity (FX) 0.7 1.0 -0.2 4.3 0.7 3.0
Income Statement
Interest Income 1/ 85.3 77.4 88.2 109.9 110.6 134.2
Interest Expenses 1/ 43.5 38.7 48.8 57.6 53.3 73.5
Net Interest Income 1/ 41.8 38.7 39.3 52.3 57.3 60.7
NPL Provisions 9.9 5.4 4.1 7.9 10.5 12.9
Net Interest Income (after NPL provisions) 1/ 31.9 33.3 35.2 44.4 46.8 47.8
Non-Interest Income 1/ 19.2 23.9 26.6 27.0 33.5 39.3
Non-Interest Expenses 1/ 27.9 30.2 36.2 42.8 50.0 52.6
Other non-interest income 1/ 1.9 0.3 -0.3 1.6 0.8 -3.0
Gross Profits 1/ 25.2 27.3 25.2 30.1 31.1 31.5
Net Income 1/ 20.2 22.1 19.8 23.5 24.7 25.1
Off-Balance Sheet
Total Off Balance Sheet Transactions 580 1,038 1,643 1,961 1,961 1,938
Commitments 446 875 1,446 1,720 1,627 1,686
Contingencies 134 164 219 241 334 351
Capital
Regulatory Capital 115 138 157 196 223 250
T1 Capital 104 124 143 166 190 214
Risk Weighted assets 559 725 954 1,098 1,461 1,532
FX Risk
NOP 0.61 0.08 0.63 3.93 -1.25 5.06
Unhedged NOP -17.19 -21.45 -33.47 -27.55 -64.44 -75.89
Memo
Nominal GDP (TL billion) 1/ 953 1,099 1,298 1,417 1,565 1,769
Deposit Interest Rate (Percent) 8.75 7.92 9.96 7.23 8.06 9.14
Loan Interest Rate (Percent) 17.15 12.32 14.25 15.35 11.84 14.88
Table 6b. Turkey: Banking System Detailed Data 2009–14
(Billions of Turkish Lira)
Sources: Banking Regulation and Supervison Agency, and IMF staff calculation.
1/ Current year data are annualized.
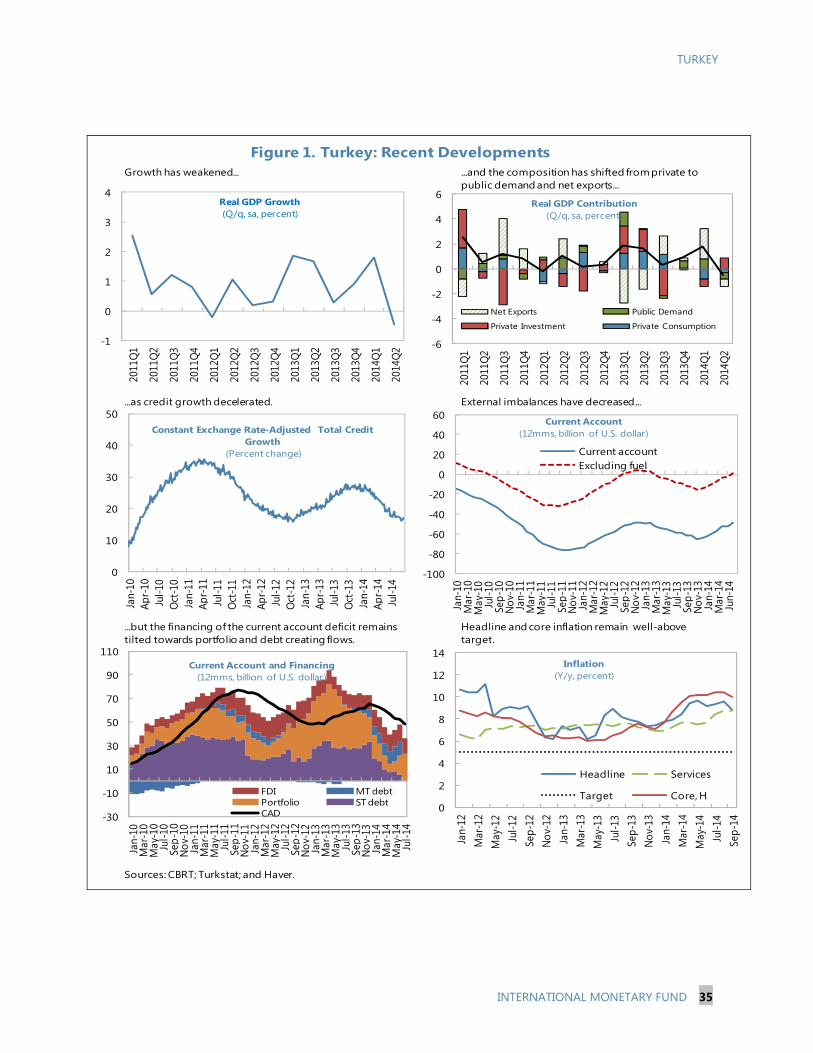
TURKEY
INTERNATIONAL MONETARY FUND 35
0
10
20
30
40
50
Jan-
10Ap
r-10
Jul-1
0O
ct-1
0Ja
n-11
A pr-
11Ju
l-11
Oct
-11
Jan-
12A p
r-12
Jul-1
2O
ct-1
2Ja
n-13
A pr-
13Ju
l-13
Oct
-13
Jan-
14A p
r-14
Jul-1
4
Constant Exchange Rate-Adjusted Total Credit Growth
(Percent change)
Figure 1. Turkey: Recent Developments
Sources: CBRT; Turkstat; and Haver.
-1
0
1
2
3
4
2011
Q1
2011
Q2
2011
Q3
2011
Q4
2012
Q1
2012
Q2
2012
Q3
2012
Q4
2013
Q1
2013
Q2
2013
Q3
2013
Q4
2014
Q1
2014
Q2
Real GDP Growth(Q/q, sa, percent)
-6
-4
-2
0
2
4
6
2011
Q1
2011
Q2
2011
Q3
2011
Q4
2012
Q1
2012
Q2
2012
Q3
2012
Q4
2013
Q1
2013
Q2
2013
Q3
2013
Q4
2014
Q1
2014
Q2
Net Exports Public Demand
Private Investment Private Consumption
Real GDP Contribution(Q/q, sa, percent)
-100
-80
-60
-40
-20
0
20
40
60
Jan-
10M
ar-1
0M
a y-1
0Ju
l-10
Sep-
10N
ov-1
0Ja
n-11
Mar
-11
Ma y
-11
Jul-1
1Se
p-11
Nov
-11
Jan-
12M
ar-1
2M
a y-1
2Ju
l-12
Sep-
12N
ov-1
2Ja
n-13
Mar
-13
Ma y
-13
Jul-1
3Se
p-13
Nov
-13
Jan-
14M
ar-1
4Ju
n-14
Current accountExcluding fuel
Current Account(12mms, billion of U.S. dollar)
-30
-10
10
30
50
70
90
110
Jan-
10M
ar-1
0M
ay-1
0Ju
l-10
Sep-
10N
ov-1
0Ja
n-11
Mar
-11
May
-11
Jul-1
1Se
p-11
Nov
-11
Jan-
12M
ar-1
2M
ay-1
2Ju
l-12
Sep-
12N
ov-1
2Ja
n-13
Mar
-13
May
-13
Jul-1
3Se
p-13
Nov
-13
Jan-
14M
ar-1
4M
ay-1
4Ju
l-14
FDI MT debtPortfolio ST debtCAD
Current Account and Financing (12mms, billion of U.S. dollar)
Growth has weakened... ...and the composition has shifted from private to public demand and net exports...
...as credit growth decelerated. External imbalances have decreased...
...but the financing of the current account deficit remains tilted towards portfolio and debt creating flows.
Headline and core inflation remain well-above target.
0
2
4
6
8
10
12
14
Jan-
12M
ar-1
2M
ay-1
2Ju
l-12
Sep-
12N
ov-1
2Ja
n-13
Mar
-13
May
-13
Jul-1
3Se
p-13
Nov
-13
Jan-
14M
ar-1
4M
ay-1
4Ju
l-14
Sep-
14
Headline Services
Target Core, H
Inflation(Y/y, percent)

TURKEY
36 INTERNATIONAL MONETARY FUND
0
2
4
6
8
10
12
14
0
2
4
6
8
10
12
14M
ay-1
3Ju
n-13
Jul-1
3Au
g-13
Sep-
13O
ct-1
3N
ov-1
3D
ec-1
3Ja
n-14
Feb-
14M
ar-1
4Ap
r-14
May
-14
Jun-
14Ju
l-14
Aug-
14Se
p-14
Interest RatesCBRT weighted avg. funding cost (5-day MA)CBRT overnight borrowing rateCBRT one-week repo rateCBRT overnight lending rate
2.0
2.1
2.2
2.3
2.4
2.5
2.6
2.7
2.8
2.9
4
5
6
7
8
9
10
11
12
13
May
-13
Jun-
13Ju
l-13
Aug-
13Se
p-13
Oct
-13
Nov
-13
Dec
-13
Jan-
14Fe
b-14
Mar
-14
Apr-
14M
ay-1
4Ju
n-14
Jul-1
4Au
g-14
Sep-
14
Exchange Rate and Benchmark bond
Benchmark bond rate
US-euro basket exchange rate (rhs) 1/
0
20
40
60
80
100
120
140
160
Jan-
08M
ay-0
8Au
g-08
Dec
-08
Apr-
09Au
g-09
Dec
-09
Apr-
10Au
g-10
Dec
-10
Apr-
11Au
g-11
Dec
-11
Apr-
12Au
g-12
Dec
-12
Apr-
13Au
g-13
Dec
-13
Apr-
14Au
g-14
GIR NIR
International Reserves(Billion of U.S. dollar)
0
20
40
60
80
100
120
140
2009 2010 2011 2012 2013 2014Q1
Gross International Reserves (Percent of relevant metric)
Fund's MetricST debt
7
8
9
10
11
12
13
Feb-
14
Mar
-14
Apr-
14
May
-14
Jun-
14
Jul-1
4
Aug-
14
Sep-
14
Oct
-14
Interest Rates
CBRT overnight borrowing rateCBRT one-week repo rateCBRT weighted avg. funding cost (5-day MA)CBRT overnight lending rate
-1500
-1300
-1100
-900
-700
-500
-300
-100
100
300
500
May
-13
Jun-
13Ju
l-13
Aug-
13Se
p-13
Oct
-13
Nov
-13
Dec
-13
Jan-
14Fe
b-14
Mar
-14
Apr-
14M
ay-1
4Ju
n-14
Jul-1
4Au
g-14
Sep-
14
Daily FX Auctions(U$ million, negative denotes FX sale)
Figure 2. Turkey: Monetary Policy and Financial Markets
Sources: Haver; CBRT; BRSA; and IMF staff estimates.1/ Lira per equal-weight euro/dollar basket.
The CBRT tightened in January 2014...
...though only on a gross basis, with net reserves still low.
...and has been selling FX reserves instead of rebuilding buffers.
...when exchange rate pressure rose.
Reserves remain constant...
The CBRT progressively relaxed the monetary stance since May...

TURKEY
INTERNATIONAL MONETARY FUND 37
Figure 3. Turkey: Fiscal Stance
Source: Fund staff estimates.
-9
-6
-3
0
3
Dec
-08
Apr
-09
Aug
-09
Jan-
10M
ay-1
0Se
p-1
0
Feb-
11Ju
n-11
Oct
-11
Mar
-12
Jul-1
2
Dec
-12
Apr
-13
Aug
-13
Jan-
14M
ay-1
4
Central Government Overall Balance (12-month cumulative, percent of GDP)
0
5
10
15
20
25
30
Dec
-10
Feb-
11A
pr-1
1Ju
n-11
Aug-
11O
ct-1
1D
ec-1
1Fe
b-12
Apr
-12
Jun-
12Au
g-12
Oct
-12
Dec
-12
Feb-
13A
pr-1
3Ju
n-13
Aug-
13O
ct-1
3D
ec-1
3Fe
b-14
Apr
-14
Jun-
14Au
g-14
Central Gov. Revenue(y/y, percent, 12-month moving average)
0
10
20
30
40
50
60
Dec
-10
Feb
-11
Apr-
11Ju
n-11
Aug
-11
Oct
-11
Dec
-11
Feb
-12
Apr-
12Ju
n-12
Aug
-12
Oct
-12
Dec
-12
Feb
-13
Apr-
13Ju
n-13
Aug
-13
Oct
-13
Dec
-13
Feb
-14
Apr-
14Ju
n-14
Aug
-14
VAT
VAT imports
VAT Components (y/y, percent, 12-month moving average)
-2
0
2
4
6
8
2002
2003
2004
2005
2006
2007
2008
2009
2010
2011
2012
2013
Central Gvt Local Gvt SOEs Other
NFPS Primary Surplus by Subsector(12 rolling months , percent of GDP)
NFPS Primary Surplus
0
15
30
45
60
75
90
2000
2001
2002
2003
2004
2005
2006
2007
2008
2009
2010
2011
2012
2013
Non-Financial Public Sector Gross Debt (Percent of GDP)
Deficits remain contained... ...with double digit total revenue growth...
...despite deceleration of VAT and other domestic demand-linked revenues...
...while expenditure growth remains elevated.
Public debt ratios remain comfortable... ...a legacy of strong efforts in the last decade, notably at the central government level.
5
10
15
20
25
Dec
-10
Feb-
11A
pr-1
1Ju
n-11
Aug-
11O
ct-1
1D
ec-1
1Fe
b-12
Apr
-12
Jun-
12Au
g-12
Oct
-12
Dec
-12
Feb-
13A
pr-1
3Ju
n-13
Aug-
13O
ct-1
3D
ec-1
3Fe
b-14
Apr
-14
Jun-
14Au
g-14
Central Gov. Primary Expenditure(y/y, percent, 12-month moving average)

TURKEY
38 INTERNATIONAL MONETARY FUND
14
15
16
17
18
19
20
21
22
Jan-
08A
pr-
08Ju
l-08
Oct
-08
Feb
-09
May
-09
Aug
-09
Dec
-09
Mar
-10
Jun-
10O
ct-1
0Ja
n-11
Ap
r-11
Aug
-11
No
v-11
Feb
-12
Jun-
12Se
p-1
2D
ec-1
2A
pr-
13Ju
l-13
Oct
-13
Jan-
14M
ay-1
4
Capital Adequacy Ratio(Percent)
-20
-10
0
10
20
30
40
50
60
70
-20
-10
0
10
20
30
40
50
60
70
Jan-
08A
pr-
08Ju
l-08
Oct
-08
Jan-
09A
pr-
09A
u g-0
9N
ov-
09Fe
b-1
0M
ay-1
0A
u g-1
0N
ov-
10M
ar-1
1Ju
n-11
Sep
-11
Dec
-11
Mar
-12
Jun-
12Se
p-1
2Ja
n-13
Ap
r-13
Jul-
13O
ct-1
3Ja
n-14
Ap
r-14
Jul-
14Constant Exchange Rate-Adjusted Total Credit
Growth (Percent change)
y/y
13-w ma, annualized (rhs)
2.0
2.5
3.0
3.5
4.0
4.5
5.0
5.5
6.0
6.5
Jan-
08A
pr-
08Ju
l-08
Oct
-08
Jan-
09A
pr-
09Ju
l-09
Oct
-09
Jan-
10A
pr-
10Ju
l-10
Oct
-10
Jan-
11A
pr-
11Ju
l-11
Oct
-11
Jan-
12A
pr-
12Ju
l-12
Oct
-12
Jan-
13A
pr-
13Ju
l-13
Oct
-13
Jan-
14A
pr-
14Ju
l-14
NPLs(Percent of total loans)
1.0
1.5
2.0
2.5
3.0
3.5
4.0
1012141618202224262830
Jan-
08A
pr-
08Ju
l-08
Oct
-08
Jan-
09A
pr-
09A
u g-0
9N
ov-
09Fe
b-1
0M
a y-1
0A
u g-1
0D
ec-1
0M
ar-1
1Ju
n-11
Sep
-11
Dec
-11
Ap
r-12
Jul-
12O
ct-1
2Ja
n-13
Ap
r-13
Jul-
13N
ov-
13Fe
b-1
4M
a y-1
4
ROE
ROA (rhs)
Return on Assets/Equity(Annualized,)
Profitability has worsened in recent months...NPL ratios remain near lows despite recently edging up.
Figure 4. Turkey: Financial Sector
0
20
40
60
80
100
120
140
0
20
40
60
80
100
120
140
160
2006
2007
2008
2009
2010
2011
2012
2013
Mar
-14
Bank Debt Abroad By Maturity(Billions of U.S. dollars)
More than one yearUp to one yearLoan-to-deposit (percent, rhs)
-60
-40
-20
0
20
40
60
Jan-
08A
pr-
08Ju
l-08
Oct
-08
Jan-
09A
pr-
09Ju
l-09
Oct
-09
Jan-
10A
pr-
10Ju
l-10
Oct
-10
Jan-
11A
pr-
11Ju
l-11
Oct
-11
Jan-
12A
pr-
12Ju
l-12
Oct
-12
Jan-
13A
pr-
13Ju
l-13
Oct
-13
Jan-
14A
pr-
14Ju
l-14
Total
On balance sheet
Off balance sheet
Net FX Position(Billions of U.S. dollars)
...while capital ratios remain well-above regulatory minima but are declining.
...and credit growth has slowed...
The loan-to-deposit ratio is increasing with lending financed from abroad.
Banks are leveraging in FX to maintain profitability, albeit positions are fully hedged.
Sources: BRSA; and CBRT.
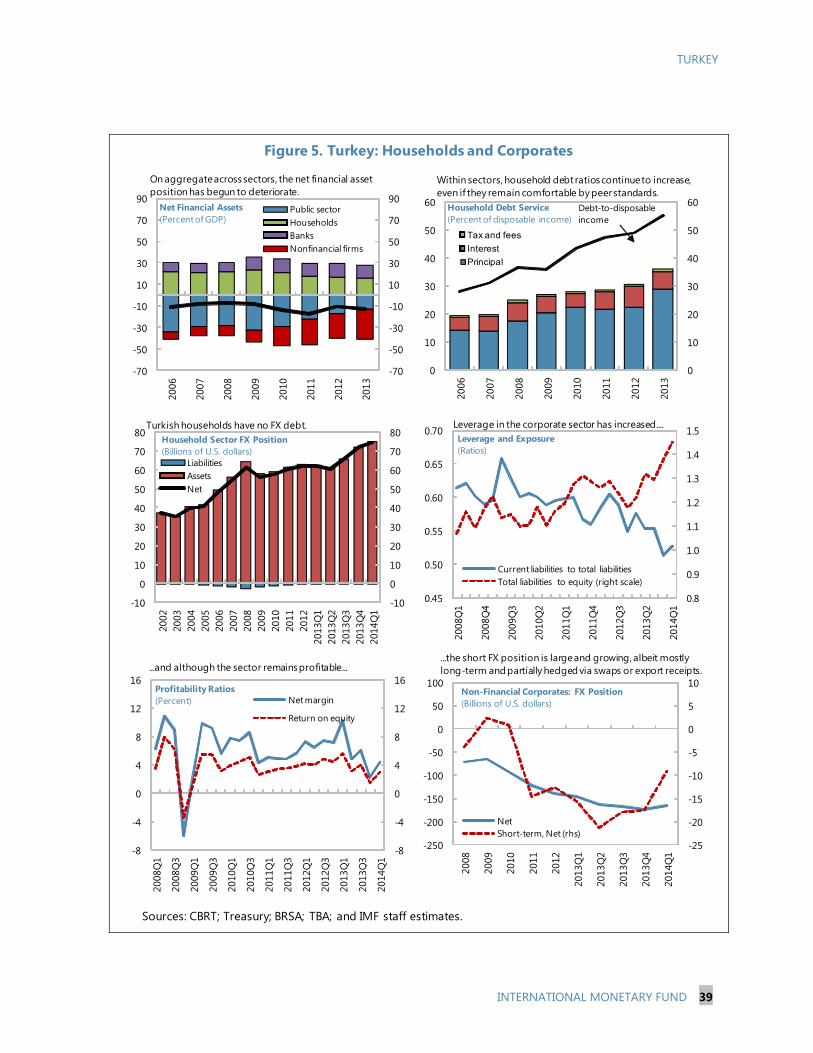
TURKEY
INTERNATIONAL MONETARY FUND 39
Figure 5. Turkey: Households and Corporates
Sources: CBRT; Treasury; BRSA; TBA; and IMF staff estimates.
-70
-50
-30
-10
10
30
50
70
90
-70
-50
-30
-10
10
30
50
70
90
2006
2007
2008
2009
2010
2011
2012
2013
Public sectorHouseholdsBanksNonfinancial firms
Net Financial Assets(Percent of GDP)
0
10
20
30
40
50
60
0
10
20
30
40
50
60
2006
2007
2008
2009
2010
2011
2012
2013
Tax and fees
Interest
Principal
Household Debt Service(Percent of disposable income)
Debt-to-disposableincome
-10
0
10
20
30
40
50
60
70
80
-10
0
10
20
30
40
50
60
70
80
2002
2003
2004
2005
2006
2007
2008
2009
2010
2011
2012
2013
Q1
2013
Q2
2013
Q3
2013
Q4
2014
Q1
LiabilitiesAssetsNet
Household Sector FX Position(Billions of U.S. dollars)
0.8
0.9
1.0
1.1
1.2
1.3
1.4
1.5
0.45
0.50
0.55
0.60
0.65
0.70
2008
Q1
2008
Q4
2009
Q3
2010
Q2
2011
Q1
2011
Q4
2012
Q3
2013
Q2
2014
Q1
Current liabilities to total liabilitiesTotal liabilities to equity (right scale)
Leverage and Exposure(Ratios)
-8
-4
0
4
8
12
16
-8
-4
0
4
8
12
16
2008
Q1
2008
Q3
2009
Q1
2009
Q3
2010
Q1
2010
Q3
2011
Q1
2011
Q3
2012
Q1
2012
Q3
2013
Q1
2013
Q3
2014
Q1
Net margin
Return on equity
Profitability Ratios(Percent)
Within sectors, household debt ratios continue to increase, even if they remain comfortable by peer standards.
Turkish households have no FX debt.
...and although the sector remainsprofitable...
Leverage in the corporate sector has increased....
...the short FX position is large and growing, albeit mostly long-term and partially hedged via swaps or export receipts.
On aggregate across sectors, the net financial asset position has begun to deteriorate.
-25
-20
-15
-10
-5
0
5
10
-250
-200
-150
-100
-50
0
50
100
2008
2009
2010
2011
2012
2013
Q1
2013
Q2
2013
Q3
2013
Q4
2014
Q1
NetShort-term, Net (rhs)
Non-Financial Corporates: FX Position(Billions of U.S. dollars)
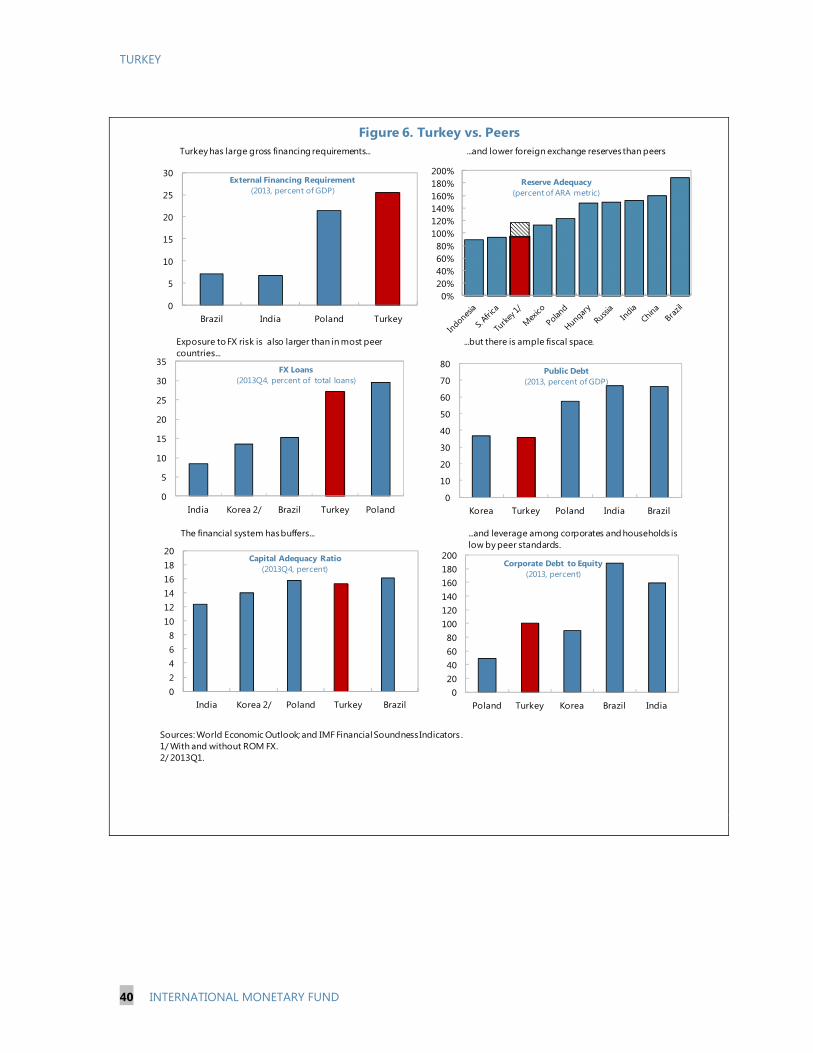
TURKEY
40 INTERNATIONAL MONETARY FUND
Figure 6. Turkey vs. Peers
Sources: World Economic Outlook; and IMF Financial Soundness Indicators .1/ With and without ROM FX.2/ 2013Q1.
0
5
10
15
20
25
30
Brazil India Poland Turkey
External Financing Requirement(2013, percent of GDP)
0
10
20
30
40
50
60
70
80
Korea Turkey Poland India Brazil
Public Debt(2013, percent of GDP)
02468
101214161820
India Korea 2/ Poland Turkey Brazil
Capital Adequacy Ratio (2013Q4, percent)
020406080
100120140160180200
Poland Turkey Korea Brazil India
Corporate Debt to Equity(2013, percent)
0
5
10
15
20
25
30
35
India Korea 2/ Brazil Turkey Poland
FX Loans(2013Q4, percent of total loans)
Exposure to FX risk is also larger than in most peer countries...
Turkey has large gross financing requirements... ...and lower foreign exchange reservesthan peers
...but there is ample fiscal space.
The financial system has buffers... ...and leverage among corporates and households is low by peer standards.
0%20%40%60%80%
100%120%140%160%180%200%
Reserve Adequacy(percent of ARA metric)
TURKEY
INTERNATIONAL MONETARY FUND 41
.
Annex I. Public Debt Sustainability At about to 35 percent of GDP (measured as general government gross debt according to Maastricht criteria), Turkey’s public debt ratio is well below its historical ten-year average. Gross public sector financing needs are about 10 percent of GDP, and will remain high at about 7 percent of GDP over the medium term. The DSA suggests that Turkey’s government debt is sustainable even under different shock scenarios. Given the debt structure (average maturity of 6 years, 64 percent of total debt at fixed interest rates, and only 31 percent of the debt in foreign exchange) the direct interest and exchange rate pass-through to the budget is relatively slow. Only the impact of lower GDP growth rates represents a significant threat to debt dynamic. While all public debt profile indicators are below early warning benchmarks, the high external financing requirements point to risks arising from the external debt position.
Baseline and Realism of Projections1
Debt-levels. Turkey’s favorable debt dynamics are underpinned by a primary surplus and trend GDP growth above the real interest rate. A higher-than-projected fiscal effort in 2013 was more than compensated by the impact of a weaker than envisaged currency, leading to a slightly higher debt to GDP ratio than previously envisaged. Nonetheless, staff forecast that the ratio will continue its declining path from already moderate levels reaching 29.5 percent in 2019—down by 6.7 pp since end-2013. At 10 percent of GDP in 2013, gross public financing needs have decline from 18.4 percent on average for 2003–2011—but will remain high by the end of the projection period.
Growth. Past projections of growth outcomes show high forecast errors, possibly due to high volatility of GDP in Turkey, but don’t seem to have a systematic bias that undermine the assessment of sustainability. The current growth projections are below those of a year ago, which lessens their positive impact in reducing the level of debt. The output gap is roughly closed in 2014, and is projected to remain closed over the medium term. Turkey’s debt is highly sensitive to big swings in GDP growth, highlighting the relevance of growth shocks in the stress tests.
Sovereign yields. While Turkey’s yields remain quite volatile, they have decline from the levels in the first quarter of 2014. The spreads against the US bonds in the last three months remained on average at 217 bps, higher than its lowest value of 118 bps observed in May 2013. The effective interest rate is forecast to decline from 10 percent in 2013 to 8.8 percent in 2014. In the medium term, the effect of lower inflation will counter the push from international rates yielding slightly lower rates.
1 The new DSA framework is described in (http://www.imf.org/external/np/pp/eng/2013/050913.pdf).
TURKEY
42 INTERNATIONAL MONETARY FUND
Fiscal adjustment. In the baseline the structural primary balance deteriorates due to lower structural revenues and the primary spending drift linked to increasing budget rigidities. The maximum projected 3-year adjustment of the cyclically-adjusted primary balance is close to zero.
Maturity and rollover. Given current debt structure (average maturity of 6 years, 64 percent share of fixed interest debt to total debt, and only 31 percent denominated in foreign currency), the direct interest and exchange rate pass-through to the budget are small.
Shocks and Stress Tests
Primary balance shock. A deterioration of 1.0pp of GDP in the primary balance for 2 years delays by 2 years the downward trend of debt-to-GDP ratio relative to the baseline. Sovereign borrowing costs are pushed up (25 bps for each 1 percent of GDP worsening in the primary balance). The impact on the debt-to-GDP ratio and gross financing needs levels by 2019 is modest.
Growth shock. Real output growth rates are lowered by 1 standard deviation, or 4.6 percentage points, for 2 years starting in 2015. The decline in growth leads to lower inflation (0.25 percentage points per 1 percentage point decrease in GDP growth). The nominal primary balance deteriorates significantly compared to the baseline as nominal revenues fall against unchanged expenditure plans, reaching -3.7 percent of GDP by 2016. The deterioration in primary balance leads to higher sovereign borrowing costs (see above). The debt-to-GDP ratio increases to about 42 percent during the growth shock and then gradually trends down. By the end of the period, gross public financing needs climb toward 10 percent of GDP.
Interest rate shock. The real effective rate reaches similar levels as in 2009, which implies a permanent increase in spreads by 682bps. The government’s interest bill climbs reaching an implicit average interest rate of 12.2 percent by 2019. The debt-to-GDP ratio remains at low levels reaching just 32.6 percent in 2019, and gross public financing needs reach around 11½ percent of GDP by 2019.
Contingent liability shock. A one-time bail out of the financial sector is assumed to increase non-interest expenditures by 10 percent of banking sector assets.2 This is combined with real GDP growth shock (1 standard deviation for 2 years). Sovereign borrowing costs are pushed up (25 bps for each 1 percent of GDP worsening in the primary balance) while
2 This shock is equivalent to 5.4 percent of GDP. The shock could also be seen to cover (a combination of) other
contingencies, part of which could be a bailout of PPP projects. PPP projects with treasury investment guarantees
amount to 0.9 percent of GDP, while treasury guaranteed loans (outside the general government) amount to 1.2
percent of GDP.

TURKEY
INTERNATIONAL MONETARY FUND 43
inflation declines (0.25 percentage points per 1 percentage point decrease in GDP growth). Debt rises to 42 percent of GDP in 2016 and then gradually declines. Gross public financing needs increase to about 10 percent of GDP in the medium term.
Combined shock. A combined shock incorporates the largest effect of individual shocks on all relevant variables (real GDP growth, inflation, primary balance, exchange rate and interest rate). In the case of Turkey, a combined shock would increase debt to around 46.5 percent of GDP, still below the average debt level between 2003 and 2011.
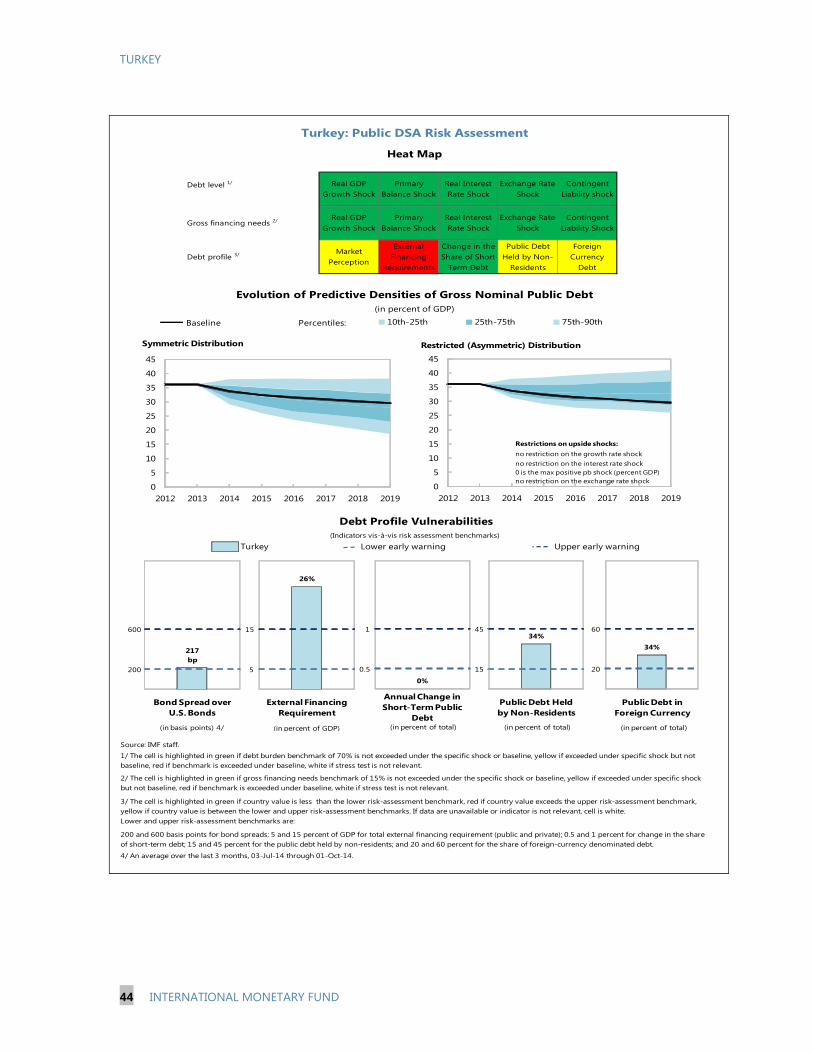
TURKEY
44 INTERNATIONAL MONETARY FUND
Turkey
Source: IMF staff.
4/ An average over the last 3 months, 03-Jul-14 through 01-Oct-14.
Real GDP Growth Shock
2/ The cell is highlighted in green if gross financing needs benchmark of 15% is not exceeded under the specific shock or baseline, yellow if exceeded under specific shock but not baseline, red if benchmark is exceeded under baseline, white if stress test is not relevant.
Turkey: Public DSA Risk Assessment
1/ The cell is highlighted in green if debt burden benchmark of 70% is not exceeded under the specific shock or baseline, yellow if exceeded under specific shock but not baseline, red if benchmark is exceeded under baseline, white if stress test is not relevant.
Real Interest Rate Shock
External Financing
Requirements
Real GDP Growth Shock
Heat Map
Upper early warning
Evolution of Predictive Densities of Gross Nominal Public Debt(in percent of GDP)
Debt profile 3/
Lower early warning
200 and 600 basis points for bond spreads; 5 and 15 percent of GDP for total external financing requirement (public and private); 0.5 and 1 percent for change in the share of short-term debt; 15 and 45 percent for the public debt held by non-residents; and 20 and 60 percent for the share of foreign-currency denominated debt.
Foreign Currency
Debt
Public Debt Held by Non-
Residents
(Indicators vis-à-vis risk assessment benchmarks)
Market Perception
Gross financing needs 2/ Primary Balance Shock
Real Interest Rate Shock
Exchange Rate Shock
Contingent Liability Shock
Primary Balance Shock
Debt Profile Vulnerabilities
3/ The cell is highlighted in green if country value is less than the lower risk-assessment benchmark, red if country value exceeds the upper risk-assessment benchmark, yellow if country value is between the lower and upper risk-assessment benchmarks. If data are unavailable or indicator is not relevant, cell is white. Lower and upper risk-assessment benchmarks are:
Change in the Share of Short-
Term Debt
Exchange Rate Shock
Contingent Liability shock
Debt level 1/
20
60
34%
1 2
200
600
217 bp
1 2
5
15
26%
1 2
0.5
1
0%
1 2
Bond Spread over U.S. Bonds
External Financing Requirement
Annual Change in Short-Term Public
Debt
Public Debt in Foreign Currency
(in basis points) 4/ (in percent of GDP) (in percent of total) (in percent of total)
0
5
10
15
20
25
30
35
40
45
2012 2013 2014 2015 2016 2017 2018 2019
10th-25th 25th-75th 75th-90thPercentiles:Baseline
Symmetric Distribution
0
5
10
15
20
25
30
35
40
45
2012 2013 2014 2015 2016 2017 2018 2019
Restricted (Asymmetric) Distribution
no restriction on the growth rate shockno restriction on the interest rate shock0 is the max positive pb shock (percent GDP)no restriction on the exchange rate shock
Restrictions on upside shocks:
15
4534%
1 2
Public Debt Held by Non-Residents
(in percent of total)
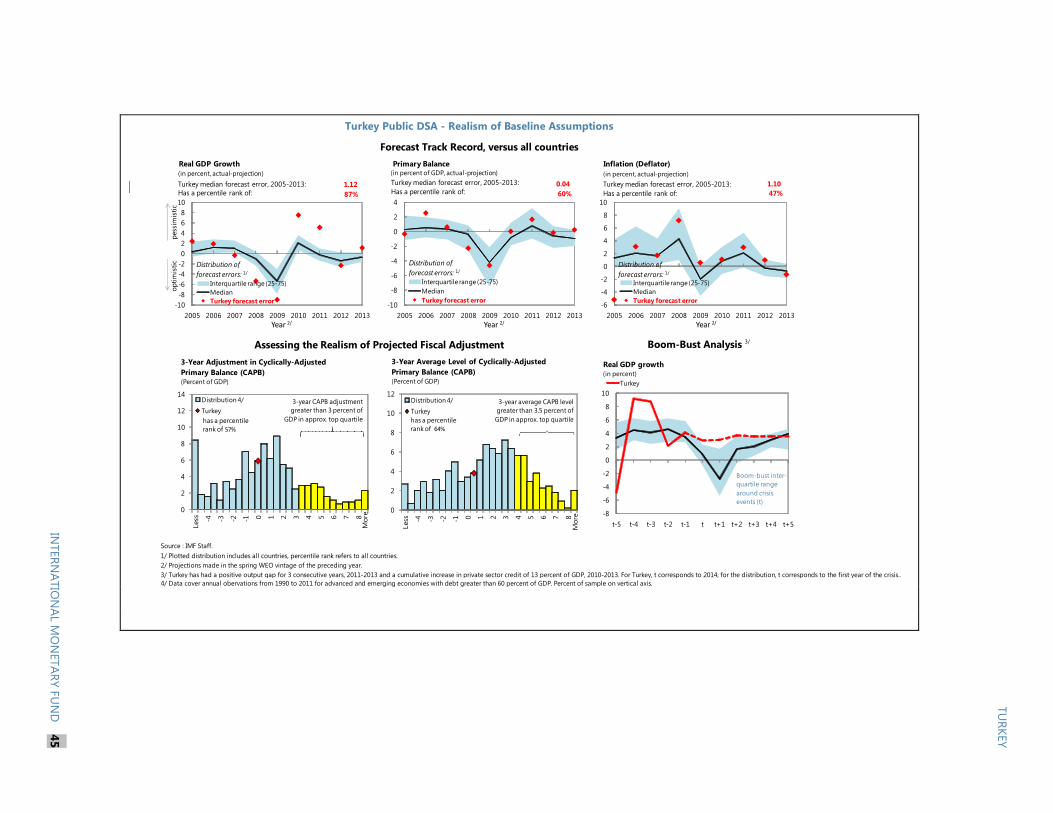
Source : IMF Staff.1/ Plotted distribution includes all countries, percentile rank refers to all countries.2/ Projections made in the spring WEO vintage of the preceding year.3/ Turkey has had a positive output gap for 3 consecutive years, 2011-2013 and a cumulative increase in private sector credit of 13 percent of GDP, 2010-2013. For Turkey, t corresponds to 2014; for the distribution, t corresponds to the first year of the crisis..
4/ Data cover annual obervations from 1990 to 2011 for advanced and emerging economies with debt greater than 60 percent of GDP. Percent of sample on vertical axis.
Turkey Public DSA - Realism of Baseline Assumptions
Forecast Track Record, versus all countries
Boom-Bust Analysis 3/Assessing the Realism of Projected Fiscal Adjustment
-10-8-6-4-202468
10
2005 2006 2007 2008 2009 2010 2011 2012 2013Year 2/
Real GDP Growth
Interquartile range (25-75)MedianTurkey forecast error
1.1287%Has a percentile rank of:
Turkey median forecast error, 2005-2013:
Distribution of forecast errors: 1/
(in percent, actual-projection)
-10
-8
-6
-4
-2
0
2
4
2005 2006 2007 2008 2009 2010 2011 2012 2013Year 2/
Primary Balance
Interquartile range (25-75)MedianTurkey forecast error
0.0460%Has a percentile rank of:
Turkey median forecast error, 2005-2013:
Distribution of forecast errors: 1/
(in percent of GDP, actual-projection)
-6
-4
-2
0
2
4
6
8
10
2005 2006 2007 2008 2009 2010 2011 2012 2013Year 2/
Inflation (Deflator)
Interquartile range (25-75)MedianTurkey forecast error
1.1047%Has a percentile rank of:
Turkey median forecast error, 2005-2013:
Distribution of forecast errors: 1/
(in percent, actual-projection)pe
ssim
istic
optim
istic
-8
-6
-4
-2
0
2
4
6
8
10
t-5 t-4 t-3 t-2 t-1 t t+1 t+2 t+3 t+4 t+5
Real GDP growth
Turkey
Boom-bust inter-quartile range around crisis events (t)
(in percent)
0
2
4
6
8
10
12
14
Less -4 -3 -2 -1 0 1 2 3 4 5 6 7 8
Distribution 4/Turkey
3-Year Adjustment in Cyclically-Adjusted Primary Balance (CAPB)(Percent of GDP)
Mor
e
3-year CAPB adjustment greater than 3 percent of
GDP in approx. top quartilehas a percentile rank of 57%
0
2
4
6
8
10
12Le
ss -4 -3 -2 -1 0 1 2 3 4 5 6 7 8
Distribution 4/Turkey
3-Year Average Level of Cyclically-Adjusted Primary Balance (CAPB)(Percent of GDP)
Mor
e
3-year average CAPB level greater than 3.5 percent of GDP in approx. top quartilehas a percentile
rank of 64%
TURKEY
INTERN
ATION
AL MO
NETARY FU
ND
45
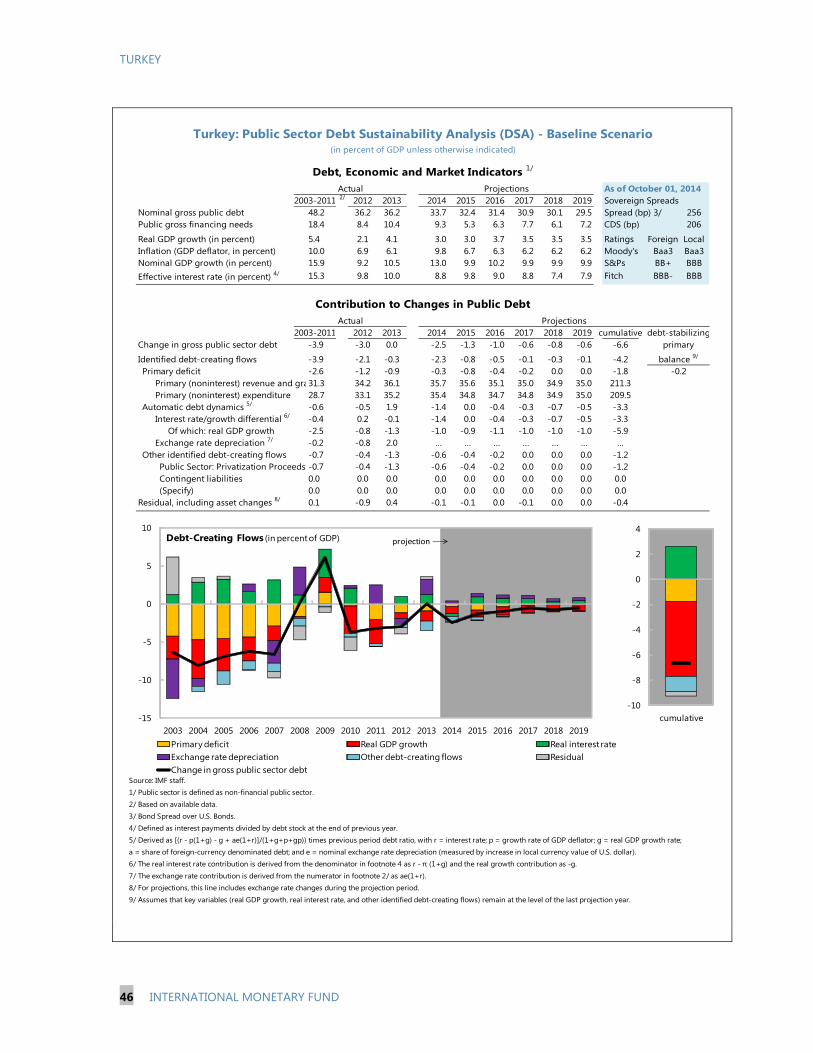
TURKEY
46 INTERNATIONAL MONETARY FUND
As of October 01, 20142/ 2012 2013 2014 2015 2016 2017 2018 2019 Sovereign Spreads
Nominal gross public debt 48.2 36.2 36.2 33.7 32.4 31.4 30.9 30.1 29.5 Spread (bp) 3/ 256Public gross financing needs 18.4 8.4 10.4 9.3 5.3 6.3 7.7 6.1 7.2 CDS (bp) 206
Real GDP growth (in percent) 5.4 2.1 4.1 3.0 3.0 3.7 3.5 3.5 3.5 Ratings Foreign LocalInflation (GDP deflator, in percent) 10.0 6.9 6.1 9.8 6.7 6.3 6.2 6.2 6.2 Moody's Baa3 Baa3Nominal GDP growth (in percent) 15.9 9.2 10.5 13.0 9.9 10.2 9.9 9.9 9.9 S&Ps BB+ BBBEffective interest rate (in percent) 4/ 15.3 9.8 10.0 8.8 9.8 9.0 8.8 7.4 7.9 Fitch BBB- BBB
2012 2013 2014 2015 2016 2017 2018 2019 cumulativeChange in gross public sector debt -3.9 -3.0 0.0 -2.5 -1.3 -1.0 -0.6 -0.8 -0.6 -6.6
Identified debt-creating flows -3.9 -2.1 -0.3 -2.3 -0.8 -0.5 -0.1 -0.3 -0.1 -4.2Primary deficit -2.6 -1.2 -0.9 -0.3 -0.8 -0.4 -0.2 0.0 0.0 -1.8
Primary (noninterest) revenue and gra31.3 34.2 36.1 35.7 35.6 35.1 35.0 34.9 35.0 211.3Primary (noninterest) expenditure 28.7 33.1 35.2 35.4 34.8 34.7 34.8 34.9 35.0 209.5
Automatic debt dynamics 5/ -0.6 -0.5 1.9 -1.4 0.0 -0.4 -0.3 -0.7 -0.5 -3.3Interest rate/growth differential 6/ -0.4 0.2 -0.1 -1.4 0.0 -0.4 -0.3 -0.7 -0.5 -3.3
Of which: real GDP growth -2.5 -0.8 -1.3 -1.0 -0.9 -1.1 -1.0 -1.0 -1.0 -5.9Exchange rate depreciation 7/ -0.2 -0.8 2.0 … … … … … … …
Other identified debt-creating flows -0.7 -0.4 -1.3 -0.6 -0.4 -0.2 0.0 0.0 0.0 -1.2Public Sector: Privatization Proceeds -0.7 -0.4 -1.3 -0.6 -0.4 -0.2 0.0 0.0 0.0 -1.2Contingent liabilities 0.0 0.0 0.0 0.0 0.0 0.0 0.0 0.0 0.0 0.0(Specify) 0.0 0.0 0.0 0.0 0.0 0.0 0.0 0.0 0.0 0.0
Residual, including asset changes 8/ 0.1 -0.9 0.4 -0.1 -0.1 0.0 -0.1 0.0 0.0 -0.4
Source: IMF staff.1/ Public sector is defined as non-financial public sector.
2/ Based on available data.3/ Bond Spread over U.S. Bonds.
4/ Defined as interest payments divided by debt stock at the end of previous year.5/ Derived as [(r - p(1+g) - g + ae(1+r)]/(1+g+p+gp)) times previous period debt ratio, with r = interest rate; p = growth rate of GDP deflator; g = real GDP growth rate;
a = share of foreign-currency denominated debt; and e = nominal exchange rate depreciation (measured by increase in local currency value of U.S. dollar).6/ The real interest rate contribution is derived from the denominator in footnote 4 as r - π (1+g) and the real growth contribution as -g.
7/ The exchange rate contribution is derived from the numerator in footnote 2/ as ae(1+r). 8/ For projections, this line includes exchange rate changes during the projection period.
9/ Assumes that key variables (real GDP growth, real interest rate, and other identified debt-creating flows) remain at the level of the last projection year.
Turkey: Public Sector Debt Sustainability Analysis (DSA) - Baseline Scenario
-0.2balance 9/
primary
(in percent of GDP unless otherwise indicated)
Debt, Economic and Market Indicators 1/
2003-2011Actual
Projections
Contribution to Changes in Public DebtProjections
2003-2011Actual
debt-stabilizing
-10
-8
-6
-4
-2
0
2
4
cumulative-15
-10
-5
0
5
10
2003 2004 2005 2006 2007 2008 2009 2010 2011 2012 2013 2014 2015 2016 2017 2018 2019
Debt-Creating Flows
Primary deficit Real GDP growth Real interest rate Exchange rate depreciation Other debt-creating flows ResidualChange in gross public sector debt
projection(in percent of GDP)

TURKEY
INTERNATIONAL MONETARY FUND 47
Baseline Scenario 2014 2015 2016 2017 2018 2019 Historical Scenario 2014 2015 2016 2017 2018 2019Real GDP growth 3.0 3.0 3.7 3.5 3.5 3.5 Real GDP growth 3.0 4.9 4.9 4.9 4.9 4.9Inflation 9.8 6.7 6.3 6.2 6.2 6.2 Inflation 9.8 6.7 6.3 6.2 6.2 6.2Primary Balance 0.3 0.8 0.4 0.2 0.0 0.0 Primary Balance 0.3 2.1 2.1 2.1 2.1 2.1Effective interest rate 8.8 9.8 9.0 8.8 7.4 7.9 Effective interest rate 8.8 9.8 9.4 9.4 8.4 9.0
Constant Primary Balance ScenarioReal GDP growth 3.0 3.0 3.7 3.5 3.5 3.5Inflation 9.8 6.7 6.3 6.2 6.2 6.2Primary Balance 0.3 0.3 0.3 0.3 0.3 0.3Effective interest rate 8.8 9.8 9.0 8.5 7.3 7.8
Source: IMF staff.
Underlying Assumptions(in percent)
Turkey: Public DSA - Composition of Public Debt and Alternative Scenarios
Alternative Scenarios
Composition of Public Debt
Baseline Historical Constant Primary Balance
15
20
25
30
35
40
2012 2013 2014 2015 2016 2017 2018 2019
Gross Nominal Public Debt(in percent of GDP)
projection0
2
4
6
8
10
12
2012 2013 2014 2015 2016 2017 2018 2019
Public Gross Financing Needs(in percent of GDP)
projection
-10
0
10
20
30
40
50
60
70
80
2003 2005 2007 2009 2011 2013 2015 2017 2019
By Maturity
Medium and long-termShort-term
projection
(in percent of GDP)
0
10
20
30
40
50
60
70
80
2003 2005 2007 2009 2011 2013 2015 2017 2019
By Currency
Local currency-denominatedForeign currency-denominated
projection
(in percent of GDP)
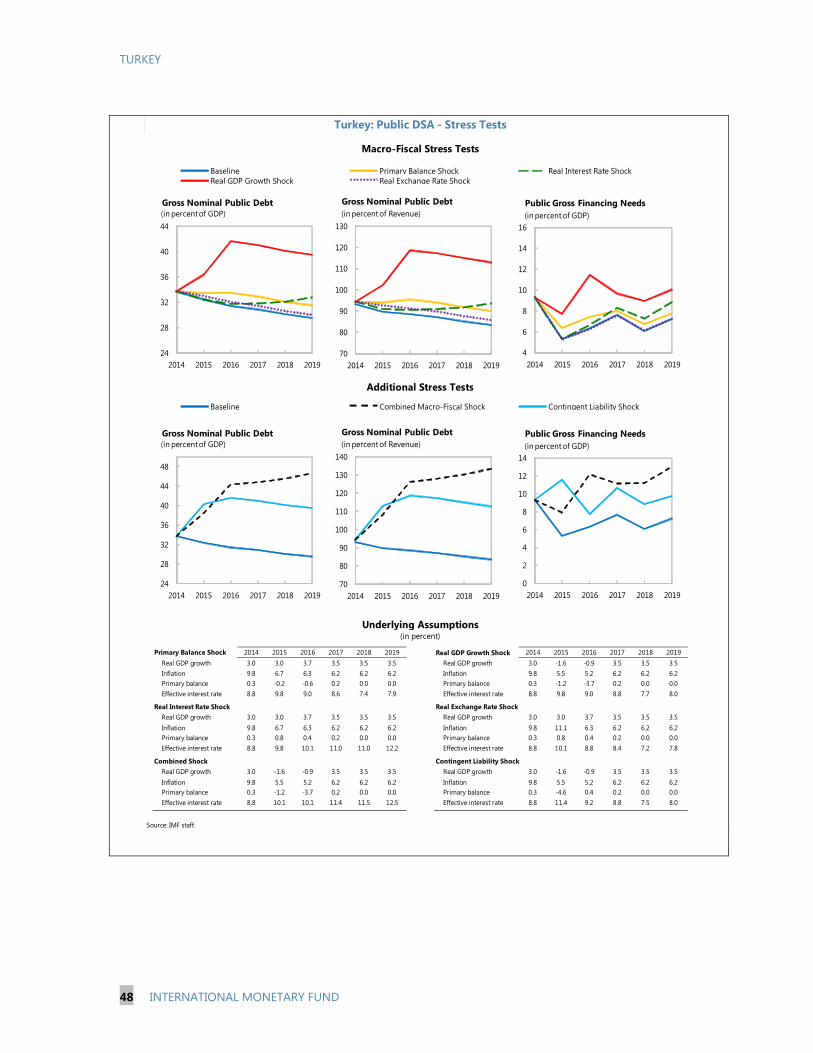
TURKEY
48 INTERNATIONAL MONETARY FUND
Primary Balance Shock 2014 2015 2016 2017 2018 2019 Real GDP Growth Shock 2014 2015 2016 2017 2018 2019Real GDP growth 3.0 3.0 3.7 3.5 3.5 3.5 Real GDP growth 3.0 -1.6 -0.9 3.5 3.5 3.5Inflation 9.8 6.7 6.3 6.2 6.2 6.2 Inflation 9.8 5.5 5.2 6.2 6.2 6.2Primary balance 0.3 -0.2 -0.6 0.2 0.0 0.0 Primary balance 0.3 -1.2 -3.7 0.2 0.0 0.0Effective interest rate 8.8 9.8 9.0 8.6 7.4 7.9 Effective interest rate 8.8 9.8 9.0 8.8 7.7 8.0
Real Interest Rate Shock Real Exchange Rate ShockReal GDP growth 3.0 3.0 3.7 3.5 3.5 3.5 Real GDP growth 3.0 3.0 3.7 3.5 3.5 3.5Inflation 9.8 6.7 6.3 6.2 6.2 6.2 Inflation 9.8 11.1 6.3 6.2 6.2 6.2Primary balance 0.3 0.8 0.4 0.2 0.0 0.0 Primary balance 0.3 0.8 0.4 0.2 0.0 0.0Effective interest rate 8.8 9.8 10.1 11.0 11.0 12.2 Effective interest rate 8.8 10.1 8.8 8.4 7.2 7.8
Combined Shock Contingent Liability ShockReal GDP growth 3.0 -1.6 -0.9 3.5 3.5 3.5 Real GDP growth 3.0 -1.6 -0.9 3.5 3.5 3.5Inflation 9.8 5.5 5.2 6.2 6.2 6.2 Inflation 9.8 5.5 5.2 6.2 6.2 6.2Primary balance 0.3 -1.2 -3.7 0.2 0.0 0.0 Primary balance 0.3 -4.6 0.4 0.2 0.0 0.0Effective interest rate 8.8 10.1 10.1 11.4 11.5 12.5 Effective interest rate 8.8 11.4 9.2 8.8 7.5 8.0
Source: IMF staff.
(in percent)
Real Exchange Rate Shock
Combined Macro-Fiscal Shock
Additional Stress Tests
Baseline
Underlying Assumptions
Contingent Liability Shock
Turkey: Public DSA - Stress Tests
Macro-Fiscal Stress Tests
Baseline Primary Balance ShockReal GDP Growth Shock
Real Interest Rate Shock
24
28
32
36
40
44
2014 2015 2016 2017 2018 2019
Gross Nominal Public Debt(in percent of GDP)
70
80
90
100
110
120
130
2014 2015 2016 2017 2018 2019
Gross Nominal Public Debt(in percent of Revenue)
4
6
8
10
12
14
16
2014 2015 2016 2017 2018 2019
Public Gross Financing Needs(in percent of GDP)
24
28
32
36
40
44
48
2014 2015 2016 2017 2018 2019
Gross Nominal Public Debt(in percent of GDP)
70
80
90
100
110
120
130
140
2014 2015 2016 2017 2018 2019
Gross Nominal Public Debt(in percent of Revenue)
0
2
4
6
8
10
12
14
2014 2015 2016 2017 2018 2019
Public Gross Financing Needs(in percent of GDP)
TURKEY
INTERNATIONAL MONETARY FUND 49
Annex II. External Debt Sustainability At nearly 50 percent of GDP, Turkey’s gross external debt is a source of vulnerability. Associated with this high debt is a high external financing requirement of 27 percent of GDP. Over the medium term, both external debt and gross financing needs are projected to remain elevated. The debt path is robust to most stress tests, but susceptible to large depreciation shocks.
Turkey’s gross external debt is sustainable under the baseline and plausible alternative scenarios, albeit with increased vulnerabilities. External debt stood at 47.4 percent of GDP at end-2013, and is projected to remain around 50 percent of GDP over the medium term. The high external debt stock reflects the country’s reliance on debt-creating inflows to finance the large and persistent current account deficit. In this regard, Turkey has benefited from the loose global liquidity conditions in recent years, but at the expense of increased external liabilities and the associated volatility. The pace of external debt buildup is expected to moderate as the current account deficit stabilizes and external funding conditions normalize.
Large external financing requirements create rollover risks. Turkey’s annual gross external financing needs are large—around 27 percent of GDP in 2014—driven by the high current account deficit and increased reliance on short-term financing. External debt sustainability therefore is vulnerable to sudden and sustained shifts in international investors’ risk appetite, which could trigger simultaneously an increase in borrowing costs and exchange rate pressure. Over the medium term, gross financing needs are projected to come down slightly to around 24 percent of GDP, with some lengthening of debt maturities by the private sector.
Most external debt is long-term, but short-term debt has been increasing. The share of short-term debt is expected to have peaked in 2013 at 33 percent of total, without further buildup. As such, the share of short-term debt is projected to come down to around 26 percent of total by 2019. Banks account for over 70 percent of short-term borrowings, with non-resident deposits (classified as short-term debt) accounting for half that amount. Private creditors hold 68 percent of Turkey’s external debt, bond investors 20 percent, and official creditors the remaining 12 percent.
Turkey’s external debt is robust to growth, interest rate, and current account shocks. To be conservative, the standard growth shock of one-half standard deviation was replaced with a one standard deviation shock equivalent to a 4.6 percentage-point reduction in growth. In the same vein, the interest rate shock was customized to mirror the large increase in spreads experienced in 2008. Under these scenarios, the standard current account balance shock, or a combination of the three shocks, external debt would remain below 60 percent of GDP. However, Turkey’s external debt sustainability is vulnerable to large exchange rate shocks. A sustained one-time depreciation by 30 percent, with other variables following their baseline paths, would increase external debt to almost 80 percent of GDP. In practice, however, this scenario is unlikely to materialize as a shock of such magnitude would precipitate sharp adjustments in the current account that would mitigate the impact on external debt.
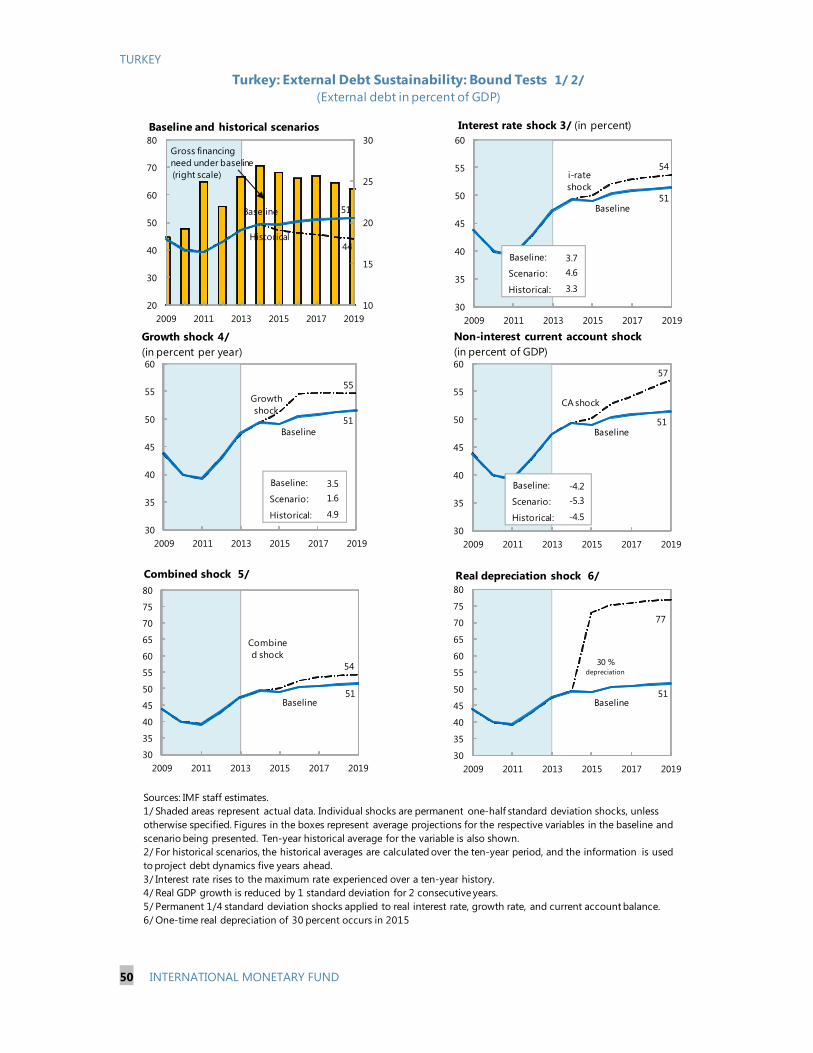
TURKEY
50 INTERNATIONAL MONETARY FUND
i-rate shock
54
Baseline51
30
35
40
45
50
55
60
2009 2011 2013 2015 2017 2019
Interest rate shock 3/ (in percent)
Turkey: External Debt Sustainability: Bound Tests 1/ 2/(External debt in percent of GDP)
Sources: IMF staff estimates.1/ Shaded areas represent actual data. Individual shocks are permanent one-half standard deviation shocks, unless otherwise specified. Figures in the boxes represent average projections for the respective variables in the baseline and scenario being presented. Ten-year historical average for the variable is also shown. 2/ For historical scenarios, the historical averages are calculated over the ten-year period, and the information is used to project debt dynamics five years ahead.3/ Interest rate rises to the maximum rate experienced over a ten-year history.4/ Real GDP growth is reduced by 1 standard deviation for 2 consecutive years.5/ Permanent 1/4 standard deviation shocks applied to real interest rate, growth rate, and current account balance.6/ One-time real depreciation of 30 percent occurs in 2015
Historical44
Baseline 51
10
15
20
25
30
20
30
40
50
60
70
80
2009 2011 2013 2015 2017 2019
Baseline and historical scenarios
CA shock
57
Baseline51
30
35
40
45
50
55
60
2009 2011 2013 2015 2017 2019
Combined shock
54
Baseline51
30
35
40
45
50
55
60
65
70
75
80
2009 2011 2013 2015 2017 2019
Combined shock 5/
30 % depreciation
77
Baseline51
30
35
40
45
50
55
60
65
70
75
80
2009 2011 2013 2015 2017 2019
Real depreciation shock 6/
Gross financing need under baseline(right scale)
Non-interest current account shock (in percent of GDP)
Growth shock
55
Baseline51
30
35
40
45
50
55
60
2009 2011 2013 2015 2017 2019
Baseline:
Scenario:
Historical:
3.74.6
3.3
Baseline:
Scenario:
Historical:
3.51.6
4.9
Baseline:
Scenario:
Historical:
-4.2-5.3
-4.5
Growth shock 4/ (in percent per year)
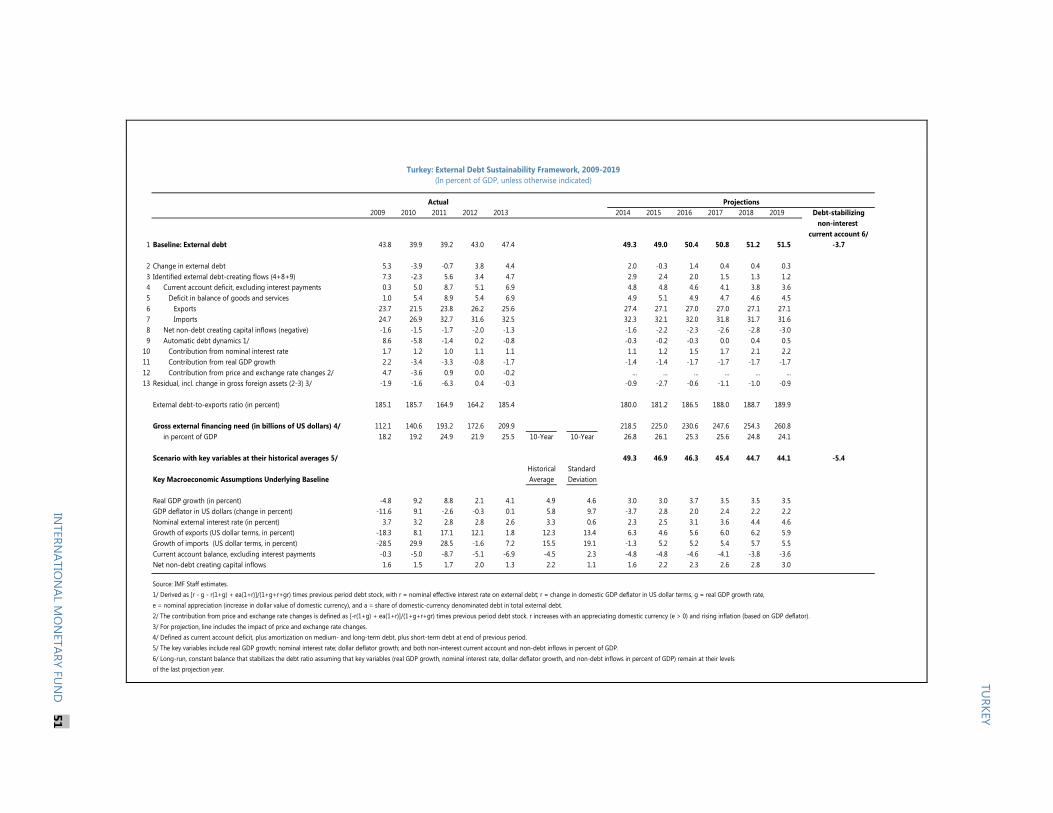
Projections2009 2010 2011 2012 2013 2014 2015 2016 2017 2018 2019 Debt-stabilizing
non-interest current account 6/
1 Baseline: External debt 43.8 39.9 39.2 43.0 47.4 49.3 49.0 50.4 50.8 51.2 51.5 -3.7
2 Change in external debt 5.3 -3.9 -0.7 3.8 4.4 2.0 -0.3 1.4 0.4 0.4 0.33 Identified external debt-creating flows (4+8+9) 7.3 -2.3 5.6 3.4 4.7 2.9 2.4 2.0 1.5 1.3 1.24 Current account deficit, excluding interest payments 0.3 5.0 8.7 5.1 6.9 4.8 4.8 4.6 4.1 3.8 3.65 Deficit in balance of goods and services 1.0 5.4 8.9 5.4 6.9 4.9 5.1 4.9 4.7 4.6 4.56 Exports 23.7 21.5 23.8 26.2 25.6 27.4 27.1 27.0 27.0 27.1 27.17 Imports 24.7 26.9 32.7 31.6 32.5 32.3 32.1 32.0 31.8 31.7 31.68 Net non-debt creating capital inflows (negative) -1.6 -1.5 -1.7 -2.0 -1.3 -1.6 -2.2 -2.3 -2.6 -2.8 -3.09 Automatic debt dynamics 1/ 8.6 -5.8 -1.4 0.2 -0.8 -0.3 -0.2 -0.3 0.0 0.4 0.5
10 Contribution from nominal interest rate 1.7 1.2 1.0 1.1 1.1 1.1 1.2 1.5 1.7 2.1 2.211 Contribution from real GDP growth 2.2 -3.4 -3.3 -0.8 -1.7 -1.4 -1.4 -1.7 -1.7 -1.7 -1.712 Contribution from price and exchange rate changes 2/ 4.7 -3.6 0.9 0.0 -0.2 ... ... ... ... ... ...13 Residual, incl. change in gross foreign assets (2-3) 3/ -1.9 -1.6 -6.3 0.4 -0.3 -0.9 -2.7 -0.6 -1.1 -1.0 -0.9
External debt-to-exports ratio (in percent) 185.1 185.7 164.9 164.2 185.4 180.0 181.2 186.5 188.0 188.7 189.9
Gross external financing need (in billions of US dollars) 4/ 112.1 140.6 193.2 172.6 209.9 218.5 225.0 230.6 247.6 254.3 260.8in percent of GDP 18.2 19.2 24.9 21.9 25.5 10-Year 10-Year 26.8 26.1 25.3 25.6 24.8 24.1
Scenario with key variables at their historical averages 5/ 49.3 46.9 46.3 45.4 44.7 44.1 -5.4Historical Standard
Key Macroeconomic Assumptions Underlying Baseline Average Deviation
Real GDP growth (in percent) -4.8 9.2 8.8 2.1 4.1 4.9 4.6 3.0 3.0 3.7 3.5 3.5 3.5GDP deflator in US dollars (change in percent) -11.6 9.1 -2.6 -0.3 0.1 5.8 9.7 -3.7 2.8 2.0 2.4 2.2 2.2Nominal external interest rate (in percent) 3.7 3.2 2.8 2.8 2.6 3.3 0.6 2.3 2.5 3.1 3.6 4.4 4.6Growth of exports (US dollar terms, in percent) -18.3 8.1 17.1 12.1 1.8 12.3 13.4 6.3 4.6 5.6 6.0 6.2 5.9Growth of imports (US dollar terms, in percent) -28.5 29.9 28.5 -1.6 7.2 15.5 19.1 -1.3 5.2 5.2 5.4 5.7 5.5Current account balance, excluding interest payments -0.3 -5.0 -8.7 -5.1 -6.9 -4.5 2.3 -4.8 -4.8 -4.6 -4.1 -3.8 -3.6Net non-debt creating capital inflows 1.6 1.5 1.7 2.0 1.3 2.2 1.1 1.6 2.2 2.3 2.6 2.8 3.0
Source: IMF Staff estimates.1/ Derived as [r - g - r(1+g) + ea(1+r)]/(1+g+r+gr) times previous period debt stock, with r = nominal effective interest rate on external debt; r = change in domestic GDP deflator in US dollar terms, g = real GDP growth rate, e = nominal appreciation (increase in dollar value of domestic currency), and a = share of domestic-currency denominated debt in total external debt.2/ The contribution from price and exchange rate changes is defined as [-r(1+g) + ea(1+r)]/(1+g+r+gr) times previous period debt stock. r increases with an appreciating domestic currency (e > 0) and rising inflation (based on GDP deflator). 3/ For projection, line includes the impact of price and exchange rate changes.4/ Defined as current account deficit, plus amortization on medium- and long-term debt, plus short-term debt at end of previous period. 5/ The key variables include real GDP growth; nominal interest rate; dollar deflator growth; and both non-interest current account and non-debt inflows in percent of GDP.6/ Long-run, constant balance that stabilizes the debt ratio assuming that key variables (real GDP growth, nominal interest rate, dollar deflator growth, and non-debt inflows in percent of GDP) remain at their levels of the last projection year.
Actual
Turkey: External Debt Sustainability Framework, 2009-2019(In percent of GDP, unless otherwise indicated)
TURKEY
INTERN
ATION
ALM
ON
ETARYFU
ND
51
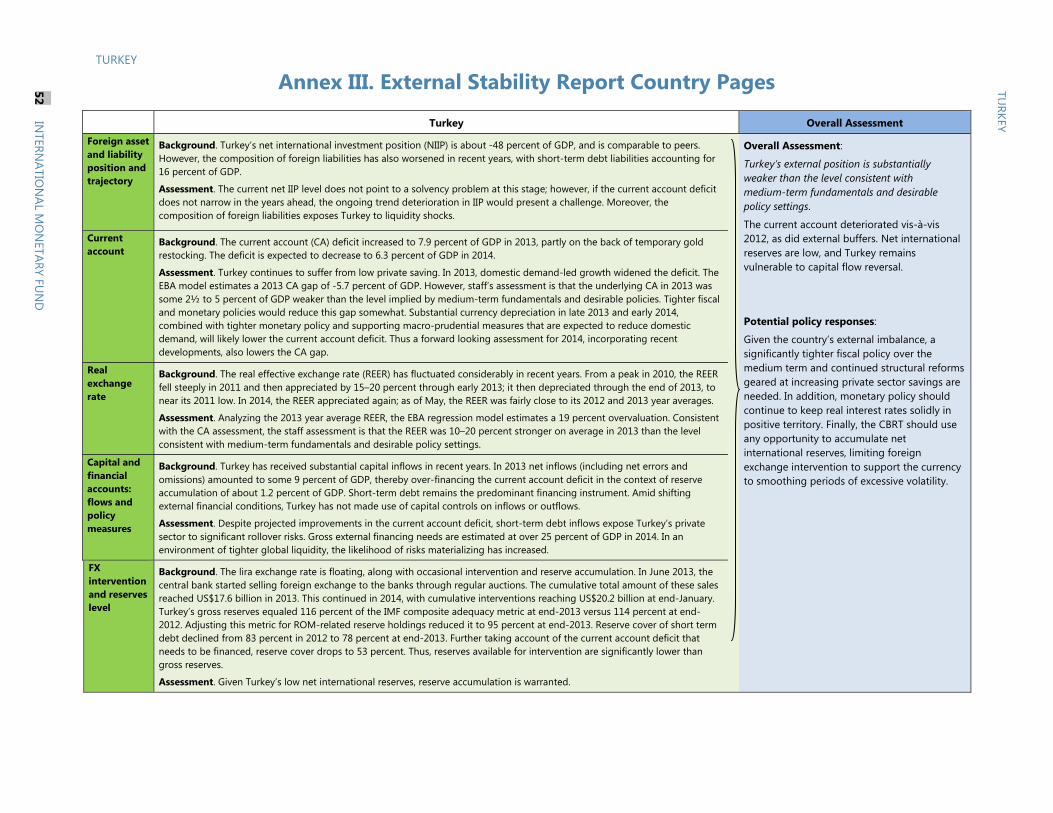
TURKEY
Annex III. External Stability Report Country Pages
Turkey Overall Assessment
Foreign asset and liability position and trajectory
Background. Turkey’s net international investment position (NIIP) is about -48 percent of GDP, and is comparable to peers. However, the composition of foreign liabilities has also worsened in recent years, with short-term debt liabilities accounting for 16 percent of GDP.
Assessment. The current net IIP level does not point to a solvency problem at this stage; however, if the current account deficit does not narrow in the years ahead, the ongoing trend deterioration in IIP would present a challenge. Moreover, the composition of foreign liabilities exposes Turkey to liquidity shocks.
Overall Assessment:
Turkey’s external position is substantially weaker than the level consistent with medium-term fundamentals and desirable policy settings.
The current account deteriorated vis-à-vis 2012, as did external buffers. Net international reserves are low, and Turkey remains vulnerable to capital flow reversal.
Potential policy responses:
Given the country’s external imbalance, a significantly tighter fiscal policy over the medium term and continued structural reforms geared at increasing private sector savings are needed. In addition, monetary policy should continue to keep real interest rates solidly in positive territory. Finally, the CBRT should use any opportunity to accumulate net international reserves, limiting foreign exchange intervention to support the currency to smoothing periods of excessive volatility.
Current account
Background. The current account (CA) deficit increased to 7.9 percent of GDP in 2013, partly on the back of temporary gold restocking. The deficit is expected to decrease to 6.3 percent of GDP in 2014.
Assessment. Turkey continues to suffer from low private saving. In 2013, domestic demand-led growth widened the deficit. The EBA model estimates a 2013 CA gap of -5.7 percent of GDP. However, staff’s assessment is that the underlying CA in 2013 was some 2½ to 5 percent of GDP weaker than the level implied by medium-term fundamentals and desirable policies. Tighter fiscal and monetary policies would reduce this gap somewhat. Substantial currency depreciation in late 2013 and early 2014, combined with tighter monetary policy and supporting macro-prudential measures that are expected to reduce domestic demand, will likely lower the current account deficit. Thus a forward looking assessment for 2014, incorporating recent developments, also lowers the CA gap.
Real exchange rate
Background. The real effective exchange rate (REER) has fluctuated considerably in recent years. From a peak in 2010, the REER fell steeply in 2011 and then appreciated by 15–20 percent through early 2013; it then depreciated through the end of 2013, to near its 2011 low. In 2014, the REER appreciated again; as of May, the REER was fairly close to its 2012 and 2013 year averages.
Assessment. Analyzing the 2013 year average REER, the EBA regression model estimates a 19 percent overvaluation. Consistent with the CA assessment, the staff assessment is that the REER was 10–20 percent stronger on average in 2013 than the level consistent with medium-term fundamentals and desirable policy settings.
Capital and financial accounts: flows and policy measures
Background. Turkey has received substantial capital inflows in recent years. In 2013 net inflows (including net errors and omissions) amounted to some 9 percent of GDP, thereby over-financing the current account deficit in the context of reserve accumulation of about 1.2 percent of GDP. Short-term debt remains the predominant financing instrument. Amid shifting external financial conditions, Turkey has not made use of capital controls on inflows or outflows.
Assessment. Despite projected improvements in the current account deficit, short-term debt inflows expose Turkey’s private sector to significant rollover risks. Gross external financing needs are estimated at over 25 percent of GDP in 2014. In an environment of tighter global liquidity, the likelihood of risks materializing has increased.
FX intervention and reserves level
Background. The lira exchange rate is floating, along with occasional intervention and reserve accumulation. In June 2013, the central bank started selling foreign exchange to the banks through regular auctions. The cumulative total amount of these sales reached US$17.6 billion in 2013. This continued in 2014, with cumulative interventions reaching US$20.2 billion at end-January. Turkey’s gross reserves equaled 116 percent of the IMF composite adequacy metric at end-2013 versus 114 percent at end-2012. Adjusting this metric for ROM-related reserve holdings reduced it to 95 percent at end-2013. Reserve cover of short term debt declined from 83 percent in 2012 to 78 percent at end-2013. Further taking account of the current account deficit that needs to be financed, reserve cover drops to 53 percent. Thus, reserves available for intervention are significantly lower than gross reserves.
Assessment. Given Turkey’s low net international reserves, reserve accumulation is warranted.
TURKEY
TURKEY
52IN
TERNATIO
NAL
MO
NETARY
FUN
D
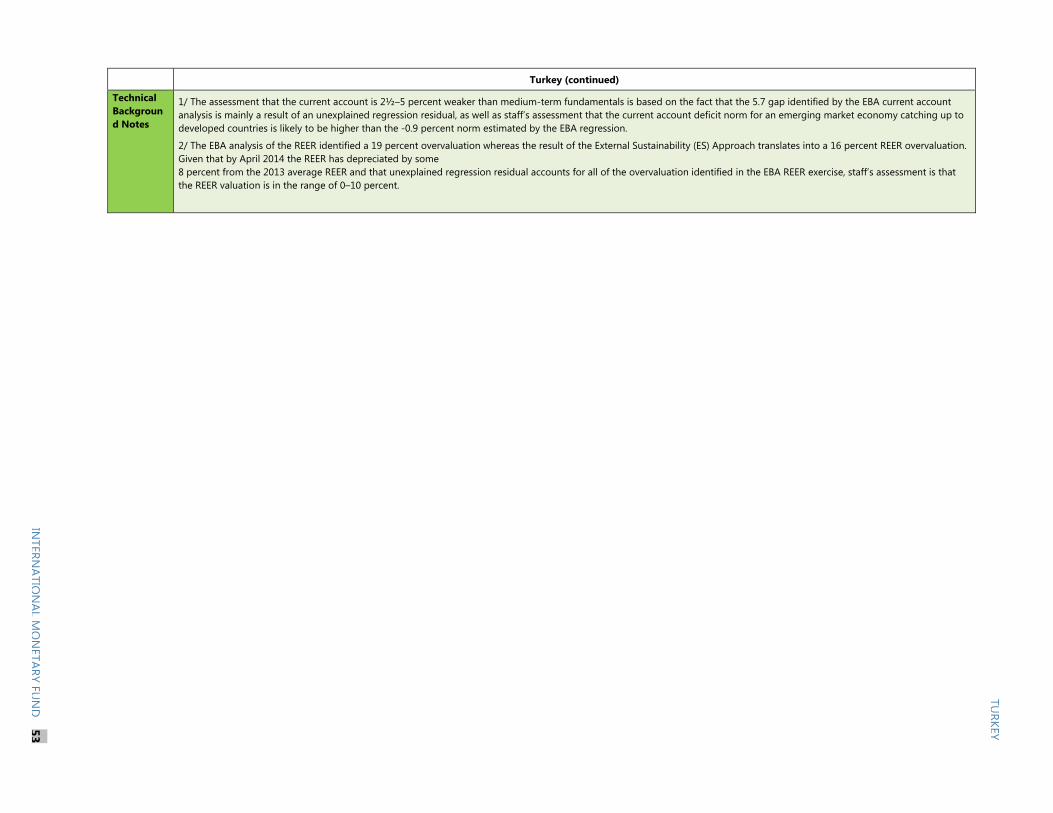
Turkey (continued)
Technical Background Notes
1/ The assessment that the current account is 2½–5 percent weaker than medium-term fundamentals is based on the fact that the 5.7 gap identified by the EBA current account analysis is mainly a result of an unexplained regression residual, as well as staff’s assessment that the current account deficit norm for an emerging market economy catching up to developed countries is likely to be higher than the -0.9 percent norm estimated by the EBA regression.
2/ The EBA analysis of the REER identified a 19 percent overvaluation whereas the result of the External Sustainability (ES) Approach translates into a 16 percent REER overvaluation. Given that by April 2014 the REER has depreciated by some 8 percent from the 2013 average REER and that unexplained regression residual accounts for all of the overvaluation identified in the EBA REER exercise, staff’s assessment is that the REER valuation is in the range of 0–10 percent.
TURKEY
INTERN
ATION
ALM
ON
ETARYFU
ND
53
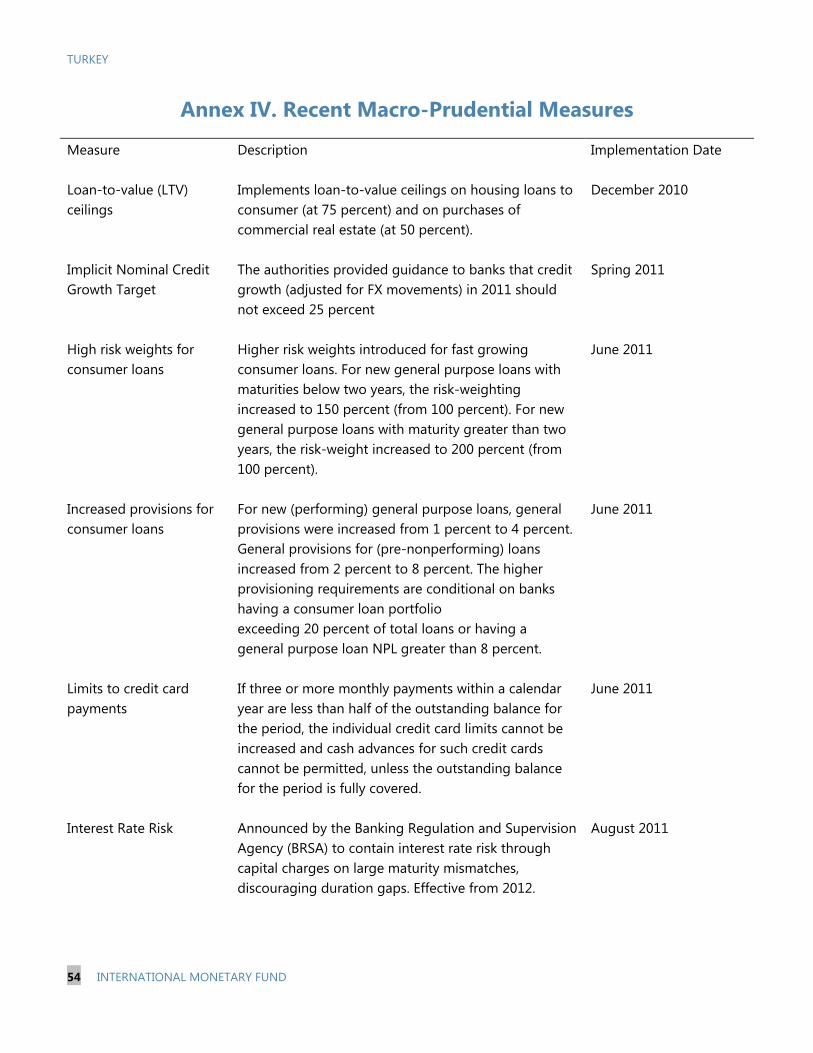
TURKEY
54 INTERNATIONAL MONETARY FUND
Annex IV. Recent Macro-Prudential Measures
Measure Description
Implementation Date
Loan-to-value (LTV) ceilings
Implements loan-to-value ceilings on housing loans to consumer (at 75 percent) and on purchases of commercial real estate (at 50 percent).
December 2010
Implicit Nominal Credit Growth Target
The authorities provided guidance to banks that credit growth (adjusted for FX movements) in 2011 should not exceed 25 percent
Spring 2011
High risk weights for consumer loans
Higher risk weights introduced for fast growing consumer loans. For new general purpose loans with maturities below two years, the risk-weighting increased to 150 percent (from 100 percent). For new general purpose loans with maturity greater than two years, the risk-weight increased to 200 percent (from 100 percent).
June 2011
Increased provisions for consumer loans
For new (performing) general purpose loans, general provisions were increased from 1 percent to 4 percent. General provisions for (pre-nonperforming) loans increased from 2 percent to 8 percent. The higher provisioning requirements are conditional on banks having a consumer loan portfolio exceeding 20 percent of total loans or having a general purpose loan NPL greater than 8 percent.
June 2011
Limits to credit card payments
If three or more monthly payments within a calendar year are less than half of the outstanding balance for the period, the individual credit card limits cannot be increased and cash advances for such credit cards cannot be permitted, unless the outstanding balance for the period is fully covered.
June 2011
Interest Rate Risk
Announced by the Banking Regulation and Supervision Agency (BRSA) to contain interest rate risk through capital charges on large maturity mismatches, discouraging duration gaps. Effective from 2012.
August 2011

TURKEY
INTERNATIONAL MONETARY FUND 55
Changes to minimum Capital Adequacy Requirements
Amended by the BRSA in September 2011 to apply to banks with foreign strategic shareholders as of January 2012. The minimum ratio would depend on various factors such as the CDS spread of the parent and its sovereign, EBA stress test results and the public debt ratio in the country of origin.
September 2011 Abolished February 2013
Changes to deposit insurance premiums
The deposit insurance fund introduced a premium surcharge for large banks and a new factor to calculate the banks’ score for the deposit premium determination.
September 2011
Abolition of loan to value ratios for commercial real estate loans
Loan to value ratios for loans financing commercial real estate were abolished.
April 2013
Credit card limits introduced
Consumer credit card limits were tied to incomes. Minimum payment limits and risk weights were increased. Limit increases were linked to prior income tests.
October 2013
Changes to provisioning rate
Increased general provisioning rates for uncollateralized consumer loans to 4 percent from 1 percent; Decreased general provisioning rates on export and SME loans to 0 percent and 0.5 percent respectively from previous 1 percent.
October 2013
Increase in risk weights for consumer car loans
Risk weights of those consumer car loans were increased for loans with a remaining maturity longer than a year.
October 2013
Maturity limit on consumer loans
Maturity of consumer loans is capped at 36 months for consumer loans excluding housing loans and other real estate related loans, and at 48 months for car loans.
December 2013
Limits to installments and credit card cash advances
As a general requirement, maximum number of installments is capped at 9 months. In addition to that, installments are banned for telecommunication device, jewelry, dining, groceries and fuel products.
February 2014
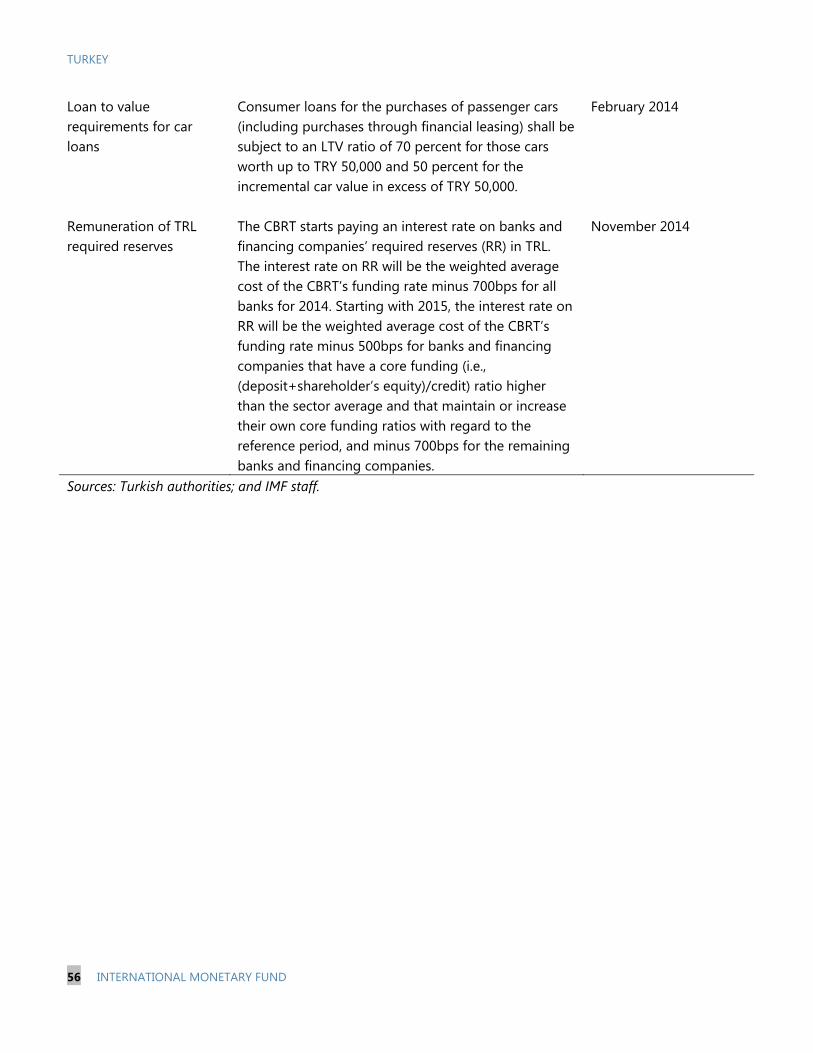
TURKEY
56 INTERNATIONAL MONETARY FUND
Loan to value requirements for car loans
Consumer loans for the purchases of passenger cars (including purchases through financial leasing) shall be subject to an LTV ratio of 70 percent for those cars worth up to TRY 50,000 and 50 percent for the incremental car value in excess of TRY 50,000.
February 2014
Remuneration of TRL required reserves
The CBRT starts paying an interest rate on banks and financing companies’ required reserves (RR) in TRL. The interest rate on RR will be the weighted average cost of the CBRT’s funding rate minus 700bps for all banks for 2014. Starting with 2015, the interest rate on RR will be the weighted average cost of the CBRT’s funding rate minus 500bps for banks and financing companies that have a core funding (i.e., (deposit+shareholder’s equity)/credit) ratio higher than the sector average and that maintain or increase their own core funding ratios with regard to the reference period, and minus 700bps for the remaining banks and financing companies.
November 2014
Sources: Turkish authorities; and IMF staff.
TURKEY STAFF REPORT FOR THE 2014 ARTICLE IV CONSULTATION—INFORMATIONAL ANNEX Prepared By
European Department
FUND RELATIONS _________________________________________________________________________ 2
WORLD BANK RELATIONS ________________________________________________________________ 5
STATISTICAL ISSUES _______________________________________________________________________ 7
CONTENTS
October 31, 2014
TURKEY
2 INTERNATIONAL MONETARY FUND
FUND RELATIONS (Data as of September 30, 2014)
A three-year SDR 6.7 billion (559 percent of quota) Stand-By Arrangement was approved in May 2005 and expired on May 10, 2008. Cumulative purchases amounted to SDR 4.4 billion.
The Board concluded an Ex-Post Assessment of Longer-Term Program Engagement and Ex-Post Evaluation of Exceptional Access for Turkey on August 1, 2008 (SM/08/248).
In September 2008, the Fund initiated Post-Program Monitoring, which concluded in September 2011.
There is no outstanding Fund credit as of August 31, 2014.
Membership Status:
Turkey became a member of the Fund on March 11, 1947. Turkey has accepted the obligations of Article VIII, Sections 2, 3, and 4 of the Fund’s Articles of Agreement as of March 22, 1990 and maintains an exchange system free of restrictions on the making of payments and transfers for current international transactions except for those maintained solely for the preservation of national or international security and which have been notified to the Fund pursuant to Executive Board Decision No. 144–(52/51).
General Resources Account
SDR Million Percent Quota Quota 1,455.80 100.00 Fund holdings of currency 1,343.03 92.25 Reserve position in Fund 112.78 7.75
SDR Department SDR Million Percent Allocation
Net cumulative allocation 1,071.33 100.00 Holdings 966.16 90.18
Outstanding Purchases and Loans
None
TURKEY
INTERNATIONAL MONETARY FUND 3
Latest Financial Arrangements
Approval
Date Expiration
Date Amount
Approved Amount Drawn
In millions of SDRs Stand By 05/11/05 05/10/08 6,662.04 4,413.60 Stand By 02/04/02 02/03/05 12,821.20 11,914.00 Stand By 12/22/99 12/20/01 15,038.40 11,738.96 Of Which: SRF 12/21/00 12/20/01 5,784.00 5,784.00
Projected Payments to the Fund1/
(In millions of SDRs; based on existing use of resources and present holdings of SDRs).
Forthcoming 2014 2015 2016 2017 2018 Principal -- -- -- -- -- Charges/Interest 0.01 0.05 0.05 0.05 0.05 Total 0.01 0.05 0.05 0.05 0.05 1/When a member has overdue financial obligations outstanding for more than three months, the amount of such arrears will be shown in this section.
Safeguard Assessments
An assessment of the central bank’s safeguards framework was conducted under the previous SBA and completed on June 29, 2005. While it uncovered no material weaknesses in the central bank’s safeguard framework, a few recommendations were made to address some remaining vulnerabilities in the areas of internal audit and controls. Those recommendations have been implemented.
Exchange Rate Arrangement:
The currency of Turkey is the Turkish lira, which replaced the new Turkish lira on January 1, 2009. The de jure exchange rate arrangement is free floating; the de facto exchange rate arrangement is floating.
Article IV Consultations:
The last Article IV staff report (IMF Country Report 13/363) was issued on December 20, 2013. Board discussion took place on November 20, 2013.
TURKEY
4 INTERNATIONAL MONETARY FUND
ROSCs
Standard or Code Assessed
Date of Issuance Document Number
Fiscal Transparency June 26, 2000 N/A Corporate Governance
December 11, 2000 Prepared by the
World Bank
Data ROSC March 14, 2002 Country Report
No. 02/55
Fiscal ROSC November 25, 2003 Country Report
No. 03/353
Fiscal ROSC March 24, 2006 Country Report
No. 06/126 FSSA and Related ROSC May 7, 2007
Country Report No. 07/361
Data ROSC September 3, 2009 Country Report
No. 09/286 BCP March 7, 2014 IAIS March 7, 2014
Recent Technical Assistance
Dept. Timing Purpose FAD/MFD February 2005 Treasury cash management and state bank reform MFD 2005–06 (several missions) Inflation targeting and monetary policy implementation ICM May 2005 Investor relations office FAD July 2005 Income tax reform FAD 2005–08 (numerous missions) Revenue administration reforms FAD February 2007 Health spending STA June 2007, November 2007 Revision of national accounts statistics and communication
strategy STA November 3–17, 2008 DATA ROSC FAD June 2009 Tax administration MCM February 2012 Stress testing framework for the financial sector supervisor FAD MCM FAD STA
September 2012 October 2012 November 2012 January 2013
G–20 budget institutions Early warning system and stress testing Measurement of structural fiscal balances National account statistics
MCM December 2013 Stress testing STA December 2013 Monetary and financial statistics STA March 2014 Government finance statistics STA March 2014 National accounts statistics FAD April 2014 Performance-based budgeting FAD May 2014 Tax revenue modeling STA May 2014 Financial sector accounts STA July 2014 Government finance statistics – public sector debt statistics
TURKEY
INTERNATIONAL MONETARY FUND 5
WORLD BANK RELATIONS 1. Turkey and the World Bank Group have a strong partnership, which has continuously deepened. Turkey’s National Development Plans form the basis of the partnership between Turkey and the World Bank Group. The Ninth (2007–13) and the new Tenth Development Plan (2014–18) overlap the CPS period. The main pillars of both Development Plans are fully consistent with the CPS. With the CPS Progress Report endorsed in October 2014, the CPS FY12-15 is extended by one year to include FY16. The three main strategic objectives and CPS pillars; namely (i) enhanced competitiveness and employment; (ii) improved equity and social services; and (iii) deepened sustainable development remain highly relevant. The CPS PR reflects less than anticipated demand for lending in support of education and increased emphasis on governance and transparency as critical elements of Turkey’s competitiveness. The CPS PR also aligns the WBG’s engagement with the new WBG Strategy and its twin goals of boosting shared prosperity and eradicating poverty.
2. The CPS has delivered financing of over US$5.5 billion during FY12-14. The distribution is: US$2.7 billion through IBRD, US$2.8 billion through IFC, and US$65 million through MIGA. In addition, IBRD lending over US$1.15 million has already been approved in FY15. The IBRD financing envelope for the five year CPS-period is expected to be up to US$6.45 billion with US$3 billion combined in FY15 and 16 reflecting the additional exposure available following the increase in the IBRD Single Borrower Limit. IFC’s own-account investment program in Turkey is expected to be in the range of US$600-650 million each in FY15 and FY16.
3. Turkey’s development priorities provide ample opportunities for unlocking value from closer cooperation across the WBG and other partners. The energy sector is an example where IBRD work on the regulatory framework has helped unlock significant IFC supported private investment to expand renewable energy and energy efficiency. The same opportunity presents itself in the health sector, the railway sector, the municipal sector and in PPPs more generally, with the health sector most advanced. In the financial sector, the combined balance sheet and product range of the WBG will be mobilized to increase the domestic funding pool and attract longer term financing, particularly to benefit Turkish exporters and SMEs and infrastructure financing. The World Bank Group engages with civil society in the preparation and implementation of projects and collaborates closely with other development partners such as the IMF, the EU, UN organizations, and other key bilateral partners
A. International Bank for Reconstruction and Development
4. Turkey is the IBRD’s fourth largest borrower in terms of debt outstanding. Turkey’s active portfolio of investment operations with the World Bank’s IBRD financing includes 13 projects with total net commitments of US$5.742 billion (as of September 2014). The investment portfolio and pipeline support the energy sector, financial and private sector development, urban development, natural resource management and health.

TURKEY
6 INTERNATIONAL MONETARY FUND
5. Turkey greatly values the WB’s knowledge work. The large analytical and advisory program with around 40 tasks during FY12-14 is carried out with the Government and a broad range of stakeholders. Major tasks are focused on long-term structural and institutional issues, including improvements in the investment climate, how to boost trade competitiveness and regional trade integration, promote skills and job creation, and orient fiscal policy to support growth. A growing area of common interest is to share Turkey’s lessons with other developing countries. A new World Bank Report ‘Turkey’s Transitions: Integration, Inclusion, and Institutions’ looks at Turkey’s lessons learned over the last 30 years. Going forward the engagement will focus on a more programmatic approach of our knowledge service delivery and the introduction of reimbursable advisory services (RAS).
6. The Turkey program is supported by selected Trust Funds. The Turkey Trust Fund portfolio currently consists of 37 Recipient or Bank-executed Trust Funds. They amount to US$167.3 million, with the bulk of funding (US$150 million) accounted for by the Clean Technology Fund (CTF).
B. International Finance Corporation
7. Turkey, a member of IFC since 1956, is IFC’s second-largest client. IFC’s work in Turkey is part of the joint World Bank/IFC CPS. From 2008 to 2011, IFC invested US$3.7 billion in 47 projects in Turkey, including US$2 billion from IFC’s own account. In the same period, IFC mobilized about US$1.7 billion. In 2010, IFC established its Istanbul office as the first IFC Operations Center. Today it is IFC’s largest office outside of Washington, DC, with 200 staff serving 52 countries in the Europe, Middle East, and North Africa region. As of December 31, 2013, IFC’s investments in Turkey during FY12–14 have been over US$2.1 billion, exceeding the expected investment program in Turkey for the FY12–15 CPS period.
C. Multilateral Guarantee Agency
8. Turkey is MIGA’s 10th largest country by gross exposure representing about 3.5 percent of MIGA’s gross portfolio. Portfolio consists of 4 projects with gross exposure of US$432 million or US$238 million net of reinsurance and all in the infrastructure sector (as of August 2014). Turkey will be the subject of targeted MIGA business development efforts to unlock opportunities for credit enhancement—as well as political risk insurance coverage. The most promising opportunities for MIGA at this point in time seem to lie in the financial sector (supporting on-lending to Small and Medium Enterprises (SMEs) and exporters), urban transport, as well as public private partnerships (PPPs) in the health care sector. Prospective MIGA support for outgoing Turkish investment, supporting backward linkages with the Turkish economy, is focused on manufacturing projects in the MNA region.
TURKEY
INTERNATIONAL MONETARY FUND 7
STATISTICAL ISSUES
1. Data provision to the Fund is broadly adequate for surveillance purposes, despite certain shortcomings.
Real Sector Statistics
2. Price Statistics: Data on producer and consumer prices are published monthly, with a short lag. The consumer price index (CPI) and the producer price index (PPI) generally conform to international standards. The methodology of the CPI was improved with the introduction of a 2003 based index, and this new CPI has been in effect since 2005. The methodology of the CPI was further improved in 2009 to take account of the prices of telecommunication services. The CPI does not cover owner-occupied dwellings, commodities produced by households for own consumption, and expenditures on commodities obtained through in-kind payments. The PPI is compiled only by product (and not by economic activity).
3. National Accounts: Quarterly national accounts are published with a 2-3 month lag. The Turkish Statistical Institute (TURKSTAT) compiles and disseminates quarterly GDP by production and expenditure approaches, in current prices and in volume terms. The annual GDP is a sum of the four quarters. The GDP by income approach was estimated for 2002–2012, but the results are not yet published. The main weaknesses of the system for compiling quarterly GDP at current prices are the lack of annual benchmarks and the reliance of fixed ratios that are outdated (ratios from the 2002 Supply and Use Tables (SUTs) are used). During the last year, provisional versions of SUTs for 2009, 2010, and 2011 have been compiled. These versions will be updated with the 2012 SUTs and will be available by the end of 2014. TURKSTAT will disseminate national accounts based on the System of National Accounts 2008 (2008 SNA)/The European System of Accounts 2010 (ESA 2010) at the end of 2015. Sectoral financial balance sheets are compiled for financial corporations on a quarterly basis, and for the general government and nonfinancial corporations on an annual basis. The financial accounts for the remaining sectors (households and rest of the world) will be disseminated by the end of 2014 and a full set of financial accounts including flows, in 2015. Monthly data on industrial production are published with a lag of five to six weeks.
4. There is a wide range of data on labor market developments, with the biannual Household Labor Force Survey (HLFS) replaced with a monthly survey at the beginning of 2000. HLFS is published every month. Coverage of wage developments in the private sector has improved through the use of quarterly surveys of the manufacturing sector.
Government Finance Statistics
5. Budgetary data are published monthly, with a lag of some 2−3 weeks. Coverage of the budget is incomplete, with some fiscal operations conducted through extra budgetary funds, for which data are available only with long lags. Fiscal analysis is further complicated by some quasi-
TURKEY
8 INTERNATIONAL MONETARY FUND
fiscal operations carried out by state banks, state economic enterprises (SEEs), and other public entities; and technical problems associated with consolidating the cash-based accounts of governmental entities with the accrual-based accounting of SEEs. It is difficult to reconcile fiscal data with monetary and BOP data, especially in the accounting of external debt flows and central government deposits.
Monetary and Financial Statistics
6. Monetary and Financial Statistics: Data on the central bank balance sheet, and provisional data on the main monetary aggregates and total domestic credit, are published weekly, with a one- and two-week lag, respectively. Data on the monetary survey and deposit interest rates are published monthly, with a one month lag, except for year-end data, where the lag is two months.
7. Public data on banks’ external funding could be improved. The CBRT reports data on banks’ foreign assets and liabilities. However, these include data on transactions with banks’ branches abroad that are classified as nonresidents in accordance with the IMF’s Monetary and Financial Statistics Manual and from the BOP perspective. The Banking Regulatory and Supervision Agency (BRSA) maintains data on the consolidated banking sector, which are compiled based on the Basel principles with more accurate information on the true foreign assets and liabilities; however, these data are not currently disseminated in a public report.
8. Financial sector surveillance: In the area of financial soundness indicators (FSIs), the BRSA reports all 12 core FSIs, 12 of the 13 encouraged FSIs for deposit takers, and 11 of the other encouraged FSIs—two FSIs for other financial corporations, three FSIs for the nonfinancial corporations sector, one FSI for households, two FSIs for market liquidity, and three FSIs for real estate markets. The FSI data and metadata for Turkey are posted on the Fund’s FSI website.
External Sector Statistics
9. External sector statistics: External sector statistics are compiled in broad conformity with the conceptual framework of the fifth edition of the Balance of Payments Manual (BPM5).
Data Standards and Quality
10. Turkey subscribes to the Special Data Dissemination Standard (SDDS). The latest Data ROSC was published in September 2009.
Reporting to STA
11. Turkey reports fiscal data for publication in the Government Finance Statistics Yearbook. The latest data available are for 2012 and cover the general government sector and its subsectors with coverage of both stocks and flows, including a full general government balance
TURKEY
INTERNATIONAL MONETARY FUND 9
sheet. Monthly data are reported on an irregular basis for publication in International Financial Statistics (IFS), starting from September 2009.
12. The Central Bank of the Republic of Turkey (CBRT) reports to STA the Standardized Report Forms 1SR for the Central Bank and 2SR for the Other Depository Corporations on a monthly basis with a one month lag. The SRF 4SR for Other Financial Corporations has been reported to the Fund on a quarterly basis from May 2014 and published in IFS from the July 2014 issue.
13. The CBRT reports quarterly BOP data to STA with about two months lag; in May 2012, it started reporting quarterly IIP data from 2006 onward. The CBRT participates in the Coordinated Portfolio Investment Survey (CPIS) and Coordinated Direct investment Survey (CDIS). For CPIS, starting with end-June 2013 data, the CBRT reports with semi-annual frequency and enhanced scope, including data on the institutional sector of the nonresident issuers of securities, and on the institutional sector of the resident holder cross-classified by the institutional sector of selected nonresident issuers. In addition, the CBRT commenced reporting encouraged additional detail on the currency composition of portfolio investment holdings.
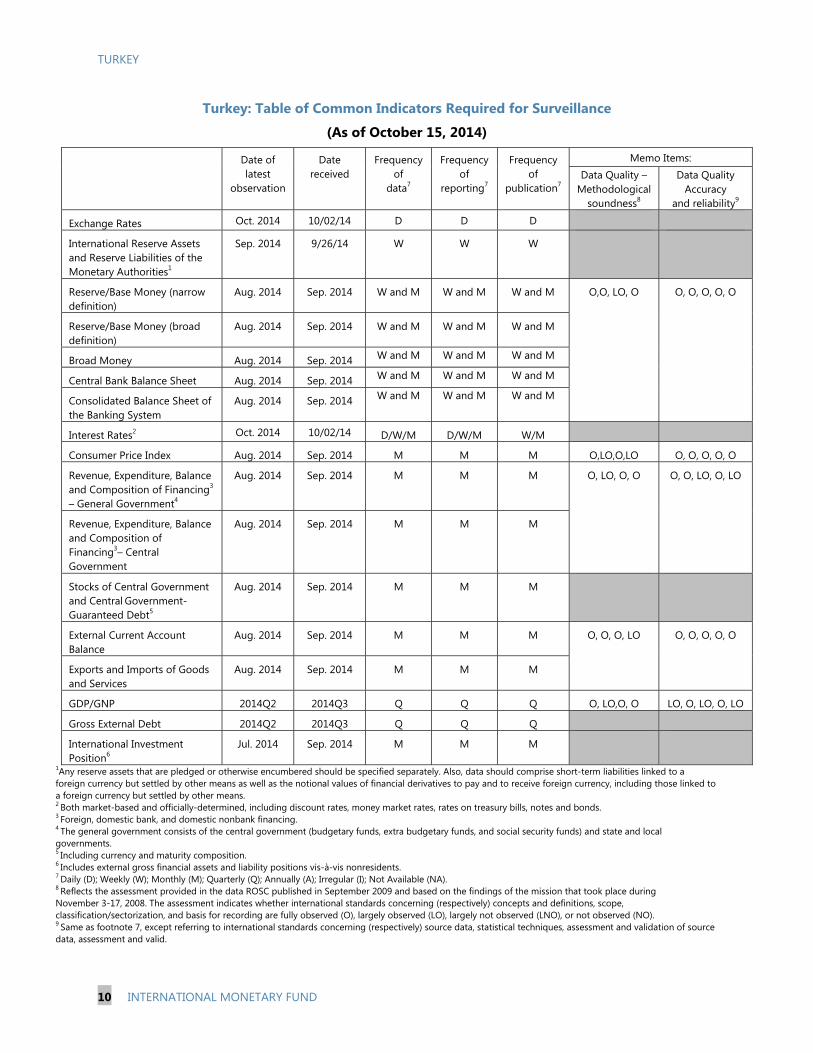
TURKEY
10 INTERNATIONAL MONETARY FUND
Turkey: Table of Common Indicators Required for Surveillance
(As of October 15, 2014) Date of
latest observation
Date received
Frequency of
data7
Frequency of
reporting7
Frequency of
publication7
Memo Items: Data Quality –
Methodological soundness8
Data Quality Accuracy
and reliability9
Exchange Rates Oct. 2014 10/02/14 D D D
International Reserve Assets and Reserve Liabilities of the Monetary Authorities1
Sep. 2014 9/26/14 W W W
Reserve/Base Money (narrow definition)
Aug. 2014 Sep. 2014 W and M W and M W and M O,O, LO, O O, O, O, O, O
Reserve/Base Money (broad definition)
Aug. 2014 Sep. 2014 W and M W and M W and M
Broad Money Aug. 2014 Sep. 2014 W and M W and M W and M
Central Bank Balance Sheet Aug. 2014 Sep. 2014 W and M W and M W and M
Consolidated Balance Sheet of the Banking System
Aug. 2014 Sep. 2014 W and M W and M W and M
Interest Rates2 Oct. 2014 10/02/14 D/W/M D/W/M W/M
Consumer Price Index Aug. 2014 Sep. 2014 M M M O,LO,O,LO O, O, O, O, O
Revenue, Expenditure, Balance and Composition of Financing3 – General Government4
Aug. 2014 Sep. 2014 M M M O, LO, O, O O, O, LO, O, LO
Revenue, Expenditure, Balance and Composition of Financing3– Central Government
Aug. 2014 Sep. 2014 M M M
Stocks of Central Government and Central Government-Guaranteed Debt5
Aug. 2014 Sep. 2014 M M M
External Current Account Balance
Aug. 2014 Sep. 2014 M M M O, O, O, LO O, O, O, O, O
Exports and Imports of Goods and Services
Aug. 2014 Sep. 2014 M M M
GDP/GNP 2014Q2 2014Q3 Q Q Q O, LO,O, O LO, O, LO, O, LO
Gross External Debt 2014Q2 2014Q3 Q Q Q
International Investment Position6
Jul. 2014 Sep. 2014 M M M
1Any reserve assets that are pledged or otherwise encumbered should be specified separately. Also, data should comprise short-term liabilities linked to a foreign currency but settled by other means as well as the notional values of financial derivatives to pay and to receive foreign currency, including those linked to a foreign currency but settled by other means. 2 Both market-based and officially-determined, including discount rates, money market rates, rates on treasury bills, notes and bonds. 3 Foreign, domestic bank, and domestic nonbank financing. 4 The general government consists of the central government (budgetary funds, extra budgetary funds, and social security funds) and state and local governments. 5 Including currency and maturity composition. 6 Includes external gross financial assets and liability positions vis-à-vis nonresidents. 7 Daily (D); Weekly (W); Monthly (M); Quarterly (Q); Annually (A); Irregular (I); Not Available (NA). 8 Reflects the assessment provided in the data ROSC published in September 2009 and based on the findings of the mission that took place during November 3-17, 2008. The assessment indicates whether international standards concerning (respectively) concepts and definitions, scope, classification/sectorization, and basis for recording are fully observed (O), largely observed (LO), largely not observed (LNO), or not observed (NO). 9 Same as footnote 7, except referring to international standards concerning (respectively) source data, statistical techniques, assessment and validation of source data, assessment and valid.
Press Release No. 14/535 FOR IMMEDIATE RELEASE November 21, 2014
IMF Executive Board Concludes 2014 Article IV Consultation with Turkey On November 21, 2014, the Executive Board of the International Monetary Fund (IMF) concluded the Article IV consultation with Turkey.1 Turkey’s economy has grown on average by 6 percent annually since 2010, but this has come at the expense of a large external deficit making the economy sensitive to changes in external financing conditions. Macroeconomic policies have been too accommodative, inflation is high and well above the authorities’ target, real policy interest rates remain negative, and the exchange rate continues to be stronger than suggested by fundamentals. These imbalances are holding back growth potential and increasing risks. They need to be addressed with carefully sequenced macroeconomic policies and structural reforms aimed at increasing aggregate savings, competitiveness and potential output. The financial system remains well capitalized with non performing loans low and well provisioned. However, banks are increasingly reliant on external wholesale funding in foreign exchange and, in tandem, have increased their indirect foreign exchange risk. The main risk for Turkey remains a capital flows reversal, associated with monetary policy normalization in advance economies or changes in the country risk premium. Other risks center on slower European growth, geopolitical issues and the strength of the policy framework.
1 Under Article IV of the IMF's Articles of Agreement, the IMF holds bilateral discussions with members, usually every year. A staff team visits the country, collects economic and financial information, and discusses with officials the country's economic developments and policies. On return to headquarters, the staff prepares a report, which forms the basis for discussion by the Executive Board.
International Monetary Fund 700 19th Street, NW Washington, D. C. 20431 USA
2
Executive Board Assessment2 Executive Directors welcomed Turkey’s positive growth and employment performance in recent years, and commended the authorities for weathering well financial market turbulence in early 2014. However, Directors noted that high inflation, a large external deficit, and reliance on external financing pose vulnerabilities and could put pressures on the economy. Against this background, they emphasized that macroeconomic policies should be geared towards rebalancing the economy, lowering inflation, and strengthening buffers together with ambitious structural reforms aimed at boosting domestic savings and fully realizing Turkey’s economic potential.
Directors agreed that fiscal policy should play a bigger role in addressing external vulnerabilities and reducing the burden on monetary policy, while providing space for greater spending in priority areas. Accordingly, they supported the fiscal tightening envisaged in the 2015 budget and the substantial increase in the primary surplus within the 2015-17 medium-term program, although a few Directors saw merit in a more ambitious pace of adjustment. Directors agreed that consolidation efforts should primarily focus on improving spending efficiency and limiting current expenditure growth while preserving capital investment.
While welcoming the monetary tightening in early 2014, Directors generally called for a renewed focus on reducing the inflation rate, by setting and sustaining a positive real policy rate to reduce inflation and anchor expectations. Most Directors also encouraged further normalization of the monetary policy framework, which would improve communications and strengthen monetary transmission. A few Directors were of the view that the monetary policy framework could have multiple objectives, taking into account the various challenges the country faces. Directors highlighted that increasing foreign exchange reserves, as market conditions permit, will help strengthen resilience.
Directors noted that the financial system remains sound and well capitalized but called for continued vigilance. They welcomed the success of recent macroprudential measures to limit consumer credit growth, and to encourage more core funding in the banking sector. Directors recommended additional steps to curb growth in wholesale foreign exchange funding and to reduce incentives for the non-financial corporate sector to take on exchange rate risk. They commended the significant progress made in enhancing Turkey’s AML/CFT framework.
2 At the conclusion of the discussion, the Managing Director, as Chairman of the Board, summarizes the views of Executive Directors, and this summary is transmitted to the country's authorities. An explanation of any qualifiers used in summings up can be found here: http://www.imf.org/external/np/sec/misc/qualifiers.htm.

3
Directors emphasized the importance of increasing national savings, particularly private savings, and reducing reliance on external financing. They encouraged the authorities to move forward with the ambitious reform agenda included in the 10th Development Plan, giving priority to increasing private sector savings, improving competitiveness and the business climate, and sustaining education and labor market reforms to boost productivity.

4
Turkey: Selected Economic Indicators, 2009−15 Population (2012): 74.9 million Per capita GDP (2012): $10,527 Quota (2012): SDR 1,455.8 million
2009 2010 2011 2012 2013 2014 2015
Proj.
Real sector (Percent) Real GDP growth rate -4.8 9.2 8.8 2.1 4.1 3.0 3.0
Contributions to GDP growth
Private domestic demand -8.3 12.6 9.5 -2.9 5.1 -0.1 2.6
Public spending 0.8 0.9 0.4 1.0 1.6 1.5 0.9
Net exports 2.7 -4.4 -1.1 4.0 -2.6 1.6 -0.4
GDP deflator growth rate 5.3 5.7 8.6 6.9 6.1 9.8 6.7
Nominal GDP growth rate 0.2 15.4 18.1 9.2 10.5 13.0 9.9
CPI inflation (12-month; end-of period) 6.5 6.4 10.4 6.2 7.4 9.0 7.1
PPI inflation (12-month; end-of-period) 5.9 8.9 13.3 2.5 7.0 8.8 6.2
Unemployment rate 13.1 11.1 9.1 8.4 9.0 9.5 10.4
Average nominal treasury bill interest rate 1/ 11.6 8.5 8.8 8.4 7.4 9.6 …
Average real policy rate 1/ 2.4 -1.6 -0.4 -2.9 -2.5 -0.3 …
Nonfinancial public sector (Percent GDP) Primary balance -0.9 0.5 2.0 1.3 1.1 0.3 0.9
Net interest payments 4.6 3.7 2.7 2.8 2.7 2.3 2.5
Overall balance -5.5 -3.1 -0.7 -1.5 -1.6 -2.0 -1.7
General government structural primary balance 2/
0.9 0.6 0.1 -0.7 -0.7 -0.8 -0.6
Debt of the public sector
General government gross debt (EU definition)
46.1 42.3 39.1 36.2 36.2 33.7 32.4
Nonfinancial public sector net debt 39.5 36.8 33.4 30.4 30.0 28.4 27.6
External sector
Current account balance -2.0 -6.2 -9.7 -6.1 -7.9 -5.8 -6.0
Nonfuel current account balance 2.3 -1.8 -3.6 0.5 -1.9 0.0 -0.4
Gross financing requirement 18.1 18.9 24.6 21.6 25.4 26.8 26.2
Foreign direct investment (net) 1.2 1.0 1.8 1.2 1.2 1.1 1.7
Gross external debt 3/ 43.8 39.9 39.2 43.0 47.4 49.4 49.1
Net external debt 24.2 23.8 23.8 24.1 28.0 30.2 30.9
Short-term external debt (by remaining maturity)
15.5 16.2 16.0 18.4 20.8 21.4 20.7
Monetary aggregates
Nominal growth of M2 broad money (percent)
13.0 19.1 14.8 10.2 22.2 13.0 9.9
GDP (billions of U.S. dollars) 4/ 614.4 731.5 774.7 788.6 821.9 … …

5
GDP (billions of Turkish lira) 952.6 1,098.8 1,297.7 1,416.8 1,565.2 1,769.3 1,944.5
Sources: Turkish authorities; and IMF staff estimates and projections.
1/ Average to latest available. 2/ The structural balance is estimated using the absorption gap method and excludes one-off operations. 3/ The external debt ratio is calculated by dividing external debt numbers in U.S. dollars based on official Treasury figures by GDP in U.S. dollars calculated by staff using the average exchange rate (consolidated from daily data published by the CBRT).
4/ GDP in U.S. dollars is derived using the average exchange rate (consolidated from daily data published by the CBRT).
Statement by Mr. Ibrahim Canakci, Executive Director for Turkey and Mr. Cem Gokcen, Advisor to Executive Director
November 21, 2014 We would like to thank staff for the comprehensive and informative set of papers that provide an in-depth analysis of the Turkish economy and financial system. Our authorities appreciate the thorough and candid discussions with the Article IV mission. The Turkish economy registered a notable recovery in the wake of the global economic crisis and expanded by 5.5 percent on average between 2010 and 20141. Unlike the economic plague described as jobless recovery, buoyant growth in Turkey translated into 5.7 million new jobs since total employment dipped in 2009. A widening external deficit and inflationary pressures, however, have emerged as side effects of the recovery, driven by strong credit expansion and domestic absorption. The staff report characterizes the improvements in the external accounts as cyclical. However, the authorities view that the prudent policy mix was the driving force behind the rebalancing even in the most recent period, while acknowledging that cyclical factors have also provided some support. In fact, it should be noted that starting from the second half of 2011, the authorities responded in a timely manner and introduced a set of measures to limit domestic demand growth and contain a rapid increase in credit and a widening in the current account deficit. In response to tight fiscal policies, monetary policy response and macroprudential measures, credit growth remained within the authorities’ indicative limits and the current account deficit-to-GDP ratio declined by 3.6 percentage points to 6.1 percent in 2012. Furthermore, consumer price inflation plummeted to 6.2 percent in 2012 year-end, the lowest level in the last 25 years. In view of the reemergence of inflationary pressures and a widening current account deficit in 2013, additional macroprudential measures were put in place and monetary policy was tightened in late 2013 and early 2014. The overall macroeconomic setting remains stable. The electoral cycle will end in the first half of 2015, and no elections are scheduled to take place between mid-2015 and 2019, which will provide a window of opportunity for major structural reforms. Notwithstanding external shocks, the Turkish economy is on track to grow at a sustainable pace. Denting the external imbalance, maintaining price stability and upholding the reform momentum remain the overarching objectives. Fiscal policy will be supportive of the rebalancing process and relieve the pressure on monetary policy while contributing to the growth momentum and domestic savings. Monetary policy is focused on price stability with financial stability under its radar. The authorities will pursue an ambitious reform agenda.
1 The 2014 figure is based on the Medium-Term Program forecasts.
2
Recent Macroeconomic Developments Growth After the strong growth reading in the first quarter of 2014, economic activity lost some steam. Private expenditures waned in the second quarter as macroprudential measures kicked in late 2013 to early 2014 while public spending remained weak. A contraction in the agricultural sector and the negative contribution from the construction sector weighed on growth. In the first half of 2014, year-on-year growth remained moderate at around 3.3 percent, while net exports’ contribution to the headline figure was 2.7 percent. Leading indicators—except for investment demand—point to a revival in economic activity amid relatively weak performance in the second quarter. In September, industrial production gained pace and grew by 9.3 percent in annual terms. Subdued growth, especially in the major trading partners, and geopolitical tensions may limit export growth. GDP growth is likely to be around 3.3 in 2014, a tad higher than staff’s expectations, with external demand contributing 2 percentage points. External Balance Improvement in the real exchange rate, moderate credit expansion and demand rebalancing supported the adjustment in the current account deficit. September current account deficit data came in at US $2.2 billion, which brings down the 12 month rolling deficit from US $48.9 billion to US $46.7 billion. Total exports, mainly driven by demand from European countries, are expected to reach US $161 billion in 2014. Imports will be around US $244 billion and the current account deficit will plunge to 5.6 percent of GDP in 2014, which is almost 1 percentage point better than envisaged at the beginning of the year. The rising trend in the share of FDI and long-term capital flows, which includes banking and the real sectors’ long-term net credit and bonds issued by banks and non-financial sectors, in the financing mix highlights the improvement in external deficit financing. Inflation Inflation hovered above the target triggered mostly by high domestic food prices and FX pass-through. Negative supply-side shocks brought about by the adverse weather conditions put significant pressure on food prices and contributed to the divergence between international and domestic food prices. The strong FX pass-through and tax hikes on automobiles also fueled the headline rate. After climbing to 14.4 percent in August 2014, annual food price inflation eased to 12.6 percent in October on the back of the deceleration in unprocessed food inflation. The food price inflation’s contribution to the headline figure was 3.1 percentage points in October. The deterioration in core inflation started to fade recently and the core inflation trend improved in the third quarter reflecting the impacts of the tight monetary policy stance and macroprudential measures. Yet, administrative price adjustments in natural gas and electricity tariffs in October
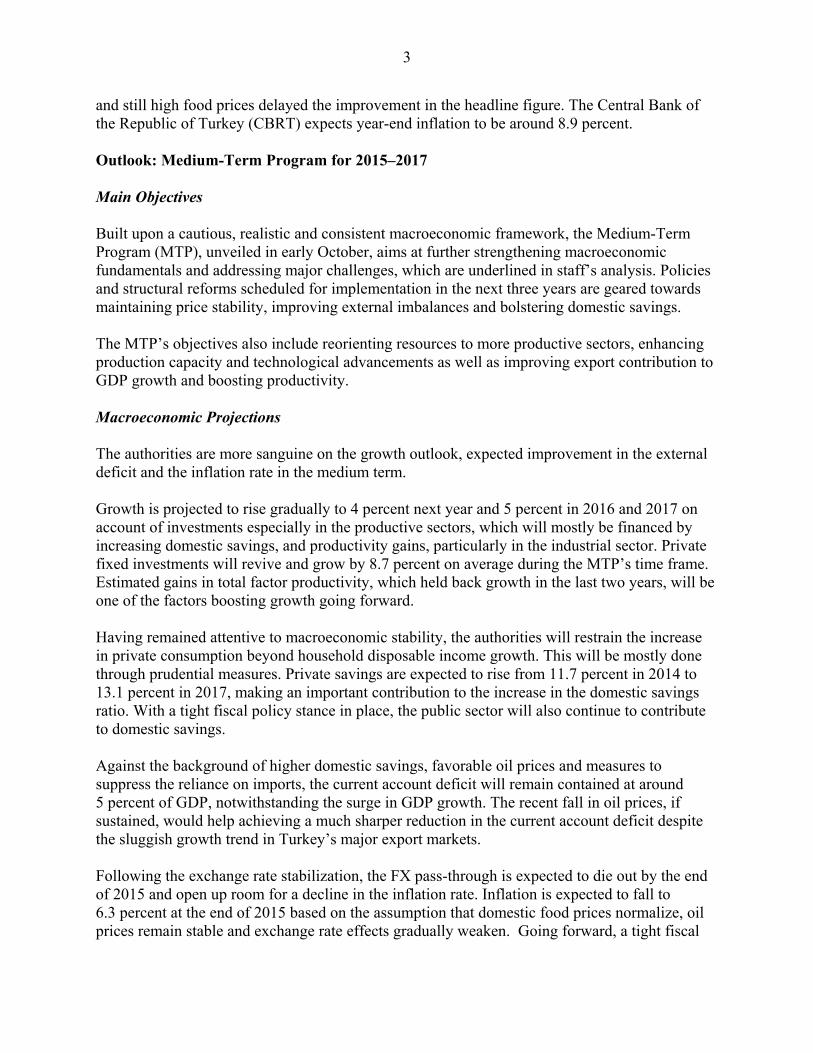
3
and still high food prices delayed the improvement in the headline figure. The Central Bank of the Republic of Turkey (CBRT) expects year-end inflation to be around 8.9 percent. Outlook: Medium-Term Program for 2015–2017 Main Objectives Built upon a cautious, realistic and consistent macroeconomic framework, the Medium-Term Program (MTP), unveiled in early October, aims at further strengthening macroeconomic fundamentals and addressing major challenges, which are underlined in staff’s analysis. Policies and structural reforms scheduled for implementation in the next three years are geared towards maintaining price stability, improving external imbalances and bolstering domestic savings. The MTP’s objectives also include reorienting resources to more productive sectors, enhancing production capacity and technological advancements as well as improving export contribution to GDP growth and boosting productivity. Macroeconomic Projections The authorities are more sanguine on the growth outlook, expected improvement in the external deficit and the inflation rate in the medium term. Growth is projected to rise gradually to 4 percent next year and 5 percent in 2016 and 2017 on account of investments especially in the productive sectors, which will mostly be financed by increasing domestic savings, and productivity gains, particularly in the industrial sector. Private fixed investments will revive and grow by 8.7 percent on average during the MTP’s time frame. Estimated gains in total factor productivity, which held back growth in the last two years, will be one of the factors boosting growth going forward. Having remained attentive to macroeconomic stability, the authorities will restrain the increase in private consumption beyond household disposable income growth. This will be mostly done through prudential measures. Private savings are expected to rise from 11.7 percent in 2014 to 13.1 percent in 2017, making an important contribution to the increase in the domestic savings ratio. With a tight fiscal policy stance in place, the public sector will also continue to contribute to domestic savings. Against the background of higher domestic savings, favorable oil prices and measures to suppress the reliance on imports, the current account deficit will remain contained at around 5 percent of GDP, notwithstanding the surge in GDP growth. The recent fall in oil prices, if sustained, would help achieving a much sharper reduction in the current account deficit despite the sluggish growth trend in Turkey’s major export markets. Following the exchange rate stabilization, the FX pass-through is expected to die out by the end of 2015 and open up room for a decline in the inflation rate. Inflation is expected to fall to 6.3 percent at the end of 2015 based on the assumption that domestic food prices normalize, oil prices remain stable and exchange rate effects gradually weaken. Going forward, a tight fiscal

4
policy stance will be an essential factor contributing to the monetary guardian’s fight against inflation. In the medium term, inflation is forecast to converge to the target. Macroeconomic Policies and Structural Reforms Fiscal Policy Fiscal discipline remains intact. The authorities plan to limit current expenditure growth in an effort to rein in the public investment-savings deficit while capital spending will be reoriented to infrastructure spending and R&D investments. The total public sector primary surplus will increase by 1.4 percentage points to 1.8 percent of GDP in 2017 with the public sector overall balance yielding a surplus of 0.1 percent of GDP. Improvement in the primary surplus will decrease public debt to 28.5 percent of GDP in 2017. As a cornerstone of Turkey’s macroeconomic policy setting, fiscal discipline will help to prop up domestic savings and provide the necessary space that may be required for structural reforms. Strong public balances will also support the CBRT’s mandate to maintain price stability. 2015 draft budget law is crafted to strike the right balance between strengthening infrastructure, improving quality of public services and maintaining fiscal discipline. The authorities are also focused on maximizing the contribution of public investments to growth, and improving the resource allocation and efficiency of public spending. Education and healthcare spending will continue to receive a major share of the budget, with education spending constituting 22.5 percent of tax revenues. The new Income Tax Law, submitted to the Parliament, will broaden the tax base, make the tax system fairer and enforce voluntary tax compliance. New policies are in the pipeline that will modernize the tax procedures law and streamline stamp duty and other charges that will lower the cost of doing business. The authorities are also committed to effectively fight against the informal economy. Monetary Policy The FX market came under pressure due to heightened financial market woes in emerging markets and country-specific factors at the end of 2013. The CBRT provided FX liquidity through foreign exchange selling auctions and directly intervened in the FX market when the pricing mechanism was impaired. In an effort to contain the adverse implications of market jitters on price and macroeconomic stability, the CBRT hiked the one week repo rate by 550 basis points to 10 percent in January 2014. Furthermore, the monetary policy framework was simplified with Turkish Lira liquidity provided mostly at the one week repo rate. Frontloaded monetary tightening proved effective as risk premia recovered notably in the second quarter, which also reflects diminished domestic uncertainties. Amid improvements in the global liquidity conditions and the external and domestic sentiment, and signs that the cumulative impact of the currency depreciation on inflation steadily declines, the CBRT initiated a series of measured rate cuts to roll back frontloaded tightening early this year. A first rate change in April 2014 slashed the late liquidity window lending rate to
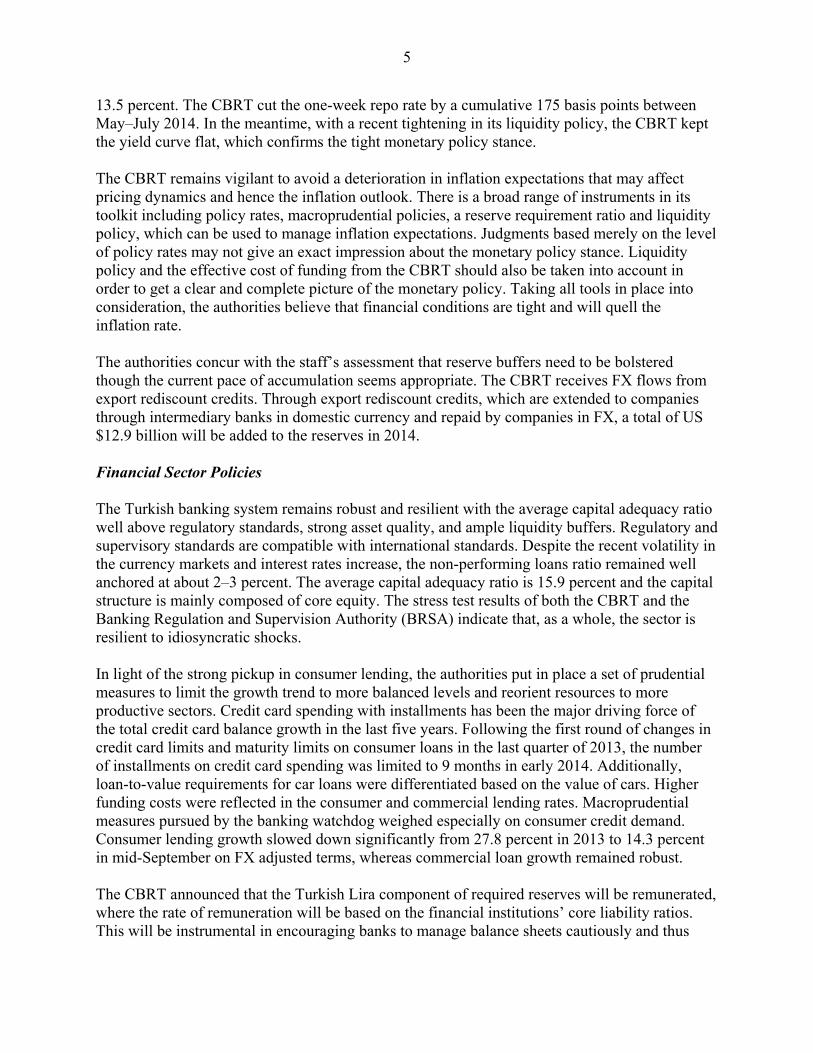
5
13.5 percent. The CBRT cut the one-week repo rate by a cumulative 175 basis points between May–July 2014. In the meantime, with a recent tightening in its liquidity policy, the CBRT kept the yield curve flat, which confirms the tight monetary policy stance. The CBRT remains vigilant to avoid a deterioration in inflation expectations that may affect pricing dynamics and hence the inflation outlook. There is a broad range of instruments in its toolkit including policy rates, macroprudential policies, a reserve requirement ratio and liquidity policy, which can be used to manage inflation expectations. Judgments based merely on the level of policy rates may not give an exact impression about the monetary policy stance. Liquidity policy and the effective cost of funding from the CBRT should also be taken into account in order to get a clear and complete picture of the monetary policy. Taking all tools in place into consideration, the authorities believe that financial conditions are tight and will quell the inflation rate. The authorities concur with the staff’s assessment that reserve buffers need to be bolstered though the current pace of accumulation seems appropriate. The CBRT receives FX flows from export rediscount credits. Through export rediscount credits, which are extended to companies through intermediary banks in domestic currency and repaid by companies in FX, a total of US $12.9 billion will be added to the reserves in 2014. Financial Sector Policies The Turkish banking system remains robust and resilient with the average capital adequacy ratio well above regulatory standards, strong asset quality, and ample liquidity buffers. Regulatory and supervisory standards are compatible with international standards. Despite the recent volatility in the currency markets and interest rates increase, the non-performing loans ratio remained well anchored at about 2–3 percent. The average capital adequacy ratio is 15.9 percent and the capital structure is mainly composed of core equity. The stress test results of both the CBRT and the Banking Regulation and Supervision Authority (BRSA) indicate that, as a whole, the sector is resilient to idiosyncratic shocks. In light of the strong pickup in consumer lending, the authorities put in place a set of prudential measures to limit the growth trend to more balanced levels and reorient resources to more productive sectors. Credit card spending with installments has been the major driving force of the total credit card balance growth in the last five years. Following the first round of changes in credit card limits and maturity limits on consumer loans in the last quarter of 2013, the number of installments on credit card spending was limited to 9 months in early 2014. Additionally, loan-to-value requirements for car loans were differentiated based on the value of cars. Higher funding costs were reflected in the consumer and commercial lending rates. Macroprudential measures pursued by the banking watchdog weighed especially on consumer credit demand. Consumer lending growth slowed down significantly from 27.8 percent in 2013 to 14.3 percent in mid-September on FX adjusted terms, whereas commercial loan growth remained robust. The CBRT announced that the Turkish Lira component of required reserves will be remunerated, where the rate of remuneration will be based on the financial institutions’ core liability ratios. This will be instrumental in encouraging banks to manage balance sheets cautiously and thus
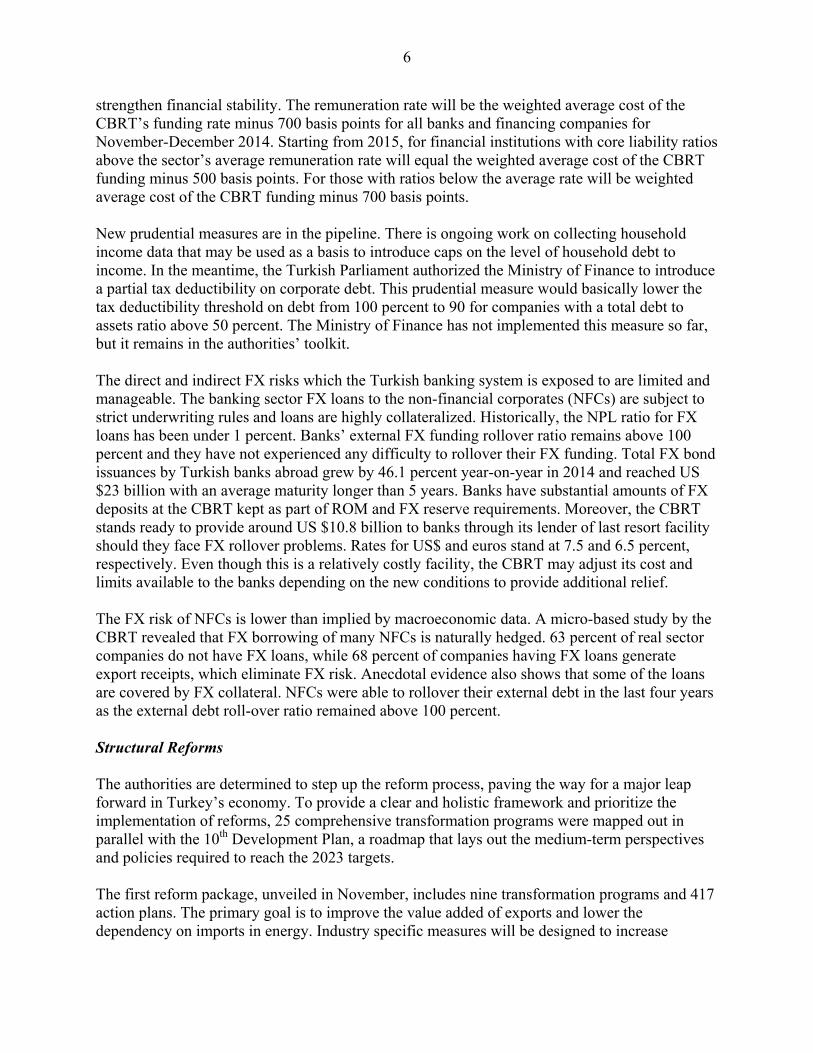
6
strengthen financial stability. The remuneration rate will be the weighted average cost of the CBRT’s funding rate minus 700 basis points for all banks and financing companies for November-December 2014. Starting from 2015, for financial institutions with core liability ratios above the sector’s average remuneration rate will equal the weighted average cost of the CBRT funding minus 500 basis points. For those with ratios below the average rate will be weighted average cost of the CBRT funding minus 700 basis points. New prudential measures are in the pipeline. There is ongoing work on collecting household income data that may be used as a basis to introduce caps on the level of household debt to income. In the meantime, the Turkish Parliament authorized the Ministry of Finance to introduce a partial tax deductibility on corporate debt. This prudential measure would basically lower the tax deductibility threshold on debt from 100 percent to 90 for companies with a total debt to assets ratio above 50 percent. The Ministry of Finance has not implemented this measure so far, but it remains in the authorities’ toolkit. The direct and indirect FX risks which the Turkish banking system is exposed to are limited and manageable. The banking sector FX loans to the non-financial corporates (NFCs) are subject to strict underwriting rules and loans are highly collateralized. Historically, the NPL ratio for FX loans has been under 1 percent. Banks’ external FX funding rollover ratio remains above 100 percent and they have not experienced any difficulty to rollover their FX funding. Total FX bond issuances by Turkish banks abroad grew by 46.1 percent year-on-year in 2014 and reached US $23 billion with an average maturity longer than 5 years. Banks have substantial amounts of FX deposits at the CBRT kept as part of ROM and FX reserve requirements. Moreover, the CBRT stands ready to provide around US $10.8 billion to banks through its lender of last resort facility should they face FX rollover problems. Rates for US$ and euros stand at 7.5 and 6.5 percent, respectively. Even though this is a relatively costly facility, the CBRT may adjust its cost and limits available to the banks depending on the new conditions to provide additional relief. The FX risk of NFCs is lower than implied by macroeconomic data. A micro-based study by the CBRT revealed that FX borrowing of many NFCs is naturally hedged. 63 percent of real sector companies do not have FX loans, while 68 percent of companies having FX loans generate export receipts, which eliminate FX risk. Anecdotal evidence also shows that some of the loans are covered by FX collateral. NFCs were able to rollover their external debt in the last four years as the external debt roll-over ratio remained above 100 percent. Structural Reforms The authorities are determined to step up the reform process, paving the way for a major leap forward in Turkey’s economy. To provide a clear and holistic framework and prioritize the implementation of reforms, 25 comprehensive transformation programs were mapped out in parallel with the 10th Development Plan, a roadmap that lays out the medium-term perspectives and policies required to reach the 2023 targets. The first reform package, unveiled in November, includes nine transformation programs and 417 action plans. The primary goal is to improve the value added of exports and lower the dependency on imports in energy. Industry specific measures will be designed to increase
7
productivity and competitiveness. In response to these policies, the export-import coverage ratio, which stood at 60 percent in 2013, is estimated to soar to 70 percent in 2018. Special emphasis is put on innovation, R&D and technology development. The government will support startup companies especially in the innovative fields along with investments in technology intensive production in several sectors. Domestic resource utilization in energy production and energy efficiency is essential to lower the energy import bill, which constituted approximately 22 percent of total imports in 2013. The authorities will develop new financing models and incentives for energy efficiency investments, encourage capacity improvements in renewable energy and promote efficient use of domestic coal resources. With the remaining transformation programs in the pipeline the authorities will address the weaknesses in the labor market, improve the business climate, and bolster competitiveness and productivity.