imc unit 2: investment practice manual - 7citymedia.co.uk · behavioural finance ... • be able to...
TRANSCRIPT
Portfolio theory 239
Portfolio theory1. Introduction
1.1. Chapter overviewThis chapter begins by defining what we mean by returns. Broadly speaking returns are your incomeand gains as a percentage of your investment. However, you will see that there is more than one wayof calculating returns. Different methods considered include holding period return, money-weightedand time-weighted. You will learn the advantages and disadvantages of each method.
The level of returns generated on an investment is not all you should consider. Risk is also an importantconsideration. A low risk investment is one which gives fairly constant returns. A high risk investment isone in which returns are highly variable. Investors who are willing to take on high levels of risk expecthigh levels of return. This chapter introduces two methods of measuring risk, standard deviation andBeta.
Standard deviation is a measure of risk on a standalone basis. Another measure of risk for assets ina portfolio is Beta, which measures risk relative to other investments. Put simply, the Beta of a stockor portfolio describes how its returns perform relative to a base index. Identifying the appropriate riskmeasure is critical to assessing performance.
Beta is a vital component to a formula known as CAPM. Once you have mastered this formula you willbe able to predict the level of return a particular stock should achieve, given the level of risk taken on.It is one of the most fundamental formulae in investment theory.
Finally, you will learn about risk adjusted measures of performance. A fund manager who achieves a12% return is not necessarily better than a fund manager who achieves a 10% return. Returns are onlyhalf the story.
1.2. Learning outcomesOn completion of this module, you will:
Portfolio construction
• Understand the concepts and strategies behind portfolio construction
• Understand how management styles can differ
• Appreciate the implications of cost
Passive vs. active fund management styles
• Passive vs. active styles
• Understand the features and risks of passive management: tracking and tracking error
• Understand the features and risks of active management: top down and bottom up bias
• Understand the concept of tilting
The efficient market hypothesis (EMH)
• Understand the efficient markets hypothesis

240 Learning outcomes
• Understand the three forms of EMH: weak, semi-strong and strong
Behavioural finance
• Understand the concept of behavioural finance
• Understand the concepts of ‘financial amnesia’ and how asset price ‘bubbles’ arise
Performance measurement
• Be able to calculate and interpret the holding period return, the money weighted rate of return andthe time weighted rate of return
Risk and reward
• Understand the risk-reward connection
• Understand the concept of the risk premium
• Understand the concepts of systemic and non-systemic risk
Measuring risk
• Understand the role of standard deviation in identifying and measuring financial risk
• Appreciate the role played by diversification
• Know how to interpret the Beta coefficient
• Be able to calculate a portfolio Beta
• Understand the concept and uses of the drawdown measure of risk
• Understand the concept and uses of value at risk
Capital Asset Pricing Model (CAPM)
• Understand the assumptions underlying the construction of the capital asset pricing model (CAPM)
• Understand the concept of the security market line
• Understand the concept of Alpha
• Be able to apply the CAPM formula to equity portfolio selection decisions
Risk adjusted performance measures
• Be able to calculate and evaluate risk-adjusted performance measures, i.e. information ratio, Sharpe,Treynor and Jensen
• Understand how the Jensen measure can be decomposed
• Understand the limitations of risk adjusted performance
Bond portfolios
• Appreciate the characteristics of an all-bond portfolio

Portfolio theory 241
• Be able to calculate and understand portfolio duration
• Understand how CAPM can be used for bond portfolios
Management of bond portfolios
• Understand the risks and rewards of 'riding the yield curve'
• Understand the differences between a cash matching and immunisation strategy
• Understand the methods of assessing the returns of a bond portfolio manager

242 Portfolio construction
2. Portfolio construction
2.1. BackgroundPortfolio construction refers to the activity of collating and managing a collection of different assets, e.g.shares, bonds or real estate.
A fund/portfolio manager working on behalf of a financial institution, such as a unit trust or pension fund,is responsible for ensuring the fund is managed in the best interests of the underlying investors. Tothis end, the fund/portfolio manager takes into account their investment objectives and manages theportfolio accordingly.
The following factors are taken into account when determining the most suitable asset mix of the fund:
Risk
Different investors are prepared to take on different levels of risk. The role of the fund manager is toattempt to diversify risk to an acceptable level. The aim of diversification is to optimise the risk/rewardtrade-off.
Liquidity
Some investors require the ability to convert their investment into cash at very short notice. These fundswill consequently invest more heavily in short-term instruments, such as Treasury bills and short-termdeposits.
Growth
Funds investing for future gains, rather than immediate returns will have a higher proportion of theircapital tied up in equity securities rather than bonds. In particular, equities in companies that re-investprofits, rather than pay out dividends, will be attractive to a fund with growth objectives.
2.2. Management styleTraditionally the two main management styles have been growth and value, although other styles havealso evolved including small cap, market orientation and socially responsible. The main features of eachare summarised below.
Value funds
Fund managers aim to identify undervalued shares. The selection criteria used vary, but can includelow price/earnings ratios, high dividend yields, and low price to book and price to sales ratios.
There are a number of sub-styles within the value category:
• Investors seeking stocks with low P/E ratios including those in defensive and cyclical sectors
• Contrarian investors looking for companies with low share prices in relation to their book value. Thesefirms are expected to experience a cyclical rebound or company turnaround
• A conservative approach looking for high yielding stocks expected to maintain or increase dividends

Portfolio theory 243
Growth funds
In this category the manager is looking for companies with high growth prospects generally reflectedby a high P/E ratio.
Market orientated funds
These do not have a bias towards growth or value, instead tending to relate more closely to the marketaverage over the business cycle.
Socially responsible investing (SRI)
Although not a specific style, this strategy certainly drives the stock selection process. SRI introducespersonal values and social issues into the decision-making process. Two key issues of SRI are:
• Screening: including or excluding securities due to social/environmental criteria such as ignoring anenergy company that contributes to depleting the world oil supply
• Shareholder advocacy: active involvement by shareholders to encourage corporate responsibility
Socially responsible investing is also sometimes referred to as ‘environmental social governance in-vesting (ESGI).
2.3. Transaction costs
Introduction
In general terms, costs can be associated with the trade itself, the clearing of that trade and the set-tlement of that trade. Certainly when referring to exchange-traded securities, the bulk of the cost liesmostly with the trade itself. Studies show that at the time of writing, this is less the case with multilateraltrading facilities (MTFs) and dark pools where the cost associated with the trade itself tends to be lower,and so takes up less of a proportion of the total costs.
Markets – how securities are traded, cleared and settled – is a matter for Unit 1 – Investment Environ-ment. However, we do need to be aware of the associated costs in this unit. These can be divided intoexplicit costs, which are those that are obvious to the trader, and implicit costs, which are those thatmay be hidden.
The explicit costs of trading
Commission is charged by brokers, which ranges anywhere from 10 to 20 basis points for large insti-tutional trades to between 100 and 150 basis points 1.5% for smaller trades. There is also a 10% with-holding tax on dividends, which is non-reclaimable.
Stamp duty on certificated shares at 0.5% rounded up to the nearest £5 and stamp duty reserve tax(SDRT) on dematerialised shares at 0.5% rounded up to the nearest 1p. Market makers are exemptfrom this charge.
The POTAM levy to fund the Panel on Takeovers and Mergers will also be payable on some trades. £1on all purchases and sales in excess of £10,000 is charged. Market makers are exempt from this charge.
The implicit costs of trading
The bid-offer spread reflects the difference between what a market maker will buy the stock for andwhat he will sell the stock for. As the client, we will be on the losing side of this spread.

244 Transaction costs
The trade itself can have an impact on the price of the security. Market makers know this and limitthe size of the trades they are willing to honour their bid-offer spreads. Beyond this size limit they arepermitted to adjust their prices to reflect this potential price impact. This is known as the price impactof a trade.
Opportunity cost could be a result of bad timing or inability to find the funds. If an opportunity is identified,but not taken advantage of, the opportunity cost arises.
MiFID
The Markets in Financial Instruments directive set out a variety of rules in relation to financial activitiesand investments. This included rules that related to the trading venues that these instruments tradeon. Since it's implementation there has been rapid growth of both trading channels (e.g. LSE, BATS,Chi-X Europe, Turquoise) and trade clearing venues (e.g. LCH.Clearnet, EMCF, EuroCCP). This hastended to result in reduction of the explicit costs of trading although the effect on implicit costs is stillopen to debate.

Portfolio theory 245
3. Passive vs. active styles
3.1. Passive fund managementA passive style means that the fund manager attempts to replicate the returns to a pre-determinedbenchmark, such as a market index, e.g. FTSE 100.
Managers of passive funds subscribe to the Efficient Market Hypothesis (EMH). EMH states that themarket price of a security is correctly priced and will have already discounted all available market in-formation.
If the EMH is true, then it is not possible to identify mis-priced securities in order to outperform the market.
The rationale, therefore, behind passive management is 'if you can't beat them, join them'; instead ofwasting time looking for mis-priced stocks to beat the market return, a fund manager should replicatethe market in their portfolio. A portfolio that replicates the market is known as a tracker fund.
Tracker funds
A FTSE 100 tracker fund is a portfolio designed to replicate the returns of the FTSE 100. There are anumber of ways of achieving this; the most obvious is called replication (buying all of the FTSE100shares in the index), as well as sampling (buying only the most influential FTSE 100 shares) synthetic(buying FTSE 100 futures and holding cash in the bank) and optimisation (using historic analysis todetermine which stocks have most accurately tracked the index in the past).
Advantages of passive funds include their low cost relative to active funds, and relatively little manage-ment time once set up.
One major disadvantage of passive funds, however, is that they follow bear as well as bull markets.Consequently, if prices (and indices) are falling, no action is taken to avoid a similar fall in the fund.
Tracking error
Note, that there is usually an element of 'tracking error' inherent in passive funds. This results in thefund not achieving exactly the same return as the relevant index. Tracking error may occur due to:
• Costs. The fund will incur costs, such as stamp duty (in the UK) and brokerage or commission, whenbuying and selling shares. The index itself does not experience any costs; it is simply an averageof the share prices
• Changes in the constituents of the index being tracked. The FTSE 100, for example, is reviewed on aquarterly basis by the London Stock Exchange. Although the index reflects any changes immediately,it is not always possible for a passive fund manager to re-construct their portfolios as quickly as theindex itself
Tracking error can be assessed as:
Tracking error = total return of portfolio - total return on benchmark.
It may more accurately be calculated as the standard deviation of the returns on the portfolio and thereturns on the benchmark.
Tracking error may be positive or negative. If the fund has outperformed the benchmark it will be positive.If it has underperformed it will be negative. Tracking error is often within +/- 50 basis points (i.e. 0.5%).

246 Active fund management
Setting tracking error limits has both advantages and disadvantages. The restrictions reduce the volatil-ity of the fund to a similar level as the benchmark reducing potential losses. However, it also reducespotential gains and restricts the ability of the fund manager to make positive returns in a falling market.
3.2. Active fund managementThere are certain stages in ensuring a portfolio is managed efficiently. The first decision the fund man-ager makes is with respect to the asset mix of the portfolio, (i.e. shares vs. bonds). For example, in-come-seeking portfolios invest more heavily in bonds, whilst growth-seeking portfolios invest a higherproportion of the fund in equities. This process is known as asset allocation (or strategic allocation).Once the strategic allocation has been set (e.g. fixed interest 80%), the next stage is the tactical allo-cation where ranges are specified around the strategic level to enable market timing adjustments to bemade by the manager (e.g. fixed interest 70-90%).
The usual process is to decide on asset allocation before focusing on stock selection and market timing.This is called a top-down approach.
Top-down
Top-down management involves three stages:
• Asset allocation
• Sector selection
• Stock selection
Asset allocation
The manager will choose what investment mix will be included in the portfolio. This was discussed inthe previous chapter. In essence, the manager will look at the proportion of cash, equity, debt and otherasset classes within the portfolio.
Some of the extra returns by the active manager may be achieved through tactical asset allocation(also called market timing). Here the fund manager uses their discretion to make small changes to theasset allocation of the fund in order to take advantage of short-term market shifts.
For example, the fund may have an asset allocation of 50% equities and 50% bonds. If the fund managerfelt that an equity bear market was imminent they may decide to alter the allocation to 45% equities and55% bonds. The fund manager's discretion will be constrained within limits agreed initially and reviewedperiodically.
Sector selection
Some sectors, such as the technology markets and financial markets, are more sensitive than the mar-kets as a whole. They have high Betas and are considered aggressive stocks that perform well in arising market. Utility companies tend to be less sensitive than the markets. They have low Betas andare considered defensive stocks performing less badly in falling markets. The manager will need toconstruct a weighting that he believes will take the best advantage of the current environment.
Stock selection
This involves seeking out mis-priced securities in order to buy undervalued and sell overvalued stock.Stock selection and market timing are therefore particularly important when an active strategy is adopt-ed.
We will see methods of assessing overvalued and undervalued stocks, such as Jensen’s Alpha, laterin this chapter.

Portfolio theory 247
The joint impact of the timing effect and selection is called the interaction effect.
Fundamental analysis
Fundamental analysis is the process of identifying stocks that are undervalued by looking at the under-lying investment.
Technical analysis
Technical analysis (or charting) focuses on the market rather than the features of the stock. Technicalanalysts will seek to identify trends in price movements, seeing these trends as indicators of humanbehaviour. By predicting these trends they hope to outperform the market.
Bottom-up
Some fund managers avoid making a conscious asset allocation decision and move directly into choos-ing individual shares and bonds that best suit their investment needs. This process is called a bot-tom-up approach.
A bottom-up approach to management focuses on the attractions of individual stocks. Specific companyfactors, such as whether the company is a takeover target or about to launch an innovative product,are important.
This, in effect, removes the asset allocation and sector selection as primary factors and focuses insteadon stock selection often from an event driven or tactical trading basis.
Summary
Achieving excess returns, however, is difficult to achieve as the relatively high costs of managing anactive fund often corrode the extra return achieved by the fund itself. Various studies suggest that, inthe long-term, most active managers tend to underperform the market.
3.3. Tilting: an active/passive hybridSome fund managers employ a mix of passive and active strategies. For example, a fund can base itsreturn on a chosen index but may 'tilt' the fund away from the index by using modest active techniques,such as stock selection. This hybrid strategy is known as tilting, or enhanced indexing.
Interestingly, enhanced indexing compares favourably with pure active or passive management styles.In many studies it provides a higher risk adjusted return. However, the main problem with this strategyis deciding where the balance between active and passive should lie.
3.4. Liability driven investmentsA liability-driven investment strategy (LDI) is an investment strategy of a company or individual basedon the cash flows needed to fund future liabilities. It is sometimes referred to as a 'dedicated portfolio'strategy. It differs from a 'benchmark-driven' strategy, which is based on achieving returns relative to anexternal index such as the FTSE All Share or a combination of indices that invest in the same types ofasset classes. LDI is designed for situations where future liabilities can be predicted with some degreeof accuracy.
The strategy often involves the use of derivative products such as swaps to negate or reduce the neg-ative effects of external factors such as changes in interest rate or inflation. The downside of this is thatimplementation of such strategies may cause a reduction in overall return on the funds investments.
Constructing and implementing an LDI strategy
The constructions of an LDI strategy requires four main areas to be considered:

248 Liability driven investments
• Cash flow forecasts of the funding needs into the future (e.g. pension funding requirements)
• The degree of acceptable risk must be specified by the trustees
• Assessment of ability of active management to outperform market
• Implementation of the LDI strategy and consideration of additional investment vehicles
Risk measures for an LDI strategy
• Duration is the difference between the target return and actual return (tracking error)
• Volatility of surplus measures the probability of a short fall. This is similar to VaR and is deemed tobe a more sophisticated measure of risk

Portfolio theory 249
4. The Efficient Market Hypothesis
4.1. What do we mean by ‘efficient markets’?A hypothesis is a theory, an idea of how something works. In this case it is an idea or hypothesis abouthow stock markets work in relation to new and existing information.
If a stock market is perfectly efficient it has certain properties:
• All investors and market participants will have perfect information about each company in the market
• There will be no point in carrying out research on a company because everyone else will alreadyknow this information and it will be already priced in by the market
• In a perfectly efficient market there would be no transaction costs
• In a perfectly efficient market there would be no earnings surprises because investors would knowthe information already
The question is: are our real life stock markets perfectly efficient? The answer is most probably no.
4.2. The Three Forms of the Efficient Market Hypothesis (EMH)The Efficient Market Hypothesis has three forms:
• The Weak Form
• The Semi-strong Form
• The Strong Form
Each form has its own definition of an efficient market. It is important to know each of the three definitions.
The Weak Form of the EMH
The weak form states that the current market price already reflects all historic share price information.If this is true, there is no benefit in looking at historic stock price charts and graphs as everyone elsealready knows this information.
So the weak form contradicts Technical Analysis – it says looking at past prices for patterns won't work.The fact that people do use technical analysis may indicate that in real life our markets are not perfectlyefficient – even at the weak form of the EMH.
The Semi-strong Form of the EMH
The semi-strong form states that the current market price already reflects not only all historic share priceinformation, but also all other publicly available information.
This means that carrying out research about a company's activities and its products will also be of nouse, as all other market participants already know the information.
The Strong Form of the EMH
The strong form states that the current market price already reflects not only all historic share priceinformation, all additional publicly available information, but also all private information.

250 The Three Forms of the Efficient Market Hypothesis (EMH)
Private information is ‘insider’ information, i.e. information known only within the company that is likelyto be material (would affect the share price), and not yet released to the markets. The EMH is verybold to suggest that the market has already priced in this private information when the market won'tbe aware of it yet.
So it is very unlikely that the strong form of the EMH holds, as material insider information is not knownto the market and is not likely to be currently priced into the share.
EMH conclusions
The main conclusion is that real life markets are not perfectly efficient. There is some evidence thatsome aspects of the EMH do hold, but there is also some evidence to the contrary.
We could also conclude that real life markets vary in their efficiency. The larger and more liquid themarket the more efficient it is e.g. the FTSE 100 or the S&P 500 should be fairly efficient. This is becauselarger markets have many analysts following the larger companies so there are fewer surprises (ofcourse these still do happen).
On the other hand, fewer analysts follow the smaller less well known companies, especially those basedin lesser followed markets around the world. These markets are often less efficient but at the same timealso carry their own specific risks.

Portfolio theory 251
5. Behavioural finance
5.1. Behavioural financeReal life markets are not perfectly efficient, and one key source of market inefficiency is the irrationalbehaviour that can be exhibited by human beings when interacting with one another within a financialmarketplace. Behavioural finance is the field of study that attempts to identify examples of such irra-tionality, in the hope of better understanding the way in which participants within markets actually act,rather than how models suggest they ought to act.
Irrational decision-making takes place in two key ways. Firstly, investors do not always process infor-mation properly, and secondly, even given correct information processing, investors sometimes takesub-optimal decisions with that information.
Examples of information processing errors include:
• Memory bias, where investors give too much weight to recent experience compared to prior beliefswhen forecasting
• Overconfidence, whereby marketplace actors overestimate the precision of their forecasts or beliefs
• Conservatism bias, referring to investors being too slow in updating their beliefs when confrontedwith new evidence
• Sample-size neglect, which is where investors infer wider population behaviour from too small asample of data
Examples of decision-making errors include:
• Framing bias, in which the way information is presented to the investor (or ‘framed’) influences thedecision the investor then makes, even though there is no rational grounds for such influence
• Regret avoidance, whereby investors resist realising losses on their investments, in the potentiallyfutile hope that their losses will be recovered and thus ultimately avoided
5.2. Financial Amnesia and asset price ‘bubbles’One form of such irrational behaviour that can often arise due to a prolonged period of sustained eco-nomic growth is ‘financial amnesia’, which results in asset price ‘bubbles’ becoming built up in the mar-ketplace.
Financial amnesia is a situation in which financial market participants behave in such a way as suggeststhey have forgotten the financial lessons of the past, and this can affect both investors, institutions andregulators. Asset prices can become divorced from the fundamental drivers of their value. For example,property prices rise far beyond those which rental income can support, or share prices rise much morequickly than company earnings. Yields become so low that investors can only continue making moneyif prices continue to rise – and a so-called ‘asset price bubble’ has been formed.
So what is it that causes such financial amnesia, and the pervasive belief that investors typically have,that somehow ‘this time it’s different’, causing the rise of such bubbles? There are three key driversthat theorists typically point to:
• Incentive structures, whereby senior managers within the financial services industry are incentivisedto take decisions that are detrimental to the wider financial system. Lack of accountability and short-termism can exacerbate this problem

252 Financial Amnesia and asset price ‘bubbles’
• Moral hazard, with the wider economy carrying the cost of excessive risk taking by the financialservices industry
• Behavioural finance biases, such as cognitive dissonance (that is, ignoring evidence that thingsmight be going awry in the marketplace, and bubbles might be inflating), groupthink, herd-like be-haviour, overconfidence and regret avoidance
Although to some extent financial amnesia and the growth of asset price ‘bubbles’ is inevitable, theycan be guarded against through sound corporate governance, strong and proactive regulators and aneducation and appreciation of the history of the financial marketplace.

Portfolio theory 253
6. Performance measurement
6.1. BackgroundIt is important that investors, and other interested parties (e.g. trustees of pension funds/unit trusts), areable to monitor the performance of a fund in order to evaluate the manager's performance.
Assessing performance requires the ability to measure the return that a fund has achieved for its clients.
This section focuses on three different methods used to measure portfolio performance:
• The Holding Period Return (HPR) - sometimes referred to as 'Total Return' or 'Holding Period Yield(HPY)'
• The Money Weighted Rate of Return (MWRR)
• The Time Weighted Rate of Return (TWRR)
Before looking at these measures in more detail, note that these measures do not take into accountthe risk that the fund being evaluated has been exposed to.
Consequently, these measures have limited use when comparing the returns on funds with differentrisk profiles (note: risk-adjusted measures are considered later).
6.2. Holding period returnThe holding period return (HPR) measures how much the portfolio has increased in value over a par-ticular time horizon.
The HPR identifies the change in value of the fund as a percentage of the start value.
In other words:
Although the holding period return is a relatively simple measure to understand it does suffer from thelimitation of not taking into account the timing of cash flows in, and out of, the fund, i.e. withdrawalsand deposits.
Consequently, it is not a particularly useful measure for assessing the returns achieved from open-ended funds, such as unit trusts, OEICs or pension funds where regular cash flows in/out of the fundare a major feature.
6.3. Money weighted rate of return (MWRR)The MWRR is used to measure the performance of a fund that has experienced deposits and with-drawals during the period being measured. It is also sometimes referred to as the internal rate of return(IRR) of the fund.

254 Money weighted rate of return (MWRR)
For example, assume a fund starts the period with a value of £97.5m that grows to £98m in six months.At this time, a further cash injection of £5m is deposited. At the end of the twelve-month period, thevalue of the fund has grown to £104.5m.
Therefore, the total return over the twelve-month period is the rate at which £97.5m for twelve monthsplus £5m for six months has grown to £104.5m.
In other words:
The money weighted rate of return, r, may be calculated using the equation below along with trial anderror:
Trying 0.02 or 2%:
The money weighted rate of return is 2.00% for the twelve-month period.
As a method of comparing one portfolio's performance against another, the money weighted rate ofreturn is only valid if both portfolios received/withdrew cash at the same time, because the timing andthe size of the flows will affect the rate of return.
For example, if a client injects cash into the fund at an unfavourable time, the MWRR will tend to bedepressed. However, if cash is injected into the fund at a favourable time, it will have the effect ofboosting the MWRR.
The MWRR should therefore be used with caution when comparing one fund manager's performancewith another.

Portfolio theory 255
6.4. Time weighted rate of return (TWRR)
The money weighted rate of return is designed to take some account of cash inflows and outflows butcan still be affected by the timing and size of flows into and out of the fund. This overstates returns whenthe fund does well and understates returns when the fund does badly. The time weighted rate of returngets around the problem of the money weighted rate of return because it is unaffected by the timingof cash flows into (or out of) the fund.
It is calculated by measuring the change in the value of the fund before the cash injection (or withdrawal),and multiplying this by the change in value after the injection (or withdrawal). This means that the TWRRgives equal weighting to the timing of the cash flows.
In the example below the increase in the fund's value before the cash injection is 0.51% (i.e. the fundis 1.0051 times its original value) and after the injection it has increased by 1.46% (1.0146 times itsoriginal value) giving an overall increase of 1.98%:
The time weighted rate of return for the twelve-month period may be calculated using the equation below:
Notice that this figure (1.98%) is very similar to that calculated for the money-weighted rate of return(2.00%). This is because there is only one cash-flow into the portfolio, exactly half-way through theperiod. Had there been several cash-flows, with variable timings, the two figures calculated would havebeen materially different to one another.

256 Time weighted rate of return (TWRR)
The fact that the time weighted rate of return is not influenced by the timing of cash deposits andwithdrawals makes it a preferred measure of fund performance compared to the money weighted rateof return.

Portfolio theory 257
7. Risk and reward
7.1. The risk and reward connectionIn the investment world it is important to see the connection between risk and reward. The concept oftaking risk with the potential to reap rewards is at the heart of all investing.
Taking on a higher level of risk may have the potential for greater rewards but also the potential forgreater losses. Higher risk investments normally have higher volatility i.e. a wider range of returns; someof them very good and some of them very bad.
But what if we are not prepared to take a risk? We’ll see in this chapter that we need to clearly definewhich risks are acceptable to investors and the degree of volatility that an investor is prepared to accept.
If an investor wishes to avoid market risk they need to scale down their return expectations to that ofthe risk-free return. Such investors should also bear in mind that inflation is a hidden risk that erodesthe value of their investment.
7.2. Risk premiumWhat is a risk premium?
A risk premium is the additional return over a risk-free return needed to compensate an investor fortaking on the risk of an investment.
For example, an equity risk premium needs to compensate equity investors for:
• The potential variability of stock returns; whilst we hope there are upside profits, there could also bedownside losses
• The potential variability of income in terms of dividends
• Giving up immediate access to the funds invested
A fundamental concept in investments is that the riskier the investment the higher the risk premiumdemanded from investors. For example, venture capital is a particularly risky alternative investment asmoney is invested in new start-up companies. Therefore the risk premium for venture capital is higherthan for more traditionally established equities.
7.3. Systematic risksWhat are systematic risks?
Systematic risks affect the financial system as a whole. Because these risk factors affect the financialmarkets as a whole, they are also sometimes collectively referred to as market risk.
It is very difficult for investors to accurately predict the nature of systematic risks over the short-term,medium-term and long-term. Some investments are more sensitive to the following systematic risksthan others.
• Interest rates
• Inflation
• Liquidity

258 Systematic risks
• Currency
Interest rates
The Bank of England sets the level of interest rates in the UK as a monetary tool to manage inflation.In the investment world, changes in interest rates can have a positive and negative effect on differingtypes of investments. The risk is that the change has a negative impact.
Here are some common effects of interest rate changes:
• Savers with variable interest rate deposits benefit from rate increases and lose from rate decreases
• Savers with fixed rates are protected against interest rate decreases but lose out on interest rateincreases
• Fixed income securities such as gilts and bonds generally rise in price from interest rate falls and fallin price from interest rate rises
• Coupons from fixed income securities can be re-invested at higher rates when interest rates rise andat lower rates when interest rates fall
• Companies often find their debt repayments rise when interest rates rise, putting pressure on oper-ating profits and perhaps slowing down new projects and expansion plans
• When interest rates rise, consumers find their mortgage payments go up leaving less to spend - whichin turn affects the retailers’ profits as we are spending less in the shops
Inflation
Inflation can be damaging to bonds, as the value of fixed future cash flows will be worth less in realterms. Index linked gilts, of course, have some inflation protection.
Inflation is not good news for equities either as companies see the prices of their costs rising, puttingpressure on margins and profits.
Investments that often do benefit from high inflation are commodities. As commodity prices rise, socommodity investment returns rise as well.
Liquidity
Liquidity is about being able to sell or buy at a fair market price. The liquidity of any market is determinedby the number of buyers and sellers at any time, the volume of trades and the costs of trading.
In a liquid market, it is easy to buy and sell and assets are likely to trade closer to their fair (intrinsic)value. However, if this liquidity dries up and there are far fewer buyers around, a seller may be facedwith accepting a reduced market price or having to keep on holding the investment.
In extreme market conditions, it may be very difficult to liquidate a position at all.
Currency
How many of the items we buy are made in the UK? Think about our clothes, our computers, our phones,our cars, toys, even nowadays our food. Many of these are imported from abroad.
Investors are increasingly creating global portfolios to have the opportunity of benefiting from goodcompanies wherever they are.
When we, as a UK investor, invest abroad in a foreign currency we now have two risks to consider:

Portfolio theory 259
• Will we make or lose money on the foreign investment itself?
• Will we make or lose money when we come to convert the foreign currency back to sterling?
Even if we make money on our foreign investment in the foreign currency, we may end up losing overallif the foreign currency has depreciated relative to sterling.
UK companies are also exposed to currency risk. For example, if a UK firm is importing raw materialsand sterling depreciates, the raw materials will effectively become more expensive as it will take morepounds to pay for them.
7.4. Unsystematic risks
What are unsystematic risks?
Whereas systematic risks are risks that affect the financial system as a whole, non-systematic risksare risks specific to a particular business. All businesses are unique and have their own specific riskfactors such as:
• Business risks
• Industry risks
• Management risks
Business risks
What are the elements that contribute to a successful business? Good products and services, skilledand committed staff, the right location, successful ideas, manageable costs, financial strength in difficulttimes and a strong market for the company’s products and services.
Business risk is the risk that any of these elements become unfavourable and uncompetitive, leadingto reduced profits.
Industry risks
Each industry carries its own specific risks that affect all companies in the industry. For example, inthe airline industry health and safety issues are paramount and are quite different to health and safetyissues in the banking industry.
Management risks
When a company performs well, growing its profits, increasing its market share and creating happycustomers, it says a lot about how it is being managed – the management must be doing something right.
7.5. Systemic risksSystemic risks are risks, which, if realised, can cause a cascading effect across the ‘system’ and lead itinto crisis. It is the systemic risk of banks being 'too big to fail' that led to the recent financial crisis andgovernments having to rescue banks to protect the whole financial system. One of the International Or-ganisation of Securities Commission's (IOSCO) main principles set down for national and internationalregulators is the reduction of systemic risk.

260 Measuring risk
8. Measuring risk
8.1. Standard deviationThe risk of a fund's constituents is a key consideration when constructing a portfolio of assets. Thehigher the return the fund manager is seeking to achieve, the greater the risk he or she must be preparedto take.
Risk is measured as the variability of returns around an expected level. If the expected level of returnis calculated as the average return (i.e. the mean), then the risk is measured as the standard deviationof returns over time.
Because it measures the level of dispersion from an expected/average value, the standard deviation isa measure of the total risk of an individual security.
A security with low risk will have returns that do not fluctuate significantly around its mean (average)return, and will consequently have a smaller standard deviation.
Alternatively, a security with high risk will have returns that do fluctuate significantly around its mean(average) return, and will therefore have a larger standard deviation.
The above illustration demonstrates that Stock J is a riskier security than Stock K due to its largerstandard deviation of returns.
Problems with standard deviation
There are a number of criticisms of standard deviation as an indicator of risk:
• It is based on historical returns, which may not be representative of future patterns

Portfolio theory 261
• It is a measure of upside movements as well as downside movements. An investor is likely to onlybe concerned with the downside
• It assumes that upside is equally as likely as downside
• Volatility generally is not a complete measure of risk
• Autocorrelation can result in quoted standard deviation being lower than the true risk. Autocorrelationis defined as future returns being significantly related to current returns and is particularly prevalentin assets such as property
There are a number of alternative measures which include:
• Semi-variance: similar to the variance but only considering returns that fall below the mean over theperiod. This is therefore a downside measure of risk
• Probability of a shortfall: this states the chance of a return over a period falling below a specific level
• Expected shortfall: a measure of the expected loss at a given probability level. Perhaps calculatingthe expected loss in the worst 5% of cases
Other measures of risk are discussed later in this section.
8.2. Specific vs. systematic risk
Introduction
As mentioned above, the standard deviation of returns (for an individual stock) is a measure of its totalrisk. The risk associated with investing in risky assets derives from the fact that there is uncertaintyabout the future cash flows from that asset.
Total risk - as measured by the standard deviation of returns - can be broken down into two componentparts: specific and systematic risk.
i.e. total risk = specific risk + systematic risk
For example:
An analyst has calculated that a share has a total standard deviation of 34% and the specific risk elementhas been calculated as 31%. Calculate the systematic risk.
Answer: Total risk (as var) = systematic risk (as var) + specific risk (as var)
Let s2 be the systematic risk in variance terms:

262 Specific vs. systematic risk
Risk and diversification
The aim of diversification is to optimise the risk/reward trade-off. This is achieved by adding stocks toa portfolio which are not perfectly correlated with one another (i.e. the returns do not move in perfectharmony with one another).
By adding stocks, it is possible to reduce the overall standard deviation of the portfolio. This is becausespecific risk is reduced by diversification.
Diversification reduces specific risk because the positive and negative individual characteristics of eachasset tend to cancel each other out.
It is not, however, possible to eliminate the risk associated with macroeconomic and political factors.Consequently, systematic risk cannot be diversified away completely. Of course, systematic risk canbe reduced by diversifying globally, as some of the systematic risk factors in, say, the UK market arenot necessarily the same as in other markets. Even so, a globally diversified portfolio can only reducesystematic risk to a 'world systematic risk' level.
The remainder of this section assumes that portfolios achieve the appropriate level of diversificationwhere specific risk has been diversified away. The fund manager is therefore only concerned with thesystematic risk of the portfolio.
Beta coefficient
Portfolio managers assess systematic risk by measuring the Beta of a security.
Beta is defined as the 'sensitivity of a stock's return to the return on the market portfolio'.
In other words, Beta measures the (systematic) risk of a security relative to the systematic risk of themarket as a whole.
The Beta for a given stock is determined by constructing a scattergram of returns achieved by the stockagainst the returns achieved by the market.
By using a technique called 'regression analysis', a line of best fit is drawn between the points on thescattergram. The gradient of this line is the stock’s Beta:
• If the gradient/Beta is greater than 1, the stock is more volatile than the market as a whole, i.e. a Betaof 1.2 reflects 20% more volatility than the market portfolio

Portfolio theory 263
• If the gradient/Beta is less than 1, the stock is less volatile than the market as a whole, i.e. a Beta of0.7 reflects 30% less volatility than the market portfolio
• If the gradient/Beta is equal to 1, the stock has the same volatility as the market as a whole
Alternatively, the information in the scattergram may be used to express Beta in a more statistical way:
The measure of covariance between the return on the stock ('Rj ') and the return on the market ('Rm')indicates the extent to which the two 'move' together.
Since total risk includes systematic and non systematic risk it can be decomposed to calculate the beta.The formula for total risk is as follows:
Variance of portfolio return = Beta2 x Variance of return on the market + Variance of unsystematic risk
For example, a stock with a total variance of return of 100 and unsystematic variance of 40 would havea beta of 1.41 if the market variance was 30. This could be calculated as follows:
• 100 = β2 x 30 + 40
• 100 - 40 = β2 x 30
• 60 = β2 x 30
• 60 / 30 = β2
• 2 = β2
• β= √(2) = 1.41
Portfolio Betas
So far, only Betas for individual securities have been considered. A fund manager is equally interestedin calculating the Beta of the portfolio he, or she, is managing.

264 Specific vs. systematic risk
A portfolio's Beta is equal to the weighted average Beta of the individual securities within the portfolio.
To illustrate:
The above example shows that the combined effect of adding stocks J, K, L and M together is to createa portfolio that is 0.75% riskier than the market portfolio.
Drawdown as a measure of risk
Another measure of risk is the use of drawdowns. This looks at the difference between any peak inan investment’s price and any subsequent trough. This figure can then be used as an indicator of themaximum potential loss on an investment.
For example, if we take the following prices of a share:

Portfolio theory 265
If we look at the first four months of this chart the drawdown would be from the peak of 215 to thesubsequent trough of 110, giving a drawdown of 105. Over the next four months there is no drawdownthat exceeds this level, so the 105 remains the maximum drawdown for the investment. In the final twomonths on the chart, there is a drawdown of 115 (from 280 to 165). This becomes the new maximumdrawdown for the investment.
Notice, it is the subsequent lowest point that we look at and the previous minimum of 110 is ignored.
Disclosing this drawdown gives an investor the opportunity of identifying the maximum possible loss onan investment. In a worst case scenario a purchase could have been made at 280 and the investmentsold at 165, giving a loss of 41%.
We can interpret from a drawdown measure an idea of variability in price. For example, the lower thevariability of the share price, the smaller the drawdown measure will be.
8.3. Value at Risk (VaR)Value at Risk (VaR) is an alternative measure that financial analysts use to quantify market risk. VaRis defined as the maximum potential change in value of a portfolio of financial instruments with a givenprobability over a certain horizon. VaR measures can have many applications, such as in risk manage-ment, to evaluate the performance of risk takers and for regulatory requirements. VaR does not giveany information about the severity of loss by which it is exceeded.
When considering a trading portfolio, we know the current market value, but its future market value isunknown. The investment bank holding that portfolio might report that its portfolio has a one-day VaRof $10m at the 95% confidence level. This implies that under normal trading conditions the bank canexpect, that 95% of the time the value of its portfolio would not decrease by more than $10m in oneday. This is equivalent to saying that there is a 5% chance that the value of its portfolio will decreaseby $10m or more during one day.
It is also important to know that here is no indication how much the portfolio will fall by in 5% of thetime when it is over $10m.
VaR, like all predictions, is based on assumptions. One of the key assumptions here is a normal distri-bution of returns. As was discussed in the statistics chapter, this is not always the case - the skewnessof the distribution need to be considered.

266 Arbitrage Pricing Theory
9. Arbitrage Pricing Theory
9.1. IntroductionThe arbitrage pricing theory (APT) is a method of using market risk factors to predict and judge theperformance of an asset.
Market risk can be broken down into separate factors; for example, changes in inflation, investor confi-dence, GNP or the yield curve. The arbitrage pricing model postulates that for any individual company,the sensitivity to each of these factors will be different. The APT allows for these multiple sensitivitiesto be taken into consideration.
The APT assumes that each investor will hold a unique portfolio with its own particular array of betas.The ultimate goal of APT is to derive a rate of return which will then be used to price the asset correctly.If the price diverges for the assessed fair value, arbitrage should bring it back into line.
9.2. Capital Asset Pricing Model CAPMThe capital asset pricing model, or CAPM, is a special case of the APT model that is based on a singlefactor.
Although the model requires some assumptions and simplifications about financial markets, it is usefulbecause of the simplicity of its predictions.
As such, CAPM is a popular tool for quantifying and measuring risk. At this stage, we will focus on howCAPM is used for equities before turning to bond portfolios later.
CAPM assumptions
CAPM has some built-in assumptions required to derive the conclusions of the model.
These are:
• All market participants may borrow and lend at the same risk-free rate
• All market participants agree on the same investment period
• All market participants are well-diversified investors i.e. specific risk has been diversified away
• There are no tax or transaction costs to consider
• All investors want a maximum return for the minimum risk
• Market participants have the same expectations about the returns and standard deviations of allassets
9.3. Security market lineWith the above assumptions in mind, CAPM is used to predict the expected/required returns to a securityusing its systematic risk, i.e. its Beta.
The CAPM equation that enables this prediction is called the 'security market line' (SML). The expressionfor the security market line is shown below:

Portfolio theory 267
If a graph is plotted depicting the expected return to a security against its systematic risk (Beta) usingthe CAPM equation, then the relationship is revealed as a straight line: the SML. The SML shows thatthe higher the risk of an asset the higher the expected return.
Note that the 'market portfolio' comprises all risky assets, although in practice the portfolio is usuallyconsidered to be all those risky assets available for purchase in a particular securities market.
The market risk premium is the amount of return an investor would expect over and above the risk-freerate. This extra return is required for taking on the additional market risk.
The Beta coefficient is the key parameter of the CAPM.
Here is a worked example:
Question: What is the expected return from a stock with a Beta of 1.2 if the risk free rate is 5% pa andthe expected return from the market is 15% pa?
Answer: Insert the information from the question into the formula:

268 Alphas
9.4. AlphasIt is possible to represent the security market line in graphical form. Such a graph plots the CAPMexpected/predicted returns against different Beta values. An illustration is shown below:
In the diagram above, a stock whose return lies at point A, is achieving a return that is higher thanCAPM predicts given its level of Beta.
In other words, the actual return of the stock is greater than the CAPM prediction. The stock is said tohave a positive Alpha.
Stocks with positive Alphas are therefore underpriced (according to CAPM), and consequently stockpickers looking for value should buy stocks with positive Alphas. As demand of the stock increases, sowill the price, which in turn lowers its yield/return until it is brought back in line with the SML.
Alternatively, a stock whose return lies at point B is achieving a return that is lower than CAPM predictsgiven its level of Beta.
In other words, the actual return of the stock is less than the CAPM prediction. The stock is said tohave a negative Alpha.
Stocks with negative Alphas are therefore overpriced (according to CAPM), and consequently stockpickers should sell stocks with negative Alphas. As supply of the stock increases, the price will reduce,which in turn increases its yield/return until it is brought back in line with the SML.

Portfolio theory 269
9.5. Using CAPMManagers of pension funds and unit trusts can use CAPM Betas to construct portfolios with a risk profilethat suits the needs of their clients.
For example, a pension fund with relatively mature liabilities will form a portfolio of equities with a Betaof less than one, while less mature funds may have a Beta greater than one.
Once the client's preference for risk has been established, the fund manager can construct a portfoliowith the required Beta. Remember, the portfolio Beta is equal to the weighted average of the Betas ofthe individual securities within the portfolio, where the weights are the market values of the securities.
By using CAPM, it is possible to form a well-diversified portfolio which tracks a market index. This isachieved by constructing a portfolio with a weighted average Beta of one.
For example, suppose that stock A has a Beta of 0.7 and stock B has a Beta of 1.3. A portfolio witha Beta of one requires 50% of the portfolio invested in stock A and 50% invested in stock B, i.e. (0.5x 0.7) + (0.5 x 1.3) = 1.
Should the fund manager wish to construct a more risky portfolio he/she would invest more than 50%of the fund in stock B.
9.6. The Merton modelThe Merton model was initially proposed by Robert C Merton in 1970 and suggests the way to calculatethe value of equity is to treat the equity as a call option on the company's assets.
You will remember from the derivatives section that with a call option the investor pays the market pricefor the investment in order to receive unlimited potential gains and a loss limited to his initial investment.
So it is with a share. The maximum loss is the initial investment and the maximum potential gain isunlimited.
In order to assess a strike price for the share we would need to consider all of the investors in the compa-ny who would need to be paid off before the equity holders; for example, debt holders, employees,tradecreditors, etc. The value of these obligations would be the strike price and if the company is worth morethan the total obligations, the share is in the money and has value.
This effective moneyness of the share can be used as an assessment of the risk of the company, aswell as a method of pricing the share.

270 Risk adjusted performance measures
10. Risk adjusted performance measures
10.1. BackgroundMeasuring the risk of a portfolio is a crucial element when evaluating portfolio performance.
By measuring both risk and return it is possible to calculate a risk-adjusted performance measure.
There are four main methods used to determine the risk-adjusted return achieved by a fund.
These are:
• The information ratio
• The Sharpe measure
• The Treynor measure
• The Jensen measure
All of these measures calculate the return to the portfolio and compare it with the level of risk taken on.It is therefore possible for funds achieving lower returns for low risk to be ranked more highly than fundsachieving higher returns for higher risk.
Another important factor in determining the success of a fund manager is to establish how much ofthe achieved return was due to their skill, and how much was due to excess risk, or even luck. Decon-structing risk adjusted performance measures to determine this is an important aspect of performanceevaluation.
10.2. Information ratioThe information ratio compares the excess return achieved by the fund over a benchmark portfolio tothe fund's tracking error (calculated as the standard deviation of excess returns from the benchmark).It is calculated as follows:
A fund's performance may deviate from the benchmark due to manager decisions concerning assetweighting. If the fund outperforms the benchmark the ratio will be positive. A fund that underperformsthe benchmark will have a negative ratio.
The tracking error gives us an estimate of the risks the manager takes in deviating from the benchmark.The excess return element tells us how well the fund manager did compared to the benchmark.

Portfolio theory 271
A high information ratio is indicative of a successful manager.
10.3. Sharpe measureThe Sharpe measure uses the standard deviation of portfolio returns as an estimate of risk in orderto calculate excess return to volatility.
Because the standard deviation is used to measure risk, the Sharpe measure is best suited for mea-suring the performance of a non-diversified fund, as such a fund is exposed to total risk (i.e. specificand systematic risk). Remember, standard deviation is a measure of total risk.
The Sharpe measure calculates the excess return achieved by a fund (i.e. the return over and abovethe risk-free rate) for each unit of total risk, (i.e. standard deviation), taken on.
In other words:
For example, assume two fund managers both achieve an average return over one year of 12% on theirrespective portfolios. Fund A has a standard deviation of 6% and Fund B has a standard deviation of8%. If the risk-free rate of return is 6% the Sharpe measures for both portfolios are:
Fund A
• Sharpe = (12% - 6%) / 6% = 1
Fund B
• Sharpe = (12% - 6%) / 8% = 0.75
Fund A has therefore given better value than Fund B on a risk-adjusted basis.
Another way to describe this is to say that Fund A has more dominance over Fund B.
Dominance is where one fund achieves a better return than another for the same risk. Alternatively, thedominant fund could achieve the same return as another for less risk. A fund that achieves better returnfor lower risk than another fund would also, clearly, be a dominant fund.
10.4. Treynor measureThe Treynor measure is similar to the Sharpe measure except it is used to measure the performanceof a well-diversified fund, i.e. specific risk has been diversified away.
The Treynor measure is based on the CAPM Beta coefficient of the portfolio and is a measure of theportfolio's excess return with respect to its Beta.

272 Jensen measure
As such, Treynor measures the excess return achieved by a fund (i.e. the return over and above therisk-free rate) for each unit of systematic risk (Beta) taken on.
In other words:
As with the Sharpe measure, the higher the Treynor measure, the better the fund has performed ona risk adjusted basis.
For example, assume two fund managers are both achieving an average return over one year of 15%on their respective portfolios. Fund A has a Beta of 0.6 and Fund B has a Beta of 1.8. If the risk-freerate of return is 6% the Treynor measures for both portfolios would be:
Fund A
• Treynor = (15% - 6%) / 0.6 = 15
Fund B
• Treynor = (15% - 6%) / 1.8 = 5
Fund A has therefore achieved a higher Treynor measure and has given better value for money on arisk-adjusted basis. Fund A is the dominant fund.
10.5. Jensen measureThe Jensen measure of performance measures the fund's return in excess of its CAPM predicted return.
The formula for calculating the Jensen measure is:
To calculate the return predicted by CAPM a Beta is necessary. The Beta used is calculated from theclient's asset allocation and risk requirements at the beginning of the period being measured.
This Beta is used to represent a benchmark portfolio.
Portfolio theory 273
Jensen measures performance by calculating a CAPM predicted return calculated from the benchmarkBeta and comparing it to the return the manager actually achieved. If the difference is positive, thefund manager has performed well. If the Jensen measure is negative, the fund manager has performedpoorly.
Those funds with a positive Jensen measure are considered to be dominant over the benchmark.
Notice that the Jensen measure may also be interpreted as the portfolio's Alpha. If the fund has apositive Jensen measure it means it lies above the SML, and therefore has a positive Alpha. Fundmanagers, when picking stocks, tend to look for stocks with positive Alpha. A negative Jensen measureis equivalent to a negative Alpha.
Decomposing Jensen
Funds with a positive Jensen measure, i.e. positive Alphas, have outperformed the benchmark portfolio.
The information available in the Jensen measure may be used to break down, or decompose, this extraperformance to determine which aspects of the fund manager's skills were responsible for this excessreturn. It can therefore be used to determine relative strengths or weaknesses of a fund manager.
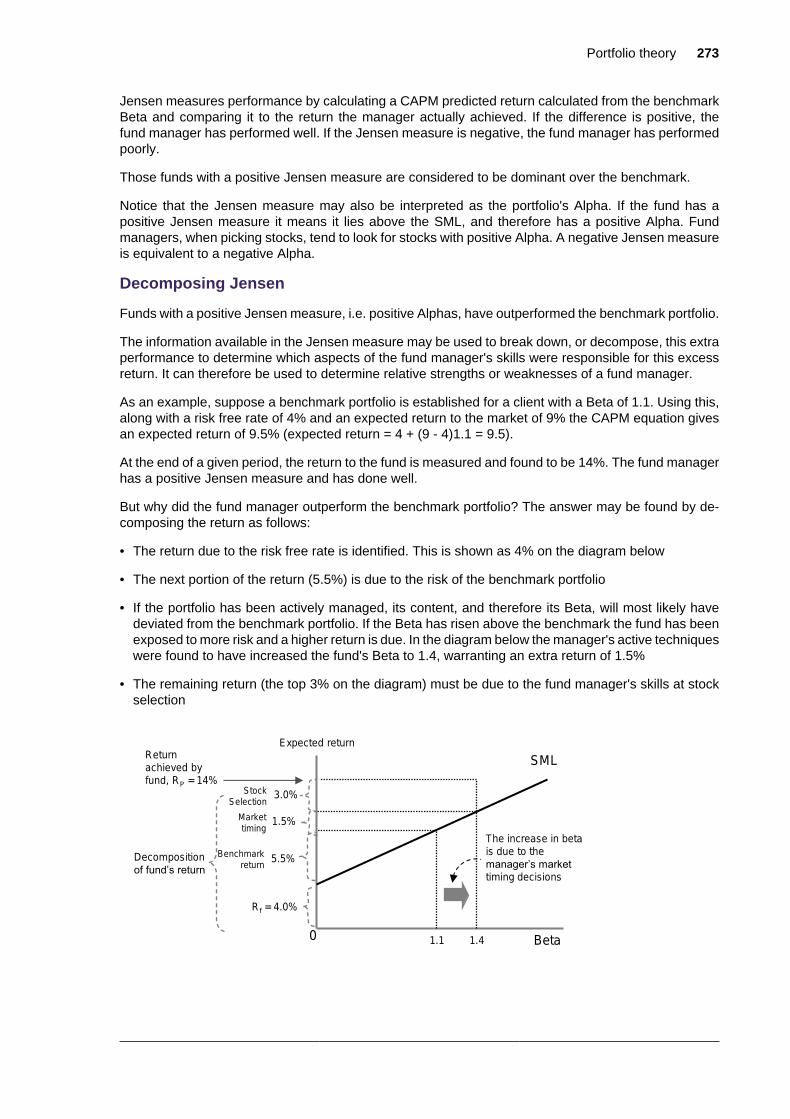
As an example, suppose a benchmark portfolio is established for a client with a Beta of 1.1. Using this,along with a risk free rate of 4% and an expected return to the market of 9% the CAPM equation givesan expected return of 9.5% (expected return = 4 + (9 - 4)1.1 = 9.5).
At the end of a given period, the return to the fund is measured and found to be 14%. The fund managerhas a positive Jensen measure and has done well.
But why did the fund manager outperform the benchmark portfolio? The answer may be found by de-composing the return as follows:
• The return due to the risk free rate is identified. This is shown as 4% on the diagram below
• The next portion of the return (5.5%) is due to the risk of the benchmark portfolio
• If the portfolio has been actively managed, its content, and therefore its Beta, will most likely havedeviated from the benchmark portfolio. If the Beta has risen above the benchmark the fund has beenexposed to more risk and a higher return is due. In the diagram below the manager's active techniqueswere found to have increased the fund's Beta to 1.4, warranting an extra return of 1.5%
• The remaining return (the top 3% on the diagram) must be due to the fund manager's skills at stockselection

274 Ex-ante and ex-post measures of risk
The decomposition of the total return to the fund may be summarised as:
• Return to the portfolio = Risk free return + Benchmark return + Market timing + Stock selection
10.6. Ex-ante and ex-post measures of riskMost of the risk adjusted performance figures we have seen use an ex-post measure of risk. That is,they look back at the historic measure of risk and performance, and create a measure based on these.
Both Treynor and Sharpe use ex-post measures of risk. Using these methods, the risk measure usedis clear, as it has already crystallised. However, the Sharpe and Treynor measures, in looking at theperformance after the event, could be seen as giving information when it’s too late: the act has alreadyoccurred.
Jensen uses an ex-ante risk measure to predict the expected risk and return of an investment. Assump-tions will play a major role in this, which is a disadvantage, but the major advantage of this ex-antemethod is it sets a visible target before the event.
10.7. Risk adjusted performance measures: summaryThe table below summarises the main methods of measuring a portfolio's performance on a risk adjustedbasis.

Portfolio theory 275
11. Bond portfolios
11.1. IntroductionPortfolios made up entirely of bonds have their own characteristics and considerations.
Like equity portfolios we can work out expected return, measures of performance and consider differentmanagement styles.
Key terms related to bond return include shift, twist and spread. Shift measures the degree to whicha yield curve has moved upwards or downwards, in parallel, across all maturities. Twist measures thedegree to which the yield curve has steepened or flattened. The premium or spread is usually quotedas basis points, and will be related to the bond issuer's yield over the government (risk-free) rate.
11.2. Portfolio durationThe duration of a portfolio is the sum of the weighted duration of the component bonds. For example,a portfolio made up of four bonds A (25%) , B (30%), C (20%) and D (25%) with durations of 1.2, 2.6,3.4, and 2.1 respectively would be:
The duration of a bond portfolio is a measure of the interest-rate risk of that portfolio, i.e. how sensitivethe fund is to changes in interest rates.
Relative duration
Relative duration is used as part of the calculation in measuring bond portfolio performance.
The measure calculates the return to the portfolio in excess of the risk-free return divided by theportfolio's relative duration.

276 CAPM in bond portfolios
In other words:
Consider portfolios A and B, both of which have achieved an excess return of 10% over and abovethe risk-free rate.
Portfolio A has a duration of 14 years and Portfolio B has a duration of 10 years. The duration of themarket during this time is six years.
In order to assess the relative performance of A and B, the duration-adjusted performance measureis calculated as follows:
Portfolio A
P = 10% / (14 years / 6 years) = 4.3.
Portfolio B
P = 10% / (10 years / 6 years) = 5.9.
Therefore, on a duration-adjusted basis Portfolio B has outperformed Portfolio A.
11.3. CAPM in bond portfoliosCAPM may be used to calculate the expected return from a bond portfolio.
Instead of using Betas to express the relative volatility to the market, relative duration is used instead.
As previously illustrated, relative duration is equal to the duration of the portfolio divided by the durationof the market.

Portfolio theory 277
The relative duration of the portfolio takes the place of Beta in the CAPM formula:

278 Management of bond portfolios
12. Management of bond portfolios
12.1. Active bond portfolio managementAn actively managed bond portfolio is one in which the manager is seeking to outperform a benchmark,such as an index.
A method adopted to achieve this aim is a process known as riding the yield curve.
Riding the yield curve
To illustrate, assume a fund manager has liabilities (payments to make) in three months' time; theycould meet those liabilities by purchasing a three-month Treasury bill now, and using the proceeds atredemption.
Alternatively, the manager could purchase a six-month Treasury bill today and hold it for three months,at which point they could sell it and use the proceeds to meet the liabilities.
Note that riding the yield curve only works if the yield curve is upwards sloping and remains upwardssloping during the process, i.e. buy the higher yielding/lower priced six-month bill and sell it as a loweryielding/higher priced three-month bill.
The advantage of riding the yield curve is that, although it is a risky strategy, it can yield a higher returncompared to buying the three-month bill and holding it to redemption (see example below).
Example
Suppose that the three-month T-bill is trading at £99,000, for £100,000 nominal value, and the six-monthT-bill is trading at £97,950.
The return over the three months from purchasing, the three-month T-bill is calculated as follows:
Three-month T-bill bought for £99,000 and redeemed at £100,000 gives a cash return of £1,000.
£1,000 expressed as a percentage of the original investment is:
Multiply by 4 to get an annualised return of 4.04%
Alternatively, the fund manager buys a six-month T-bill, holds it for three months and sells it after threemonths. The price received in three months will be £99,000 (assuming the yield curve has not movedduring this time).
The return from riding the yield curve is therefore:
The six-month T-bill purchased for £97,950 and sold for £99,000 in three months' time would give acash return of:
£99,000 - £97,950 = £1,050

Portfolio theory 279
Expressed as a percentage of the original investment of £97,950:
This can be annualised by multiplying by 4 to get 4.28%
The extra return achieved by the fund manager riding the yield curve is 1.07% - 1.01% = 0.06% overthree months, or on an annualised basis 4.28 - 4.04 = 0.24%.
Credit risk management
A fund manager may decide to move out of bonds if they believe that the credit quality of an issuer maydeteriorate, and into bonds where they believe that the credit quality of an issuer will improve. This canbe due to changes in issuer performance in line with economic cycles. The fund manager may havereduced the risk of bonds in their portfolio going into default and also has the benefit of avoiding pricefalls or taking advantage of prices rises if they have pre-empted a ratings change.
12.2. Passive bond portfolio management
Introduction
Passive portfolio management means the manager is looking to track an index, or benchmark.
Two major concerns that must be taken into account, particularly for liability driven investments suchas defined benefit pension schemes, when managing bond portfolios are the problems of interest raterisk and re-investment rate risk.
Interest rate risk is the risk of interest rate changes (affecting bond prices). In addition, there is a riskof not achieving similar yields when re-investing coupons received from existing bond holdings (re-investment rate risk).
The fund manager can protect the fund from interest rate risk and re-investment rate risk by adoptingeither a cash matching or immunisation strategy.
Cash matching
A cash matched, or dedicated, portfolio is one where the fund manager chooses bonds that generatecash flows of the same size and timing as the fund's liabilities. The fund manager purchases a collectionof bonds with coupons and capital repayments that coincide with the payments the fund must make(i.e. pension liabilities).
Immunisation
An immunised portfolio is one is designed to protect the fund from changes in interest rates.
Immunised portfolios are created by matching the duration of its constituent bonds with the durationof its liabilities.
Matching duration rather than exact cashflow is often more practically and provides a greater range ofbonds with which to implement the strategy. A disadvantage of Immunisation strategy is that it assumes

280 Passive bond portfolio management
a flat 'term structure of interest rates', i.e. a flat yield curve and that any shifts in the yield curve areparallel.
There are two types of immunised portfolios: bullet and barbell.
Bullet portfolios
A bullet portfolio (or focused) is one where the duration of the bonds within the portfolio is the same (orvery similar) to the duration of the portfolio's liabilities.
For example, if the manager has liabilities with a duration close to five years, they will choose bondsthat also have five-year durations.
Implementing a bullet strategy is likely to be easier than a cash matched strategy since there are moreavailable bonds that match a fund manager's requirements. The downside is that the portfolio will requirerebalancing in order to maintain the immunisation effect.
Barbell portfolios
As the name implies, a barbell portfolio contains bonds that have much shorter and longer durationsthan the liability but are weighted so that the average duration matches that of the liability.
For example, should the manager have liabilities of, say, 10 years, then they may choose some bondswith a duration of five years, some with a duration of 15 years until the 'point of balance' is equal to10 years.
As the durations in a barbell strategy have a greater range than that of the bullet strategy are evenmore available bonds that match the fund managers requirements. The downside is that the portfoliowill require a greater deal of rebalancing than the bullet strategy.
Contingent immunisation
A technique employed by active managers as a protection in case they fail to achieve the required returnthrough active management.
If the fund performs poorly then they will switch to a passively managed immunised portfolio as anirrevocable approach until the liability date.

Portfolio theory 281
13. Portfolio theory: summary
13.1. Key conceptsPortfolio construction
• The concepts and strategies behind portfolio construction
• How management styles can differ
• The implications of cost
Passive vs. active fund management styles
• Passive vs. active styles
• Understand the features and risks of passive management: tracking and tracking error
• Understand the features and risks of active management: top down and bottom up bias
• Understand the concept of tilting
The efficient market hypothesis (EMH)
• Understand the efficient markets hypothesis
• Understand the three forms of EMH: weak, semi-strong and strong
Behavioural finance
• Understand the concept of behavioural finance
• Understand the concepts of ‘financial amnesia’ and how asset price ‘bubbles’ arise
Performance measurement
• Calculation and interpretation of the holding period return, the money weighted rate of return and thetime weighted rate of return
Risk and reward
• The risk-reward connection
• The concept of the risk premium
• The concepts of systemic and non-systemic risk
Measuring risk
• The role of standard deviation in identifying and measuring financial risk
• The role played by diversification
• How to interpret the Beta coefficient
• Calculation of a portfolio Beta
282 Key concepts
• The concept and uses of the drawdown measure of risk
• The concept and uses of value at risk
Capital Asset Pricing Model (CAPM)
• The assumptions underlying the construction of the capital asset pricing model (CAPM)
• The concept of the security market line
• The concept of Alpha
• The application of the CAPM formula to equity portfolio selection decisions
Risk adjusted performance measures
• Calculation and evaluation of risk-adjusted performance measures, i.e. information ratio, Sharpe,Treynor and Jensen
• How the Jensen measure can be decomposed
• The limitations of risk adjusted performance
Bond portfolios
• The characteristics of an all-bond portfolio
• Portfolio duration
• How CAPM can be used for bond portfolios
Management of bond portfolios
• The risks and rewards of 'riding the yield curve'
• The differences between a cash matching and immunisation strategy
• The methods of assessing the returns of a bond portfolio manager
Now you have finished this chapter you should attempt the chapter questions.

Portfolio theory 283