imaging with a rectangular phase grating applied to displacement metrology
TRANSCRIPT
Imaging with a rectangular phase grating appliedto displacement metrology
Yoichi Ohmura, Toru Oka, Toshiro Nakashima, and Kazuhiro Hane
We achieved displacement metrology with a high-amplitude signal by using a rectangular phasegrating as the pupil in a grating imaging system. The imaging phenomenon with a pupil transmissiongrating that has a bilevel profile with a 50% duty ratio is discussed on the basis of the optical transferfunction. By optimizing the imaging condition, we obtained high-contrast images with high light powerunder a magnified or demagnified imaging system. The amplitude of the signal in the displacementmeasurement was four times higher than that of the conventional grating imaging system with ampli-tude gratings. © 2006 Optical Society of America
OCIS codes: 120.3940, 110.4850.
1. Introduction
Grating imaging, used in displacement metrology,1 is awell-known interference phenomenon. In this imagingsystem, the first grating, illuminated by spatially in-coherent light, can be considered a periodic object, andthe second grating functions as an imaging pupil. Asimilar optical configuration was described as the Laueffect, in which two diffraction gratings of equal pitchare positioned in tandem, and the fringe is observed atinfinity. The Lau effect has been examined with sev-eral considerations based on self-imaging,2 coherencetheory,3,4 and optical transfer function (OTF) theory,5and this phenomenon has been used in displacementmeasurement.6 Some authors have developed the in-terpretation of this interference phenomenon to gen-eralized grating imaging.7–10 Unlike in the Lauimaging system, in our system the frequency of theperiodic object in the grating imaging is not always thesame as that of the pupil grating, and the image planeis not always located at infinity.
Analyses of the generalized grating imaging basedon the OTF and experimental demonstrations havebeen reported when amplitude gratings are used.11,12
The contrast of the image can be calculated as afunction of the object distance, so this method of anal-ysis has an advantage with respect to the optimiza-tion of the imaging condition. However, in amplitudegrating imaging, received light power on an imageplane, which determines accuracy and resolution indisplacement measurement, was not satisfactory ow-ing to the transmittance.
To improve the power with high contrast, we pro-posed using a rectangular phase grating instead ofthe amplitude grating as the pupil.13 We discuss thisimaging phenomenon, using the pupil transmissiongrating that has a bilevel profile with a 50% dutyratio, by considering the OTF. To confirm the theo-retical results, we measured the image contrast fromthe intensity distribution on the image plane. Fur-thermore, we performed the displacement measure-ments when the pupil grating was moved underhigh-contrast imaging conditions.
2. General Analysis
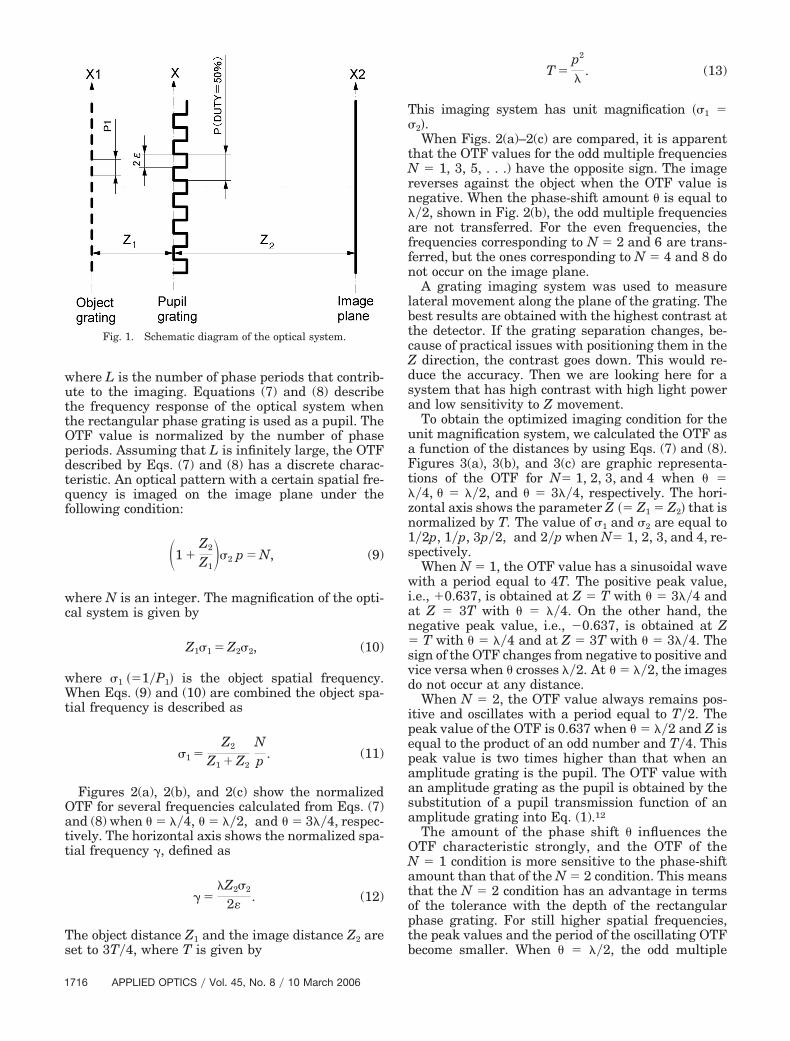
Let us consider the optical system described in Fig. 1.An object grating placed on the X1 axis has a periodicstructure with pitch p1. The object grating is illumi-nated by spatially incoherent light. A rectangularphase grating that has a bilevel profile with a 50%duty ratio is placed on the X axis as a pupil. Theobject distance between the X1 axis and the X axis isdefined as Z1. The amount of phase shift of the pupilis controlled by the depth of the bilevel profile, andthe pitch of the pupil grating is set to p. The imageplane (X2 axis) is located at image distance Z2 fromthe pupil grating. In this optical configuration, theintensity distribution on the X1 axis is imaged on
Y. Ohmura ([email protected]) is withNayoga Works, Mitsubishi Electric Corporation, Nayoga 461-8670,Japan. T. Oka and T. Nakashima are with the Advanced Technol-ogy R&D Center, Mitsubishi Electric Corporation, Amagasaki 661-8661, Japan. K. Hane is with the Department of Nanomechanics,Tohoku University, Sendai 980-8579, Japan.
Received 24 March 2005; revised 8 September 2005; accepted 11September 2005.
0003-6935/06/081713-08$15.00/0© 2006 Optical Society of America
10 March 2006 � Vol. 45, No. 8 � APPLIED OPTICS 1713
the image plane (X2 axis) by the pupil grating. Whenthe object grating is moved along the X1 axis, theimage is transported in the opposite direction on theimage plane. On the other hand, when the pupil grat-ing is moved along the X axis, the image is moved inthe same direction.
The OTF is defined as the Fourier transform of thesquare of its impulse response. The impulse responseof the optical system can be described with theFresnel approximation in the Fresnel–Kirchhoff dif-fraction theory. By use of the Fourier transform for-mula, the OTF can be given as the autocorrelation ofthe generalized pupil function. Therefore the OTF (F)can be written after simplification as
F��2� � exp�ika��2Z22�2
2���P�x� � �Z2�2�P*�x��
� exp��2ika�Z2�2 x��dx�, (1)
where k � 2��, a � �1�Z1 � 1�Z2��2, � is the wave-length of the incoherent light, and �2 ��1�P2� is the
image spatial frequency.11,12 The normalization fac-tor has been omitted in the calculating process of theOTF.
The pupil transmission function P(x) of a rectangu-lar phase grating with a 50% duty ratio is defined as
P�x� � 1 �� exp�i0��, �x � np� � ,
P�x� � exp�i�, �x � �n �12p� �
p2 � , (2)
where � is the amount of phase shift, 2 is the widthof its top and bottom, and n is an integer.
Substituting Eq. (2) into Eq. (1) gives the OTF for therectangular phase grating. We consider two cases:
mp � �Z2�2 � mp � 2
mp � 2 � �Z2�2 � mp , (3)
where m is an integer. For the case of mp � �Z2�2� mp � 2, we have
and for the case of mp � 2 � �Z2�2 � mp, the OTFis
F��2� � �n���
�
exp�ika 2���np
�mp��np
�exp��i�exp��2ika x���dx�
� �n���
�
exp�ika 2�� �mp��np
�np
�exp��2ika x���dx�
� �n���
�
exp�ika 2����np
�mp��np
�exp�i�exp��2ika x���dx�
� �n���
�
exp�ika 2�� �mp��np
��(n�1)p
�exp�i� � ��exp��2ika x�� dx�, (4)
F��2� � �n���
�
exp�ika 2�� �mp��(n�1)p
��(n�1)p
�exp��i�exp��2ika x���dx�
� �n���
�
exp�ika 2����np
�mp��np
�exp��2ika x���dx�
� �n���
�
exp�ika 2�� �mp��np
�np
�exp�i�exp��2ika x���dx�
� �n���
�
exp�ika 2���np
�mp��(n�1)p
�exp�i� � ��exp��2ika x�� dx�, (5)
1714 APPLIED OPTICS � Vol. 45, No. 8 � 10 March 2006
which can be somewhat simplified by use of the sub-stitution
� �Z2�2. (6)
The phase-shift amount � of the rectangular phasegrating can be considered a constant.
We obtain the following expression after simplifi-cation from Eqs. (4) and (5). For the case of mp� �Z2�2 � mp � 2, the simplified OTF is
and for the case of mp � 2 � �Z2�2 � mp, wehave
F��2� �
1 � 2�n�1
L
cos�2��2�1 �Z2
Z1np�
1 � 2L
� [exp��i�exp�i��1 �Z2
Z1�2��2 � mp�����2 �
mp�Z2
�Z2
4 �� sinc�2��1 �
Z2
Z1�2���2 �
mp�Z2
�Z2
2 �� exp�i��1 �
Z2
Z1�2�mp���1 � ��2 �
mp�Z2
�Z2
4 �� sinc2��1 �
Z2
Z1�2�1 � ��2 �
mp�Z2
�Z2
2 ��� exp�i�exp�i��1 �
Z2
Z1�2�2 � mp�����2 �
mp�Z2
�Z2
4 �� sinc�2��1 �
Z2
Z1�2��2 �
mp�Z2
�Z2
2 �� exp�i��1 �
Z2
Z1�2�m � 1�p��1 � ��2 �
�m � 1�p�Z2
��Z2
4 �� sinc(2��1 �
Z2
Z1�21 � ��2 �
�m � 1�p�Z2
��Z2
2 �)], (7)
F��2� �
1 � 2�n�1
L
cos�2��2�1 �Z2
Z1np�
1 � 2L
� [exp��i�expi��1 �Z2
Z1�2�2�m � 2�p������2 �
mp�Z2
�Z2
4 �� sinc�2��1 �
Z2
Z1�2��2 �
mp�Z2
�Z2
2 �� exp�i��1 �
Z2
Z1�2�mp���1 � ��2 �
mp�Z2
�Z2
2 �� sinc2��1 �
Z2
Z1�2�1 � ��2 �
mp�Z2
�Z2
2 ��� exp�i�exp�i��1 �
Z2
Z1�2��2 � mp������2 �
mp�Z2
�Z2
4 �� sinc�2��1 �
Z2
Z1�2��2 �
mp�Z2
�Z2
2 �� exp�i��1 �
Z2
Z1�2�m � 1�p��1 � ��2 �
�m � 1�p�Z2
��Z2
4 �� sinc(2��1 �
Z2
Z1�2�1 � ��2 �
�m � 1�p�Z2
��Z2
2 �)], (8)
10 March 2006 � Vol. 45, No. 8 � APPLIED OPTICS 1715
where L is the number of phase periods that contrib-ute to the imaging. Equations (7) and (8) describethe frequency response of the optical system whenthe rectangular phase grating is used as a pupil. TheOTF value is normalized by the number of phaseperiods. Assuming that L is infinitely large, the OTFdescribed by Eqs. (7) and (8) has a discrete charac-teristic. An optical pattern with a certain spatial fre-quency is imaged on the image plane under thefollowing condition:
�1 �Z2
Z1�2 p � N, (9)
where N is an integer. The magnification of the opti-cal system is given by
Z1�1 � Z2�2, (10)
where �1 ��1�P1� is the object spatial frequency.When Eqs. (9) and (10) are combined the object spa-tial frequency is described as
�1 �Z2
Z1 � Z2
Np . (11)
Figures 2(a), 2(b), and 2(c) show the normalizedOTF for several frequencies calculated from Eqs. (7)and (8) when � ��4, � ��2, and � 3��4, respec-tively. The horizontal axis shows the normalized spa-tial frequency �, defined as
� ��Z2�2
2. (12)
The object distance Z1 and the image distance Z2 areset to 3T�4, where T is given by
T �p2
�. (13)
This imaging system has unit magnification ��1 ��2�.
When Figs. 2(a)–2(c) are compared, it is apparentthat the OTF values for the odd multiple frequenciesN � 1, 3, 5, . . .) have the opposite sign. The imagereverses against the object when the OTF value isnegative. When the phase-shift amount � is equal to��2, shown in Fig. 2(b), the odd multiple frequenciesare not transferred. For the even frequencies, thefrequencies corresponding to N � 2 and 6 are trans-ferred, but the ones corresponding to N � 4 and 8 donot occur on the image plane.
A grating imaging system was used to measurelateral movement along the plane of the grating. Thebest results are obtained with the highest contrast atthe detector. If the grating separation changes, be-cause of practical issues with positioning them in theZ direction, the contrast goes down. This would re-duce the accuracy. Then we are looking here for asystem that has high contrast with high light powerand low sensitivity to Z movement.
To obtain the optimized imaging condition for theunit magnification system, we calculated the OTF asa function of the distances by using Eqs. (7) and (8).Figures 3(a), 3(b), and 3(c) are graphic representa-tions of the OTF for N� 1, 2, 3, and 4 when ���4, � ��2, and � 3��4, respectively. The hori-zontal axis shows the parameter Z �� Z1 � Z2� that isnormalized by T. The value of �1 and �2 are equal to1�2p, 1�p, 3p�2, and 2�p when N� 1, 2, 3, and 4, re-spectively.
When N � 1, the OTF value has a sinusoidal wavewith a period equal to 4T. The positive peak value,i.e., �0.637, is obtained at Z � T with � 3��4 andat Z � 3T with � ��4. On the other hand, thenegative peak value, i.e., �0.637, is obtained at Z� T with � ��4 and at Z � 3T with � 3��4. Thesign of the OTF changes from negative to positive andvice versa when � crosses ��2. At � ��2, the imagesdo not occur at any distance.
When N � 2, the OTF value always remains pos-itive and oscillates with a period equal to T�2. Thepeak value of the OTF is 0.637 when � ��2 and Z isequal to the product of an odd number and T�4. Thispeak value is two times higher than that when anamplitude grating is the pupil. The OTF value withan amplitude grating as the pupil is obtained by thesubstitution of a pupil transmission function of anamplitude grating into Eq. (1).12
The amount of the phase shift � influences theOTF characteristic strongly, and the OTF of theN � 1 condition is more sensitive to the phase-shiftamount than that of the N � 2 condition. This meansthat the N � 2 condition has an advantage in termsof the tolerance with the depth of the rectangularphase grating. For still higher spatial frequencies,the peak values and the period of the oscillating OTFbecome smaller. When � ��2, the odd multiple
Fig. 1. Schematic diagram of the optical system.
1716 APPLIED OPTICS � Vol. 45, No. 8 � 10 March 2006

frequencies included in the one corresponding to N� 1 are not transferred. In the case of � �, evi-dently, the OTF values for all frequencies are alwaysequal to zero.
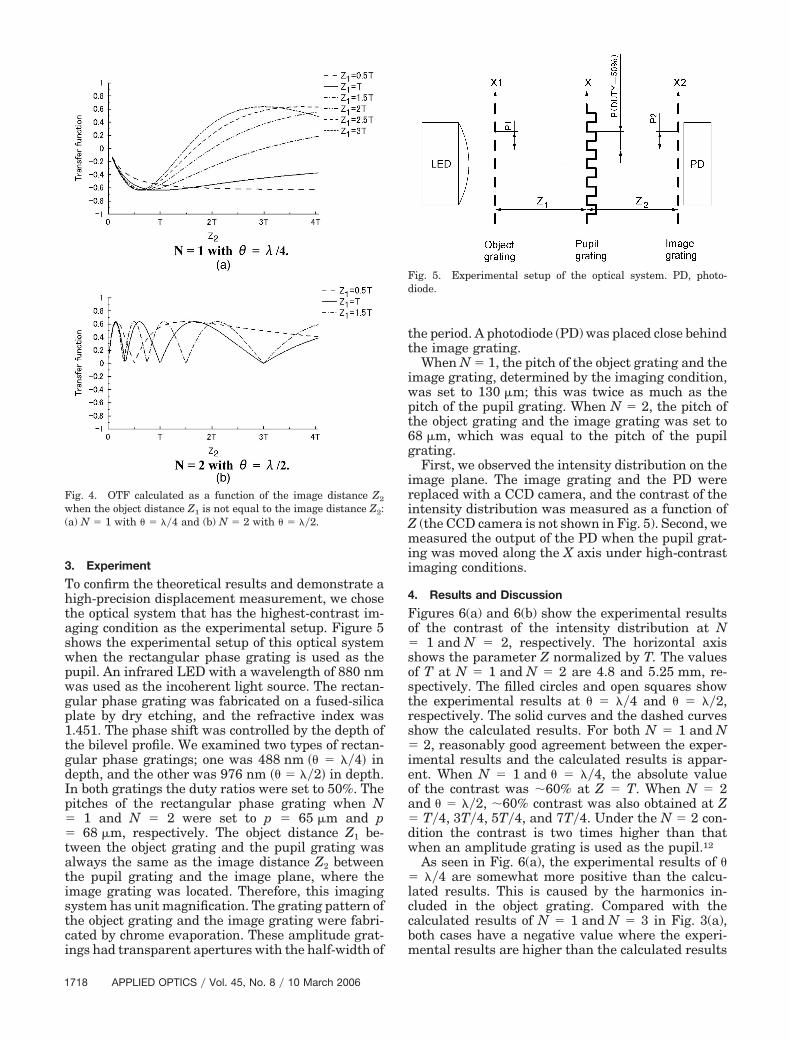
For displacement metrology by use of gratingimaging, the magnification influences resolution andaccuracy. When the magnification is large, the dis-placement of the image is magnified against the oneof the object or the pupil. By use of Eqs. (7) and (8),the OTF for the magnified or the demagnified imag-ing system can be calculated. Figures 4(a) and 4(b)are graphic representations of the OTF when theobject distance Z1 is not the same as the image dis-tance Z2. We calculate the OTF for N � 1 with � ��4 and for N � 2 with � ��2, as these conditions
are optimized to obtain the maximum contrast withthe unit magnification system. The horizontal axisshows the image distance Z2, which is normalized byT. We have seen from Eq. (10) that the system mag-nification is determined by the ratio of Z1 and Z2 andthe imaging condition shown in Eq. (9) depends onthe spatial frequency and the distances. Hence wenote the object frequencies transferable to the imageplane change owing to the configuration of the dis-tances.
For N � 1, the sign of the OTF changes from neg-ative to positive, and for N � 2, the value of the OTFoscillates in the positive region. In both cases, themaximum absolute value of the OTF is the same, i.e.,0.637, as that of the unit magnification system.
Fig. 2. OTF as a function of the normalized spatial frequency �.The object distance Z1 and the image distance Z2 are equal to 3T�4:(a) � � ��4, (b) � � ��2, (c) � � 3��4.
Fig. 3. OTF calculated as a function of Z for N � 1, 2, 3, and 4,when the ratio of the object distance Z1 to the image distance Z2 isequal to one: (a) � � ��4, (b) � � ��2, (c) � � 3��4.
10 March 2006 � Vol. 45, No. 8 � APPLIED OPTICS 1717
3. Experiment
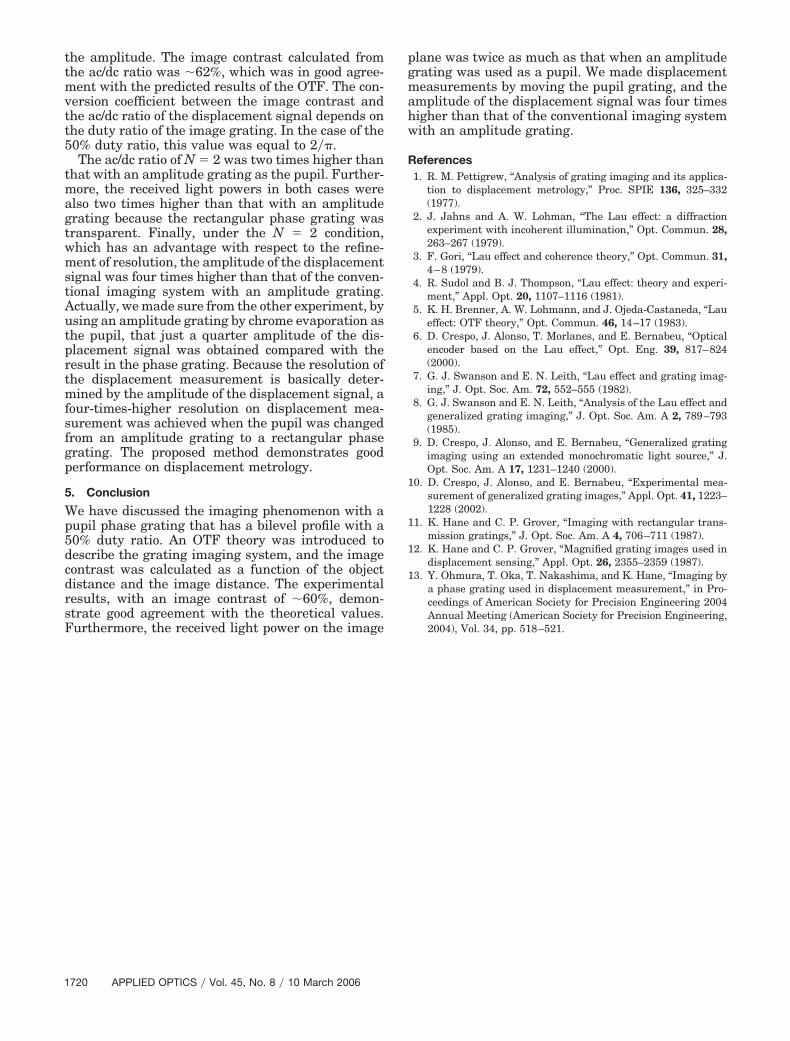
To confirm the theoretical results and demonstrate ahigh-precision displacement measurement, we chosethe optical system that has the highest-contrast im-aging condition as the experimental setup. Figure 5shows the experimental setup of this optical systemwhen the rectangular phase grating is used as thepupil. An infrared LED with a wavelength of 880 nmwas used as the incoherent light source. The rectan-gular phase grating was fabricated on a fused-silicaplate by dry etching, and the refractive index was1.451. The phase shift was controlled by the depth ofthe bilevel profile. We examined two types of rectan-gular phase gratings; one was 488 nm � � ��4� indepth, and the other was 976 nm � � ��2� in depth.In both gratings the duty ratios were set to 50%. Thepitches of the rectangular phase grating when N� 1 and N � 2 were set to p � 65 �m and p� 68 �m, respectively. The object distance Z1 be-tween the object grating and the pupil grating wasalways the same as the image distance Z2 betweenthe pupil grating and the image plane, where theimage grating was located. Therefore, this imagingsystem has unit magnification. The grating pattern ofthe object grating and the image grating were fabri-cated by chrome evaporation. These amplitude grat-ings had transparent apertures with the half-width of
the period. A photodiode (PD) was placed close behindthe image grating.
When N � 1, the pitch of the object grating and theimage grating, determined by the imaging condition,was set to 130 �m; this was twice as much as thepitch of the pupil grating. When N � 2, the pitch ofthe object grating and the image grating was set to68 �m, which was equal to the pitch of the pupilgrating.
First, we observed the intensity distribution on theimage plane. The image grating and the PD werereplaced with a CCD camera, and the contrast of theintensity distribution was measured as a function ofZ (the CCD camera is not shown in Fig. 5). Second, wemeasured the output of the PD when the pupil grat-ing was moved along the X axis under high-contrastimaging conditions.
4. Results and Discussion
Figures 6(a) and 6(b) show the experimental resultsof the contrast of the intensity distribution at N� 1 and N � 2, respectively. The horizontal axisshows the parameter Z normalized by T. The valuesof T at N � 1 and N � 2 are 4.8 and 5.25 mm, re-spectively. The filled circles and open squares showthe experimental results at � ��4 and � ��2,respectively. The solid curves and the dashed curvesshow the calculated results. For both N � 1 and N� 2, reasonably good agreement between the exper-imental results and the calculated results is appar-ent. When N � 1 and � ��4, the absolute valueof the contrast was �60% at Z � T. When N � 2and � ��2, �60% contrast was also obtained at Z� T�4, 3T�4, 5T�4, and 7T�4. Under the N � 2 con-dition the contrast is two times higher than thatwhen an amplitude grating is used as the pupil.12
As seen in Fig. 6(a), the experimental results of � ��4 are somewhat more positive than the calcu-lated results. This is caused by the harmonics in-cluded in the object grating. Compared with thecalculated results of N � 1 and N � 3 in Fig. 3(a),both cases have a negative value where the experi-mental results are higher than the calculated results
Fig. 4. OTF calculated as a function of the image distance Z2
when the object distance Z1 is not equal to the image distance Z2:(a) N � 1 with � � ��4 and (b) N � 2 with � � ��2.
Fig. 5. Experimental setup of the optical system. PD, photo-diode.
1718 APPLIED OPTICS � Vol. 45, No. 8 � 10 March 2006

in Fig. 6(a). Furthermore, the calculated results ofN � 3 have a peak at each of these locations. Becausethe third-harmonic frequency �N � 3� and the funda-mental frequency �N � 1� were imaged with the samephase, the shape of the image resembled a rectangu-lar wave. For studying the amplitude of the funda-mental frequency directly, fast Fourier transformanalysis was performed on the experimental resultsof � ��4. Figure 7 shows the normalized amplitude
of the fundamental frequency as a function of Z. Theexperimental results plotted as open circles comeclose to the calculated result.
The output signal of the PD was measured as afunction of the pupil grating displacement along theX axis. Figures 8(a) and 8(b) show the displacementsignal at N � 1 and N � 2, respectively. The imagingconditions were optimized to obtain the high-amplitude signal. The displacement measurement ofN � 1 was made under the following conditions: Theobject distance Z1 and the image distance Z2 wereT �� 4.8 mm�, and the depth of the phase grating wasset to 488 nm � � ��4�. The displacement measure-ment of N � 2 was made under the following condi-tions: Z1 and Z2 were 3T�4 �� 3.94 mm�; the depthwas 976 nm � � ��2�. As shown in Fig. 8(b), a dis-placement signal having a period equal to 34 �m,which is half of the pupil grating pitch, was describedas a function of the movement of the pupil grating forN � 2. On the other hand, the pitch of the displace-ment signal was equal to that of the pupil grating forN � 1. Hence the N � 2 condition is better than theN � 1 condition with respect to the refinement ofresolution.
For both N � 1 and N � 2, an ac/dc ratio of �40%was obtained. We define the ac/dc ratio of the dis-placement signal by dividing the average value into
Fig. 6. Experimental results of the OTF as a function of Z: (a) N� 1 (T � 4.8 mm), (b) N � 2 (T � 5.25 mm).
Fig. 7. Normalized amplitude of the fundamental frequency as afunction of Z at N � 1 with � � ��4. The open circles correspond tothe experimental results, and the solid curve shows the calculatedresults.
Fig. 8. Output of the PD as a function of the pupil grating dis-placement: (a) N � 1, � � ��4, p � 65 �m, and Z1 � Z2 � T (� 4.8mm); (b) N � 2, � � ��2, p � 68 �m, and Z1 � Z2 � 3T�4 (� 3.94mm).
10 March 2006 � Vol. 45, No. 8 � APPLIED OPTICS 1719
the amplitude. The image contrast calculated fromthe ac/dc ratio was �62%, which was in good agree-ment with the predicted results of the OTF. The con-version coefficient between the image contrast andthe ac/dc ratio of the displacement signal depends onthe duty ratio of the image grating. In the case of the50% duty ratio, this value was equal to 2��.
The ac/dc ratio of N � 2 was two times higher thanthat with an amplitude grating as the pupil. Further-more, the received light powers in both cases werealso two times higher than that with an amplitudegrating because the rectangular phase grating wastransparent. Finally, under the N � 2 condition,which has an advantage with respect to the refine-ment of resolution, the amplitude of the displacementsignal was four times higher than that of the conven-tional imaging system with an amplitude grating.Actually, we made sure from the other experiment, byusing an amplitude grating by chrome evaporation asthe pupil, that just a quarter amplitude of the dis-placement signal was obtained compared with theresult in the phase grating. Because the resolution ofthe displacement measurement is basically deter-mined by the amplitude of the displacement signal, afour-times-higher resolution on displacement mea-surement was achieved when the pupil was changedfrom an amplitude grating to a rectangular phasegrating. The proposed method demonstrates goodperformance on displacement metrology.
5. Conclusion
We have discussed the imaging phenomenon with apupil phase grating that has a bilevel profile with a50% duty ratio. An OTF theory was introduced todescribe the grating imaging system, and the imagecontrast was calculated as a function of the objectdistance and the image distance. The experimentalresults, with an image contrast of �60%, demon-strate good agreement with the theoretical values.Furthermore, the received light power on the image
plane was twice as much as that when an amplitudegrating was used as a pupil. We made displacementmeasurements by moving the pupil grating, and theamplitude of the displacement signal was four timeshigher than that of the conventional imaging systemwith an amplitude grating.
References1. R. M. Pettigrew, “Analysis of grating imaging and its applica-
tion to displacement metrology,” Proc. SPIE 136, 325–332(1977).
2. J. Jahns and A. W. Lohman, “The Lau effect: a diffractionexperiment with incoherent illumination,” Opt. Commun. 28,263–267 (1979).
3. F. Gori, “Lau effect and coherence theory,” Opt. Commun. 31,4–8 (1979).
4. R. Sudol and B. J. Thompson, “Lau effect: theory and experi-ment,” Appl. Opt. 20, 1107–1116 (1981).
5. K. H. Brenner, A. W. Lohmann, and J. Ojeda-Castaneda, “Laueffect: OTF theory,” Opt. Commun. 46, 14–17 (1983).
6. D. Crespo, J. Alonso, T. Morlanes, and E. Bernabeu, “Opticalencoder based on the Lau effect,” Opt. Eng. 39, 817–824(2000).
7. G. J. Swanson and E. N. Leith, “Lau effect and grating imag-ing,” J. Opt. Soc. Am. 72, 552–555 (1982).
8. G. J. Swanson and E. N. Leith, “Analysis of the Lau effect andgeneralized grating imaging,” J. Opt. Soc. Am. A 2, 789–793(1985).
9. D. Crespo, J. Alonso, and E. Bernabeu, “Generalized gratingimaging using an extended monochromatic light source,” J.Opt. Soc. Am. A 17, 1231–1240 (2000).
10. D. Crespo, J. Alonso, and E. Bernabeu, “Experimental mea-surement of generalized grating images,” Appl. Opt. 41, 1223–1228 (2002).
11. K. Hane and C. P. Grover, “Imaging with rectangular trans-mission gratings,” J. Opt. Soc. Am. A 4, 706–711 (1987).
12. K. Hane and C. P. Grover, “Magnified grating images used indisplacement sensing,” Appl. Opt. 26, 2355–2359 (1987).
13. Y. Ohmura, T. Oka, T. Nakashima, and K. Hane, “Imaging bya phase grating used in displacement measurement,” in Pro-ceedings of American Society for Precision Engineering 2004Annual Meeting (American Society for Precision Engineering,2004), Vol. 34, pp. 518–521.
1720 APPLIED OPTICS � Vol. 45, No. 8 � 10 March 2006