imaging of gaps in digital joints by measurement … › ~hkanai › pdf-fullpaper ›...
TRANSCRIPT

Ultrasound in Med. & Biol., Vol. 35, No. 3, pp. 382–394, 2009Copyright © 2009 World Federation for Ultrasound in Medicine & Biology
Printed in the USA. All rights reserved0301-5629/09/$–see front matter
doi:10.1016/j.ultrasmedbio.2008.09.022
● Original Contribution
IMAGING OF GAPS IN DIGITAL JOINTS BY MEASUREMENT OFULTRASOUND TRANSMISSION USING A LINEAR ARRAY
HIDEYUKI HASEGAWA,#,* MICHIKO MATSUURA,† HIROSHI SATO,† TERUKO YAMAMOTO†
and HIROSHI KANAI�,#
#Graduate School of Biomedical Engineering; *Graduate School of Engineering; and †Graduate School of Dentistry,Tohoku University, Sendai, Japan
(Received 14 December 2007; revised 18 August 2008; in final form 15 September 2008)
Abstract—In orthodontic dentistry for young subjects, it is important to assess the degree of growth of the jawbones to determine the optimum time for treatment. The structure of the digital joint changes with age, with suchchanges correlating to the degree of bone growth (including jaw bones). There are two gaps in the digital jointof a young subject, one of which disappears with aging. In the present study, a method for noninvasive assessmentof such change in the structure of a digital joint was examined, in which continuous-wave ultrasound is radiatedto a digital joint by a single-element ultrasonic transducer. This continuous ultrasound, which passes through thedigital joint, is received by a linear array ultrasonic probe situated opposite the transducer. The probesimultaneously realizes pulse–echo imaging and imaging of transmission ultrasound, which passes through thejoint. Using this experimental apparatus, the existence and position of a gap can be detected clearly by imagingthe transmission ultrasound on a pulse–echo image. In basic experiments, continuous-wave ultrasound generatedby a planar or focused transducer was radiated to a gap between two acrylic bars, which simulated that in adigital joint; transmission ultrasound, which passed through the gap, was measured with a linear array probe.The basic experimental results showed that a gap with a width >0.4 mm is detectable and that the width at halfmaximum of the amplitude profile of the received transmission ultrasound that passed through the gap correlatedwith the width of the gap. Furthermore, in the preliminary in vivo experiments, transmission ultrasound thatpassed through two gaps in the case of a child was clearly imaged by the proposed method, and that which passedthrough only one gap in the case of an adult was also imaged. These results show the possibility for the use ofthe proposed method to noninvasively assess the change in the structure of a joint as a result of aging. (E-mail:[email protected]) © 2009 World Federation for Ultrasound in Medicine & Biology.
Key Words: Bone age, Digital joint, Continuous-wave ultrasound, Ultrasound transmission, Linear array.
INTRODUCTION
In orthodontic dentistry for young subjects, it is impor-tant to assess the degree of growth of the jaw bones todetermine the optimum time for treatment. The ossifica-tion of bones in a hand is often used for assessment ofbone age, such ossification being evaluated by x-rayimaging of a hand and wrist (Tanner et al. 1975; Rucci etal. 1995; Wit et al. 2005; Jones and Ma 2005). In addi-tion, Khal et al. (2008) have recently proposed a methodby which the degree of bone growth is assessed based onthe maturation of the cervical spine. The bone maturityassessed by this method was found to correlate well with
Address correspondence to: Hideyuki Hasegawa, Department ofBiomedical Engineering, Graduate School of Biomedical Engineering,
Tohoku University, 6-6-05 Aramaki-aza-Aoba, Aoba-ku, Sendai 980-8579, Japan. E-mail: [email protected]382
that assessed by hand radiography. This method wouldbe useful because the cervical spine is always seen on thelateral cephalometric radiograph. Although these meth-ods give an accurate estimate of bone age, exposure ofhealthy subjects to x-rays is inevitable.
Because ultrasound is useful for noninvasive diag-nosis of bone, many studies on ultrasonic measurementof bone have been conducted. Wells (1975) reported thespeed of sound and ultrasonic absorption in bone,whereas Williams (1991) predicted the propagation ofslow and fast waves propagating through bone by Biot’stheory (Biot 1962) and also experimentally measuredthese waves. Otani and colleagues extensively investi-gated slow and fast waves (Hosokawa and Otani 1997,1998; Hosokawa et al. 1997; Otani 2005), which propa-gate in bone marrow and the contained hard structure,
respectively. Therefore, the amplitude of a slow-wave
disappears with aging. (b)
imaged by pulse–echo imaging.
Imaging of gaps in digital joints ● H. HASEGAWA et al. 383
propagating through the cancellous or trabecular boneincreases as the hard structure decreases, whereas that ofa fast wave decreases. The hard structure in trabecularbone decreases because of osteoporosis and, thus, amethod has recently been developed to quantitativelyestimate bone density and quality by measuring the am-plitude change of these waves that cannot be obtainedonly from the attenuation coefficient of bone (Otani2005). Speed-of-sound and attenuation of ultrasound inbone is used widely for characterization of bone (Asai etal. 1996; Wear 2000, 2001a; Bossy et al. 2004). How-ever, the structure of bone is complex, and the measuredsound velocity shows a significant dispersion. Manystudies have been conducted to identify the sources ofthis dispersion (Droin et al. 1998; Wear 2000, 2001b),and Häat et al. (2006) have attempted to generalize themeasurement of sound velocity in bone. Furthermore,methods for estimating attenuation and spacing of can-cellous bone structures by analyzing backscattered ultra-sound have been developed (Wear 2003; Pereira et al.2004) because the aforementioned methods require mea-surement of transmission ultrasound through the bone,and it is difficult to apply such methods to bone deepinside the body. All of these methods measure speed-of-sound and attenuation of ultrasound propagating through,or backscattered from, a large bone to estimate the bonedensity for diagnosis of osteoporosis in elderly subjects,the quality of bone being the main focus.
The present study was focused on the structure of ajoint. As shown by a method using x-ray imaging (Tan-ner et al. 1975; Rucci et al. 1995; Wit et al. 2005; Jonesand Ma 2005), the structure of a joint of a young subjectchanges because of aging. In the case of a digital joint ofa young subject, there are two gaps, one of which dis-
) 5-year-old male. The arrowhead indicates the gap that26-year-old female.
Fig. 1. X-ray image of the second joint of the middle finger. (a
Fig. 2. (a) Ultrasonic B-mode image of the second joint of themiddle finger of a 33-year-old male. (b) Illustration of regions
appears with aging. The present study investigated an

MHz; (2) focused
384 Ultrasound in Medicine and Biology Volume 35, Number 3, 2009
ultrasonic-based method to noninvasively assess suchchange in the structure of a digital joint by using ultra-sound transmission through a joint. Weigel et al. (1982)conducted ultrasound transmission imaging using sacri-ficed dogs seven to eight weeks of age. They usedcollimated ultrasound (plane wave) for transmission, thetransmitted ultrasound being focused by an acoustic lenssystem. Their system achieved a spatial resolution ofapproximately 1 mm at an ultrasonic frequency of 2MHz. In the present study, higher-frequency ultrasoundwas used for ultrasound transmission through a digitaljoint, the gap of such joint usually being �1 mm. Fur-thermore, focused and unfocused ultrasound were usedbecause the latter may be better for transmission througha narrow gap. Ultrasound transmitted through a gap wasmeasured by a linear array ultrasonic probe. This exper-imental setup enables simultaneous pulse–echo imagingand ultrasound transmission imaging. The feasibility ofthis method was investigated by basic experiments usingacrylic bars. Furthermore, initial in vivo imaging wasconducted for child and adult subjects.
Current methods for assessment of the bone matu-rity using x-rays are accurate and exposure to radiation isrelatively low. However, ultrasonic methods would sup-plement x-ray methods because of their absolute nonin-vasiveness and potential for use in a wide range ofmedical institutions, because the cost of ultrasonic equip-ment is lower than that of x-ray equipment. Unfortu-nately, no equipment for imaging ultrasound transmis-sion is now commercially available, and thus a newexperimental system was used in this study to examinethe basic concepts of the proposed method.
MATERIALS AND METHODS
Growth of bone in digital jointsFigure 1a and b show x-ray images of the second
joints of middle fingers of a 5-year-old male and 26-year-
red line in (a) of transmission ultrasound: (1) planar, 5
Fig. 3. (a) Measurement apparatus to realize pulse–echo imag-ing and ultrasound transmission imaging simultaneously. (b)Schematic diagram of experimental setup. Both planar and
focused transducers were used for ultrasound transmission.
Fig. 4. (a) Imaged pattern and (b) amplitude profile along the
, 7 MHz.
Imaging of gaps in digital joints ● H. HASEGAWA et al. 385
old female, respectively. The gap indicated by the whitearrow in Fig. 1a disappears because of aging. Therefore,a joint with developing bone can be differentiated fromthat with mature bone by identifying whether there aretwo gaps. In addition, the width of the gap indicated bythe white arrow in Fig. 1a can be used for evaluation ofbone age. This study was approved by the Ethics Com-mittee on Clinical Investigation, Graduate School ofDentistry, Tohoku University, and was performed inaccordance with the policy of the Declaration of Hel-sinki; all subjects gave informed consent.
Conceptual overviewUltrasonic B-mode imaging is useful for morpho-
logic diagnosis of organs. Figure 2a shows a B-mode
10 mm
(a)
(b)
(c)
(d)0.25
0.125
0
ampl
itude
norm
aliz
ed
10 mm
0[dB]
−20
−40
10 m
m
Fig. 5. Example of analysis in basic experiments (diameters ofbars: 10 mm; width of gap: 0.6 mm; planar transducer forultrasound transmission): B-mode images (a) with and (b)without exposure of transmission ultrasound, respectively. Thetransmitting transducer was placed on the bottom and the lineararray probe was placed at the top. (c) Subtraction image ob-tained from (a) and (b). (d) Amplitude profile along the red line
in (c).
image of the second joint of the middle finger of a33-year-old male. A gap in the joint can be recognized inthe B-mode image shown in Fig. 2a. However, the tissuestructure in the joint is poorly imaged because the inci-dent ultrasound is almost perfectly reflected by the nearsurfaces of bones and the pulse–echo imaging can onlyassess the shape of the near surfaces (illustrated by thesolid curves in Fig. 2b). In addition, the exact position ofa gap is somewhat unclear because the image pattern ina gap is inhomogeneous, as shown in Fig. 2a, similar tothat of the surrounding soft tissue. The reason is that theacoustic impedance of cartilage (of course, there is softtissue in a joint) is much closer to that of soft tissuecompared with that of bone (Töyräs et al. 2003), andthere is no distinct echo from a gap.
To overcome this drawback, in this study transmis-sion of continuous ultrasound through a gap in a jointwas imaged in combination with pulse–echo imaging toclearly assess the existence of gaps and their positions. Alinear array ultrasonic probe was positioned, as shown inFig. 3a, for pulse–echo imaging of a gap. A single-
0.25
0.125
0
0.25
0.125
0
0.25
0.125
0
0.25
0.125
0
0.25
0.125
0
norm
aliz
ed a
mpl
itude
10 mm10 mm
(k)4
3
2
1
0
of a
mpl
itude
pro
file
[mm
]w
idth
at h
alf m
axim
um
0 1 2 3 4width of gap [mm]
Fig. 6. Amplitude profiles at different widths of the gap (planartransducer, diameter of bars: 10 mm): (a) 0 mm, (b) 0.4 mm, (c)0.8 mm, (d) 1.2 mm, (e) 1.6 mm, (f) 2 mm, (g) 2.4 mm, (h) 2.8mm, (i) 3.2 mm and (j) 3.6 mm. (k) Width at half maximum ofthe amplitude profile plotted as a function of the gap width(diameter of bars: 10 mm). Planar transducer was used, andwidths at half maximum were obtained from 10 image frames
at each gap width d.
element ultrasonic transducer opposite the linear array

386 Ultrasound in Medicine and Biology Volume 35, Number 3, 2009
was used for irradiation of continuous-wave ultrasoundfor transmission through the gap. Transmission ultra-sound that passed through the gap was received by thelinear array. Ultrasound for transmission was irradiatedcontinuously, and transmission ultrasound that passedthrough the gap was imaged together with the pulse-echoimage. Imaged transmission ultrasound clearly showedthe existence of a gap, and the transmission patternprovided information on the width of the gap.
Experimental setupAs shown in Fig. 3b, two acrylic bars were placed
between a 10-MHz linear array probe (UST-5545, AlokaCo., Ltd., Tokyo, Japan) for imaging and a transducer forgeneration of continuous-wave ultrasound to penetrate agap with width d between the two acrylic bars. The gapsimulated that between bones in a joint. Transmissionultrasound that passed through the gap was measured bythe linear array probe. Planar (5Z10I-C, Tokimec Co.,Ltd., Tokyo, Japan) and focused (7Z10I-PF30-C-K445,Tokimec Co., Ltd.) transducers, driven by 5-MHz and
norm
aliz
ed a
mpl
itude
10 mm 10 mm
0
0
0
0
0
0.5
0.25
0.5
0.25
0.5
0.25
0.5
0.25
0.5
0.25
(k)4
3
2
1
0
of a
mpl
itude
pro
file
[mm
]w
idth
at h
alf m
axim
um
0 1 2 3 4width of gap [mm]
Fig. 7. Amplitude profiles at different widths of the gap (fo-cused transducer, diameter of bars: 10 mm): (a) 0 mm, (b) 0.4mm, (c) 0.8 mm, (d) 1.2 mm, (e) 1.6 mm, (f) 2 mm, (g) 2.4 mm,(h) 2.8 mm, (i) 3.2 mm and (j) 3.6 mm. (k) Width at halfmaximum of the amplitude profile plotted as a function of thegap width (diameter of bars: 10 mm). Focused transducer wasused, and widths at half maximum were obtained from 10
image frames at each gap width d.
7-MHz continuous signals, respectively, were used for
generation of transmission ultrasound. The distance be-tween the surface of the transducer and the lower edgesof the acrylic bars was set at 30 mm, which correspondsto the focal distance of the focused transducer. Thedistance between the surface of the linear array probe andthe upper edges of the acrylic bars was set at 20 mm,which corresponds to the elevational focal distance(fixed focus using acoustic lens). Using this apparatus,the ultrasound transmitted through the gap could beimaged together with the object (acrylic bars). RF sig-nals, which contain both continuous-wave and pulsedultrasound produced by the transducer and array probe,respectively, and are received by the array probe, weresampled at 40 MHz.
As described previously, it is essential for evalua-tion of bone age of a young subject to investigatewhether one or two gaps exist between the bones in ajoint. Furthermore, it is desirable that the width of thegap be assessed from the measured pattern of transmis-sion ultrasound. In basic experiments, transmission ul-trasound was measured by changing the gap width dfrom 0–4 mm, with increments of 0.2 mm to investigatehow a small gap can be detected and whether the width
10 mm
10 mm
0 1 2 3 4width of gap [mm]
0
1
2
3
4
of a
mpl
itude
pro
file
[mm
]w
idth
at h
alf m
axim
um
descendingleading
(b)
(a)
Fig. 8. (a) Example of measurement of an amplitude profile atthe leading edge (indicated by red line) of the echo from theupper surface of the bar (diameter of bars: 10 mm). (b) Widthsat half maxima of amplitude profiles obtained at the leading and
descending edges of the echo from the upper surface of the bar.
Imaging of gaps in digital joints ● H. HASEGAWA et al. 387
of such a gap can be evaluated using the measuredtransmission ultrasound.
Difference between imaged patterns of transmission ul-trasound produced by planar and focused transducers
Figure 4(1-a) and (2-a) show the imaged transmis-sion ultrasound produced by the planar and focused
Fig. 9. Illustration of measurement of sound field emitted froma gap.
Fig. 10. Sound fields measured by a hydrophone when a30 mm and (2) 40 mm away from the lower surface of th
ultrasound were emitted from
transducers for transmission, respectively. In these fig-ures, gap width d was set at about 5 mm and 9 mm,respectively, i.e., �4 mm (maximum gap width in basicexperiments), to visualize the imaged pattern of trans-mission ultrasound in a wider area. Figure 4(1-b) and(2-b) show the profiles of the amplitudes of ultrasoundsignals received by the linear array probe along the redlines in Fig. 4(1-a) and (2-a). The imaged radiationpattern of the focused transducer (Fig. 4[2-a]) was rathercomplex compared with that of the planar transducer(Fig. 4[1-a]), the latter being suitable for imaging a widergap. However, as the measured transmission ultrasoundproduced by the focused transducer showed a high in-
d transducer for ultrasound transmission was placed (1)diameter of bars: 10 mm). (a) Continuous and (b) pulsed
Table 1. Widths at half maxima �w of the amplitude profilesof transmission ultrasound measured for different distancesbetween the focused transducer for transmitting ultrasound
and the lower surface of the acrylic bar (10 mm in diameter)
Width of gapd (mm)
Distance between focusedtransducer and lowersurface of bar (mm)
Width at halfmaximum�w (mm)
0.6 30 0.80.6 40 0.72.0 30 1.82.0 40 1.8
focusee bar (
a focused transducer.
388 Ultrasound in Medicine and Biology Volume 35, Number 3, 2009
tensity within a narrow area (width at half maximum: 2mm), it would be useful for penetration of cartilage andtissue in a joint because the attenuation in such tissue ismuch greater than that in water. Thus, the focused trans-ducer was used in the following preliminary in vivoimaging, whereas both the planar and focused transduc-ers were used in the basic experiments.
BASIC EXPERIMENTAL RESULTS
Measurements with the planar transducerFigure 5a and b show B-mode images with and
without exposure of transmission ultrasound producedby the 5-MHz planar transducer. The width of the gap inFig. 5 was 0.6 mm. Ultrasound transmitted through thegap was clearly imaged. In the basic experiments, theobject was stationary. Therefore, as shown in Fig. 5c,only transmission ultrasound that passed through the gapcould be imaged by subtracting the RF signals withoutexposure from those with exposure, which were received
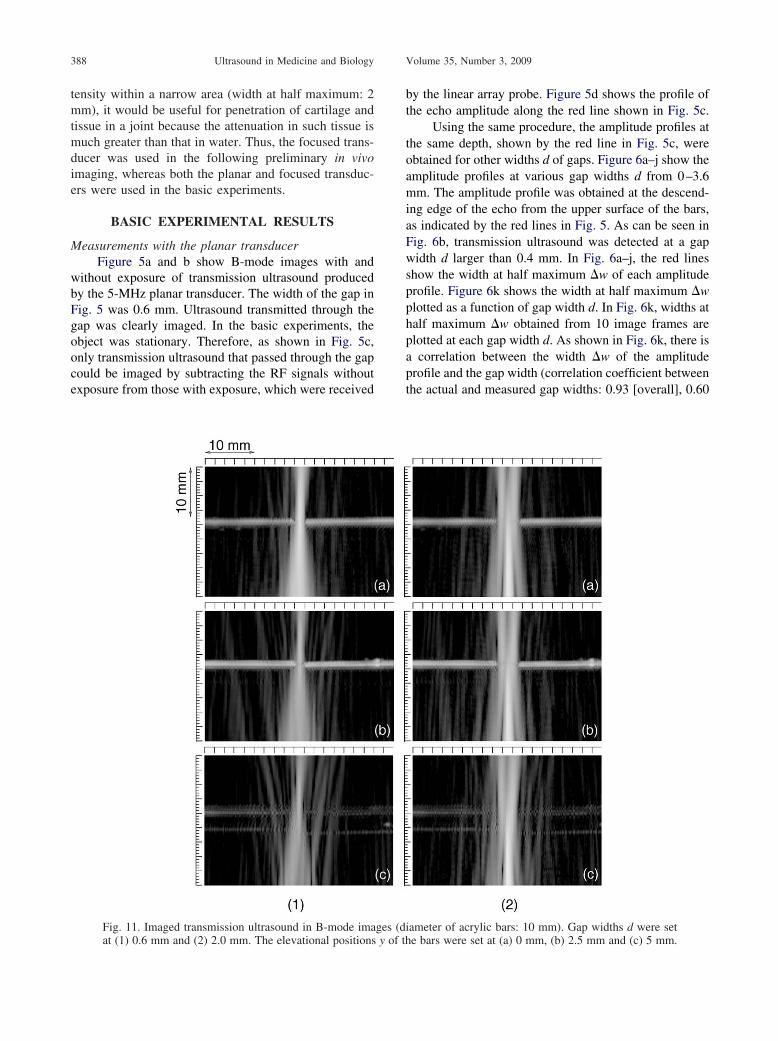
Fig. 11. Imaged transmission ultrasound in B-mode ima
at (1) 0.6 mm and (2) 2.0 mm. The elevational positions y of thby the linear array probe. Figure 5d shows the profile ofthe echo amplitude along the red line shown in Fig. 5c.
Using the same procedure, the amplitude profiles atthe same depth, shown by the red line in Fig. 5c, wereobtained for other widths d of gaps. Figure 6a–j show theamplitude profiles at various gap widths d from 0–3.6mm. The amplitude profile was obtained at the descend-ing edge of the echo from the upper surface of the bars,as indicated by the red lines in Fig. 5. As can be seen inFig. 6b, transmission ultrasound was detected at a gapwidth d larger than 0.4 mm. In Fig. 6a–j, the red linesshow the width at half maximum �w of each amplitudeprofile. Figure 6k shows the width at half maximum �wplotted as a function of gap width d. In Fig. 6k, widths athalf maximum �w obtained from 10 image frames areplotted at each gap width d. As shown in Fig. 6k, there isa correlation between the width �w of the amplitudeprofile and the gap width (correlation coefficient betweenthe actual and measured gap widths: 0.93 [overall], 0.60
ameter of acrylic bars: 10 mm). Gap widths d were set
ges (di e bars were set at (a) 0 mm, (b) 2.5 mm and (c) 5 mm.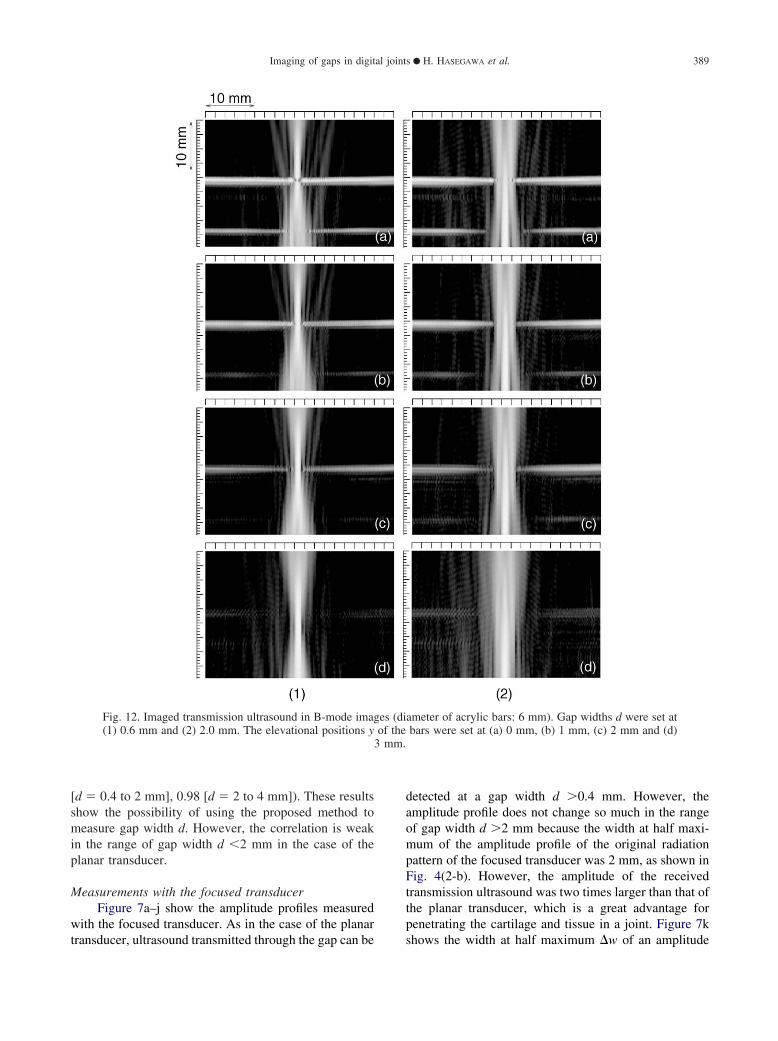
3 mm.
Imaging of gaps in digital joints ● H. HASEGAWA et al. 389
[d � 0.4 to 2 mm], 0.98 [d � 2 to 4 mm]). These resultsshow the possibility of using the proposed method tomeasure gap width d. However, the correlation is weakin the range of gap width d �2 mm in the case of theplanar transducer.
Measurements with the focused transducerFigure 7a–j show the amplitude profiles measured
with the focused transducer. As in the case of the planar
Fig. 12. Imaged transmission ultrasound in B-mode imag(1) 0.6 mm and (2) 2.0 mm. The elevational positions y
transducer, ultrasound transmitted through the gap can be
detected at a gap width d �0.4 mm. However, theamplitude profile does not change so much in the rangeof gap width d �2 mm because the width at half maxi-mum of the amplitude profile of the original radiationpattern of the focused transducer was 2 mm, as shown inFig. 4(2-b). However, the amplitude of the receivedtransmission ultrasound was two times larger than that ofthe planar transducer, which is a great advantage forpenetrating the cartilage and tissue in a joint. Figure 7k
ameter of acrylic bars: 6 mm). Gap widths d were set atbars were set at (a) 0 mm, (b) 1 mm, (c) 2 mm and (d)
es (diof the
shows the width at half maximum �w of an amplitude

390 Ultrasound in Medicine and Biology Volume 35, Number 3, 2009
profile plotted as a function of gap width d. In Fig. 7k,widths at half maximum �w obtained from 10 imageframes are plotted at each gap width d. There is nocorrelation between the width at half maximum �w andgap width d in the range of gap width �2 mm, whichcorresponds to the fact that the amplitude profile does notchange in that range, as shown in Fig. 7a–j. However,there is a strong correlation at a gap width d �2 mm(correlation coefficient between the actual and measuredgap widths: 0.7 [overall], 0.94 [d � 0.4 to 2 mm] and�0.94 [d � 2 to 4 mm]). Therefore, a focused transduceris useful, especially for imaging a narrow gap in a digitaljoint. As shown in Fig. 1, the typical width of a gap in adigital joint is �2 mm. Therefore, the focused transducerwas used in the subsequent experiments.
Widths at half maxima shown in Fig. 7k weremeasured at depth positions assigned by referring to thedescending edge of the echo from the upper surface ofthe acrylic bar. Figure 8 shows the widths at half maximameasured at the leading edge of the echo from the uppersurface; the measured widths �w in Fig. 8 are similar tothose in Fig. 7k. In this study, widths at half maxima �wwere measured at the descending edge in the subsequentexperiments because stable measurements of �w can beachieved as long as measurement is done at the leadingor descending edge of the echo from the upper surface ofthe bars.
The sound pressure distribution measured with ahydrophone, which scans the sound field in the horizon-tal direction x (the longitudinal axis of the bar), as shownin Fig. 9, was shown in Figure 10(1-a). Gap width d wasset to be 0.6 mm, and the distance between the lowersurface of the bar and the transmitting transducer was setat 30 mm. To more clearly observe how the ultrasoundwave propagated, pulsed ultrasound was irradiated fromthe transmitting transducer as shown in Fig. 10(1-b),which shows that a spherical wave was emitted from thegap. The distance between the hydrophone and thesource of the spherical wave, which was estimated fromthe time delay (p � 0.07 �s, as shown in Fig. 10[1-b])
Table 2. Widths at half maxima �w of the amplitude profilesof transmission ultrasound measured for different elevational
positions y of the bars (10 mm in diameter)
Gap widthd (mm)
Elevational positiony (mm)
Width at half maximum�w (mm)
0.6 0 0.80.6 2.5 0.90.6 5 1.02.0 0 1.82.0 2.5 1.82.0 5 1.6
between signals received at two different horizontal po-
sitions x, was 19 mm. Therefore, the source was esti-mated to be located at the gap on the level of the uppersurface of the bar. In the diagnostic ultrasound equip-ment used, dynamic focusing was applied to the signalsreceived by the array elements. In this case, the width ofthe ultrasound beam becomes the narrowest at the posi-tion of the source of the spherical wave.
Figure 10(2) shows the sound field measured whenthe distance l between the lower surface of the bar andthe transmitting transducer was set at 40 mm, and Table1 shows a comparison of the widths at half maxima �wmeasured at l � 30 and 40 mm. The wave pattern wassimilar to that in Fig. 10(1), and the width at half max-imum �w measured at l � 40 mm was similar to that atl � 30 mm. However, the amplitude of transmissionultrasound that passed through the gap decreased 50%, asshown in Fig. 10(2). It is considered that more energycan enter a gap when the beam width is narrower at theentrance of a gap. These results indicate that it is betterto locate the focal point of a transmitting transducer atthe lower surface of the bar.
Measurements of gaps between bars with different diam-eters
Acrylic bars 10 mm and 6 mm in diameter wereused to create gaps, as shown in Fig. 3b. Transmissionultrasound that passed through gaps with different widthsd of 0.6 and 2.0 mm were measured for the differentpositions, y, of the acrylic bars in the elevational direc-tion to investigate the influence of the alignment of thebars.
Figures 11 and 12 show the B-mode images andTables 2 and 3 show the widths at half maxima �w of theamplitude profiles of transmission ultrasound measuredat each setting of gap width d and elevational position y.As shown in Tables 2 and 3, the measured width at halfmaximum �w does not change when the elevationalposition y is less than half the radius of the bar, and thedifference between widths at half maxima of the ampli-
Table 3. Widths at half maxima �w of the amplitude profilesof transmission ultrasound measured for different elevational
positions y of the bars (6 mm in diameter)
Gap widthd (mm)
Elevational positiony (mm)
Width at half maximum�w (mm)
0.6 0 0.70.6 1 0.70.6 2 0.60.6 3 0.72.0 0 1.72.0 1 1.72.0 2 1.4
2.0 3 1.9
(d) 7.
Imaging of gaps in digital joints ● H. HASEGAWA et al. 391
tude profiles obtained for 6-mm and 10-mm acrylic barswas 0.1 mm when y � 0.
Measurements at different angles of incidence betweenultrasound and the gap
The amplitude profile of transmission ultrasoundwould be influenced by the angle of incidence betweenthe ultrasound beam radiated by the focused transducerand the gap. In the previous section, the widths at halfmaxima measured for the acrylic bars with differentdiameters were similar when the elevational position ywas zero. Therefore, the influence of the angle of inci-dence was investigated using acrylic bars 10 mm indiameter by setting the elevational position y at zero. Thegap width d was set at 0.6 mm. Figure 13 shows imagesof transmission ultrasound through the gap at differentangles of incidence � � 0, 2.5, 5 and 7.5 degrees. Table4 shows the width at half maximum �w measured atthese angles of incidence �. As shown in Fig. 13, al-though the change in the alignment was obvious, evenwhen the angle of incidence was 2.5 degrees, the mea-sured widths at half maxima were similar, as shown inTable 4.
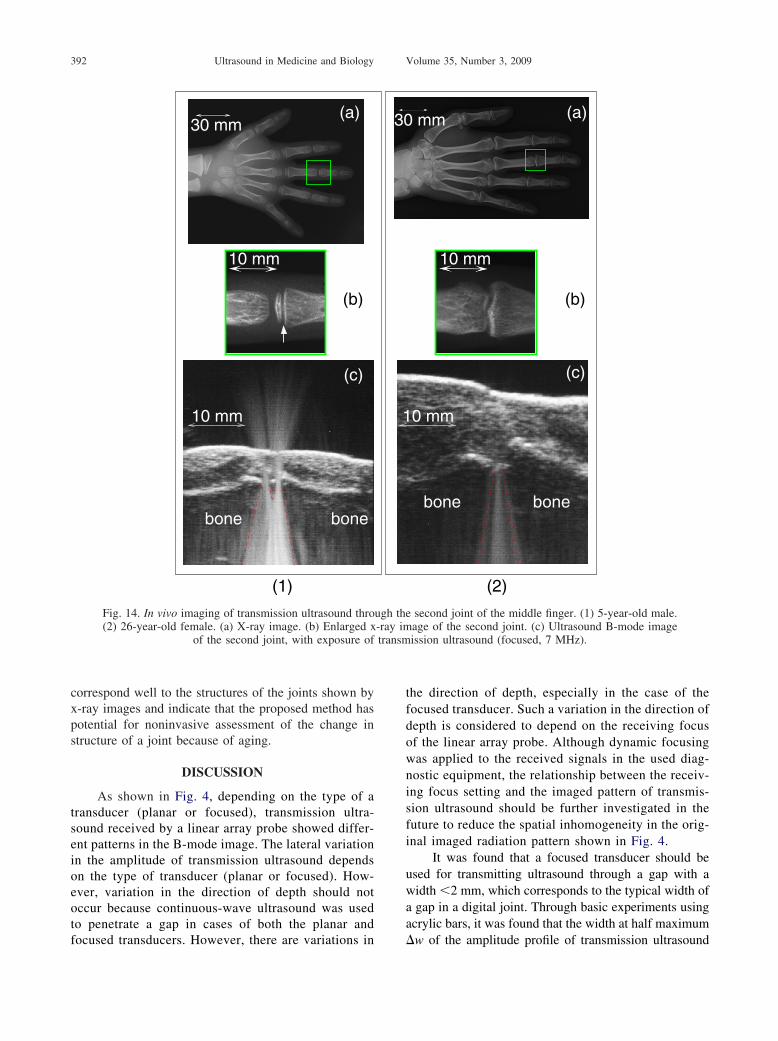
Preliminary in vivo imagingFigure 14(1-a) and (2-a) show x-ray images of the
Fig. 13. Imaged transmission ultrasound through the gadegree, (b) 2.5 degrees, (c) 5 degrees and
hands of a 5-year-old male and a 26-year-old female,
respectively, and Fig. 14(1-b) and (2-b) are enlargedviews of the second joints of their middle fingers. One ofthe two gaps found in the child subject indicated by thewhite arrow in Fig. 14(1-b) is not found in the joint of the26-year-old female shown in Fig. 14(2-b).
Figure 14(1-c) shows an ultrasound B-mode imagewith exposure of transmission ultrasound (focused, 7MHz) for the 5-year-old male, and Fig. 14(2-c) showsthat of the 26-year-old female. The widths of gaps ofthese two subjects are from 1–2 mm, and the focusedtransducer was used with consideration of the results ofthe basic experiments. In Fig. 14(1-c), transmission ul-trasound that passed through the two regions in the jointcan be clearly recognized in the case of the 5-year-oldmale. On the other hand, in the B-mode image of the26-year-old female (Fig. 14[2-c]), applied focused ultra-sound passed through only one region. These results
th d: 0.6 mm) at different angles of incident � of (a) 05 degrees. Diameter of bars was 10 mm.
Table 4. Widths at half maxima �w of the amplitude profilesof transmission ultrasound measured at different angles of
incidence � (diameter of bars: 10 mm)
Angle of incidence � (deg.) Width at half maximum �w (mm)
0 0.72.5 0.75 0.7
p (wid
7.5 0.8
transm
392 Ultrasound in Medicine and Biology Volume 35, Number 3, 2009
correspond well to the structures of the joints shown byx-ray images and indicate that the proposed method haspotential for noninvasive assessment of the change instructure of a joint because of aging.
DISCUSSION
As shown in Fig. 4, depending on the type of atransducer (planar or focused), transmission ultra-sound received by a linear array probe showed differ-ent patterns in the B-mode image. The lateral variationin the amplitude of transmission ultrasound dependson the type of transducer (planar or focused). How-ever, variation in the direction of depth should notoccur because continuous-wave ultrasound was usedto penetrate a gap in cases of both the planar and
(a)
10 mm
(c)
(b)
bonebone
10 mm
30 mm
(1)
Fig. 14. In vivo imaging of transmission ultrasound thro(2) 26-year-old female. (a) X-ray image. (b) Enlarged x
of the second joint, with exposure of
focused transducers. However, there are variations in
the direction of depth, especially in the case of thefocused transducer. Such a variation in the direction ofdepth is considered to depend on the receiving focusof the linear array probe. Although dynamic focusingwas applied to the received signals in the used diag-nostic equipment, the relationship between the receiv-ing focus setting and the imaged pattern of transmis-sion ultrasound should be further investigated in thefuture to reduce the spatial inhomogeneity in the orig-inal imaged radiation pattern shown in Fig. 4.
It was found that a focused transducer should beused for transmitting ultrasound through a gap with awidth �2 mm, which corresponds to the typical width ofa gap in a digital joint. Through basic experiments usingacrylic bars, it was found that the width at half maximum
(a)
0 mm
bone bone
(c)
(b)
10 mm
mm
(2)
second joint of the middle finger. (1) 5-year-old male.age of the second joint. (c) Ultrasound B-mode imageission ultrasound (focused, 7 MHz).
1
30
ugh the-ray im
�w of the amplitude profile of transmission ultrasound
Imaging of gaps in digital joints ● H. HASEGAWA et al. 393
correlated well with actual gap width d under the fol-lowing conditions:
(1) The focal point of a transmitting transducer is lo-cated at the lower surface of the bar.
(2) The elevational positions y of the bars are set to beless than half of the radius of the bar.
(3) The width at half maxima �w is measured at theleading or descending edge of the echo from theupper surface of the bar.
To realize stable in vivo measurements, in futurework it will be important to develop a measurementsystem in which the above conditions are maintained.
To apply this method to other larger joints, the sepa-ration between a transducer for ultrasound transmission andan imaging probe needs to be increased. To keep the focalposition of a transducer as it was in the present study, adifferent transducer and different probe must be used toincrease the separation. The frequency of ultrasound mayneed to be changed because of the increase of the distancebetween the skin surface and a joint. In addition, the type oftransducer (planar or focused) may need to be considered toimage a wider gap in a larger joint. Therefore, the optimumfrequency of transmission ultrasound and the type of trans-ducers (planar or focused) should be more thoroughly in-vestigated because the frequency of ultrasound significantlyinfluences the spatial resolution. In this preliminary study,different frequencies were used for the planar and focusedtransducers. A set consisting of planar and focused trans-ducers operated at the same frequency would be required toinvestigate the difference between these transducers, andsets of transducers at different frequencies would be re-quired to investigate the optimum frequency.
Although there are many things to be investigatedfurther as described here, the proposed method would en-able the tomographic imaging of a digital joint. The com-bination of pulse–echo imaging and tomographic imagingshould be useful for diagnosis of joint structures.
CONCLUSION
The structure of a digital joint changes with aging.There are two gaps in a digital joint of a young subject,one that disappears with aging. To noninvasively assesssuch change in a digital joint, in this study continuous-wave ultrasound was radiated through a gap between twoacrylic bars, which simulated the gap in the digital joint.Transmission ultrasound was measured with a lineararray probe for imaging. The basic experimental resultsshowed that a gap with a width �0.4 mm can be imaged.In the case of a planar transducer, the width at halfmaximum of the amplitude profile of received transmis-sion ultrasound that passed through the gap correlated
with the width of the gap when the gap was �2.0 mm.On the other hand, the width at half maximum obtainedusing a focused transducer correlated with the gap widthwhen the gap was �2.0 mm. From these results, afocused transducer is considered to be preferable for themeasurement of a gap in a digital joint whose width istypically �2 mm. Furthermore, in the preliminary in vivoexperiments, transmission ultrasound that passed throughtwo gaps was clearly imaged by the proposed method inthe case of a child subject, whereas transmission ultra-sound that passed through only one gap was imaged inthe case of an adult subject. These results show thepossibility of using the proposed method to noninva-sively assess the change in the structure of a joint be-cause of aging.
REFERENCES
Asai H, Kanai H, Chubachi N. Noninvasive method for measuringvelocity of leaky surface skimming compressional wave propagat-ing on bone surface. Electron Lett 1996;32:2290–2291.
Biot MA. Generalized theory of acoustic propagation in porous dissi-pative media. J Acoust Soc Am 1962;34:1254–1264.
Bossy E, Talmant M, Defontaine M, Patat F, Laugier P. Bidirectionalaxial transmission can improve accuracy and precision of ultrasonicvelocity measurement in cortical bone: A validation on test mate-rials. IEEE Trans Ultrason Ferroelectr Freq Control 2004;51:71–79.
Droin P, Berger G, Laugier P. Velocity dispersion of acoustic waves incancellous bone. IEEE Trans Ultrason Ferroelectr Freq Control 1998;45:581–592.
Häat G, Padilla F, Cleveland RO, Laugier P. Effects of frequency-depen-dent attenuation and velocity dispersion on in vitro ultrasound velocitymeasurements in intact human femur specimens. IEEE Trans UltrasonFerroelectr Freq Contr 2006;53:39–51.
Hosokawa A, Otani T. Ultrasonic wave propagation in bovine cancel-lous bone. J Acoust Soc Am 1997;101:558–562.
Hosokawa A, Otani T, Suzaki T, Kubo Y, Takai S. Influences oftrabecular structure on ultrasonic wave propagation in bovine can-cellous bone. Jpn J Appl Phys 1997;36:3233–3237.
Hosokawa A, Otani T. Acoustic anisotropy in bovine cancellous bone.J Acoust Soc Am 1998;103:2718–2722.
Jones G, Ma D. Skeletal age deviation assessed by the Tanner-White-house 2 method is associated with bone mass and fracture risk inchildren. Bone 2005;36:352–357.
Khal HAA, Wong WK, Rabie ABM. Elimination of the hand-wristradiographs for maturity assessment in children needing orthodon-tic therapy. Skeletal Radiol 2008;37:195–200.
Otani T. Quantitative estimation of bone density and bone quality usingacoustic parameters of cancellous bone for fast and slow waves. JpnJ Appl Phys 2005;44:4578–4582.
Pereira WCA, Bridal SL, Coron A, Laugier P. Singular spectrumanalysis applied to backscattered ultrasound signals from in vitrohuman cancellous bone specimens. IEEE Trans Ultrason Ferro-electr Freq Control 2004;51:302–312.
Rucci R, Coppini G, Nicoletti I, Cheli D, Valli G. Automatic analysisof hand radiographs for the assessment of skeletal age: A subsym-bolic approach. Comput Biomed Res 1995;28:239–256.
Tanner J, Whitehouse R. Assessment of Skeletal Maturity and Predic-tion of Adult Height (TW2 method). New York: Academic Press,1975.
Töyräs J, Laasanen MS, Saarakkala S, Lammi MJ, Rieppo J, KurkuärviJ, Lappalainen R, Jurvelin JS. Speed of sound in normal anddegenerated bovine articular cartilage. Ultrasound Med Biol 2003;29:447–454.
Wear KA. The effects of frequency-dependent attenuation and disper-sion on sound speed measurements: Applications in human trabec-
394 Ultrasound in Medicine and Biology Volume 35, Number 3, 2009
ular bone. IEEE Trans Ultrason Ferroelectr Freq Control 2000;47:265–273.
Wear KA. Ultrasonic attenuation in human calcaneus from 0.2 to 1.7MHz. IEEE Trans Ultrason Ferroelectr Freq Control 2001a;48:602–608.
Wear KA. A stratified model to predict dispersion in trabecular bone.IEEE Trans Ultrason Ferroelectr Freq Control 2001b;48:1079–1083.
Wear KA. Characterization of trabecular bone using the backscatteredspectral centroid shift. IEEE Trans Ultrason Ferroelectr Freq Con-trol 2003;50:402–407.
Weigel JP, Cartee RE, Marich KW. Preliminary study on the use of
ultrasonic transmission imaging to evaluate the hip joint in theimmature dog. Ultrasound Med Biol 1983;9:371–378.
Wells PNT. Absorption and dispersion of ultrasound in biologicaltissue. Ultrasound Med Biol 1975;1:369–376.
Williams JL. Ultrasonic wave propagation in cancellous and corticalbone: Prediction of some experimental results by Biot’s theory. JAcoust Soc Am 1992;91:1106–1112.
Wit JM, Rekers-Mombarg LT, Cutler GB, Crowe B, Beck TJ, RobertsK, Gill A, Chaussain JL, Frisch H, Yturriaga R, Attanasio AF.Growth hormone (GH) treatment to final height in children withidiopathic short stature: Evidence for a dose effect. J Pediatr 2005;
146:45–53.