image mining
TRANSCRIPT
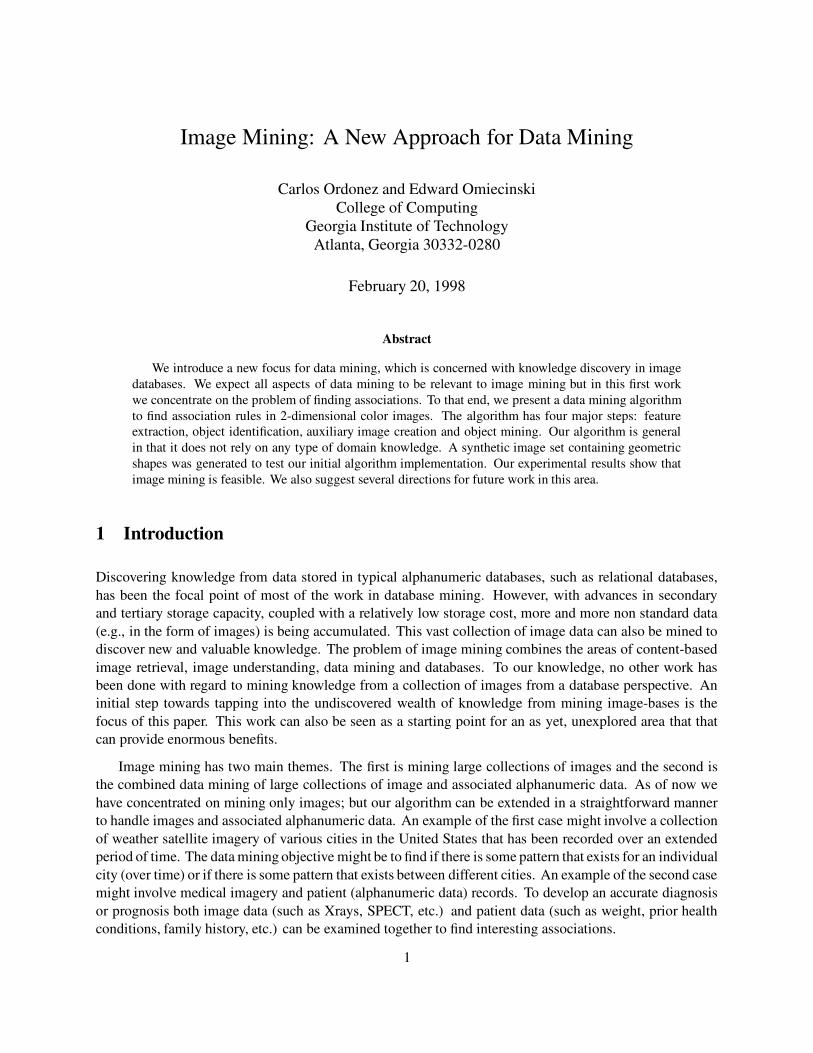
Image Mining: A New Approach for Data Mining
Carlos Ordonez and Edward OmiecinskiCollege of Computing
Georgia Institute of TechnologyAtlanta, Georgia 30332-0280
February 20, 1998
Abstract
We introduce a new focus for data mining, which is concerned with knowledge discovery in imagedatabases. We expect all aspects of data mining to be relevant to image mining but in this first workwe concentrate on the problem of finding associations. To that end, we present a data mining algorithmto find association rules in 2-dimensional color images. The algorithm has four major steps: featureextraction, object identification, auxiliary image creation and object mining. Our algorithm is generalin that it does not rely on any type of domain knowledge. A synthetic image set containing geometricshapes was generated to test our initial algorithm implementation. Our experimental results show thatimage mining is feasible. We also suggest several directions for future work in this area.
1 Introduction
Discovering knowledge from data stored in typical alphanumeric databases, such as relational databases,has been the focal point of most of the work in database mining. However, with advances in secondaryand tertiary storage capacity, coupled with a relatively low storage cost, more and more non standard data(e.g., in the form of images) is being accumulated. This vast collection of image data can also be mined todiscover new and valuable knowledge. The problem of image mining combines the areas of content-basedimage retrieval, image understanding, data mining and databases. To our knowledge, no other work hasbeen done with regard to mining knowledge from a collection of images from a database perspective. Aninitial step towards tapping into the undiscovered wealth of knowledge from mining image-bases is thefocus of this paper. This work can also be seen as a starting point for an as yet, unexplored area that thatcan provide enormous benefits.
Image mining has two main themes. The first is mining large collections of images and the second isthe combined data mining of large collections of image and associated alphanumeric data. As of now wehave concentrated on mining only images; but our algorithm can be extended in a straightforward mannerto handle images and associated alphanumeric data. An example of the first case might involve a collectionof weather satellite imagery of various cities in the United States that has been recorded over an extendedperiod of time. The data mining objective might be to find if there is some pattern that exists for an individualcity (over time) or if there is some pattern that exists between different cities. An example of the second casemight involve medical imagery and patient (alphanumeric data) records. To develop an accurate diagnosisor prognosis both image data (such as Xrays, SPECT, etc.) and patient data (such as weight, prior healthconditions, family history, etc.) can be examined together to find interesting associations.
1
Our data mining system is built on top of a content-based image retrieval system (CBIR), the “Blobworld”system from the University of California at Berkeley (UCB). This CBIR system supports object-based queriesand thus eliminates the need for the manual indexing of image content. This is a major advantage sincemanually indexing massive collections of images is impractical.
2 Applications & Motivation
Applications such as military reconnaissance, weather forcasting, the management of earth’s resources,criminal investigation and medical imaging all require (or will in the near future) the storage and processingof massive collections of images. For instance, NASA’s EOS system generates 1 terabyte of image data perday. To take full advantage of these image-bases and the knowledge they contain, data mining techniqueswill have to be applied. This opens up a new area with new problems (i.e., the area of image mining).
One of the typical data mining problems is to find association rules among data items in a database. Ina retail environment such as a grocery store, an association rule might state that customers who purchasespaghetti and Italian sausage also purchase red wine. This can be determined by examining all the customertransactions (i.e., purchases). In this case, the data is explicit, there is a specific data item for each of the threegrocery items and an individual customer transaction would include a subset of those items and in generala subset of all the items sold by the store. In the case of image-bases, assumming that all the images havebeen manually indexed (or their contents classified) may not be feasible. This presents one major deviation(problem) from the typical data mining approach for numerical data. If images can efficiently be labelled bya semantic descriptor, then the mining can be done on those high level concepts. However, with hundred’sof thousands of images, this will become impossible. An alternative is to rely on automatic/semi-automaticanalysis of the image content and to do the mining on the generated descriptors. For example, color, texture,shape and size can be determined automatically. Objects in an image can be determined by the similarity ofthose attributes.
Consider the sample images shown in Figure 1. The color photographs, although shown in black andwhite, are pictures of different rivers near populated areas. They contain buildings, roads, bridges andwater. Due to the different color and texture of these objects it is possible for an indexing algorithm todetermine distinct objects, although without the semantic label. With a CBIR system it would be possibleto retrieve images that contain similar objects. Hence an image mining system could determine whethercertain objects appear together in enough of the images to make that fact interesting. The association ruleand the supporting images (or a subset thereof) could be returned along with the information as to whatconstitutes the derived objects from the photographs. So for the samples in Figure 1, a computed associationrule might be the following: ��������� 1 determines ��������� 2. The river might be represented by ��������� 1 in thedifferent photographs and the populated area (buildings and roads) by ��������� 2.
3 Content-based Image Retrieval
Content-based image retrieval (CBIR) systems will be needed to effectively and efficiently use large imagedatabases. With a CBIR system, users will be able to retrieve relevant images based on their contents. CBIRresearchers have typically followed two distinct directions [10] based on
modelling the contents of the image as a set of attributes which is produced manually and stored, forexample in a relational database
2
Figure 1: City-River Images from the California Department of Water Resources
using an integrated feature-extraction/object-recognition system.
More recent research has recognized the need to develop a solution that captures the essence of bothdirections. However, there are still differences between the various current approaches. Mainly thedifferences can be categorized in terms of image features extracted, their level of abstraction and the degreeof domain independence. Certainly tradeoffs must be made in building a CBIR system. For example, havingautomatic feature extraction is achieved at the expense of domain independence. Having a high degree ofdomain indepence is achieved by having a semiautomatic (or manual) feature extraction component.
With CBIR systems [10], querying is facilitated through generic query classes. Examples of some queryclasses include color, texture, shape, attributes, text and domain concepts. Color and texture queries allowusers to formulate the description of the images to be retrieved in terms of like color and texture. Queriescan also be posed with regard to the text associated with the images. For instance, in a medical setting,image retrieval is not only based on image content but also on the physician’s diagnosis, treatment, etc. (i.e.,additional textual data). We should also point out that CBIR differs from traditional database systems in thatimages are retrieved based on a degree of similarity and that records are usually retrieved from databasesbecause of exactly matching specified attribute values.
Various content-based retrieval systems (QBIC, Chabot and Photobook) have focused on material-oriented queries and have used low-level image properties (e.g., color and texture) to implement thesequeries. On the other hand, a content-based retrieval system developed at the University of California atBerkeley [3, 5] focuses on object-oriented queries. That is, queries that search for images that containparticular objects. The approach to object recognition at Berkeley is structured around a sequence ofincreasingly specialized grouping activities that produces a “blobworld” representation of an image, whichis a transformation from the raw pixel data to a small set of localized coherent regions in color and textualspace. The “blobworld” representation is based on image segmentation using the Expectation-Maximization
3
algorithm on combined color and texture features.
The salient feature of the Berkeley work is their approach to object recognition. Their approach [3] isbased on the construction of a sequence of successively abstract descriptors through a hierarchy of groupingand learning processes. The image descriptors at a low level are color, texture, contrast, polarity, etc. andthe grouping is based on spatiotemporal coherence of the local descriptors. The central notion in groupingis coherence and four major issues have been identified in [8] which are segmenting images into coherentregions based on integrated region and contour descriptors; fusing color, texture and shape information todescribe primitives; using learning techniques for developing the relationship between object classes andcolor, texture and shape descriptors; and classifying objects based on primitive descriptors and relationshipsbetween primitives.
4 Data Mining
Database mining, an important part of knowledge discovery, is defined as the automated discovery ofpreviously unknown, nontrivial, and potentially useful information from databases. The information is astatement that describes the relationship among a set of objects contained in the database with a certainconfidence such that the statement is in some sense simpler than enumerating all the relationships betweenthe individual instances of objects [9]. For example, in a database of employees and their salaries, eachinstance represents the relationship between an individual employee and his salary. A statement such as“salaries of engineers is higher than the salaries of secretaries,” based on the instances of the database,conveys information that is implicit and interesting than listing the salaries of all engineers and secretaries.Database mining is the process of generating high-level patterns that have acceptable certainty and are alsointeresting from a database of facts.
Knowledge Discovery has been applied effectively to solve many diverse problems. Examples includediscovering rules of mass spectrometry from spectrogram data [4], assessment of credit card applicants [6],discovering rules for query optimization [17, 18], diagnosing diseases from medical data [14], inferring riskprofiles of insurance policy holders [19], and so on.
Knowledge discovery derives much of its success from reasoning techniques in artificial intelligence,expert systems, machine learning and statistics. Many paradigms such as inductive learning [15], Bayesianstatistics [11], mathematical taxonomy [7], etc, have also been applied to knowledge discovery. In general,knowledge discovery is an amalgamation of concepts from diverse fields.
Efficiency is, in general, important for any computational problem. However, for database mining it alsodetermines whether a particular technique can be applied or not. For example, the number of possible waysto cluster � objects into � clusters in unsupervised learning is exponential in � [12]. Hence, an algorithmwhich uses exhaustive search for clustering is impractical for real-world databases. In general any algorithmwhich grows faster than ����� 2 � is unlikely to be useful for large databases. Over the years, database systems,mainly relational, have made great strides in improving efficiency. The success of relational databasesystems in the business community can be attributed to these improvements. Many techniques such as,efficient access methods, buffer management, disk management, etc, are well understood. However, mostof these techniques have been developed for on-line transaction processing (OLTP) applications. The accesspatterns for OLTP applications, which typically access a few hundred records, are considerably differentfrom database mining applications, where entire tables may need to be scanned. One of the challenges indatabase mining is developing more efficient algorithms, better access structures, optimizing disk I/O, andso on.
4

5 Image Mining
There are two major issues that will affect the image data mining process. One is the notion of similaritymatching and the other is the generality of the application area, that is, the breadth of usefulness of datamining from a practical point of view. For a specific application area, associated domain knowledge can beused to improve the data mining task. Since data mining relies on the underlying querying capability of theCBIR system, which is based on similarity matching, user interaction will be necessary to refine the datamining process.
With image mining we will consider the four broad problem areas associated with data mining: findingassociations, classification, sequential patterns and time series patterns. With all of these, the essentialcomponent in image mining is identifying similar objects in different images. With typical basket-marketanalysis, the data is usually constrained to a fixed set of items that are explicitly labelled. It is also quiteefficient to see if a transaction contains a particular item, i.e., requires an examination of the item labelsassociated with a transaction. In some cases the data might be pre-processed into a fixed record formatwhere a field exists for each item in the domain and a Boolean value is associated with it, indicating thepresence or absence of that item in the transaction. This preprocessing can be done automatically. In ageneral image mining setting, having a human label every possible object in a vast collection of images is adaunting task. However, we intend to capitalize on the recent work in CBIR, in particular, Blobworld [8].
As discussed previously, we intend to build our data mining system on top of a content-based imageretrieval system. One premise behind supporting object-based queries in a CBIR system is to eliminate theneed for manual indexing of image content. The CBIR system we will use is from Berkeley [8]. We willrefer to it as the “Blobworld” system. This system produces a “blobworld” representation of each image.A “blob” is just a 2-D ellipse which possesses a number of attributes. An image is made up of a collectionof blobs, usually less than ten. Each blob represents a region of the image which is relatively homogeneouswith respect to color and texture. A blob is described by its color, texture and spatial descriptors. Thedescriptors are represented by multidimensional vectors.
At this point, we will consider in detail, the problem of finding associations. The problem of generatingassociation rules was first introduced in [1] and an algorithm called AIS was proposed for mining allassociation rules. In [13], an algorithm called SETM was proposed to solve this problem using relationaloperations. In [2], two algorithms called Apriori and AprioriTid were proposed. These algorithms achievedsignificant improvements over the previous algorithms. The rule generation process was also extendedto include multiple items in the consequent and an efficient algorithm for generating the rules was alsopresented. In [16], we presented an efficient algorithm for mining association rules that was fundamentallydifferent from prior algorithms. Compared to previous algorithms, our algorithm not only reduced the I/Ooverhead significantly but also had lower CPU overhead for most cases.
These relationships will take the form of rules. An association rule is an implication of the form�������, where
�����! #", and
�!$%�&�('. ) is the set of objects, also referred to as items.
�is called
the antecedent and�
is called the consequent of the rule. In general, a set of items (such as the antecedentor the consequent of a rule) is called an itemset.
Each itemset has an associated measure of statistical significance called support. For an itemset�� *"
,support(
�) = + , if the fraction of records in the database containing
�equals + . A rule has a measure of its
strength called confidence defined as the ratio support(�&,%�
) / support(�
).
The problem of mining association rules is to generate all rules that have support and confidence greaterthan some user specified minimum support and minimum confidence thresholds, respectively. This problem
5
can be decomposed into the following subproblems:
1. All itemsets that have support above the user specified minimum support are generated. These itemsetare called the large itemsets. All others are said to be small.
2. For each large itemset, all the rules that have minimum confidence are generated as follows: for alarge itemset
�and any
�- .�, if support(
�)/support(
�!/#�) 0 minimum confidence, then the
rule�1/2�(�3�4�
is a valid rule.
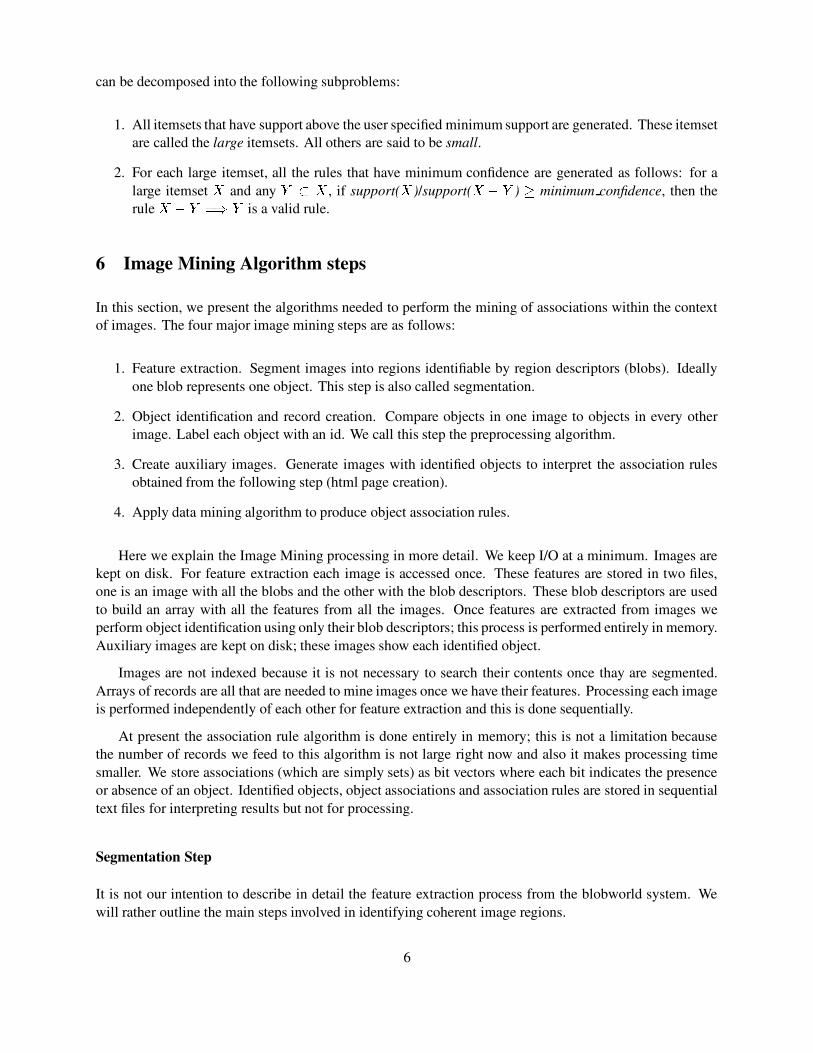
6 Image Mining Algorithm steps
In this section, we present the algorithms needed to perform the mining of associations within the contextof images. The four major image mining steps are as follows:
1. Feature extraction. Segment images into regions identifiable by region descriptors (blobs). Ideallyone blob represents one object. This step is also called segmentation.
2. Object identification and record creation. Compare objects in one image to objects in every otherimage. Label each object with an id. We call this step the preprocessing algorithm.
3. Create auxiliary images. Generate images with identified objects to interpret the association rulesobtained from the following step (html page creation).
4. Apply data mining algorithm to produce object association rules.
Here we explain the Image Mining processing in more detail. We keep I/O at a minimum. Images arekept on disk. For feature extraction each image is accessed once. These features are stored in two files,one is an image with all the blobs and the other with the blob descriptors. These blob descriptors are usedto build an array with all the features from all the images. Once features are extracted from images weperform object identification using only their blob descriptors; this process is performed entirely in memory.Auxiliary images are kept on disk; these images show each identified object.
Images are not indexed because it is not necessary to search their contents once thay are segmented.Arrays of records are all that are needed to mine images once we have their features. Processing each imageis performed independently of each other for feature extraction and this is done sequentially.
At present the association rule algorithm is done entirely in memory; this is not a limitation becausethe number of records we feed to this algorithm is not large right now and also it makes processing timesmaller. We store associations (which are simply sets) as bit vectors where each bit indicates the presenceor absence of an object. Identified objects, object associations and association rules are stored in sequentialtext files for interpreting results but not for processing.
Segmentation Step
It is not our intention to describe in detail the feature extraction process from the blobworld system. Wewill rather outline the main steps involved in identifying coherent image regions.
6
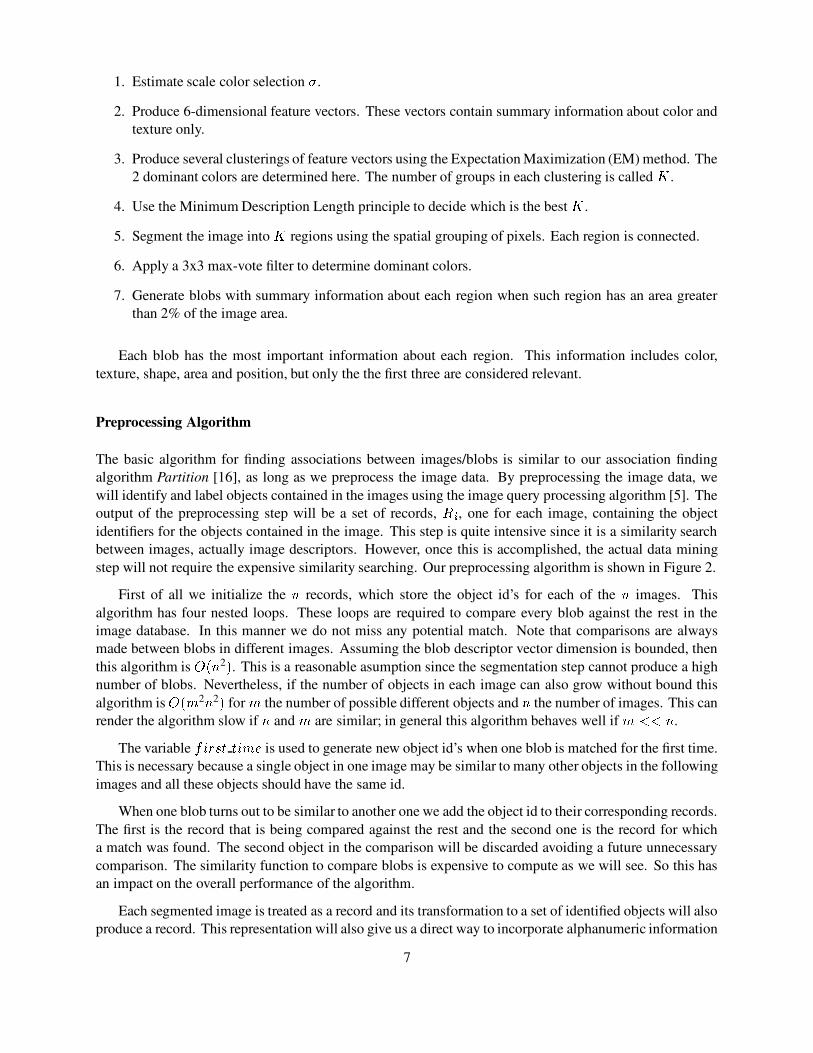
1. Estimate scale color selection 5 .
2. Produce 6-dimensional feature vectors. These vectors contain summary information about color andtexture only.
3. Produce several clusterings of feature vectors using the Expectation Maximization (EM) method. The2 dominant colors are determined here. The number of groups in each clustering is called 6 .
4. Use the Minimum Description Length principle to decide which is the best 6 .
5. Segment the image into 6 regions using the spatial grouping of pixels. Each region is connected.
6. Apply a 3x3 max-vote filter to determine dominant colors.
7. Generate blobs with summary information about each region when such region has an area greaterthan 2% of the image area.
Each blob has the most important information about each region. This information includes color,texture, shape, area and position, but only the the first three are considered relevant.
Preprocessing Algorithm
The basic algorithm for finding associations between images/blobs is similar to our association findingalgorithm Partition [16], as long as we preprocess the image data. By preprocessing the image data, wewill identify and label objects contained in the images using the image query processing algorithm [5]. Theoutput of the preprocessing step will be a set of records, 798 , one for each image, containing the objectidentifiers for the objects contained in the image. This step is quite intensive since it is a similarity searchbetween images, actually image descriptors. However, once this is accomplished, the actual data miningstep will not require the expensive similarity searching. Our preprocessing algorithm is shown in Figure 2.
First of all we initialize the � records, which store the object id’s for each of the � images. Thisalgorithm has four nested loops. These loops are required to compare every blob against the rest in theimage database. In this manner we do not miss any potential match. Note that comparisons are alwaysmade between blobs in different images. Assuming the blob descriptor vector dimension is bounded, thenthis algorithm is �:��� 2 � . This is a reasonable asumption since the segmentation step cannot produce a highnumber of blobs. Nevertheless, if the number of objects in each image can also grow without bound thisalgorithm is �:��� 2 � 2 � for � the number of possible different objects and � the number of images. This canrender the algorithm slow if � and � are similar; in general this algorithm behaves well if �<;=;>� .
The variable ?�@BA�+ @C� � is used to generate new object id’s when one blob is matched for the first time.This is necessary because a single object in one image may be similar to many other objects in the followingimages and all these objects should have the same id.
When one blob turns out to be similar to another one we add the object id to their corresponding records.The first is the record that is being compared against the rest and the second one is the record for whicha match was found. The second object in the comparison will be discarded avoiding a future unnecessarycomparison. The similarity function to compare blobs is expensive to compute as we will see. So this hasan impact on the overall performance of the algorithm.
Each segmented image is treated as a record and its transformation to a set of identified objects will alsoproduce a record. This representation will also give us a direct way to incorporate alphanumeric information
7

INPUT: D segmented images, EGF 1 H F 2 HJIIIBH F�K�L ,where FNM is a record containing: an image id and a blob descriptor vector O�POUTPUT: Set of D records, ERQ 1 H Q 2 HIJII�H QSKTL containing the object identifiers for the blobs
UWV QYX 1 Z 1 []\SD=^ VQ M 1 Z _`Wa ^ UbV Q�\ROCcedfC[ XgP Z 0UWV QYX 1 Z 1 h V D9i 1 ^ VUbV Q%c 1 Z 1 h V*j Xlk�d�mgF M I OnPpoq Xlr j [ []Xlstd Z []rRuTdUWV Q�X 2 Z X 1 v 1 h V DF U F M 2 I O�Pw 2 X j D�\n[xstye[]f�zTdJP|{�d�[xh~} `WaF U*j XlstX��gy�r�mgF M 1 I OnPJw 1 H F M 2 I O�Pw 2 H j XlstX��gy�rRX�[]{ []zTrRd j z�\�lP H j []ypD�P�y�rRP P�d��Xlye[]Xg\RD�o�h~} `WaF U q Xgr j [ []Xlstd%h~} `Wa\ROCc�dJfC[ XlP Z \ROCc�dfC[ XgP v 1q Xlr j [ []Xlstd Z q y�� j d`ba ^=F UQSM 1 Z QSM 1 � E�\ROCc�dJf][ XlPWLQSM 2 Z QSM 2 � E�\ROCc�dJf][ XlPWL� y�rR�WF M 2 I O�Pw 2 y j s�ye[]f�z�dP`Wa ^=F U`Wa ^=F U`Wa ^ UWV Q� y�rR�WF M 1 I O�Pw 1 y j s�yR[]fnz�dPWX q []z�drRd��~y j \RD�d�stye[]f�z=ye[��gdy j [`ba ^ UWV Q`Wa ^ UbV QU X���[]dr~\Ru�[3u�D��SypD�[]dP~s�ye[]f�z�dPW\ROCc�dfC[ j
Figure 2: Preprocessing Algorithm
8

associated with the image into the image mining process. The algorithm can handle such informationwithout modification, provided those additional attributes are treated as boolean values.
Similarity Function
The similarity function [5] between two blobs is essential for our image mining program. This function takesfour parameters, the two blobs to be compared, a similarity threshold and a vector of standard deviations.The similarity function is mathematically defined as:
+�@B��@C����A�@ �� � ���~�C���g�����J�l�C���g�¡ �� 1 ¢ �l�¡ �� 2 £2�
where
¤ @B+ �T� �R� � � � ��� 1� � � ��� 2
� �(¥ � � � ��� 1/ � � ��� 2
�N¦ Σ � 1 � � � ��� 1/ � � ��� 2
�]§ 1 ¨ 2 ©In these formulas � � ��� 1 and � � ��� 2 are vectors containing summary features and Σ � 1 represents the vector
containing the standard deviations allowed for matching on each desired feature. The/
1 power means wedivide each distance by the corresponding entry of this vector; this is clarified in Figure 3. This similaritymeasure is 1 if there is a perfect match on all desired features and approaches zero as the match becomesworse. A low similarity can mean every object is similar to any other object.
It is important to note that the distance for color is computed in a special manner. Colors are stored asthree coordinates for a point located in a color-cone, referred as the hue saturation value (hsv). The distanceis computed as the minimum pairwise distance of the two dominant colors of the object. Each color is a pointin 3-dimensional space affecting its third coordinate by a weight of 0.5 and leaving the first two unchanged.This is computed as a matrix product between the color vector and the weights. This distance constitutesthe first entry of the difference vector. For all the remaining 10 features the distance is just computed as thedifference between each blob entry.
The standard deviation vector permits adjusting parameters for the image mining process to use ordiscard features in an easy way. If we want to pay close attention to one specific feature we set the standarddeviation to a value close to zero, but never zero. If we do not consider some feature to be relevant tothe mining process we set the standard deviation to a high value. For some of the features the blobworldsystem requires standard deviations to be in specific ranges. More specifically standard deviations for color,anisotropy, and contrast require standard deviations at a maximum value of roughly 0.5. For area at most0.1 is permitted. For all the remaining features any positive standard deviation is legal. If some feature isconsidered as completely irrelevant an infinity value is assigned to the corresponding entry.
A more detailed description of the similarity function between two blobs is given in Figure 3.
Auxiliary Image Creation
Here we talk about the auxiliary image creation step. It is important to mention that this step is necessary inorder for the user to make sense out of the image mining results. We use a web browser as the tool to havean integrated view of images, image features (blobs), object ids, associations, and association rules.
The association rules are of the form:
9

F a«ª¬ h : OnP 1 H O�P 2 H j XlstX��gy�rRX�[]{ []z�rRd j zT\�gP H j []y�D�P�y�rRP P�dJ��Xgye[]Xl\RDV¬ h ª®¬ h : 1q \RrSy¯s�ye[]f�z H 0 \n[]zTdJrR�SX j d
P 11 Z mlO��g\RO 1 I f�\RD�d 1 i°O��g\RO 2 I f�\RD�d 1 o²±~³ 1 1 0 I 5´P 22 Z mlO��g\RO 1 I f�\RD�d 2 i°O��g\RO 2 I f�\RD�d 2 o²±~³ 1 1 0 I 5´P 1 Z¶µ P 11 µ²v ypO j µ P 22 µP 12 Z mgON�g\RO 1 I f�\RD�d 1 i:ON�g\RO 2 I f�\RD�d 2 o�±~³ 1 1 0 I 5´P 21 Z mgON�g\RO 1 I f�\RD�d 2 i:ON�g\RO 2 I f�\RD�d 1 o�±~³ 1 1 0 I 5´P 2 Z y�O j µ P 12 µ�v ypO j µ P 21 µP�X j [ 1 Z stXlD�mgP 1 H P 2 oP�X j [ 2:11 Z O��g\RO 1 I q dJye[]uTrRd j i&O��g\RO 2 I q dJye[]uTrRd jj f�\RrRd Z d·�¸²m�i 0 I 5 ± j¹ rn[Jm Σ11M»º 1 mCmgP�X j [ M�¼ j []ypD�P�y�rRP P�d��Xlye[]Xg\RD M o 2 oCo�orRdN[]u�rRD j f�\RrRd*½ Z j Xgs�X¾�lyprRX»[]{ []z�rRd j zT\�gP
Figure 3: Similarity function
¿ @ ¤ 1� @ ¤ 2 À � ¿ @ ¤ 3 À � +�Á�Âà� A �¶�
%� �R� ��?�@ ¤ � � �R� �¶�
%
For each image we show the original image with all the geometric shapes and then one blob image permatched blob. Ideally, each blob should correspond to one shape but this did not always happen as we willdiscuss. Each of of the blobs is labeled with the object id generated by the preprocessing algorithm. Theseare the id’s that appear in the rule. Right now this step is somewhat slow because it involves generating oneimage per matched blob, but this process is done only once if the image mining program is run several timesover the same image set. And also, this step is alleviated by the fact that unmatched blobs are not displayedand thus no image for them is generated.
After showing all the images there are two links to view the association text file and the association ruletext file generated by the previous step. These files contain all the associations and rules as well as statisticalinformation that help the user interpret and verify the correctness of the experimental results.
Example
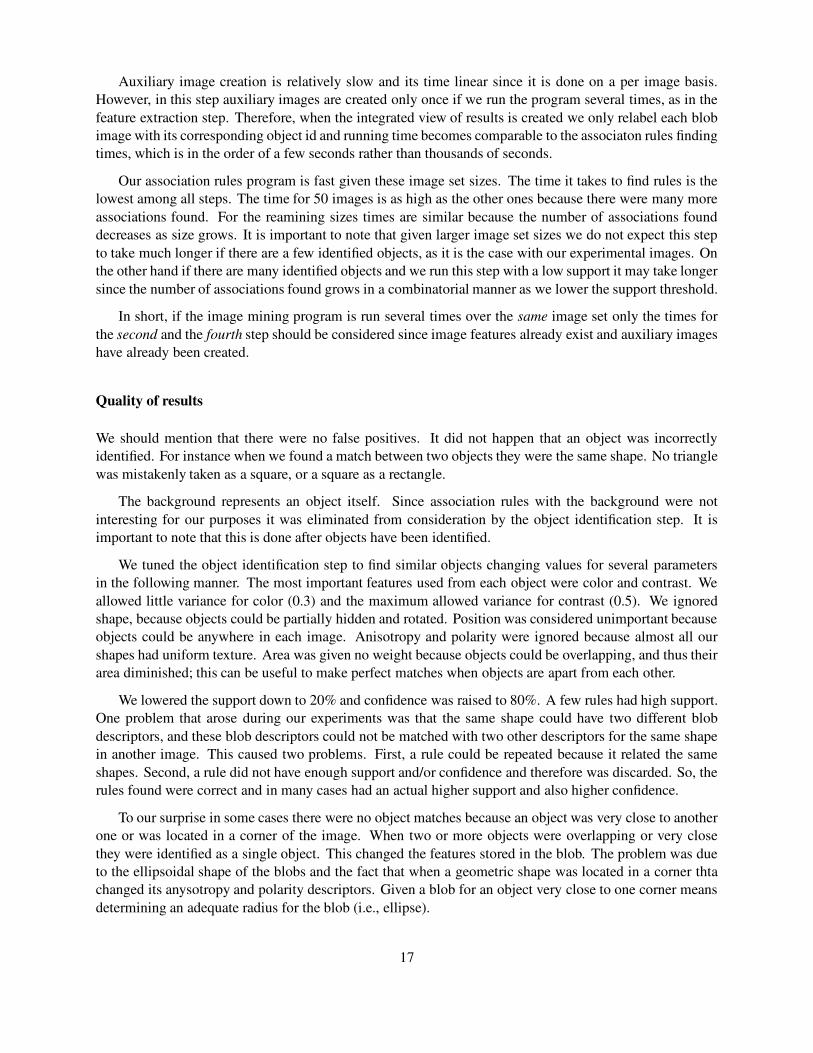
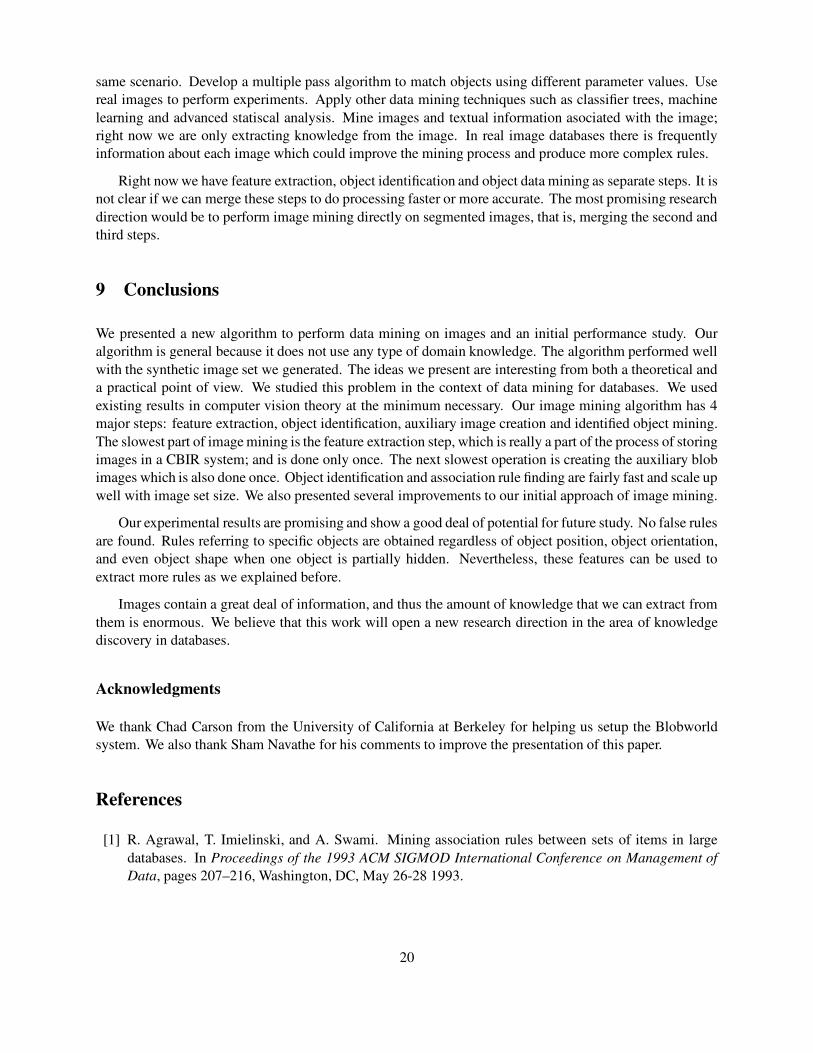
At this point we show a simple example illustrating how our image mining algorithms work with � � 10.The original images and their corresponding blobs are shown on Figure 4 and Figure 5. Association rulescorresponding to the identified objects are shown on Figure 6. We chose 10 representative images from theimage set we created for our experiments. This set of synthetic images is explained in detail in the nextsection.
In Figures 4 and 5 we show the original image at the left with several geoemetric shapes and whitebackground. These images are labeled with an image id. These images are the only input data for ourprogram; no domain knowledge is used. Then we show a series of blob images, each containing oneblob. These images are labeled with the id obtained in the preprocessing algorithm. Each blob has a close(most times equal) position to its corresponding geometric shape. There are some cases in which one blobcorresponds to several geometric shapes. For instance in image 013 object 2 corresponds to the triangle andobject 3 corresponds to the circle. In image 131 object 4 corresponds to all the shapes in the image.
As parameters for object identification we set color standard deviation to 0.29 and contrast standard
10

deviation to 0.5. We tuned these parameters after several experiments. The remaining parameters did notimprove object identification for this set of synthetic images so their values were set to infinity.
The data mining algorithm was run with a 20% support and 70% confidence. The output is a set ofassociation rules whose support and confidence are above these thresholds.
The 66 rules obtained by the program are shown on Figure 6. Let us analyze some of these rules. Thefirst rule
¿3 À � ¿
2 À means that if there is circle in the image then there is also a triangle. In fact with thesesimple images, there was never a circle without a triangle. In this case the rule actually has a higher supportand a higher confidence than that obtained by the program (50% and 83 % respectively). This happenedbecause the circle had two different object identifiers: 3 and 7. The rule
¿2�3�5 À � ¿
8 À says if there is acircle, a triangle and an hexagon then there is also a square. Once again images containing the first threeshapes always contained the square. Another interesting rule is
¿3�11 À � ¿
2 À . In this case the rule saysthat if there are a circle and an ellipse then there is also a triangle; once again the rule is valid; note that thisrule has a low support.
It important to note that several incorrect or useless blob matches such as 9, 10, 13, 14, 16 are filteredout by the 30% support. That is the case for images 029, 108, 119, 131 and 144. There are no rules thatinvolve these identified objects (matched blobs).
11
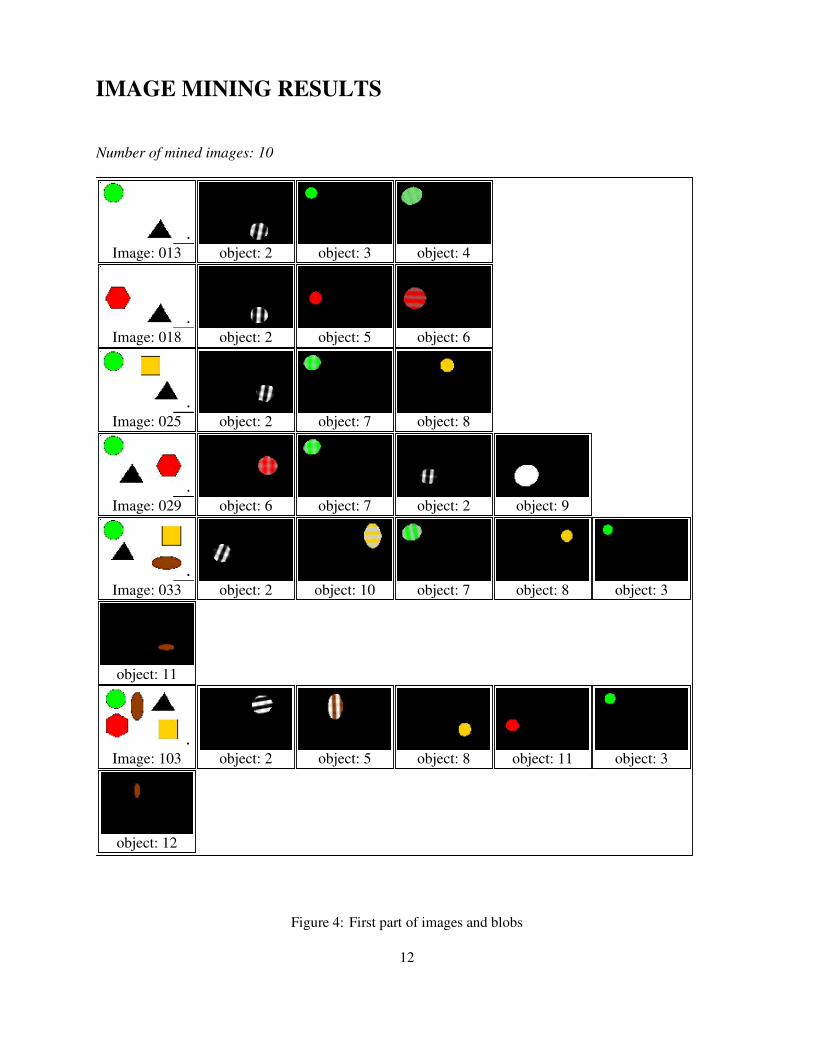
IMAGE MINING RESULTS
Number of mined images: 10
Image: 013 object: 2 object: 3 object: 4
Image: 018 object: 2 object: 5 object: 6
Image: 025 object: 2 object: 7 object: 8
Image: 029 object: 6 object: 7 object: 2 object: 9
Image: 033 object: 2 object: 10 object: 7 object: 8 object: 3
object: 11
Image: 103 object: 2 object: 5 object: 8 object: 11 object: 3
object: 12
Figure 4: First part of images and blobs
12
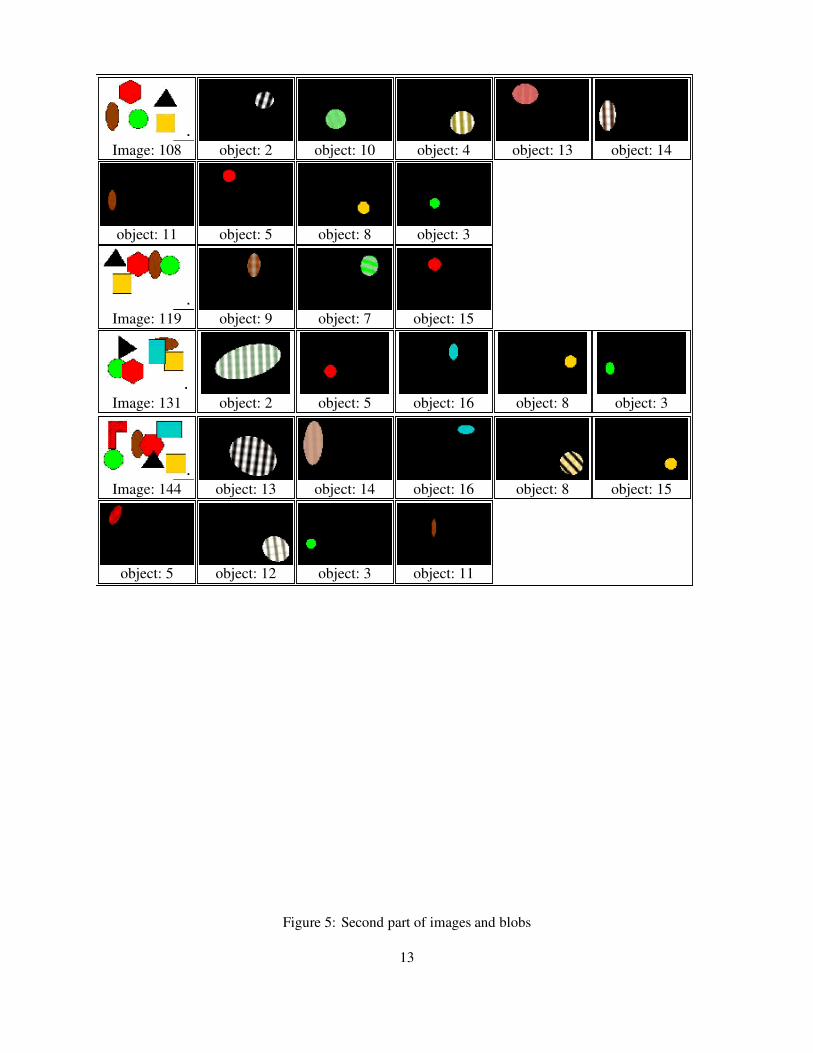
Image: 108 object: 2 object: 10 object: 4 object: 13 object: 14
object: 11 object: 5 object: 8 object: 3
Image: 119 object: 9 object: 7 object: 15
Image: 131 object: 2 object: 5 object: 16 object: 8 object: 3
Image: 144 object: 13 object: 14 object: 16 object: 8 object: 15
object: 5 object: 12 object: 3 object: 11
Figure 5: Second part of images and blobs
13

RULES GENERATED
Parameters:Support: 20%Confidence: 70%Number of records: 10Number of associations: 30
{3} => {2} s= 50%, c= 83% {3} => {8} s= 50%, c= 83%{5} => {2} s= 40%, c= 80% {5} => {3} s= 40%, c= 80%{5} => {8} s= 40%, c= 80% {5} => {3,8} s= 40%, c= 80%{7} => {2} s= 30%, c= 75% {8} => {2} s= 50%, c= 83%{8} => {3} s= 50%, c= 83% {11} => {2} s= 30%, c= 75%{11} => {3} s= 40%, c=100% {11} => {5} s= 30%, c= 75%{11} => {8} s= 40%, c=100% {11} => {2,3} s= 30%, c= 75%{11} => {2,8} s= 30%, c= 75% {11} => {3,5} s= 30%, c= 75%{11} => {3,8} s= 40%, c=100% {11} => {5,8} s= 30%, c= 75%{11} => {3,5,8} s= 30%, c= 75% {11} => {2,3,8} s= 30%, c= 75%{2,3} => {8} s= 40%, c= 80% {2,5} => {3} s= 30%, c= 75%{2,5} => {8} s= 30%, c= 75% {2,5} => {3,8} s= 30%, c= 75%{2,8} => {3} s= 40%, c= 80% {2,11} => {3} s= 30%, c=100%{2,11} => {8} s= 30%, c=100% {2,11} => {3,8} s= 30%, c=100%{3,5} => {2} s= 30%, c= 75% {3,5} => {8} s= 40%, c=100%{3,5} => {11} s= 30%, c= 75% {3,5} => {2,8} s= 30%, c= 75%{3,5} => {8,11} s= 30%, c= 75% {3,8} => {2} s= 40%, c= 80%{3,8} => {5} s= 40%, c= 80% {3,8} => {11} s= 40%, c= 80%{3,11} => {2} s= 30%, c= 75% {3,11} => {5} s= 30%, c= 75%{3,11} => {8} s= 40%, c=100% {3,11} => {2,8} s= 30%, c= 75%{3,11} => {5,8} s= 30%, c= 75% {5,8} => {2} s= 30%, c= 75%{5,8} => {3} s= 40%, c=100% {5,8} => {11} s= 30%, c= 75%{5,8} => {2,3} s= 30%, c= 75% {5,8} => {3,11} s= 30%, c= 75%{5,11} => {3} s= 30%, c=100% {5,11} => {8} s= 30%, c=100%{5,11} => {3,8} s= 30%, c=100% {8,11} => {2} s= 30%, c= 75%{8,11} => {3} s= 40%, c=100% {8,11} => {5} s= 30%, c= 75%{8,11} => {2,3} s= 30%, c= 75% {8,11} => {3,5} s= 30%, c= 75%{2,8,11} => {3} s= 30%, c=100% {3,8,11} => {2} s= 30%, c= 75%{3,8,11} => {5} s= 30%, c= 75% {5,8,11} => {3} s= 30%, c=100%{3,5,11} => {8} s= 30%, c=100% {2,5,8} => {3} s= 30%, c=100%{3,5,8} => {2} s= 30%, c= 75% {3,5,8} => {11} s= 30%, c= 75%{2,3,11} => {8} s= 30%, c=100% {2,3,8} => {5} s= 30%, c= 75%{2,3,8} => {11} s= 30%, c= 75% {2,3,5} => {8} s= 30%, c=100%
Number of rules generated: 66
Figure 6: Association rules for identified objects
14

Range Content000-009 1 shape010-019 2 shapes020-029 3 shapes030-049 4 shapes100-109 5 shapes not overlapping without rectangle and L110-119 5 shapes with some overlapping shapes120-129 6 shapes not overlapping without L130-139 6 shapes with some overlapping shapes140-149 7 shapes
Table 1: Image Content
7 Experimental Results
Synthetic Image Generation
To test our image mining algorithm we created synthetic images. We used synthetic images as a startingpoint in showing the feasibility of mining images. Also, with our constrained image set, we can more readilydetermine the weaknesses and strengths of our approach. These images are 192x128 color JPEG formatbecause the Blobworld software from UCB needed this specific size. It is important to note that this formatuses a lossy compression scheme and thus image quality is deteriorated. This was not a problem for oursynthetic images, but it may be a problem for images with rich information content, such as photographs.
Our images contain a combination of plain geometric shapes. The seven shapes for our experimentswere: triangle, circle, square, rectangle, hexagon, ellipse and an irregular shape similar to the letter L.Each of the shapes had a different uniform color and a black border. The background was always white.The texture for each shape was uniform with one exception, the irregular shape. For technical reasons twoadditional little objects were added to two opposing corners of each image to delimit its size. These littleobjects are ignored by the feature extraction step because it discards objects whose area does not representmore than 2% of the total image area.
Each geometric shape has the same size and color in each image where it appears. All shapes have asimilar size with respect to each other. However, their position and orientation can differ between images.To make the mining process more interesting, in some cases we overlapped shapes or placed them veryclose to each other so they would seem to be part of the same object by the segmentation algorithm.
With the guidelines mentioned above we manually generated 100 basic images and we replicated ordeleted some or all of these images to obtain larger or smaller image sets for our experiments. In Table 1we show summary information for the images we created. We partitioned images into classes according totheir content complexity. Image id’s below 100 indicate easy to mine images and image id’s greater than100 mean difficult images, that is, images with complex content. In the easy images we have no more than4 shapes plus the background. Shapes are in different positions but they are not close to each other and theyare not overlapping either. For difficult images we have up to 7 shapes plus the background. In this caseshapes overlap and also may be close to each other. This certainly makes the image mining process moredifficult as we shall see.
15
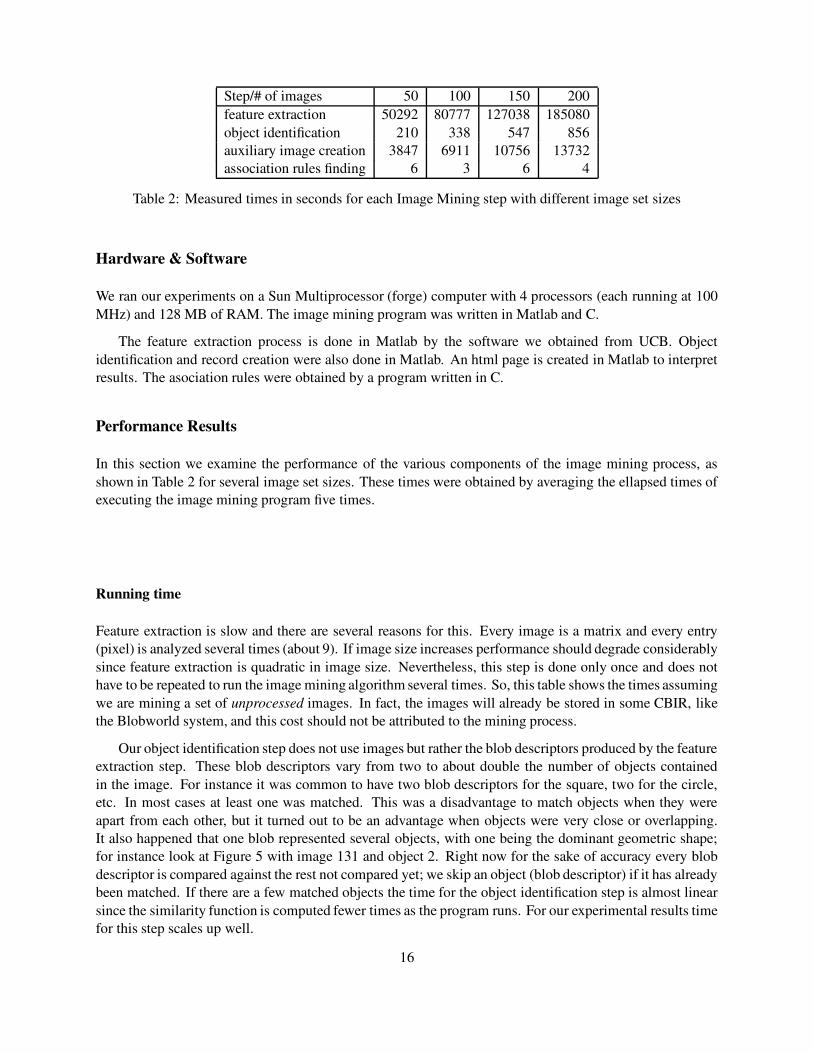
Step/# of images 50 100 150 200feature extraction 50292 80777 127038 185080object identification 210 338 547 856auxiliary image creation 3847 6911 10756 13732association rules finding 6 3 6 4
Table 2: Measured times in seconds for each Image Mining step with different image set sizes
Hardware & Software
We ran our experiments on a Sun Multiprocessor (forge) computer with 4 processors (each running at 100MHz) and 128 MB of RAM. The image mining program was written in Matlab and C.
The feature extraction process is done in Matlab by the software we obtained from UCB. Objectidentification and record creation were also done in Matlab. An html page is created in Matlab to interpretresults. The asociation rules were obtained by a program written in C.
Performance Results
In this section we examine the performance of the various components of the image mining process, asshown in Table 2 for several image set sizes. These times were obtained by averaging the ellapsed times ofexecuting the image mining program five times.
Running time
Feature extraction is slow and there are several reasons for this. Every image is a matrix and every entry(pixel) is analyzed several times (about 9). If image size increases performance should degrade considerablysince feature extraction is quadratic in image size. Nevertheless, this step is done only once and does nothave to be repeated to run the image mining algorithm several times. So, this table shows the times assumingwe are mining a set of unprocessed images. In fact, the images will already be stored in some CBIR, likethe Blobworld system, and this cost should not be attributed to the mining process.
Our object identification step does not use images but rather the blob descriptors produced by the featureextraction step. These blob descriptors vary from two to about double the number of objects containedin the image. For instance it was common to have two blob descriptors for the square, two for the circle,etc. In most cases at least one was matched. This was a disadvantage to match objects when they wereapart from each other, but it turned out to be an advantage when objects were very close or overlapping.It also happened that one blob represented several objects, with one being the dominant geometric shape;for instance look at Figure 5 with image 131 and object 2. Right now for the sake of accuracy every blobdescriptor is compared against the rest not compared yet; we skip an object (blob descriptor) if it has alreadybeen matched. If there are a few matched objects the time for the object identification step is almost linearsince the similarity function is computed fewer times as the program runs. For our experimental results timefor this step scales up well.
16
Auxiliary image creation is relatively slow and its time linear since it is done on a per image basis.However, in this step auxiliary images are created only once if we run the program several times, as in thefeature extraction step. Therefore, when the integrated view of results is created we only relabel each blobimage with its corresponding object id and running time becomes comparable to the associaton rules findingtimes, which is in the order of a few seconds rather than thousands of seconds.
Our association rules program is fast given these image set sizes. The time it takes to find rules is thelowest among all steps. The time for 50 images is as high as the other ones because there were many moreassociations found. For the reamining sizes times are similar because the number of associations founddecreases as size grows. It is important to note that given larger image set sizes we do not expect this stepto take much longer if there are a few identified objects, as it is the case with our experimental images. Onthe other hand if there are many identified objects and we run this step with a low support it may take longersince the number of associations found grows in a combinatorial manner as we lower the support threshold.
In short, if the image mining program is run several times over the same image set only the times forthe second and the fourth step should be considered since image features already exist and auxiliary imageshave already been created.
Quality of results
We should mention that there were no false positives. It did not happen that an object was incorrectlyidentified. For instance when we found a match between two objects they were the same shape. No trianglewas mistakenly taken as a square, or a square as a rectangle.
The background represents an object itself. Since association rules with the background were notinteresting for our purposes it was eliminated from consideration by the object identification step. It isimportant to note that this is done after objects have been identified.
We tuned the object identification step to find similar objects changing values for several parametersin the following manner. The most important features used from each object were color and contrast. Weallowed little variance for color (0.3) and the maximum allowed variance for contrast (0.5). We ignoredshape, because objects could be partially hidden and rotated. Position was considered unimportant becauseobjects could be anywhere in each image. Anisotropy and polarity were ignored because almost all ourshapes had uniform texture. Area was given no weight because objects could be overlapping, and thus theirarea diminished; this can be useful to make perfect matches when objects are apart from each other.
We lowered the support down to 20% and confidence was raised to 80%. A few rules had high support.One problem that arose during our experiments was that the same shape could have two different blobdescriptors, and these blob descriptors could not be matched with two other descriptors for the same shapein another image. This caused two problems. First, a rule could be repeated because it related the sameshapes. Second, a rule did not have enough support and/or confidence and therefore was discarded. So, therules found were correct and in many cases had an actual higher support and also higher confidence.
To our surprise in some cases there were no object matches because an object was very close to anotherone or was located in a corner of the image. When two or more objects were overlapping or very closethey were identified as a single object. This changed the features stored in the blob. The problem was dueto the ellipsoidal shape of the blobs and the fact that when a geometric shape was located in a corner thtachanged its anysotropy and polarity descriptors. Given a blob for an object very close to one corner meansdetermining an adequate radius for the blob (i.e., ellipse).
17

Regular shapes such as the triangle, square and hexagon were easily matched across images. This is adirect consequence of the circular blob representation produced when the image is segmented. In this caseneither position nor rotation affect the mining process at all. It was surprising that in some cases there wereno matches for the circle; in these cases it was in a corner or some other shape was very close or overlapping.Another important aspect about shape is that we do not use it as a parameter to mine images, but shape playsan important role during the segmentation step. So, shape does affect the image mining results quality.
The rectangle and the ellipse are the next shapes that are easily matched even though we did not use theshape feature. The most complicated shape was the L. In this case a number of factors affected matches.When this shape was overlapped with other shapes a few matches were found because a big blob wasgenerated. Also, orientation changed dominant colors and contrast. When the L was close to another shapeits colors were merged making it dissimilar to other L shaped objects. This suggests that irregular shapes ingeneral make image mining difficult.
We worked with color images but it is also possible to use black and white images. Color and texturewere important in mining the geometric shapes we created. However, we ignored shape as mentioned above.Shape may be more important for black and white images but more accurate shape descriptors, than thoseprovided by the blobs.
8 Future Work
Results obtained so far look promising but we need to improve several aspects in our research effort. Weare currently working on the following tasks. This list may look comprehensive but it is the result of theassessment of our initial implementation and experimental results. These tasks are sorted by difficulty. Westart with the easiest ones, ending with longer term goals.
We need to incorporate objects in different sizes. This does not seem a difficult thing to try since we relyon color and texture to match objects, Object sizes should represent at least 2% of the image are in order tobe considered by the feature extraction step.
We are in the process of improving auxiliary image generation to treat blob descriptors and blobsthemselves just as internal information and display object identifiers (oid’s) directly on each image; thismakes result interpretation easier and this process faster since only one image is generated. As explainedbefore we have displayed one image per blob as produced by the Berkeley system. The drawback of thislatter approach is that we require human intervention to interpret the discovered rules.
Images of different size and resolution will be analyzed. This looks like a complex problem because ofa variety of reasons. First, if we try to mine photographs information content is in general very high and itis likely we should try to use some type of domain knowledge. Second, since images are treated as matricesperformance will always be an issue. Higher resolution means slower feature extraction and possibly moreidentified objects. On the other hand, lower resolution images have faster feature extraction, but provideless knowledge to be discovered. Right now, we re depending on the constrainst of the Blobworld system.
We also need to analyze images with repeated geometric shapes. If we want to obtain simple associationrules this can make our program more general. This can be done without further modification to what isworking. However, if we want to mine for more specific rules then we would need to modify our algorithm.For instance, we could try to get rules like the following: if there are two rectangles and one square then weare likely to find three triangles. The issues are the combinatorial growth of all the possibilities to mine andalso a more complex type of condition. We will also study more deeply the problem of mining images with
18

more complex shapes such as the irregular one similar to the letter L.
We need a systematic approach to determine an optimal similarity threshold or at least a close one. Avery high threshold means only perfect matches are accepted. On the other hand, a very low similaritythreshold may mean any object is similar to any other object. Finding the right similarity threshold for eachimage type looks like an interesting problem. Right now it is provided by the user but it can be changed tobe tuned by the algorithm itself. Also, there are many ways to tune the eleven parameters to match blobsand the optimal tuning may be specific to image type.
There also exists the possibilityof using other segmentation algorithms that could perform faster or betterfeature extraction. It is important to note that these algorithms should give a means to compare segmentedregions and provide suitable parameters to perform object matching in order to be useful for image mining.From our experimental results it is clear that this step is a bottleneck for the overall performance of imagemining.
We can change the object identification algorithms to generate overlapping object associations usingmore features. Our algorithm currently generates partititons of objects, that is, if one object is consideredsimilar to another one, the latter one will not be compared again. By generating overlapping associationswe can find even more rules. For instance a red rectangular object may be considered similar to anotherrectangular object and at the same time be similar to another red object. Mining by position is also possible;for instance two objects in a certain position may imply another object to be in some other position. Sincethe software we are using for feature extraction produces eleven parameters to describe blobs we have 211
possibilites to match objects.
We need to minimize I/O for large collections of images. Having 200 images represents a small imagedatabase used in real life. We intend to extend our algorithm to handle arbitrary collections of images.Suitable buffering capabilities would be needed for our modified version of the image mining process. Anapproach could be to process blob descriptors by pairs of blocks to minimize disk access. This would requiremajor modifications for our object identification algorithm since independent object id’s could be generatedfor the same object. A straightforward extension of the same algorithm is discarded since disk access wouldbe �:��� 2 � and this number does not scale up for heavy disk access.
If the image set grows considerably it may be advisable to use image indexing and buffering to makeretrieval faster. An image can be indexed in a variety of ways. By id, by color, by texture, by size, by shape,etc. And also, each parameter in the standard deviation vector is a floating point problem. So, there aremany ways to find the best match between objects. This looks like an NP-hard problem in � , the number ofimages.
Other directions for future research include using parallel processing applied to some steps of the process.This includes using partitioning or even pipelining techniques to accelerate image processing. The problembecomes more complex if we try to mine images stored in different computers in a distributed fashion.Parallel processing for feature extraction is straightrforward since each image is processed independently.However, parallel processing of object identification is an interesting problem if we also want to minimizedisk access as mentioned above.
We can perform incremental mining when a few images are added to an already mined image set. Thepossibility of reusing work performed in one image to save work in another image when image contents arevery similar is an option. However, this could imply using domain knowledge rendering the algorithm lessgeneral.
We can incorporate a time dimension to associations and rules when there are historical images on the
19
same scenario. Develop a multiple pass algorithm to match objects using different parameter values. Usereal images to perform experiments. Apply other data mining techniques such as classifier trees, machinelearning and advanced statiscal analysis. Mine images and textual information asociated with the image;right now we are only extracting knowledge from the image. In real image databases there is frequentlyinformation about each image which could improve the mining process and produce more complex rules.
Right now we have feature extraction, object identification and object data mining as separate steps. It isnot clear if we can merge these steps to do processing faster or more accurate. The most promising researchdirection would be to perform image mining directly on segmented images, that is, merging the second andthird steps.
9 Conclusions
We presented a new algorithm to perform data mining on images and an initial performance study. Ouralgorithm is general because it does not use any type of domain knowledge. The algorithm performed wellwith the synthetic image set we generated. The ideas we present are interesting from both a theoretical anda practical point of view. We studied this problem in the context of data mining for databases. We usedexisting results in computer vision theory at the minimum necessary. Our image mining algorithm has 4major steps: feature extraction, object identification, auxiliary image creation and identified object mining.The slowest part of image mining is the feature extraction step, which is really a part of the process of storingimages in a CBIR system; and is done only once. The next slowest operation is creating the auxiliary blobimages which is also done once. Object identification and association rule finding are fairly fast and scale upwell with image set size. We also presented several improvements to our initial approach of image mining.
Our experimental results are promising and show a good deal of potential for future study. No false rulesare found. Rules referring to specific objects are obtained regardless of object position, object orientation,and even object shape when one object is partially hidden. Nevertheless, these features can be used toextract more rules as we explained before.
Images contain a great deal of information, and thus the amount of knowledge that we can extract fromthem is enormous. We believe that this work will open a new research direction in the area of knowledgediscovery in databases.
Acknowledgments
We thank Chad Carson from the University of California at Berkeley for helping us setup the Blobworldsystem. We also thank Sham Navathe for his comments to improve the presentation of this paper.
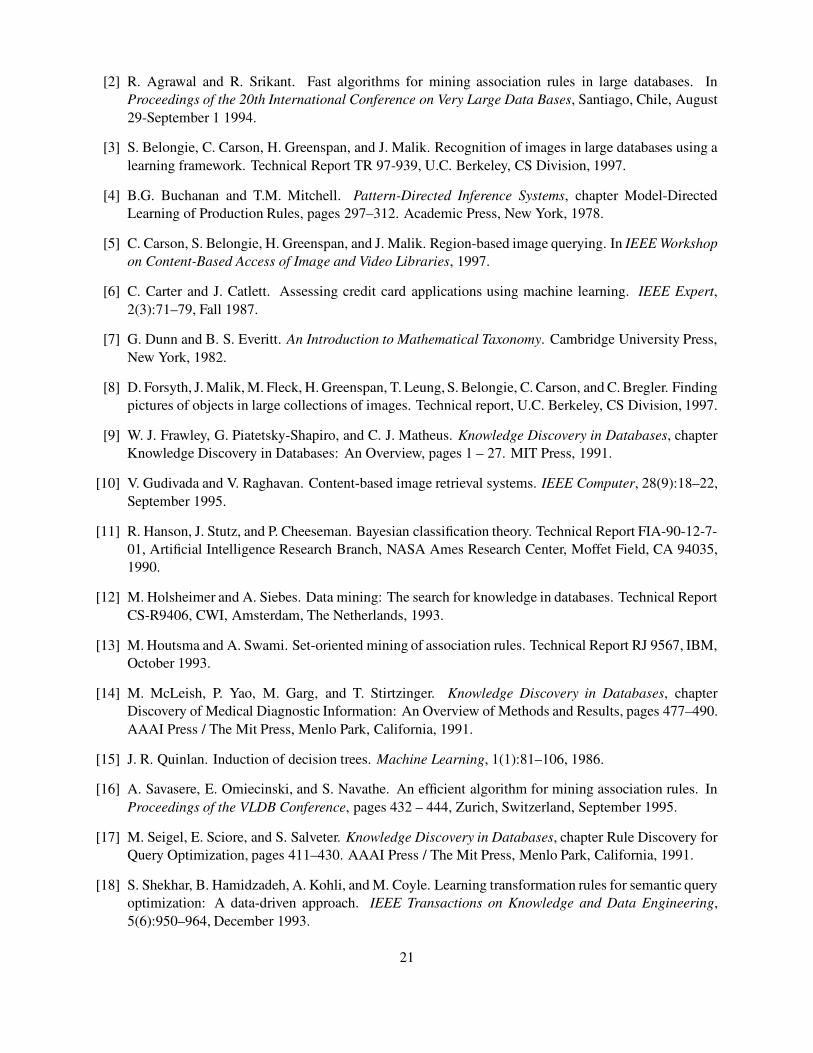
References
[1] R. Agrawal, T. Imielinski, and A. Swami. Mining association rules between sets of items in largedatabases. In Proceedings of the 1993 ACM SIGMOD International Conference on Management ofData, pages 207–216, Washington, DC, May 26-28 1993.
20
[2] R. Agrawal and R. Srikant. Fast algorithms for mining association rules in large databases. InProceedings of the 20th International Conference on Very Large Data Bases, Santiago, Chile, August29-September 1 1994.
[3] S. Belongie, C. Carson, H. Greenspan, and J. Malik. Recognition of images in large databases using alearning framework. Technical Report TR 97-939, U.C. Berkeley, CS Division, 1997.
[4] B.G. Buchanan and T.M. Mitchell. Pattern-Directed Inference Systems, chapter Model-DirectedLearning of Production Rules, pages 297–312. Academic Press, New York, 1978.
[5] C. Carson, S. Belongie, H. Greenspan, and J. Malik. Region-based image querying. In IEEE Workshopon Content-Based Access of Image and Video Libraries, 1997.
[6] C. Carter and J. Catlett. Assessing credit card applications using machine learning. IEEE Expert,2(3):71–79, Fall 1987.
[7] G. Dunn and B. S. Everitt. An Introduction to Mathematical Taxonomy. Cambridge University Press,New York, 1982.
[8] D. Forsyth, J. Malik, M. Fleck, H. Greenspan, T. Leung, S. Belongie, C. Carson, and C. Bregler. Findingpictures of objects in large collections of images. Technical report, U.C. Berkeley, CS Division, 1997.
[9] W. J. Frawley, G. Piatetsky-Shapiro, and C. J. Matheus. Knowledge Discovery in Databases, chapterKnowledge Discovery in Databases: An Overview, pages 1 – 27. MIT Press, 1991.
[10] V. Gudivada and V. Raghavan. Content-based image retrieval systems. IEEE Computer, 28(9):18–22,September 1995.
[11] R. Hanson, J. Stutz, and P. Cheeseman. Bayesian classification theory. Technical Report FIA-90-12-7-01, Artificial Intelligence Research Branch, NASA Ames Research Center, Moffet Field, CA 94035,1990.
[12] M. Holsheimer and A. Siebes. Data mining: The search for knowledge in databases. Technical ReportCS-R9406, CWI, Amsterdam, The Netherlands, 1993.
[13] M. Houtsma and A. Swami. Set-oriented mining of association rules. Technical Report RJ 9567, IBM,October 1993.
[14] M. McLeish, P. Yao, M. Garg, and T. Stirtzinger. Knowledge Discovery in Databases, chapterDiscovery of Medical Diagnostic Information: An Overview of Methods and Results, pages 477–490.AAAI Press / The Mit Press, Menlo Park, California, 1991.
[15] J. R. Quinlan. Induction of decision trees. Machine Learning, 1(1):81–106, 1986.
[16] A. Savasere, E. Omiecinski, and S. Navathe. An efficient algorithm for mining association rules. InProceedings of the VLDB Conference, pages 432 – 444, Zurich, Switzerland, September 1995.
[17] M. Seigel, E. Sciore, and S. Salveter. Knowledge Discovery in Databases, chapter Rule Discovery forQuery Optimization, pages 411–430. AAAI Press / The Mit Press, Menlo Park, California, 1991.
[18] S. Shekhar, B. Hamidzadeh, A. Kohli, and M. Coyle. Learning transformation rules for semantic queryoptimization: A data-driven approach. IEEE Transactions on Knowledge and Data Engineering,5(6):950–964, December 1993.
21

[19] A. Siebes. Homogeneous discoveries contain no surprises: Inferring risk-profiles from large databases.Technical Report CS-R9430, CWI, Amsterdam, The Netherlands, 1994.
22