image guidance of breast cancer surgery using 3-d ... · image guidance of breast cancer surgery...
TRANSCRIPT

IEEE TRANSACTIONS ON MEDICAL IMAGING, VOL. 17, NO. 5, OCTOBER 1998 681
Image Guidance of Breast Cancer Surgery Using3-D Ultrasound Images and Augmented
Reality VisualizationYoshinobu Sato,*Member, IEEE, Masahiko Nakamoto, Yasuhiro Tamaki, Toshihiko Sasama,
Isao Sakita, Yoshikazu Nakajima, Morito Monden, and Shinichi Tamura,Member, IEEE
Abstract—This paper describes augmented reality visualizationfor the guidance of breast-conservative cancer surgery usingultrasonic images acquired in the operating room just before sur-gical resection. By combining an optical three-dimensional (3-D)position sensor, the position and orientation of each ultrasoniccross section are precisely measured to reconstruct geometricallyaccurate 3-D tumor models from the acquired ultrasonic images.Similarly, the 3-D position and orientation of a video camera areobtained to integrate video and ultrasonic images in a geometri-cally accurate manner. Superimposing the 3-D tumor models ontolive video images of the patient’s breast enables the surgeon toperceive the exact 3-D position of the tumor, including irregularcancer invasions which cannot be perceived by touch, as if it werevisible through the breast skin. Using the resultant visualization,the surgeon can determine the region for surgical resection in amore objective and accurate manner, thereby minimizing the riskof a relapse and maximizing breast conservation. The system wasshown to be effective in experiments using phantom and clinicaldata.
Index Terms—Augmented reality, breast cancer, breast-con-servative therapy, computer-assisted surgery, optical 3-D sensor,ultrasound imaging.
I. INTRODUCTION
W ITH breast-conservative surgery for breast cancer be-coming common, one important problem has arisen;
how the region for surgical resection should be determined [1],[2]. The best compromise needs to be made between minimiz-ing the risk of a relapse and maximizing breast conservation.Our aim is to employ computer guidance to ascertain this.
Since the breasts of east Asian women are relatively small,in our country the surgeon usually localizes the cancer by
Manuscript received March 4, 1998; revised June 23, 1998 The AssociateEditor responsible for coordinating the review of this paper and recommendingits publication was M. Viergever.Asterisk indicates corresponding author.
*Y. Sato is with Division of Functional Diagnostic Imaging, BiomedicalResearch Center, Osaka University Medical School, Suita, Osaka 565-0871Japan (e-mail: [email protected]).
M. Nakamoto, T. Sasama, and Y. Nakajima were with the Division of Func-tional Diagnostic Imaging, Biomedical Research Center, Osaka UniversityMedical School, Suita, Osaka 565-0871 Japan. They are now with InformationTechnology R & D Center, Mitsubishi Electric Corp., Kamakura, Kanagawa247-8501 Japan.
Y. Tamaki, I. Sakita, and M. Monden are with Department of Surgery II,Osaka University Medical School, Suita, Osaka 565-0871 Japan.
S. Tamura is with the Division of Functional Diagnostic Imaging, Biomedi-cal Research Center, Osaka University Medical School, Suita, Osaka 565-0871Japan.
Publisher Item Identifier S 0278-0062(98)08750-3.
touch, determining and tracing on the breast skin the regionfor surgical removal. However, cancers often spread alonglactiferous ducts (intraductal spread) or in other tissues inan irregular manner, which cannot easily be perceived bytouch. As an alternative, MR [3] or ultrasonic [4], [5] imagingcan be used to detect irregular invasions of cancers suchas intraductal spread. Clinically, it is highly important todetermine the region for surgical resection by considering thethree-dimensional (3-D) extent of the irregular invasions [1],[2], which is currently judged intuitively by the surgeon onthe basis of ultrasonic or preoperative MR images. To allowthe surgeon to perceive the situation in a more objective anddirect manner, our system provides guidance by visualizingthe 3-D extent of the tumors in the form of 3-D modelsreconstructed from ultrasonic images, which are superimposedusing augmented reality techniques onto live video images ofthe patient in the operating room.
Computer guidance for breast cancer surgery is technicallychallenging because the breast is a nonrigid organ that candiffer in shape depending on the patient’s posture. To provideaccurate guidance, 3-D models of the tumor need to bereconstructed from images taken with the patient in the sameposition as when the region for surgical resection is determinedand traced on the breast skin. Because of its portability andreal-time nature, ultrasonic imaging is particularly suitablefor imaging in the operating room just before the region forremoval is traced. We use an optical 3-D position sensor inorder to add accurate spatial information to ultrasonic crosssections. Then, using the ultrasonic intracross section sequencewith the 3-D information obtained, we reconstruct geometri-cally accurate 3-D tumor models. In addition, we measure the3-D position and orientation of a video camera to accuratelyintegrate the video and ultrasonic images. Superimposing these3-D models onto live video images enables the surgeon toperceive the exact 3-D shape of the tumor as if it were visiblethrough the breast skin.
The organization of the paper is as follows: In Section II,we briefly refer to related work and identify the distinctivefeatures of our system. In Section III, we formulate the cameraand ultrasound calibration procedures using an optical 3-Dsensor, and describe the interactive segmentation tool for 3-Dtumor reconstruction from ultrasonic images. In Section IV,we present details of the calibration procedures and the results
0278–0062/98$10.00 1998 IEEE
682 IEEE TRANSACTIONS ON MEDICAL IMAGING, VOL. 17, NO. 5, OCTOBER 1998
(a) (b)
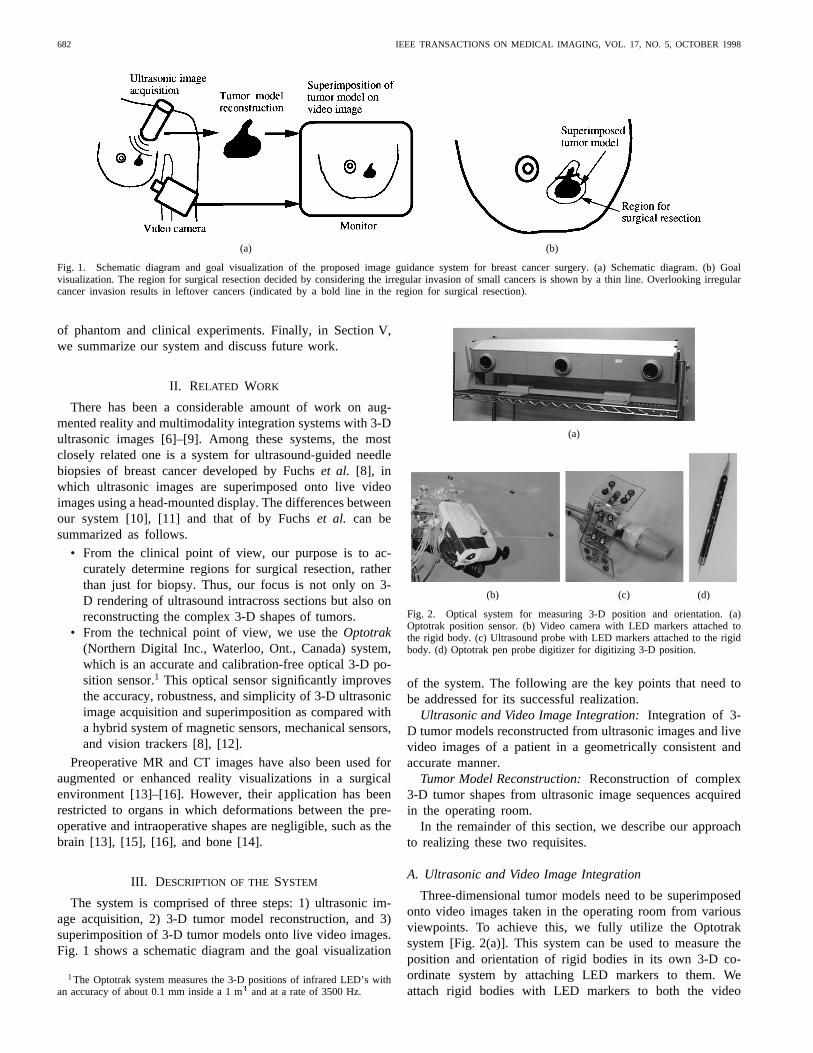
Fig. 1. Schematic diagram and goal visualization of the proposed image guidance system for breast cancer surgery. (a) Schematic diagram. (b) Goalvisualization. The region for surgical resection decided by considering the irregular invasion of small cancers is shown by a thin line. Overlookingirregularcancer invasion results in leftover cancers (indicated by a bold line in the region for surgical resection).
of phantom and clinical experiments. Finally, in Section V,we summarize our system and discuss future work.
II. RELATED WORK
There has been a considerable amount of work on aug-mented reality and multimodality integration systems with 3-Dultrasonic images [6]–[9]. Among these systems, the mostclosely related one is a system for ultrasound-guided needlebiopsies of breast cancer developed by Fuchset al. [8], inwhich ultrasonic images are superimposed onto live videoimages using a head-mounted display. The differences betweenour system [10], [11] and that of by Fuchset al. can besummarized as follows.
• From the clinical point of view, our purpose is to ac-curately determine regions for surgical resection, ratherthan just for biopsy. Thus, our focus is not only on 3-D rendering of ultrasound intracross sections but also onreconstructing the complex 3-D shapes of tumors.
• From the technical point of view, we use theOptotrak(Northern Digital Inc., Waterloo, Ont., Canada) system,which is an accurate and calibration-free optical 3-D po-sition sensor.1 This optical sensor significantly improvesthe accuracy, robustness, and simplicity of 3-D ultrasonicimage acquisition and superimposition as compared witha hybrid system of magnetic sensors, mechanical sensors,and vision trackers [8], [12].
Preoperative MR and CT images have also been used foraugmented or enhanced reality visualizations in a surgicalenvironment [13]–[16]. However, their application has beenrestricted to organs in which deformations between the pre-operative and intraoperative shapes are negligible, such as thebrain [13], [15], [16], and bone [14].
III. D ESCRIPTION OF THESYSTEM
The system is comprised of three steps: 1) ultrasonic im-age acquisition, 2) 3-D tumor model reconstruction, and 3)superimposition of 3-D tumor models onto live video images.Fig. 1 shows a schematic diagram and the goal visualization
1The Optotrak system measures the 3-D positions of infrared LED’s withan accuracy of about 0.1 mm inside a 1 m3 and at a rate of 3500 Hz.
(a)
(b) (c) (d)
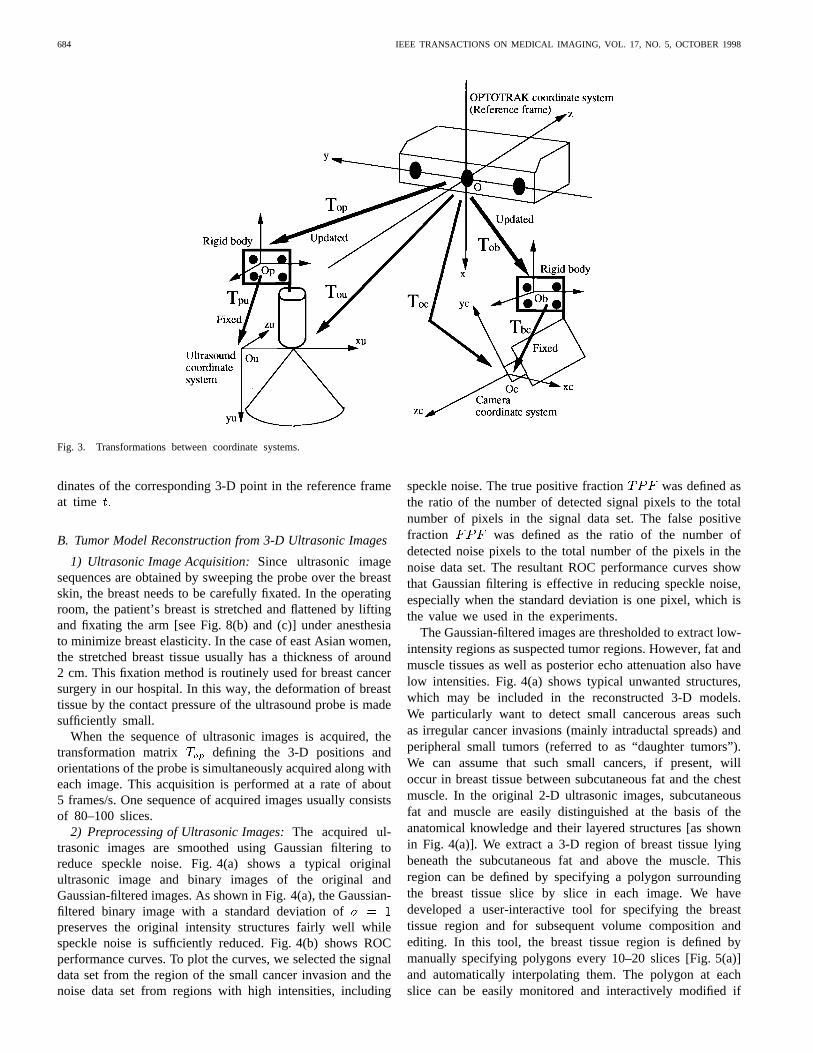
Fig. 2. Optical system for measuring 3-D position and orientation. (a)Optotrak position sensor. (b) Video camera with LED markers attached tothe rigid body. (c) Ultrasound probe with LED markers attached to the rigidbody. (d) Optotrak pen probe digitizer for digitizing 3-D position.
of the system. The following are the key points that need tobe addressed for its successful realization.
Ultrasonic and Video Image Integration:Integration of 3-D tumor models reconstructed from ultrasonic images and livevideo images of a patient in a geometrically consistent andaccurate manner.
Tumor Model Reconstruction:Reconstruction of complex3-D tumor shapes from ultrasonic image sequences acquiredin the operating room.
In the remainder of this section, we describe our approachto realizing these two requisites.
A. Ultrasonic and Video Image Integration
Three-dimensional tumor models need to be superimposedonto video images taken in the operating room from variousviewpoints. To achieve this, we fully utilize the Optotraksystem [Fig. 2(a)]. This system can be used to measure theposition and orientation of rigid bodies in its own 3-D co-ordinate system by attaching LED markers to them. Weattach rigid bodies with LED markers to both the video

SATO et al.: IMAGE GUIDANCE OF BREAST CANCER SURGERY 683
camera [Fig. 2(b)] and the ultrasound probe [Fig. 2(c)] tomeasure their 3-D positions and orientations. The Optotraksystem can be also used as an accurate 3-D digitizer incombination with a special pen probe in which 24 markersare embedded [Fig. 2(d)]. We regard the Optotrak coordinatesystem as a fixed reference frame (world coordinate system).All the processes can be unified into this fixed referenceframe in a geometrically consistent and accurate manner,including camera and ultrasound calibration, 3-D ultrasonicimage acquisition, and camera tracking. A basic assumptionwith regard to the spatial arrangements is that the patient’sbreast is kept in the same shape and position in the Optotrakcoordinate system from the beginning of ultrasonic imageacquisition to the end of video camera image acquisition, thatis, to the final augmented visualization. Thus, the Optotrakcamera array and the patient’s breast need to be fixated duringthis period. The field of view of our Optotrak system includesa 1 1 1 m volume whose center is at a distance of 2.25 mfrom the center of the Optotrak camera array. The ultrasoundprobe, video camera, and pen probe can be tracked withinthis volume as long as the LED markers attached to them arevisible to the camera array. In an accuracy evaluation test,the RMS error of the Optotrak pen probe was about 0.3 mmwithin this volume. The accuracy of 3-D localization of theultrasound probe and video camera are evaluated in detail inSection IV.
1) Camera Calibration: Let be a row vector representingthe 3-D coordinates of any visible point in a fixed referenceframe (the Optotrak coordinate system in this case), and let
represent the coordinates of the same point in a camera-centered coordinate system. Let and be homogeneouscoordinates of and respectively. The relationship between
and is given by
(1)
where is a 4 4 transformation matrix defining the cameraorientation and position. Let be the two-dimensional (2-D)coordinates of the corresponding pixel of in the cameraimage. The relationship between, , and is given by
(2)
where is a perspective projection defined by the internalcamera parameters, including the focal length and imagecenter. Given a sufficient number of control points whose3-D coordinates in the reference frame and 2-D coordinates
of the projections onto the camera image are known,and can be estimated by an algorithm based on a
closed-form solution [17]. (We used the distortion-free cameramodel described in [17] for in the experiments.) TheOptotrak pen probe digitizer is used to acquire the 3-Dcoordinates of the control points in the reference frame.Let be a transformation matrix defining the orientationand position of the rigid body attached to the camera.can be measured using the Optotrak system when imagesfor calibration are obtained from the camera. Let bethe transformation from the rigid body coordinates to thecamera coordinates. By combining and we have
and are fixed parameters inherentin the camera with LED’s attached to its rigid body, whoseestimation is exactly the purpose of the camera calibrationprocedure. This calibration procedure can be performed in thesame manner as conventional camera calibration except thatthe rigid body with LED markers needs to be set so as to bemeasurable by the Optotrak system. The right part of Fig. 3illustrates the transformations described above.
and are used for the superimposition of 3-D modelsonto video images in a geometrically consistent manner.Let be the transformation, at time representingthe orientation and position of the rigid body attached tothe camera in the operating room. By combining the fixedparameters and with the updated parameterwe have the projection equation
(3)
where represents the 2-D coordinates in the camera imageat time and the homogeneous coordinates of any 3-Dpoint in the reference frame.
2) Ultrasound Calibration: Let be the 3-D coordinatesof any point in the reference frame, and letbe the 2-D coordinates of the corresponding pixel ofin theultrasonic image. Further, we let be Let and
be homogeneous coordinates ofand respectively.The relationship between and is
(4)
where is a transformation matrix defining isotropic scalingwhere only one scale parameter,is involved, and is atransformation matrix defining the orientation and position ofthe ultrasound intracross section. Given a sufficient number ofcontrol points whose 3-D coordinatesin the reference frameand 2-D coordinates in the ultrasonic image are known,and can be estimated. The pen probe digitizer is also usedhere to give the 3-D coordinates of the control points in thereference frame. Let be a transformation matrix definingthe orientation and position of the rigid body attached to theultrasound probe. can be measured using the Optotraksystem when the ultrasonic images for the calibration areobtained. Let be the transformation from the ultrasonicimage coordinates to the rigid body coordinates. By combining
and we have and arefixed parameters inherent in the ultrasound probe with LED’sattached to the rigid body, whose estimation is exactly thepurpose of the ultrasound calibration procedure. The left partof Fig. 3 illustrates the above transformations.
and are used for the accurate determination of3-D coordinates in the reference frame of each pixel in theultrasonic images. Let be the transformation, at time
representing the orientation and position of the rigid bodyattached to the ultrasound probe. By combining the fixedparameters and with the updated parameterwe have the equation
(5)
where represents the homogeneous coordinates of theultrasound pixel at time and the homogeneous coor-
684 IEEE TRANSACTIONS ON MEDICAL IMAGING, VOL. 17, NO. 5, OCTOBER 1998
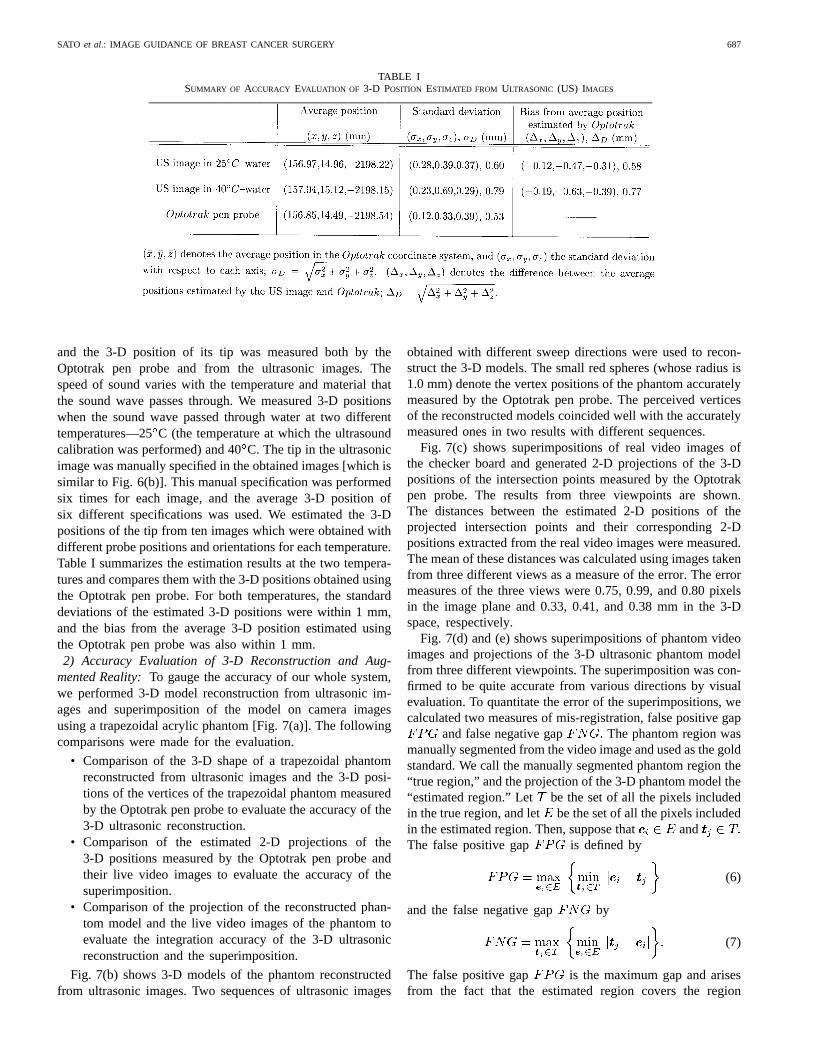
Fig. 3. Transformations between coordinate systems.
dinates of the corresponding 3-D point in the reference frameat time
B. Tumor Model Reconstruction from 3-D Ultrasonic Images
1) Ultrasonic Image Acquisition:Since ultrasonic imagesequences are obtained by sweeping the probe over the breastskin, the breast needs to be carefully fixated. In the operatingroom, the patient’s breast is stretched and flattened by liftingand fixating the arm [see Fig. 8(b) and (c)] under anesthesiato minimize breast elasticity. In the case of east Asian women,the stretched breast tissue usually has a thickness of around2 cm. This fixation method is routinely used for breast cancersurgery in our hospital. In this way, the deformation of breasttissue by the contact pressure of the ultrasound probe is madesufficiently small.
When the sequence of ultrasonic images is acquired, thetransformation matrix defining the 3-D positions andorientations of the probe is simultaneously acquired along witheach image. This acquisition is performed at a rate of about5 frames/s. One sequence of acquired images usually consistsof 80–100 slices.
2) Preprocessing of Ultrasonic Images:The acquired ul-trasonic images are smoothed using Gaussian filtering toreduce speckle noise. Fig. 4(a) shows a typical originalultrasonic image and binary images of the original andGaussian-filtered images. As shown in Fig. 4(a), the Gaussian-filtered binary image with a standard deviation ofpreserves the original intensity structures fairly well whilespeckle noise is sufficiently reduced. Fig. 4(b) shows ROCperformance curves. To plot the curves, we selected the signaldata set from the region of the small cancer invasion and thenoise data set from regions with high intensities, including
speckle noise. The true positive fraction was defined asthe ratio of the number of detected signal pixels to the totalnumber of pixels in the signal data set. The false positivefraction was defined as the ratio of the number ofdetected noise pixels to the total number of the pixels in thenoise data set. The resultant ROC performance curves showthat Gaussian filtering is effective in reducing speckle noise,especially when the standard deviation is one pixel, which isthe value we used in the experiments.
The Gaussian-filtered images are thresholded to extract low-intensity regions as suspected tumor regions. However, fat andmuscle tissues as well as posterior echo attenuation also havelow intensities. Fig. 4(a) shows typical unwanted structures,which may be included in the reconstructed 3-D models.We particularly want to detect small cancerous areas suchas irregular cancer invasions (mainly intraductal spreads) andperipheral small tumors (referred to as “daughter tumors”).We can assume that such small cancers, if present, willoccur in breast tissue between subcutaneous fat and the chestmuscle. In the original 2-D ultrasonic images, subcutaneousfat and muscle are easily distinguished at the basis of theanatomical knowledge and their layered structures [as shownin Fig. 4(a)]. We extract a 3-D region of breast tissue lyingbeneath the subcutaneous fat and above the muscle. Thisregion can be defined by specifying a polygon surroundingthe breast tissue slice by slice in each image. We havedeveloped a user-interactive tool for specifying the breasttissue region and for subsequent volume composition andediting. In this tool, the breast tissue region is defined bymanually specifying polygons every 10–20 slices [Fig. 5(a)]and automatically interpolating them. The polygon at eachslice can be easily monitored and interactively modified if

SATO et al.: IMAGE GUIDANCE OF BREAST CANCER SURGERY 685
(a) (b)
Fig. 4. Typical ultrasonic image of breast and effect of Gaussian filtering on tumor detection. (a) Original ultrasonic image and binary images. Upperleft: Original image. The arrow indicates the main tumor. The arrowhead denotes a cancer invasion, which was confirmed by pathological findings.Subcutaneous fat (double arrowheads), muscle (double arrows), and posterior echo attenuation (long arrow) are also shown. Upper right: Binary imageof original image. Lower left: Binary image of Gaussian-filtered image (� = 1:0). Lower right: Binary image of Gaussian-filtered image (� = 2:0). (b)ROC performance curves. The true positive and false positive fractions were plotted for the original and Gaussian-filtered images using different valuesof standard deviation (� = 1:0; 2:0) when the threshold value was varied.
necessary. Because subcutaneous fat and muscle are layered,we can fully utilize the continuity along the slice direction.Specification of the breast tissue region using our tool is quiteefficient.
3) Volume Composition and Editing:The volume to besurgically resected is defined by the volume generated bysweeping the region marked on the breast skin [as shownin Fig. 1(b)] in an anterior–posterior (front-to-back) directionfrom the breast skin to the chest muscle. Reconstructed 3-Dtumor models are useful for ascertaining the distribution ofthe cancer and determining the region for resection on thebreast skin. Since we have the 3-D position of each pixel ofthe ultrasonic cross-sectional images, geometrically correct3-D tumor models can be reconstructed based on thesecross-sectional images.
A volume of regular grids with a 256 256 256 matrix iscomposed from the Gaussian-filtered original images in whichthe breast tissue region is extracted. We prepare an emptyvolume and then fill it with each image of the sequence. Thesize and position of the volume is adaptively determined sothat all the pixels of the sequence are within the volume. Thesize of the volume is usually about 1010 10 cm The 3-Dcoordinates of each pixel of the images are obtained using (5).We assign each pixel value of the Gaussian-filtered images tothe voxel nearest to the obtained 3-D coordinates. If this voxelhas already been assigned a value, it is reassigned the smallerof the old and new values—this is because the tumor is darkerthan the surrounding structures, and the selection of the smallervalue minimizes the overlooking of tumor components. Thisvolume composition is performed as a batch process.
Tumor regions are extracted from the constructed volume.Minimum intensity projection (MIP) images are created andused to select a volume of interest (VOI) roughly constrainingthe tumor regions. Usually, MIP images clearly depict the maintumor. Suspicious areas found in original images are marked[Fig. 5(a)] and displayed at the corresponding 3-D positionsin the MIP image [Fig. 5(b)]. The VOI is carefully selected,
allowing a sufficient margin from the main tumor so as toinclude not only the main tumor itself but also any irregularinvasions and/or daughter tumors which may be invisible inthe MIP images.
Candidate tumor regions are extracted by thresholding thesubvolume trimmed using the VOI. The threshold value isselected interactively [Fig. 5(c)]. Connectivity analysis, suchas extracting the largest connected component, can be furthercombined to refine the tumor models if necessary. The spatialcorrespondence relations between the original images and thereconstructed 3-D model can easily be confirmed by displayingthe 3-D position in the model corresponding to specified 2-Dposition in the original images, thereby providing the surgeonwith both 3-D shape and 2-D intensity information. The ex-tracted tumor regions are surface-rendered and superimposedonto video images using (3).
IV. EXPERIMENTS
The system was implemented on a Sun Ultra2 Creator 3-Dworkstation (Sun Microsystems, Mountain View, CA, USA).We used an Aloka SSD–2000 with a 10 MHz annular arraymechanical sector probe (Aloka, Tokyo, Japan) for ultrasonicimage acquisition, which is suitable for capturing subtle inten-sity variations of breast tumors with high resolution. A Sunvideo camera (Sun Microsystems) was used for video imageacquisition. The ultrasonic and video images were digitizedas a 320 240 matrix using a Sunvideo Sbus card (SunMicrosystems).
A. Ultrasound and Camera Calibration
1) Ultrasound Calibration:A specially shaped board was designed for the ultrasound
calibration [Fig. 6(a)]. This was placed under water, and anultrasound probe was positioned over the calibration boardsuch that the ultrasonic intracross section was completely co-incident with the plane of the board. The ultrasonic image wasthen acquired [Fig. 6(b)], with the ultrasound beam focused at

686 IEEE TRANSACTIONS ON MEDICAL IMAGING, VOL. 17, NO. 5, OCTOBER 1998
(a) (b) (c)
Fig. 5. Interactive tool for volume editing of 3-D tumor models from ultrasonic images. (a) Defining breast tissue regions (encircled by square-shaped controlpoints connected with white line segments) and marking suspected cancerous areas (white points). (b) Specification of the VOI. The suspected cancerous areasmarked in the original image are shown in the MIP image. (c) 3-D model reconstruction with interactive adjustment of threshold values.
(a) (b)
(c) (d)
Fig. 6. Ultrasound and camera calibration. (a) Board used for ultrasoundcalibration. The three tips (shown by arrows) are used as the control points ofthe calibration procedure. (b) Ultrasonic image of ultrasound calibration board.The 2-D positions of the tips are specified in this image. (c) Digitization oftip of ultrasound calibration board using Optotrak pen probe. (d) Cameracalibration. The 25 intersection points on the checker board at each of fourdepths, that is, 100 points, were used as the control points.
a depth of around 1.5 cm. The three tips of the board wereeasily localized in the acquired ultrasonic image and their 2-Dcoordinates (from which in (4) was obtained) were specifiedmanually. The 3-D positions of these three tips in the referenceframe [ in (4)] were also measured using the Optotrak penprobe [Fig. 6(c)]. Using and of the three control points,
and were estimated based on (4) (see Appendix A).The transformation defining the position and orientationof the rigid body in the reference frame was obtained at thesame time as the image acquisition.
2) Camera Calibration: A checker board was used to ob-tain the images for camera calibration, with each intersectionon the board being used as a control point. The checker boardplane was positioned so as to be nearly parallel to the imageplane at four different depths from the camera; in this way, thecontrol points were arranged as uniformly as possible withinthe 3-D volume used in the clinical setting. The distance fromthe camera to the center of this 3-D volume was adjusted sothat it lay approximately within the field of view of the camera,which was focused on the volume center. The volume, whichshould be sufficient to include the relation of the nipple and thetumor, ranged from 10 10 10 cm to 15 15 15 cmThe depth of field of the camera was adequate even if thefocus was fixed. The distance from the camera to the volumecenter was typically around 20 cm. The 3-D positions of thecontrol points in the reference frame were measured usingthe Optotrak pen probe [Fig. 6(d)]. The corresponding 2-Dpositions in the camera images were obtained by fitting straightlines to the edges of the checker board and extracting theirintersection points. and were estimated using the setof the corresponding 3-D and 2-D positions [17] (see AppendixB). Since this estimation is more unstable than the ultrasoundcalibration, we used 100 control points. The transformation
[in (3)] defining position and orientation of the rigid bodyattached to the camera was obtained at the time of the imageacquisition in the calibration procedure. In a typical focussetting, the estimated focal length was around 410 pixels. Sincethe camera image was a 320240 matrix, the view angle was
in the horizontal direction andin the vertical direction.
B. Phantom Experiments
1) Accuracy Evaluation of 3-D Position Estimated fromUltrasonic Image: The accuracy of the 3-D position estimatedfrom ultrasonic images was evaluated. A triangular phantomsimilar to the calibration board shown in Fig. 6(a) was used,
SATO et al.: IMAGE GUIDANCE OF BREAST CANCER SURGERY 687
TABLE ISUMMARY OF ACCURACY EVALUATION OF 3-D POSITION ESTIMATED FROM ULTRASONIC (US) IMAGES
and the 3-D position of its tip was measured both by theOptotrak pen probe and from the ultrasonic images. Thespeed of sound varies with the temperature and material thatthe sound wave passes through. We measured 3-D positionswhen the sound wave passed through water at two differenttemperatures—25C (the temperature at which the ultrasoundcalibration was performed) and 40C. The tip in the ultrasonicimage was manually specified in the obtained images [which issimilar to Fig. 6(b)]. This manual specification was performedsix times for each image, and the average 3-D position ofsix different specifications was used. We estimated the 3-Dpositions of the tip from ten images which were obtained withdifferent probe positions and orientations for each temperature.Table I summarizes the estimation results at the two tempera-tures and compares them with the 3-D positions obtained usingthe Optotrak pen probe. For both temperatures, the standarddeviations of the estimated 3-D positions were within 1 mm,and the bias from the average 3-D position estimated usingthe Optotrak pen probe was also within 1 mm.2) Accuracy Evaluation of 3-D Reconstruction and Aug-
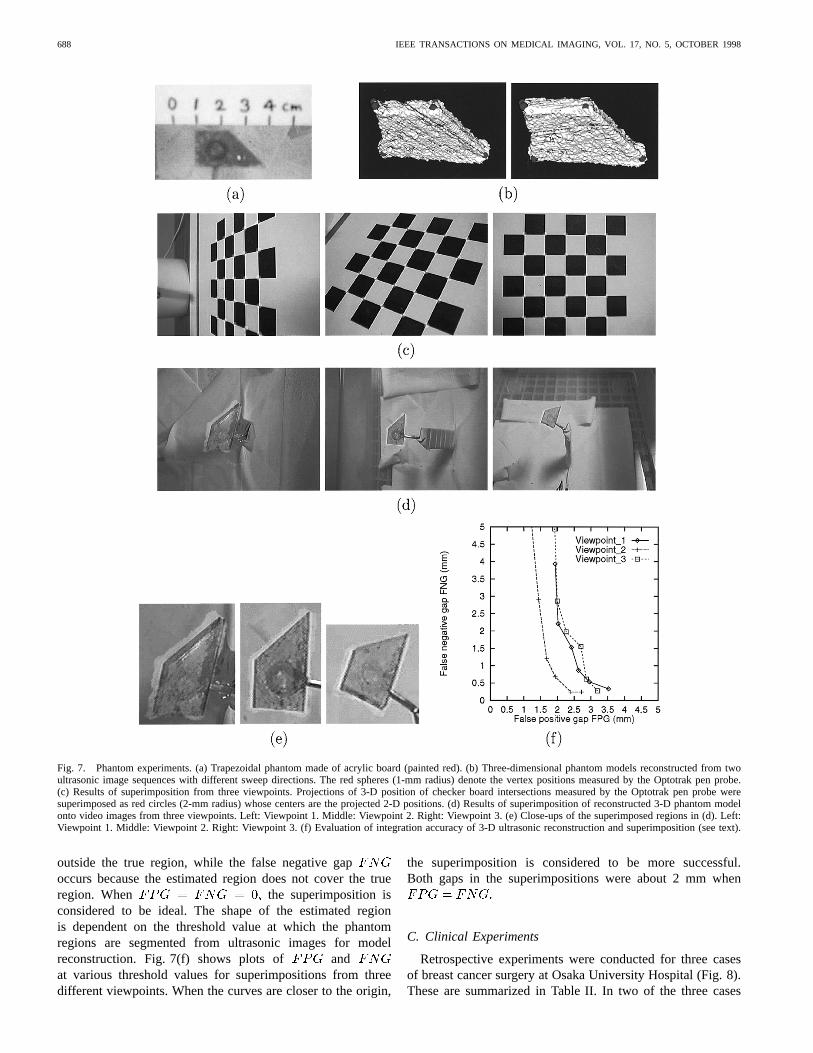
mented Reality:To gauge the accuracy of our whole system,we performed 3-D model reconstruction from ultrasonic im-ages and superimposition of the model on camera imagesusing a trapezoidal acrylic phantom [Fig. 7(a)]. The followingcomparisons were made for the evaluation.
• Comparison of the 3-D shape of a trapezoidal phantomreconstructed from ultrasonic images and the 3-D posi-tions of the vertices of the trapezoidal phantom measuredby the Optotrak pen probe to evaluate the accuracy of the3-D ultrasonic reconstruction.
• Comparison of the estimated 2-D projections of the3-D positions measured by the Optotrak pen probe andtheir live video images to evaluate the accuracy of thesuperimposition.
• Comparison of the projection of the reconstructed phan-tom model and the live video images of the phantom toevaluate the integration accuracy of the 3-D ultrasonicreconstruction and the superimposition.
Fig. 7(b) shows 3-D models of the phantom reconstructedfrom ultrasonic images. Two sequences of ultrasonic images
obtained with different sweep directions were used to recon-struct the 3-D models. The small red spheres (whose radius is1.0 mm) denote the vertex positions of the phantom accuratelymeasured by the Optotrak pen probe. The perceived verticesof the reconstructed models coincided well with the accuratelymeasured ones in two results with different sequences.
Fig. 7(c) shows superimpositions of real video images ofthe checker board and generated 2-D projections of the 3-Dpositions of the intersection points measured by the Optotrakpen probe. The results from three viewpoints are shown.The distances between the estimated 2-D positions of theprojected intersection points and their corresponding 2-Dpositions extracted from the real video images were measured.The mean of these distances was calculated using images takenfrom three different views as a measure of the error. The errormeasures of the three views were 0.75, 0.99, and 0.80 pixelsin the image plane and 0.33, 0.41, and 0.38 mm in the 3-Dspace, respectively.
Fig. 7(d) and (e) shows superimpositions of phantom videoimages and projections of the 3-D ultrasonic phantom modelfrom three different viewpoints. The superimposition was con-firmed to be quite accurate from various directions by visualevaluation. To quantitate the error of the superimpositions, wecalculated two measures of mis-registration, false positive gap
and false negative gap The phantom region wasmanually segmented from the video image and used as the goldstandard. We call the manually segmented phantom region the“true region,” and the projection of the 3-D phantom model the“estimated region.” Let be the set of all the pixels includedin the true region, and let be the set of all the pixels includedin the estimated region. Then, suppose that andThe false positive gap is defined by
(6)
and the false negative gap by
(7)
The false positive gap is the maximum gap and arisesfrom the fact that the estimated region covers the region
688 IEEE TRANSACTIONS ON MEDICAL IMAGING, VOL. 17, NO. 5, OCTOBER 1998
Fig. 7. Phantom experiments. (a) Trapezoidal phantom made of acrylic board (painted red). (b) Three-dimensional phantom models reconstructed fromtwoultrasonic image sequences with different sweep directions. The red spheres (1-mm radius) denote the vertex positions measured by the Optotrak pen probe.(c) Results of superimposition from three viewpoints. Projections of 3-D position of checker board intersections measured by the Optotrak pen probeweresuperimposed as red circles (2-mm radius) whose centers are the projected 2-D positions. (d) Results of superimposition of reconstructed 3-D phantom modelonto video images from three viewpoints. Left: Viewpoint 1. Middle: Viewpoint 2. Right: Viewpoint 3. (e) Close-ups of the superimposed regions in (d). Left:Viewpoint 1. Middle: Viewpoint 2. Right: Viewpoint 3. (f) Evaluation of integration accuracy of 3-D ultrasonic reconstruction and superimposition(see text).
outside the true region, while the false negative gapoccurs because the estimated region does not cover the trueregion. When the superimposition isconsidered to be ideal. The shape of the estimated regionis dependent on the threshold value at which the phantomregions are segmented from ultrasonic images for modelreconstruction. Fig. 7(f) shows plots of andat various threshold values for superimpositions from threedifferent viewpoints. When the curves are closer to the origin,
the superimposition is considered to be more successful.Both gaps in the superimpositions were about 2 mm when
C. Clinical Experiments
Retrospective experiments were conducted for three casesof breast cancer surgery at Osaka University Hospital (Fig. 8).These are summarized in Table II. In two of the three cases
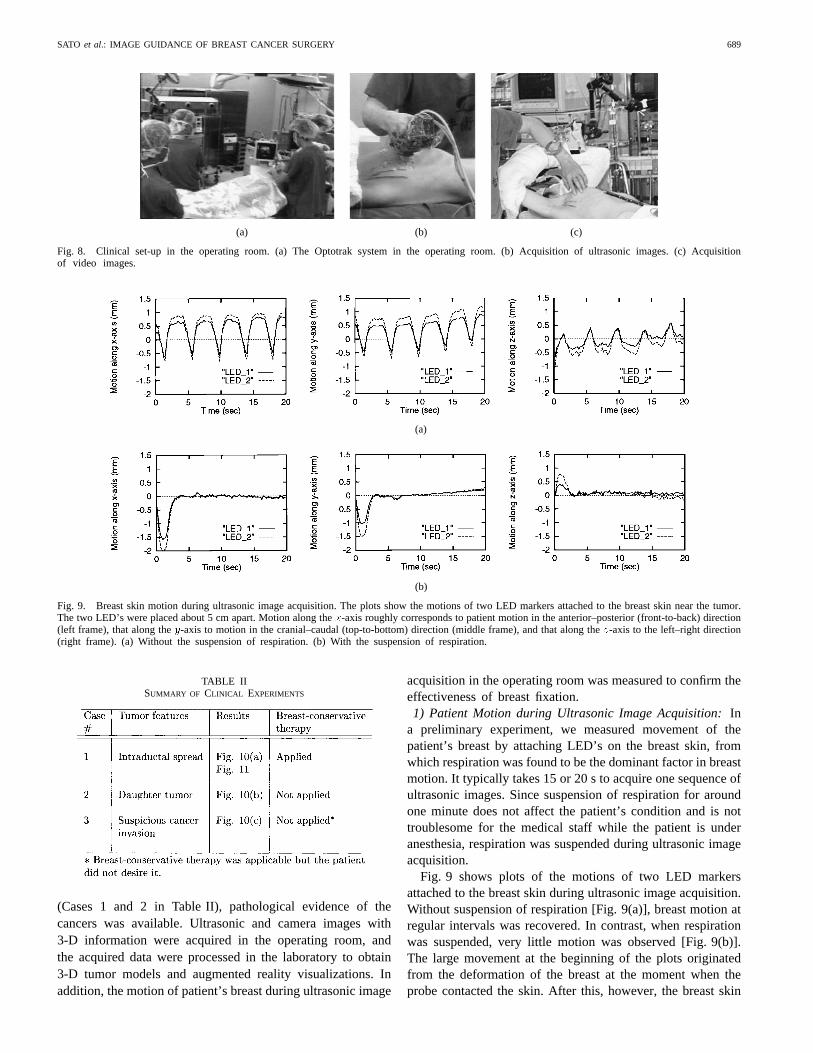
SATO et al.: IMAGE GUIDANCE OF BREAST CANCER SURGERY 689
(a) (b) (c)
Fig. 8. Clinical set-up in the operating room. (a) The Optotrak system in the operating room. (b) Acquisition of ultrasonic images. (c) Acquisitionof video images.
(a)
(b)
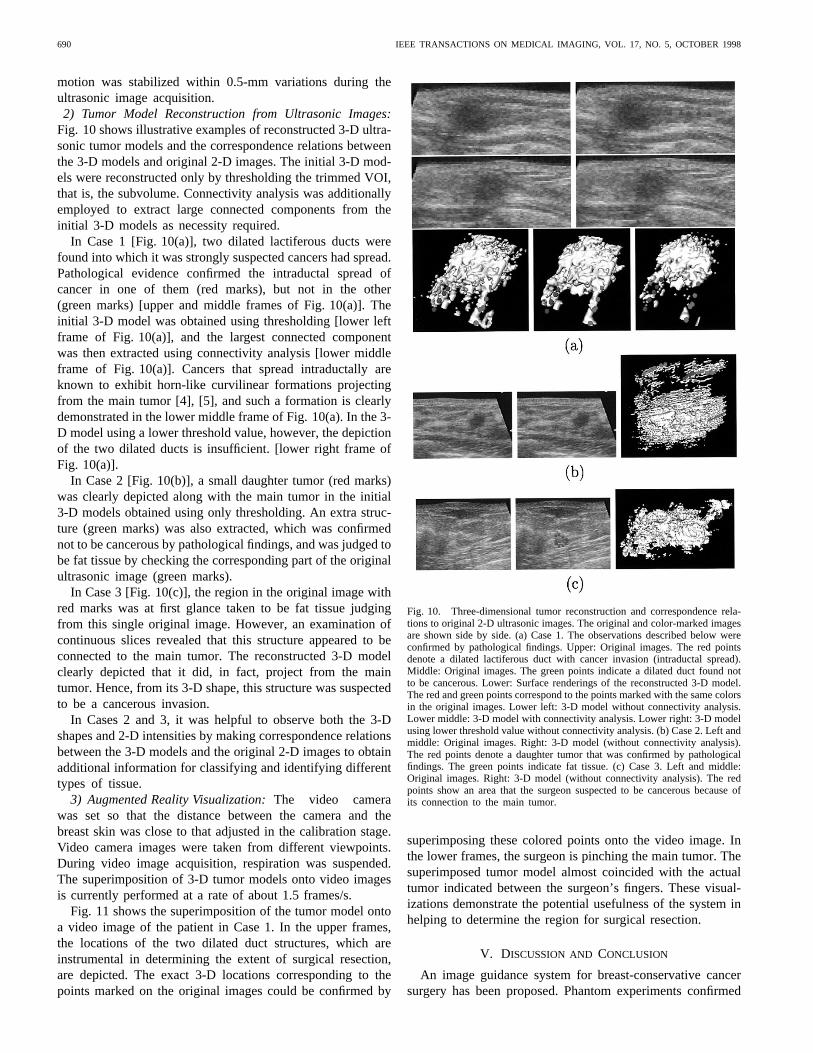
Fig. 9. Breast skin motion during ultrasonic image acquisition. The plots show the motions of two LED markers attached to the breast skin near the tumor.The two LED’s were placed about 5 cm apart. Motion along thex-axis roughly corresponds to patient motion in the anterior–posterior (front-to-back) direction(left frame), that along they-axis to motion in the cranial–caudal (top-to-bottom) direction (middle frame), and that along thez-axis to the left–right direction(right frame). (a) Without the suspension of respiration. (b) With the suspension of respiration.
TABLE IISUMMARY OF CLINICAL EXPERIMENTS
(Cases 1 and 2 in Table II), pathological evidence of thecancers was available. Ultrasonic and camera images with3-D information were acquired in the operating room, andthe acquired data were processed in the laboratory to obtain3-D tumor models and augmented reality visualizations. Inaddition, the motion of patient’s breast during ultrasonic image
acquisition in the operating room was measured to confirm theeffectiveness of breast fixation.1) Patient Motion during Ultrasonic Image Acquisition:In
a preliminary experiment, we measured movement of thepatient’s breast by attaching LED’s on the breast skin, fromwhich respiration was found to be the dominant factor in breastmotion. It typically takes 15 or 20 s to acquire one sequence ofultrasonic images. Since suspension of respiration for aroundone minute does not affect the patient’s condition and is nottroublesome for the medical staff while the patient is underanesthesia, respiration was suspended during ultrasonic imageacquisition.
Fig. 9 shows plots of the motions of two LED markersattached to the breast skin during ultrasonic image acquisition.Without suspension of respiration [Fig. 9(a)], breast motion atregular intervals was recovered. In contrast, when respirationwas suspended, very little motion was observed [Fig. 9(b)].The large movement at the beginning of the plots originatedfrom the deformation of the breast at the moment when theprobe contacted the skin. After this, however, the breast skin
690 IEEE TRANSACTIONS ON MEDICAL IMAGING, VOL. 17, NO. 5, OCTOBER 1998
motion was stabilized within 0.5-mm variations during theultrasonic image acquisition.2) Tumor Model Reconstruction from Ultrasonic Images:
Fig. 10 shows illustrative examples of reconstructed 3-D ultra-sonic tumor models and the correspondence relations betweenthe 3-D models and original 2-D images. The initial 3-D mod-els were reconstructed only by thresholding the trimmed VOI,that is, the subvolume. Connectivity analysis was additionallyemployed to extract large connected components from theinitial 3-D models as necessity required.
In Case 1 [Fig. 10(a)], two dilated lactiferous ducts werefound into which it was strongly suspected cancers had spread.Pathological evidence confirmed the intraductal spread ofcancer in one of them (red marks), but not in the other(green marks) [upper and middle frames of Fig. 10(a)]. Theinitial 3-D model was obtained using thresholding [lower leftframe of Fig. 10(a)], and the largest connected componentwas then extracted using connectivity analysis [lower middleframe of Fig. 10(a)]. Cancers that spread intraductally areknown to exhibit horn-like curvilinear formations projectingfrom the main tumor [4], [5], and such a formation is clearlydemonstrated in the lower middle frame of Fig. 10(a). In the 3-D model using a lower threshold value, however, the depictionof the two dilated ducts is insufficient. [lower right frame ofFig. 10(a)].
In Case 2 [Fig. 10(b)], a small daughter tumor (red marks)was clearly depicted along with the main tumor in the initial3-D models obtained using only thresholding. An extra struc-ture (green marks) was also extracted, which was confirmednot to be cancerous by pathological findings, and was judged tobe fat tissue by checking the corresponding part of the originalultrasonic image (green marks).
In Case 3 [Fig. 10(c)], the region in the original image withred marks was at first glance taken to be fat tissue judgingfrom this single original image. However, an examination ofcontinuous slices revealed that this structure appeared to beconnected to the main tumor. The reconstructed 3-D modelclearly depicted that it did, in fact, project from the maintumor. Hence, from its 3-D shape, this structure was suspectedto be a cancerous invasion.
In Cases 2 and 3, it was helpful to observe both the 3-Dshapes and 2-D intensities by making correspondence relationsbetween the 3-D models and the original 2-D images to obtainadditional information for classifying and identifying differenttypes of tissue.
3) Augmented Reality Visualization:The video camerawas set so that the distance between the camera and thebreast skin was close to that adjusted in the calibration stage.Video camera images were taken from different viewpoints.During video image acquisition, respiration was suspended.The superimposition of 3-D tumor models onto video imagesis currently performed at a rate of about 1.5 frames/s.
Fig. 11 shows the superimposition of the tumor model ontoa video image of the patient in Case 1. In the upper frames,the locations of the two dilated duct structures, which areinstrumental in determining the extent of surgical resection,are depicted. The exact 3-D locations corresponding to thepoints marked on the original images could be confirmed by
Fig. 10. Three-dimensional tumor reconstruction and correspondence rela-tions to original 2-D ultrasonic images. The original and color-marked imagesare shown side by side. (a) Case 1. The observations described below wereconfirmed by pathological findings. Upper: Original images. The red pointsdenote a dilated lactiferous duct with cancer invasion (intraductal spread).Middle: Original images. The green points indicate a dilated duct found notto be cancerous. Lower: Surface renderings of the reconstructed 3-D model.The red and green points correspond to the points marked with the same colorsin the original images. Lower left: 3-D model without connectivity analysis.Lower middle: 3-D model with connectivity analysis. Lower right: 3-D modelusing lower threshold value without connectivity analysis. (b) Case 2. Left andmiddle: Original images. Right: 3-D model (without connectivity analysis).The red points denote a daughter tumor that was confirmed by pathologicalfindings. The green points indicate fat tissue. (c) Case 3. Left and middle:Original images. Right: 3-D model (without connectivity analysis). The redpoints show an area that the surgeon suspected to be cancerous because ofits connection to the main tumor.
superimposing these colored points onto the video image. Inthe lower frames, the surgeon is pinching the main tumor. Thesuperimposed tumor model almost coincided with the actualtumor indicated between the surgeon’s fingers. These visual-izations demonstrate the potential usefulness of the system inhelping to determine the region for surgical resection.
V. DISCUSSION AND CONCLUSION
An image guidance system for breast-conservative cancersurgery has been proposed. Phantom experiments confirmed

SATO et al.: IMAGE GUIDANCE OF BREAST CANCER SURGERY 691
Fig. 11. Augmented reality visualization for Case 1. The right-hand imagesare close-ups of the tumor model (colored yellow) and the nipple. Thecolored points marked on the original images [Fig. 10(a)] are also renderedand superimposed, allowing the surgeon to obtain both original intensityand 3-D information from the ultrasonic images. Upper: Top view. Irregularstructures that cannot be perceived by touch are depicted in the superimposedimage. Lower: Side view. The surgeon is pinching the main tumor, whichdemonstrates that the 3-D model of the tumor is accurately superimposed.
that the 3-D models reconstructed from ultrasonic imagescould be accurately integrated with live video images. Clinicalexperiments demonstrated the potential usefulness of the visu-alization provided by the system for determining the region forsurgical resection in a more objective and quantitative mannerthan is possible by intuitive judgment, based on the precise3-D shape of the tumor, including irregularly shaped cancerinvasions.
An attractive feature of the system is the comparativesimplicity of both the ultrasound and camera calibrations.The calibration problem is one of the key considerations inaugmented reality systems [18]. In Sections III-A and IV-A,we give detailed descriptions of the calibration proceduresusing the Optotrak system in order to clearly explicate theirrelative lack of complexity. With respect to camera calibration,it is unnecessary to carry out the calibration procedure everytime before an operation if the focus is fixed. Since the depthrange of the camera used in our clinical setting is almost fixedand the depth of field is adequate even if the focus is fixed, thefocus does not need to be changed for each surgical case. Thatis, only one initial calibration is necessary. Furthermore, thecalibration is quite accurate because we use a well-developedcalibration method [17]. Thus, the superimposition was quiteaccurate and robust as shown in Fig. 7. With respect toultrasound calibration, we attach and detach the rigid bodyfor each surgical case because having the rigid body attachedto the probe is somewhat troublesome in routine clinical use.For this reason, we need to perform the calibration procedurebefore each operation. However, ultrasound calibration isparticularly simple because it involves only the acquisition
of a calibration board image and the digitization of threecorresponding 2-D and 3-D points. It usually takes less thanten minutes to perform the whole calibration procedure. Inspite of the simplicity, as indicated in Table I, the accuracyof the estimated 3-D positions is quite good. In a real breast,the 3-D positions that we want to measure lie at a depth of1 or 2 cm. Given 5% variations in the speed of sound, theresultant theoretical variation in the 3-D position at a depthof 20 mm could be up to 1 mm mm . Suchan order of variation is consider to be sufficiently small forclinical use since a margin of 1 or 2 cm beyond the tumorboundary is allowed for in determining the extent of the areafor surgical resection.
In most previously reported guidance systems [13], [15],[16], MR or CT images have been used as their modality. 3-Dmodels are reconstructed from MR/CT images acquired beforean operation. Because reconstructed models are centered inthe MR/CT coordinate system, intraoperative registration isnecessary to relate the MR/CT coordinate system to that of theoperating room. Registration is recognized as the most criticaland often unstable step in computer guidance systems [19]. Inour approach, an accurate geometrical relationship between theultrasonic image and reference coordinate systems is obtainedby the ultrasonic calibration, which is a highly stable and sim-ple procedure, before the operation. Instead of intraoperativeregistration, segmentation for 3-D model reconstruction needsto be done in the operating room. Our system uses ultrasonicimages as its modality, and 3-D models are reconstructed usingdata acquired at the time of the operation. The advantage ofcapturing images in the operating room is the tolerance itgives for movement and deformation of the target organ; withthe deformable organ, MR/CT-based systems have difficultyin registering 3-D models reconstructed from preoperativeMR/CT images. Recent work using intraoperative ultrasonicimages for the correction of registration has been reported [20].Although an open MR unit for intraoperative image acquisitionhas been developed recently [21], it is currently not widelyadopted because of its high cost and insufficient image quality.We believe that the basic principle of our system is promisingfor the image guidance of other soft tissue organs, includingthe liver as well as the breast. Since the Optotrak systemcan simultaneously track multiple rigid bodies, the system canbe easily extended so as to integrate the navigation of othersurgical tools and hand-held devices.
One problem yet to be resolved is that our current tumor seg-mentation and visualization is still insufficient in efficiency andreliability. Currently, it takes about 15 min or more to obtainthe 3-D tumor models. In this process, the cycle of thresholdselection, connectivity analysis, and 3-D reconstruction mayneed to be repeated several times. A real-time volume rendererand volume editor [22] would greatly improve the speed ofthis cycle. Another major problem is that further analysis of areconstructed 3-D model is necessary in order to judge whetheror not suspicious areas are actually cancers or arise fromother tissues. Since this judgement needs to be based on both3-D shapes and 2-D intensity structures, the correspondencerelations as shown in Fig. 10 between reconstructed 3-Dshapes and 2-D intensities in the original images are helpful.

692 IEEE TRANSACTIONS ON MEDICAL IMAGING, VOL. 17, NO. 5, OCTOBER 1998
Nevertheless, a considerable amount of time is often requiredfor the analysis, depending on the conditions of the tumorand surrounding structures. In routine clinical use, delaysarising from the need to undertake model analysis as wellas reconstruction are undesirable. To confirm and, it is hoped,improve the reliability of 3-D ultrasonic model reconstruc-tion and analysis, we are presently engaged in an ongoingclinical validation study involving a rigorous comparison ofreconstructed 3-D tumor models, original ultrasonic images,and pathological findings. We are also planning to make thesystem less bulky by using a compact optical 3-D positionsensor—thePolaris (Northern Digital Inc.) system—so that 3-D ultrasonic images can be obtained in a routine examination(not in the operating room) before the actual operation. Thiswill allow the 3-D ultrasonic images to be carefully segmentedand analyzed in the preoperative planning stage when moretime is available. Since tumor segmentation and analysis inthe operating room would then be based on the results of thepreoperative analysis, their efficiency and reliability can beexpected to be considerably improved.
APPENDIX AESTIMATION OF AND IN ULTRASOUND CALIBRATION
Suppose that three control points are given with 3-D po-sitions measured by the Optotrak pen probe and their 2-Dultrasonic image positions. Let ( ) be their 3-Dcoordinates in the reference frame, and letbe their 3-D coordinates in the ultrasound coordinate system.The scale parameter in is estimated by
(8)
Let be a 3 3 rotational matrix and be a 3-Dtranslation vector. is defined by and and
minimizing
(9)
can be estimated using a nonlinear least squares methodsuch as the Levenberg-Marquardt algorithm, where we as-sume that rotation is represented based on Euler angles.This minimization is stable since it is based on 3-D to 3-Dcorrespondences.
APPENDIX BESTIMATION OF AND IN CAMERA CALIBRATION
Let and be a rotation matrix and translation vectordefining respectively. Then, we have
(10)
Using the distortion-free camera model described in [17], theprojection equation can be written as
(11)
where and are therow and column focal lengths, respectively, and isthe image center, that is, the intersection of the camera imageplane with the optical axis. and are the internalcamera parameters defining Combining (10) and (11),we have
(12)
where and Supposethat control points are given whose 3-D positions are
and their 2-D camera projections are( ). and can be estimatedby minimizing
(13)
subject to the condition that is an orthonormal rotationalmatrix. A good approximation of this nonlinear least squaresproblem can be obtained in the form of a closed-form solutionas described in [17]. This minimization is relatively unstablesince it is based on 2-D to 3-D correspondences, and thus thenumber of control points should be large.
ACKNOWLEDGMENT
The authors would like to thank J. Masumoto and H.Tsuchiya at Division of Functional Diagnostic Imaging, OsakaUniversity Medical School and Department of Information andComputer Sciences, Osaka University, for their assistance inbuilding the user-interactive tool and evaluating the system.
REFERENCES
[1] J. R. Harris, J. L. Connolly, S. J. Shmitt, B. Cady, S. Love, R. T. Osteen,W. B. Patterson, R. Shirley, S. Hellman, and R. B. Cohen, “The use ofpathologic features in selecting the extent of surgical resection necessaryfor breast cancer patients treated by primary radiation therapy,”AnnSurg., vol. 201, pp. 164–169, 1985.
[2] F. A. Vicini, T. J. Eberlein, J. L. Connolly, A. Recht, A. Abner, S. J.Schnitt, W. Silen W, and J. R. Harris, “The optimal extent of resectionfor patients with stage I or II breast cancer treated with conservativesurgery and radiotherapy,”Ann Surg., vol. 214, pp. 200–204, 1991.
[3] H. Hiramatsu, T. Ikeda, and K. Enomoto, M. Mukai, K. Kikuchi, J.Furukawa, K. Oshio, M. Kitajima, and K. Hiramatsu, “The use of highresolution MR imaging for pre-treatment of evaluation of breast cancer:Detection of intraductal spread,”Nippon Acta Radiologica, vol. 57, pp.182–188, 1997.
[4] H. Tsunoda, E. Ueno, E. Tohno, and M. Akisada, “Echogram of ductalspreading of breast carcinoma,”Jpn. J. Med. Ultrason., vol. 17, pp.44–49, 1990.
[5] T. Kamio, S. Kameoka, and K. Hamano, “Ductal echography: Classi-fication of ducts,”Breast Ultrasound Update, in H. Madjar and B.-J.Teubner, Eds. Basel, Switzerland: Karger, 1994, pp. 174–182.
[6] M. Bajura, H. Fuchs, and R. Ohbuchi, “Merging virtual objects withthe real world: Seeing ultrasound imagery within the patient,”Proc.SIGGRAPH ’92, Chicago, IL, 1992, pp. 203–210.
[7] O. Peria, L. Chevalier, A. Francois-Joubert, J.-P. Caravel, S. Dalsoglio,S. Lavallee, and P. Cinquin, “Using a 3-D position sensor for registrationof SPECT and US images of the kidney,”Lecture Notes in Computer

SATO et al.: IMAGE GUIDANCE OF BREAST CANCER SURGERY 693
Science, (First International Conference on Computer Vision, VirtualReality, and Robotics in Medicine, Nice, France), vol. 905, pp. 23–29,1995.
[8] H. Fuchs, A. State, E. D. Pisano, W. F. Garrett, G. Hirota, M.Livingston, M. C. Whitton, S. M. Pizer, “Toward performing ultrasound-guided needle biopsies from within a head-mounted display,”LectureNotes in Computer Science, (Visualization in Biomedical Computing ’96,Hamburg, Germany), vol. 1131, pp. 591–600, 1996.
[9] T. Berlage, “Augmented reality for diagnosis based on ultrasoundimages,”Lecture Notes in Computer Science, (First Joint Conf. CVRMedand MRCAS, Grenoble, France), vol. 1205, pp. 253–262, 1997.
[10] M. Nakamoto, Y. Tamaki, Y. Nakajima, Y. Sato, and S. Tamura, “3-D shape reconstruction of breast tumor from ultrasonic images,”Proc.Japanese Society of Medical Imaging Technology (JAMIT Frontier ’97),Suita, Japan, 1997, pp. 72–75.
[11] M. Nakamoto, Y. Sato, Y. Tamaki, T. Sasama, Y. Nakajima, I. Sakita,S. Tamura, and M. Monden, “An augmented reality system using 3-Dultrasonic images for guidance in breast cancer surgery—A prelimi-nary result—,”Proc. Japanese Society of Medical Imaging Technology(JAMIT Frontier’ 98), Koganei, Japan, 1998, pp. 72–77.
[12] A. State, G. Hirota, D. T. Chen, W. F. Garrett, and M. A. Livingston,“Superior augmented reality registration by integrating landmard track-ing and magnetic tracking,”Proc. SIGGRAPH ’96, New Orleans, LA,1996, pp. 429–438.
[13] W. Lorensen, H. Cline, C. Nafis, R. Kikinis, D. Altobelli, and L.Gleason, “Enhancing reality in the operating room,”Proc. Visualizationin Biomedical Computing ’93 (VBC’93), Los Alamitos, CA, 1993, pp.410–415.
[14] M. Uenohara and T. Kanade, “Vision-based object registration for real-time image overlay,”Lecture Notes in Computer Science, (First Inter-national Conference on Computer Vision, Virtual Reality, and Roboticsin Medicine, Nice, France), vol. 905, pp. 13–22, 1995.
[15] W. Grimson, G. Ettinger, S. White, T. Lozano-Perez, W. M. Wells,III, and R. Kikinis, “An automatic registration method for framelessstereotaxy, image guided surgery, and enhanced reality visualization,”IEEE Trans. Med. Imaging, vol. 15, pp. 129–140, 1996.
[16] S. Nakajima, H. Atsumi, R. Kikinis, T. M. Moriarty, D. C. Metcalf, F.A. Jolesz, and R. M. Black, “Use of cortical surface vessel registrationfor image-guided neurosurgery,”Neurosurg., vol. 40, pp. 1201–1210,1997.
[17] J. Weng, P. Cohen, and M. Herniou, “Calibration of stereo camerasusing a nonlinear distortion model,”Proc. 10th Int. Conf. on PatternRecognition (ICPR’90), Atlantic City, NJ, 1990, vol. 1, pp. 246–253.
[18] M. Tuceryan, D. S. Greer, R. T. Whitaker, D. E. Breen, C. Crampton, E.Rose E, and K. H. Ahlers, “Calibration requirements and procedures fora monitor-based augmented reality system,”IEEE Trans Visualizationand Computer Graphics, vol. 1, pp. 255–273, 1995.
[19] S. Lavallee, “Registration for computer-integrated surgery: Methodol-ogy, state of the art,”Computer-Integrated Surgery, in R. H. Taylar,S. Lavallee, G. C. Burdea, and R. Mosges, Eds. Cambrige, MA, TheMIT Press, 1996, pp. 77–97.
[20] R. D. Bucholz, D. D. Yeh, J. Trobaugh, L. L. Mcdurmont, C. D.Sturm, C. Baumann, J. M. Henderson, A. Levy, and P. Kessman, “Thecorrection of stereotactic inaccuracy caused by brain shift using anintraoperative ultrasound device,”Lecture Notes in Computer Science,(First Joint Conference on CVRMed and MRCAS, Grenoble, France),vol. 1205, pp. 459–466, 1997.
[21] S. G. Silverman, B. D. Collick, M. R. Figueira, R. Khorasani, D. F.Adams, R. W. Newman, G. P. Topulos, and F. A. Jolesz, “InteractiveMR-guided biopsy in an open-configuration MR imaging system,”Radiol., vol. 197, pp. 173–181, 1995.
[22] P. Saiviroonporn, A. Robatino, J. Zahajszky, R. Kikinis, and F. A.Jolesz, “Real time interactive 3-D-segmentation,”Acad. Radiol., vol.5, pp. 49–56, 1998.