image classification based on plsa fusing spatial relationships between topics
TRANSCRIPT
IEEE SIGNAL PROCESSING LETTERS, VOL. 19, NO. 3, MARCH 2012 151
Image Classification Based on pLSA FusingSpatial Relationships Between Topics
Biao Jin, Wenlong Hu, and Hongqi Wang
Abstract—The spatial relationships between objects are theimportant specificities of the images. This letter proposes ahistogram to represent the spatial relationships, and use fuzzyk-nearest neighbors (k-NN) classifier to classify the spatial rela-tionships (left, right, above, below, near, far, inside, outside) withsoft labels. Then probabilistic latent semantic analysis (pLSA) isextended by taking into account the spatial relationships betweentopics (SR-pLSA), and SR-pLSA is used to model the image asthe input for support vector machine (SVM) to classify the scene.Experiments demonstrate that the proposed method can achievehigh classification accuracy.
Index Terms—Image classification, probabilistic latent semanticanalysis (pLSA), spatial relationship.
I. INTRODUCTION
R ECENT progress on classifying images has introduceda range of features, models, classifiers, and frameworks.
The previous works can be summarized as two basic strategies.The first strategy uses low-level features such as color, texture,power spectrum, etc, combining with supervised learningmethods to classify images [1], [2]. The second strategy uses anintermediate semantic representation before classifying images:Much work has converged on bag-of-words (BoW) models[3]–[5] [e.g., probabilistic latent semantic analysis (pLSA)and latent Dirichlet analysis (LDA)] based on quantized localdescriptors and support vector machines (SVM) or k-NearestNeighbor (k-NN) as basic techniques; Another semantic mod-eling of scene is object-based or region-based model [6]–[8],which identifies the semantic as a set of materials or objectsthat appear in the image (e.g., sky, grass, and cars), and thendevelops generative models of the scenes.Some works have proved that spatial information can im-
prove image classification performance [3], [5], [7], [8]. Thespatial correlation of basic elements (e.g., pixel, lines and re-gions) is the most important feature of the image, yet to the bestof our knowledge, the previous works mainly use the positioninformation, and the spatial relationships (including topolog-ical, directional and metric relations) between objects are rarelymodeled in the classification methods.In this letter, we propose a histogram to represent the spa-
tial relationships between objects, and extend pLSA by takinginto account spatial relationships between topics (SR-pLSA)
Manuscript received October 27, 2011; revised January 01, 2012; acceptedJanuary 06, 2012. Date of publication January 12, 2012; date of current versionJanuary 23, 2012. This work was supported by the National Basic Research Pro-gram of China (2010CB327900) and the National Natural Science Foundationof China (61001176). The associate editor coordinating the review of this man-uscript and approving it for publication was Prof. Yong Man Ro.The authors are with the Key Laboratory of Technology in Geo-spatial In-
formation Processing and Application System, Institute of Electronics, ChineseAcademy of Sciences, Beijing 100190, China (e-mail: [email protected]).Digital Object Identifier 10.1109/LSP.2012.2184091
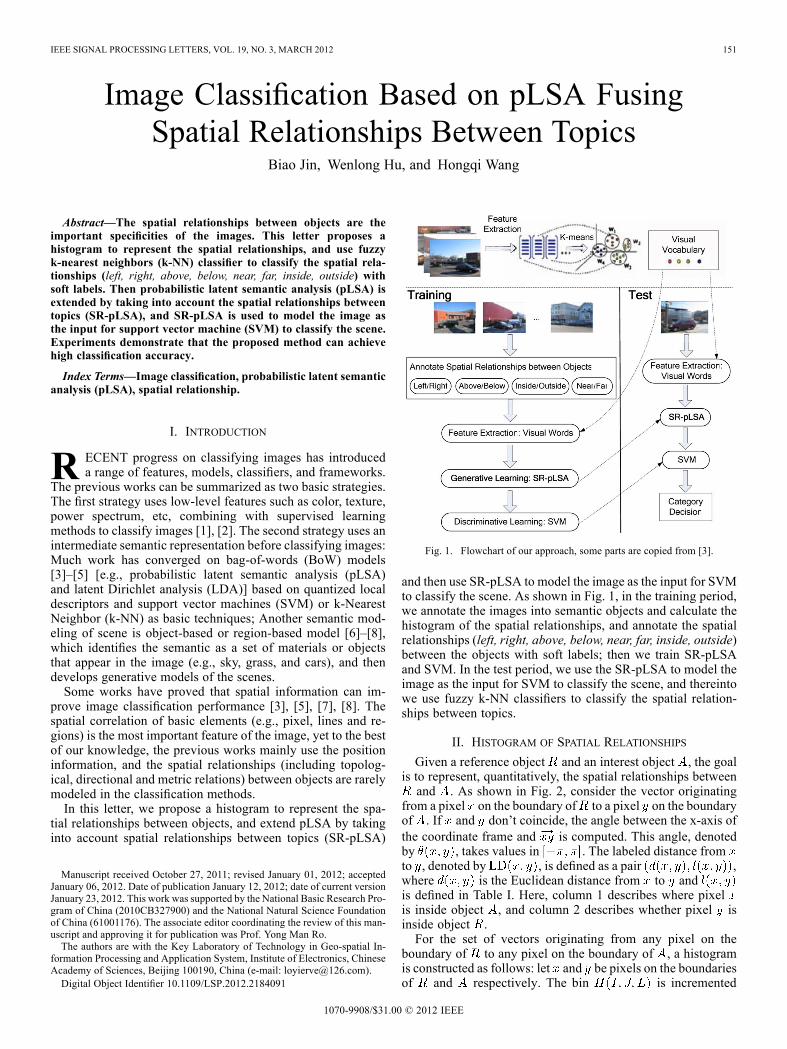
Fig. 1. Flowchart of our approach, some parts are copied from [3].
and then use SR-pLSA to model the image as the input for SVMto classify the scene. As shown in Fig. 1, in the training period,we annotate the images into semantic objects and calculate thehistogram of the spatial relationships, and annotate the spatialrelationships (left, right, above, below, near, far, inside, outside)between the objects with soft labels; then we train SR-pLSAand SVM. In the test period, we use the SR-pLSA to model theimage as the input for SVM to classify the scene, and thereintowe use fuzzy k-NN classifiers to classify the spatial relation-ships between topics.
II. HISTOGRAM OF SPATIAL RELATIONSHIPS
Given a reference object and an interest object , the goalis to represent, quantitatively, the spatial relationships betweenand . As shown in Fig. 2, consider the vector originating
from a pixel on the boundary of to a pixel on the boundaryof . If and don’t coincide, the angle between the x-axis ofthe coordinate frame and is computed. This angle, denotedby , takes values in . The labeled distance fromto , denoted by , is defined as a pair ,where is the Euclidean distance from to andis defined in Table I. Here, column 1 describes where pixelis inside object , and column 2 describes whether pixel isinside object .For the set of vectors originating from any pixel on the
boundary of to any pixel on the boundary of , a histogramis constructed as follows: let and be pixels on the boundariesof and respectively. The bin is incremented
1070-9908/$31.00 © 2012 IEEE

152 IEEE SIGNAL PROCESSING LETTERS, VOL. 19, NO. 3, MARCH 2012
Fig. 2. Example of the interest object and reference object .
TABLE ILABELS IN THE LABELED DISTANCE
Fig. 3. Histogram of the spatial relationship between and in Fig. 2.
as (1): Where is the range of angle values spanned by bin, and is the range of distance values spanned by
bin , and is the label associated withthe distance values spanned by bin .Then the histogram is normalized as follows:
(2)
where is the number of angle bins and the number ofdistance bins. We call as the histogram of the spatialrelationships.For example, the histogram of the spatial relationship be-
tween and in Fig. 2 is calculated as shown in Fig. 3.Let be a labeled set
for one kind of pairwise objects in the scenes, where is thehistogram of the spatial relationship and is the soft labelvector that labeled to the spatial relationships (left, right,above, below, near, far, inside, outside):
(3)
For example, we label the spatial relationships in Fig. 2 asbased on the his-
togram in Fig. 3. So we obtain a matrix :
... (4)
We calculate the statistical property of the soft labels as (5),and the weight of the relationship as (6). The largerindicates that the relevant relationship is more important for thescene, and it primarily affects the classification results:
... (5)
(6)
We choose to use the fuzzy k-NN classifier to classify a newinput , the nearest prototypes are retrieved from togetherwith their class labels. The input is labeled corresponding tothe nearest neighbors:
(7)
are the nearest neighbors of input sample is a“fuzzification” parameter, and is the distance betweenand its th nearest neighbor .
(8)
III. PLSA FUSING SPATIAL RELATIONSHIPSBETWEEN TOPICS (SR-PLSA)
Probabilistic latent semantic analysis (pLSA) is a generativemodel from the statistical text literature [9]. Here we have im-ages as documents and we discover objects as topics (such ascar/pavement, and grass/sky), so that an image is modeled asa mixture of topics. There is no concept of spatial informationwithin the model, so a lot of works extend the pLSA by takinginto account the position information [3], and it has been shownthat position information can improve scene classification per-formance. Yet there is no work considering the spatial relation-ships between topics. Spatial relationships between objects aremore important for the scenes, and here we extend the pLSAby taking into account the spatial relationships between topics(corresponding to objects) (SR-pLSA).
(1)

JIN et al.: IMAGE CLASSIFICATION BASED ON PLSA FUSING SPATIAL RELATIONSHIPS BETWEEN TOPICS 153
Fig. 4. Graphical model representation of the SR-pLSA.
Suppose we have a collection of imageswith words from a visual vocabulary , un-observed topic variable , and a spatial rela-tionship aggregation thatis the spatial relationships between and is the histogramof the spatial relationships between and . One may summa-rize the data in a co-occurrence table of counts
, where denotes how often the word oc-curred in an image .The graphical model representation is shown in Fig. 4 corre-
sponding to a joint probability:
(9)
(10)
is calculated using (7). Marginalizing out the latentvariable and gives:
(11)
And then from , we obtainas
(12)
The standard procedure for maximum likelihood estimationin SR-pLSA is the Expectation Maximization (EM) algorithm,
and according to [9], we have E-step as (13) and M-step as (14).E-step: M-step:
(14)
The E-step and the M-step equations are alternated until a ter-mination condition is met. is the topic specific distribu-tion, and each image is modeled as a mixture of topicsas the input for SVM to classify the scene.
IV. EXPERIMENTS
In order to evaluate our approach, we apply it to two testdatasets: 1) Vogel and Schiele [6] and 2) Fei-Fei and Perona[4]. We will refer to these data sets as VS and FP, respectively.All experiments are repeated five times with different randomlyselected training and test images, and the final result is reportedas the mean of the results from the individual runs. In thetraining period, we use LabelMeToolbox [10] to annotate ob-jects, and train SR-pLSA and SVM [11]. In the test period, weuse SR-pLSA to model the images, and use SVM to recognizethe categories of the images.In the formulation of SR-pLSA, we compute a co-occurrence
table, where each image is represented as a collection of vi-sual words, provided from a visual vocabulary that is obtainedfrom the image descriptors. According to [3], we summarizethe performances of the descriptors as following: SIFT-type de-scriptors are always superior to patches; color is always supe-rior to gray level. So in this letter, we obtain the visual vocabu-lary as in [3] by vector quantizing descriptors (color SIFT andfour concentric circles, or gray SIFT and four concentric circlesfor the gray images) computed from the training images usingK-Means.We carry out a set of experiments to investigate how classi-
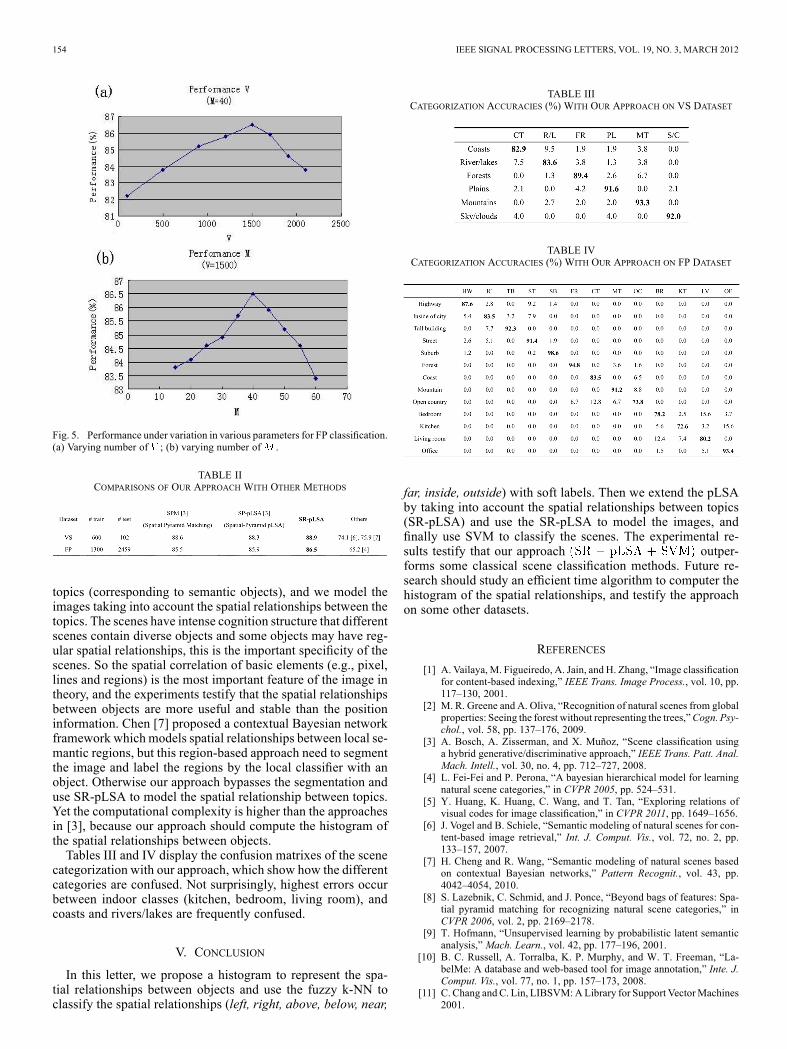
fication performance (on the FP data set) is affected by the var-ious parameters: the number of visual words ( in the K-Meansvector quantization), and the number of topics ( in SR-pLSA).Fig. 5 shows the performance variation on different and .Note the mode in the graphs of and , we can see that themode is at and , and we obtained the bestperformance values with a mean of 86.5 percent.We compare the performance of our image classification ap-
proach to the approaches of Bosch [3], Fei-Fei and Perona [4],Vogel and Schiele [6], and H. Chen and R. Wang [7] using thesame data sets that they tested their approaches on. Bosch [3]demonstrated that pLSA works better than the BoW representa-tion, and pLSA framework with position information performsmuch better than others. The comparisons of our algorithm withother methods are given in Table II.Note that much better results are obtained using our approach.
In contrast to the approaches in [3], we annotate and learn 40
(13)
154 IEEE SIGNAL PROCESSING LETTERS, VOL. 19, NO. 3, MARCH 2012
Fig. 5. Performance under variation in various parameters for FP classification.(a) Varying number of ; (b) varying number of .
TABLE IICOMPARISONS OF OUR APPROACH WITH OTHER METHODS
topics (corresponding to semantic objects), and we model theimages taking into account the spatial relationships between thetopics. The scenes have intense cognition structure that differentscenes contain diverse objects and some objects may have reg-ular spatial relationships, this is the important specificity of thescenes. So the spatial correlation of basic elements (e.g., pixel,lines and regions) is the most important feature of the image intheory, and the experiments testify that the spatial relationshipsbetween objects are more useful and stable than the positioninformation. Chen [7] proposed a contextual Bayesian networkframework which models spatial relationships between local se-mantic regions, but this region-based approach need to segmentthe image and label the regions by the local classifier with anobject. Otherwise our approach bypasses the segmentation anduse SR-pLSA to model the spatial relationship between topics.Yet the computational complexity is higher than the approachesin [3], because our approach should compute the histogram ofthe spatial relationships between objects.Tables III and IV display the confusion matrixes of the scene
categorization with our approach, which show how the differentcategories are confused. Not surprisingly, highest errors occurbetween indoor classes (kitchen, bedroom, living room), andcoasts and rivers/lakes are frequently confused.
V. CONCLUSION
In this letter, we propose a histogram to represent the spa-tial relationships between objects and use the fuzzy k-NN toclassify the spatial relationships (left, right, above, below, near,
TABLE IIICATEGORIZATION ACCURACIES (%) WITH OUR APPROACH ON VS DATASET
TABLE IVCATEGORIZATION ACCURACIES (%) WITH OUR APPROACH ON FP DATASET
far, inside, outside) with soft labels. Then we extend the pLSAby taking into account the spatial relationships between topics(SR-pLSA) and use the SR-pLSA to model the images, andfinally use SVM to classify the scenes. The experimental re-sults testify that our approach outper-forms some classical scene classification methods. Future re-search should study an efficient time algorithm to computer thehistogram of the spatial relationships, and testify the approachon some other datasets.
REFERENCES
[1] A. Vailaya, M. Figueiredo, A. Jain, and H. Zhang, “Image classificationfor content-based indexing,” IEEE Trans. Image Process., vol. 10, pp.117–130, 2001.
[2] M. R. Greene and A. Oliva, “Recognition of natural scenes from globalproperties: Seeing the forest without representing the trees,”Cogn. Psy-chol., vol. 58, pp. 137–176, 2009.
[3] A. Bosch, A. Zisserman, and X. Muñoz, “Scene classification usinga hybrid generative/discriminative approach,” IEEE Trans. Patt. Anal.Mach. Intell., vol. 30, no. 4, pp. 712–727, 2008.
[4] L. Fei-Fei and P. Perona, “A bayesian hierarchical model for learningnatural scene categories,” in CVPR 2005, pp. 524–531.
[5] Y. Huang, K. Huang, C. Wang, and T. Tan, “Exploring relations ofvisual codes for image classification,” in CVPR 2011, pp. 1649–1656.
[6] J. Vogel and B. Schiele, “Semantic modeling of natural scenes for con-tent-based image retrieval,” Int. J. Comput. Vis., vol. 72, no. 2, pp.133–157, 2007.
[7] H. Cheng and R. Wang, “Semantic modeling of natural scenes basedon contextual Bayesian networks,” Pattern Recognit., vol. 43, pp.4042–4054, 2010.
[8] S. Lazebnik, C. Schmid, and J. Ponce, “Beyond bags of features: Spa-tial pyramid matching for recognizing natural scene categories,” inCVPR 2006, vol. 2, pp. 2169–2178.
[9] T. Hofmann, “Unsupervised learning by probabilistic latent semanticanalysis,” Mach. Learn., vol. 42, pp. 177–196, 2001.
[10] B. C. Russell, A. Torralba, K. P. Murphy, and W. T. Freeman, “La-belMe: A database and web-based tool for image annotation,” Inte. J.Comput. Vis., vol. 77, no. 1, pp. 157–173, 2008.
[11] C. Chang and C. Lin, LIBSVM:ALibrary for Support VectorMachines2001.