image as a factor in tourism development
TRANSCRIPT

http://jtr.sagepub.com/Journal of Travel Research
http://jtr.sagepub.com/content/13/3/1.citationThe online version of this article can be found at:
DOI: 10.1177/004728757501300301
1975 13: 1Journal of Travel ResearchJohn D. Hunt
Image as a Factor in Tourism Development
Published by:
http://www.sagepublications.com
On behalf of:
Travel and Tourism Research Association
can be found at:Journal of Travel ResearchAdditional services and information for
http://jtr.sagepub.com/cgi/alertsEmail Alerts:
http://jtr.sagepub.com/subscriptionsSubscriptions:
http://www.sagepub.com/journalsReprints.navReprints:
http://www.sagepub.com/journalsPermissions.navPermissions:
What is This?
- Jan 1, 1975Version of Record >>
at Scientific library of Moscow State University on December 2, 2013jtr.sagepub.comDownloaded from at Scientific library of Moscow State University on December 2, 2013jtr.sagepub.comDownloaded from

1
Image as a Factor in Tourism DevelopmentJOHN D. HUNT
Dr. Hunt is Chairman of the Institute for the Study ofOutdoor Recreation and Tourism and Assistant Dean,
College of Natural Resources, Utah State University,Logan.
- IntroductionThe perceptions held by potential visitors about
an area may have significant influences upon the
viability of that area as a tourist-recreation region.What these potential customers think about thenatural environment, climate, and people of a regionmay shape perceptions or images which detract fromor contribute to successful development. Althougha region may contain a wide spectrum and highquality of tourist-recreation resources, a distorted
image may detract from realizing potential use or
optimum economic development.This article discusses a research project which
was designed to examine the phenomenon of im-
age as it may relate to tourism. The project waspilot in nature. More sophisticated and extensive .re-search is needed to understand the influence of imageand perception upon tourism development. In add-tion, the project was geographically specific in thatit dealt with Rocky IBIountain states and predomi-
. nantly western recreational resources. However, itsis suggested that the principles of image are trans-
ferrable and should be given serious consideration inany established, developing, or potential tourist-re-
creation region.Finally, while image is probably a significant
variable weigliing upon the success of a region, itsrelative magnitude as compared to other feasibilityfactors such as access, intervening opportunities, pop-ulation concentrations, physical facilities, and so
forth is not known. Given this level of understand-
ing it is also difficult to determine the case or diffi-culty with which images can be changed or reinforced.
The Effect of Image on Consumer DecisionsEach year states, cities, airlines, resorts, and
many, many others spend millions of dollars in anattempt to build images conducive to vacation travel.Tlie lure to visit a particular region or fly a certainairline is often more visionary than tangible.
Very limited attention, however, is devoted to
self-examination of image by tourist-recreation re-
gions or tlieir services and accommodations. Generally
j speaking, most producers examine the reactions of
B consumers as opposed to the attitudes of potential
consumers. This lack of understanding image is parti-cularly evident among states and various vacation
regions. At least there is little evidence of attemptsto describe image, or for that matter, determine ifidentifiable images do exist in the minds of potentialtravelers. Some exceptions are evident in the litera-ture. In 1962, the United States Travel Service con-ducted market research in Great Britain, France,West Germany, Italy, Brazil, Venezuela, liexico, Jap-an, and Australia to determine the attitudes of poten-tial travelers to the United Statcs.I The study gener-ally described the United States and her citizens asperceived by a sample of respondents from each - ofthe countries.
For example, the Australians, on one hand, sug-gested that U.S. citizens are &dquo;friendly, interesting, rich,warmhearted, hard working, cosmopolitan, honest;courteous, and happy.&dquo; On the otiier hand, sizeablenumbers of Australians &dquo;consider the American hard,materialistic, tense, vulgar, insecure, and childish.&dquo;
In reference to attitudes and opinions about theUnited States, Italians &dquo;believe the United Statcs-has good roads, modernity, variety, many large cities,efficient transportation, and much interesting enter-tainment.&dquo; On the negative side, Italians indicatedthat the United States has &dquo;expensive food, poorfood, lack of variety in foods, poor weather, ex-pensive living, and over-industrialization.&dquo;
Casual review of the entire study suggests thatthe citizens of the above-mcntioned countries whohad visited the United States generally had a morefavorable opinion of the United States and Americansthan those who had not visited the United States.
In discussing brand image, Herzog= noted that &dquo;users
generally interpret the brand image more favorablythan non-users although both groups agree on its
essential outline.&dquo;More recently BIayo3 examined regional images
and regional travel behavior. Among other things,lze indicated that &dquo;the image of a destination area
was ... a critical factor in the destination choice
process.&dquo; Mayo furtlier concluded that, &dquo;whether or
not an image is, in fact, a true representation of whatany given region has to offer the tourist, what is im-portant is the image that exists in the mind of thevacationer.&dquo; As was mentioned at the outset, it is
possible that images, as perceived by individuals inthe travel market, may havc as much to do with anarea’s tourism development success as the more tangi.ble recreation and tourism resources.
at Scientific library of Moscow State University on December 2, 2013jtr.sagepub.comDownloaded from
2
ivhile little is known about the impact of imageon tourism, traditional marketing researchers tell usthat customers often buy products and services on thebasis of their images as well as their inhcrent charac-teristics. Aaron Syector-~ notes that &dquo;clients buy brandproducts not only because of their inherent qualitiesbut also because of a bias, a disposition toward pro-duct or service not only because of what it &dquo;will dofor him performanccwise [sic] but also on what itmean to him.&dquo; While Walter Nkloocls&dquo; believes thatnew products are initially tried on the basis of per-cepts or &dquo;the proditct concept&dquo; and are &dquo;repurchasedor discarded on the basis of tangible satisfaction,&dquo;other writers believe the conceptual appeal continuesto be an important factor as long as products areutilized. Marketing and consumer researchers re-
peatedly voice the role of image in consumer productpreferences.
Finally, many writers suggest that &dquo;consumerstend to prefer the brand (or product) whose imageis congenial to them.&dquo;7 In speaking of product sym-bolism Sidney Levyg argues that &dquo;a symbol is ap-propTlatc~and the product will be used and en-
joyed when it joins with, meshes with, adds to, rein.
forces, the way the consumer thinks about himself.&dquo;
.. The ProblemGiven this simple understanding of brand, pro-
duct, and:corporate image and a knowledge that whilemany states or regions are endowed witli tourist re-
sources equal or superior to other regions, yet oftenrank very unfavorably in tourist visitation, length-of-stay, and expenditure, it becomes critical to knowif image may influence the willingness of travelersto &dquo;buy&dquo; certain tourist-recreation regions. This mayseem a moot question in light of some of the citedliterature; however, this study and lBIayo’s!J were
conducted totally independent of one another dur-ing similar time periods. While each study employeddifferent methods and explore different variables,some of the results and conclusions offer interestingcomparisons. In total, the studies tend to complementone another.
The study reported here had essentially three
objectives:1. To determine if nonresidents of a state agreed
upon perceptions of land, climate, resident popula-tion, and recreational character of that state,
2. To determine if nonresidents of a group ofstates perceived different images for each state in thegroup, and
3. To determine if nonresidents of a state, fromdifferent regions of the United States, perceiveddifferent images for that state.
In other worlds, do people who live outside a
state or region similarly or differently perceive thatstate’s imagc? Are people living outside of a groupof states able to perceive different images for eachof the states in the group? Do groups of peopleliving in different regions of tlie country perceivea different image of a single state?
Research MethodsFour Rocky Mountain states tvere cltosen for
study: Colorado, Montana, Utalt, and Wyoming. Al-through these states were chosen for a variety of rca-sons the fact that they atre similar in many ways, yetexhibit some rather extreme differences in the magni-tude of their tourist industries, afforded interestingcomparisons.
Test markets were selected from five geographicalsubdivisions of the United States to represent the non-resident populations. The markets were chosen at
random from groups of markets frecjuently used formarketing and consumer research. ’I’hc five geo-graphical subdivisions represented the origins ofmost past nonresident visitors to the states of Colo-rado, Montana, Utah and Wyoming.
.
A questionnaire employing the semantic differ.ential scale and various multiple-choice techniqueswas developed. Seven-point scales were designed to
determine respondent impressions or perceptions ofthe residents of Colorado, Montana, Utah, and
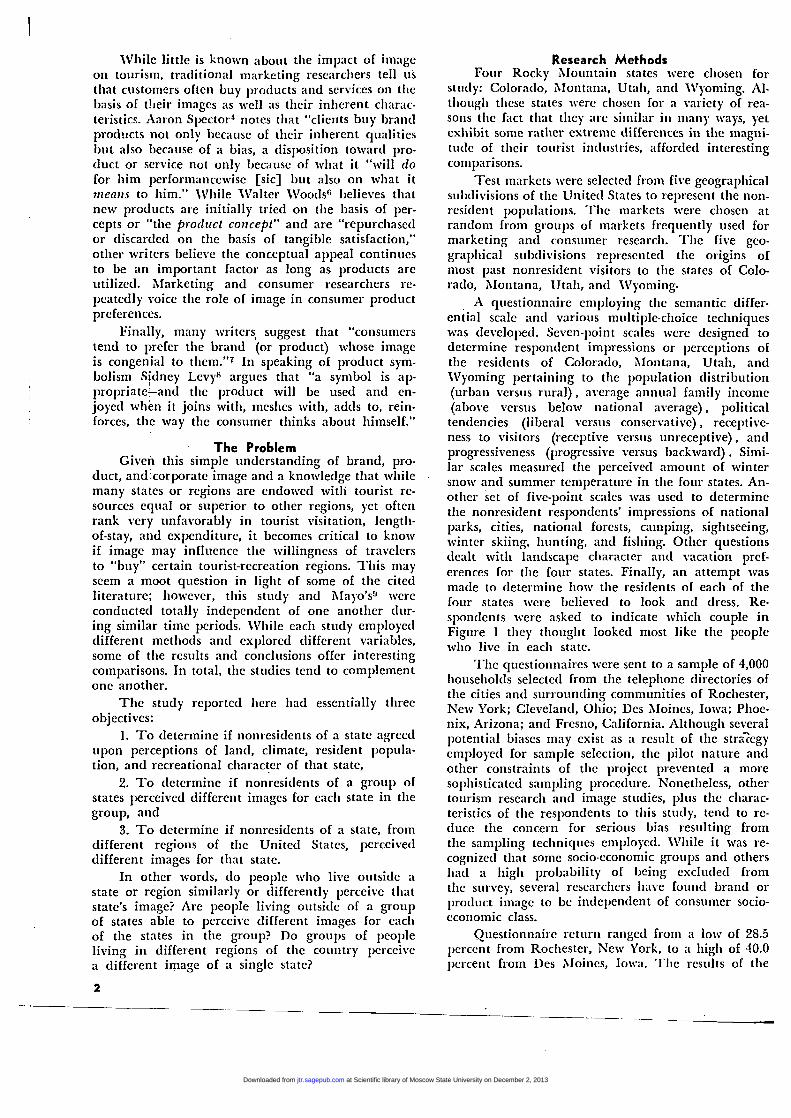
Wyoming pertaining to tlie population distribution(urban versus rural), average annual family income(above vcrsus below national average), politicaltendencies (liberal versus conscrvative) , receptive-ness to visitors (receptive versus unreceptive) , andprogressiveness (progressive versus backward) . Simi-lar scales measured the perceived amount of wintersnow and summer temperature in the four states. An-other set of five-point scales was used to determinethe nonresidents respondents’ impressions of nationalparks, cities, national forests, camping, sightseeing,winter skiing, hunting, and fishing. Other questionsdealt with landscape cliaracter and vacation pref-erences for the four states. Finally, an attempt wasmade to determine how the residents of each of thefour states were believed to look and dress. Re-
spondents were asked to indicate which couple in
Figure I they thought looked most like the peoplewho live in each state.
The questionnaires were sent to a sample of 4,000households selected from the teleplione directories ofthe cities and surrounding communities of Rochester,New York; Cleveland, Ohio; Des iBloines, Iowa; Phoe-nix, Arizona; and Fresno, California. Although severalpotential biases may exist as a result of the strategyemployed for sample selection, the pilot nature andother constraints of the project prevented a more
sophisticated sampling procedure. Nonetheless, othertourism research and image studies, plus the charac-teristics of the respondents to this study, tend to re-
duce the concern for serious bias resulting fromthe sampling techniques employed. While it was re-
cognized that some socio-economic groups and othersltad a high probability of being excluded fromthe survey, several researchers have found brand or
product image to be independent of consumer socio-economic class.
Questionnaire return ranged from a low of 28.5percent from Rocltester, New York, to a high of 40.0percent from Des Moines, Iowa. The results of the
at Scientific library of Moscow State University on December 2, 2013jtr.sagepub.comDownloaded from

3
FIGURE 1. Drawings of couples representing how residents of Colorado, Montana, Utah, Wyoming might look and dress.
study and final conclusions arc drawn only from thisresponse. No attempt was made to check for a non-response bias. White this weakness is characteristicof too many tourism studies, the characteristics ofthe respondents to this study were such that the datafrom nonrespondents would have been of little valuehad it bcen similar or different. While the education-al levels and occupations of the respondents did notcompare with tliose of the general population withinthe Standard Metropolitan Statistical Areas incluclingthe test markets, there was no statistical differencesbetween these respondent characteristics and thoseof recent tourists visiting Colorado and Utah. No
timely data was available for comparisons with Mon-tana and Wyoming; howcver, some older, as well as
very current data, suggest that visitors to all fourstates are very similar.
In order to analyze the data and accept it as
meaningful, it was necessary to establish some clc-finitional limitations and restrictions. For example,perceptions of respondents, which were averaged to
describe image, were not accepted unless they fellwithin a relatively narrow range. In other words, un-less considerable agreement was obtained on a varia-ble it vras not felt to be a viablc descriptor of a state’simage. For example, in the final analysis the popula-tion distribution variable was considered invalid since
respondents could not generally agree upon the char-actc -istic.
The semantic differential scale scores were distrib-uted so widely over the scale that grouping aroundthe mean scores was not within the acceptable range(Standard Deviation of 1.25 for the seven-point scalesand 1.00 for the five-point scale). If respondentscould not agree on any variables then it would bed
impossible to describe a state’s image with the vari-ables chosen. It was also assumed tliat the state withthc highest vacation preference rank would be themost congenial to tlje respondents, have the best
image, and be the most likely purchased tourist-rc-creation destination.
’
The Resuifs and ConclusionsThe data collected in this study suggest that
states and tourist-recreation regions do have images.
Essentially, groups of people express similar opinionsof verbal and visual descriptions winch may be usedto cltaracterize a state’s landscape, climatic tondi-
tions, and resident population. These groups of non-residents perceive similar and comparable levels of
imhressi~·eness of recreational attractions and ac-
tivities in a state.While the magnitude of data collected in this
study cannot be presented here, a few examples andgeneralizations are offered.
In the case of landscape character, 66 percent ofthe total sample perceived Colorado to be prcdomin-antly mountainous; 67 percent thought Wyoming wasgrassland and rangeland; and 43 percent labelledUtah as desert. As a specific example, the Cleveland,Oliio, respondents generally conformed to the cons-
bined respondent impressions of land types (Table1). Tables 2, 3, 4, and 5 represent examples of datafor some variables. Nearly 50 similar comparisonswere made for all variables and the five test marketareas. In calculating tlte C11I-5(~tlll’e values in this
study, the weighted mean scores or percentage arenot utilized. Chi-square values arc calculated fromthe number and distribution of respondent choicesover the semantic differential scales. HowcB’cr, since
reporting of the data in the form utilized for chi-
square calculation would have increased the numberof tables four- and five-fold and possibly confused
TABLE 1
LAND TYPES CHARACTERISTIC OF COLORADO, MONTANA,UTAH, AND WYOMING AS PERCEIVED BY CLEVELAND,
OHIO, RESPONDENTS&dquo;
’Necessary chi-square for significance at the .95 probabilitylevel is 2I.03, at 12 degrees of freedom; this difference issignificant:X*-’ = 477.60.
at Scientific library of Moscow State University on December 2, 2013jtr.sagepub.comDownloaded from

4
comparisons between states and regions, only the
weighted scores are presented in the tables and de-scribed in the narrative.
In the final analysis, Colorado residents were
perceived to have average annual family- iiicomcs near
TABLE 2
SEMANTIC DIFFERENTIAL WEIGHTED SCORES (SDWS1&dquo;AND STANDARD DEVIATIONS (SD) FOR POPULATION
DISTRIBUTION, INCOME LEVEL, POLITICAL TENDENCIES,RECEPTIVENESS, AND PROGRESSIVENESS OF COLORADO,MONTANA, UTAH, AND WYOMING RESIDENTS ASPERCEIVED BY DES MOINES, IOWA, RESPONDENTS
- - - -
’The lower the score the higher the incomes, the more liberalthe politics; the more receptive to visitors, and the more pro-gressive. ;
’’Necessary chi-square for significance at the .95 probabilitylevel is 28.87, at 18 degrees of freedom; this difference issignificant: ~X- = 237.62.
&dquo;This difference is significant: X2 = 150.20.this difference is significant: X~ = 88.77.’This difference is significant: X~ = 312.54.
TABLE 3
HOW THE RESIDENTS OF COLORADO, MONTANA,UTAH, AND WYOMING LOOK AND DRESS AS
PERCEIVED BY ROCHESTER, NEW YORK, RESPONDENTS&dquo;
. , , - -. - ;:;J _
- .._.
_ _ .’Necessary chi-square for significance at the .95 probabilitylevel is 21.03 at 12 degrees of freedom; this difference is
significant: X-’ = 375.71.’
See figure 1 for pictures of couples.
TABLE 4
SEMANTIC DIFFERENTIAL WEIGHTED SCORES (SDWS)’AND STANDARD DEVIATIONS (SD) FOR IMPRESSIONS
OF NATIONAL PARKS, CITIES, AND NATIONALFORESTS IN COLORADO, MONTANA, UTAH, AND
WYOMING AS PERCEIVED BY PHOENIX,ARIZONA, RESPONDENTS
-
.. * -.. - .. n ’&dquo;-I ~. II&dquo; ~&dquo;
&dquo;The lower the score the more impressive the national parks,cities, and national forests.bNecessary chi-square for significance at the .95 probabilitylevel is 21.03, at 12 degrees of freedom; this difference is
significant: X- - 49.61.’This difference is significant: X-’ = 213.89’This difference is significant: X-’ = 95.08.
to slightly above the national average, middle-of-thc-road political tendencies, progressive attitudes, andhigh receptiveness to visitors from other states; and todress in contemporary styles of the time. Goloraclo’snational parks, cities, national forests, and recreation-al activities were perceived to be impressive to veryimpressive.
Montana was thought to receive very muchivinter snow and have moderate to cool summer temp-eratures. Its residents were perceived to have averageannual incomes near to slightly below the nationalaverage and conservative political tendencies. Its citieswerc thought to be somewhat unimpressive while itshunting and fishing were rankecl very impressive.
Wyoming was thought to have moderate to slight-ly hot temperatures. The residents were seen to haveslightly conservative to middle-of-the-road politicaltendencies, to be very receptive to visitors, and to
look and dress like cowboys.Although Utah was thought to receive moderate
amounts of snow, the summer temperatures were en-visioned as sliglttly to very hot. Utah residents werelabelled conservative and tliought by many respond-ents to look and dress like the western pioneer of thelate 1800s or certain religious sects such as the Amish,,BIcnnonites and Hutterites.
It is interesting to note that in the case of climateand resident population characteristics, the eastern
or more distant nonresident samples did not discernas extreme differences among the four states as didthe nearer markets. In the case of recreation variables,the far western or closer samples gencrally exhibitedthe least difference in impressiveness among thestates. Tliesc examples of a market’s ability or inabili-ty to recognize differences in states or tourist-recrea-tion regions may be interpreted as indicating thatstates or tourist-recreation centers may engage in
cooperative promotion and advertising in some mark-ets while maintaining individual efforts in others. If
TABLE 5
SEMANTIC DIFFERENTIAL WEIGHTED SCORES (SDWS)LAND STANDARD DEVIATIONS (SD) FOR IMPRESSIONSOF CAMPING, SIGHTSEEING, SKIING, HUNTING, ANDFISHING IN COLORADO, MONTANA, UTAH, ANDWYOMING AS PERCEIVED BY DES MOINES, IOWA,
RESPONDENTS
aThe lower the score the more impressive the recreationolactivities.
bNecessary chi-square for significance at the .95 probabilitylevel is 21.03, at 12 degrees of freedom; this difference is
significant: X~ = 127.44.’This difference is significant: X~ = 150.69.’’This difference is significant: X= - 310.33.’This difference is significant: X*-’ = 133.24.’This difference is significant: XZ = 122.01.
at Scientific library of Moscow State University on December 2, 2013jtr.sagepub.comDownloaded from

5
markets located considerable distances from a groupof tourist-rccreation centers arc unable to distinguishbetween centers, cooperative advertising to sell the
cluster of centers or general arca may prove as pro-fitable in tourist business as individual tourist-re-creation center promotion efforts. For example, inthe case of tlie four statcs, Montana may find itmore advantageous to cooperate with Colorado, Utah,and Wyoming to promote tlle Rocky Mountain Westregion to far eastern and far western U.S. marketsthan to engage in an individual effort. Essentially,some states or tourist-recreation regions, which mayconstitute a geographic area that is visualized rather
homogeneously, may have more competition withother geographic regions or groups of states than
among themselves. In addition, it could be argued,particularly in the case of motor vellicle travelers,that potential tourists located considerable distances
away are most likely to take tltc &dquo;grand tour&dquo; of a
general area once the decision is made to spend thenecessary time and money for an extended trip. Tour-ists located closer to an area may be more selectivein their destination, reserving their &dquo;grand tour&dquo;for other vacations located in more distant and lessfamiliar areas. However, in markets ivhich are ableto discern major differences between states, individualpromotion efforts may bc highly competitive and
necessary.As was mentioned abo~·e, the western and gener-
ally closer markets expressed fewer differences be-
tween the impressiveness of the recreational activitiesand attractions of the four states than did the moredistant markets. It is possible that nearby marketshave an equal or greater opportunity for similar re-creation experiences in their own states and conse-
quently arc less interested or less able to discern majordifferences in similar attractions and activities inother nearby states. Another possibility is that nearbymarkets may know more about tlle neighboring statesand thus perceive them as more equal. Distant mar-kets may know of only famous attractions in selectedstates and tllus find them comparatively different.
Assuming that intervening opportunitics or rc-
gional familiarity may have an influence on creatinghomogeneity in image of a group of states, individualstate promotion efforts would be necessary to create
and capitalize on unique recreational opportunitieswhich may exist in a single state.
-
People from different regions of the United Statesoften agree upon a state’s image. However, such agree-ment is not unanimous. This lack of unanimity sup-ports the concept that, in some cases, tourism pro-motion and advertising should be regionalized. How-ever, this philosophy has generally been followedbecause different regions of the country contain mar-kets of different magnitude. Consequently, different
proportions or amounts, rather than different sub-
ject matter contents of advertising, have been directedto these markets. Tlle fact that image perception ofa single state or tourist-recreation center may be dif-ferent in different regional markets suggests that coil-
tent, as well as proportion of advertising, should bedifferent.
More specifically, thc data from this study sug-gest that a state’s resident population characteristicsarc perceived similarly by nonresidents from differentregions more often than not. In comparisons of thesemantic differential scores of the respondents fromall five test markets for the perceived income levels,political tendencies, receptlveness, and progressive-ness of the residents of each statc there were no signi-ficant differences in 7 of 16 comparisons. Respond-ents from different regions agreed in 50 percent ofthe cases on how eacli state’s residents looked anddressed. On t1e otlier liand, less agreement amongnonresident regions seems to be achieved for landand climatic characteristics. Although the differencestvere not great and the respondents tended to favorone land type over the others or similar extremes ofsummer temperature and amounts of snow there wassignificant difference between seven of eight test
market comparisons for these variables. This mayimply that regionalization in advertising is necessaryfor changing or reinforcing landscape and climatic
images. And the perception of population charactermay be adjusted or reinforced with common or multi-market promotional efforts.
While it is recommended that states or tourist-re-creation regions seriously consider conducting imagestudies, it is suggested that major emphasis be placedon variables dealing with landscape, climate, andresident population. Although some attention is nee-cessary, less should be devoted to determining thelevel of perceived impressiveness of recreational at-
tractions or activities. This recommendation is found-ed upon the basis that land, climate, and particularlyresident population image characteristics seem to
be the most neglected in other studies and may pro-vide more tangible ingredients for which comparativeanalysis can be made and, consequent promotion pro-grams developed. In the final analysis, the portionsof this study which dealt width the impressiveness ofattractions and activities seemed to offer very littlefor suggesting promotional strategy. Essentially,groups of people thought nearly everything aboutevery state was somewhat impressive with some attrac-tions and activities more or less impressive for somestates. There were exceptions, liowever, that mayhave resulted from the impact of those attractionsand activities for which certain states were most fam-ous or had devoted grcatcr promotional effort in
past years. Assuming that some states did not rate
relatively well on some activities for which they havea liigh level of quantity and quality, it may be thatconcentrated efforts to promote these aspects is war-ranted. For example, Utali might devote a greaterportion of its promotion effort to skiing in light oftlie fact that it lras an outstanding ski opportunitywhich, at the time of the study, was perceived unim-pressive relative to othcr states.
Assuming that the four states examined in this
study represent a valid group for comparison, states
at Scientific library of Moscow State University on December 2, 2013jtr.sagepub.comDownloaded from
6
do have different images. However, when states or
tourist-recreation rcgions in a common geographical .
area arc compared, their differences may be subtleand small when verbally described. Because of theseslight differences, one state’s image may not appearmuch different than another. However, assuming thatone state or tourist recreation region can be rated ashaving the best image of several, it becomes import-ant to make relative comparisons in the subtle differ-ences. In this study the best state was defined as thatstate having the highest preference as a vacation desti-nation. Tlie relative magnitude of visitation or ex-
penditure could also be used as indicators of the bestor better tourist-recreation region. Regardless of themeastireinent, the best state sets the standard forwhich other states or regions may desire to strivc.
Based upon the qualifications established at thcoutset of this paper, some generalizations can be madeabout those land, climate, and resident populationcharacteristics which seem to suggest ai good state
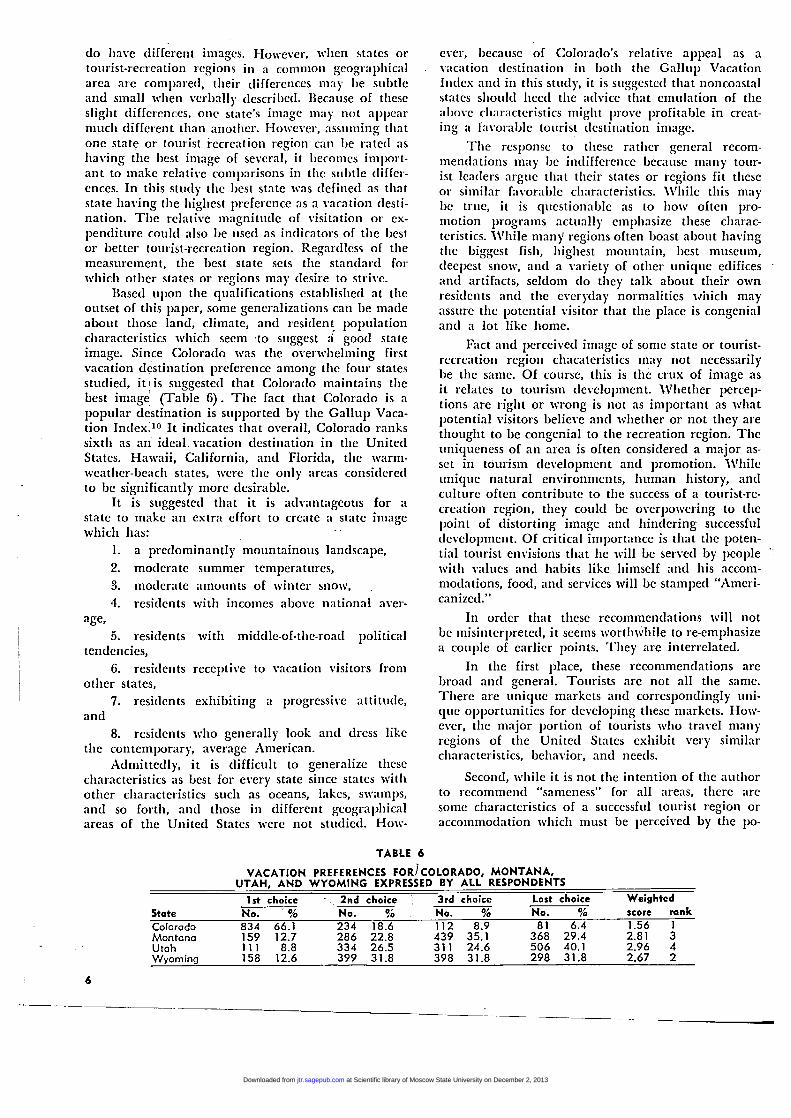
image. Since Colorado was the overwhelming firstvacation destination 1’reference among the four statesstudied, itiis suggested that Colorado maintains thebest image (Table 6). Tlie fact that Colorado is a
popular destination is supported by the Gallul’ Vaca-tion Index’ .10 It indicates that overall, Colorado rankssixth as an ideal. vacation destination in the UnitedStates. Hawaii, California, and Florida, the warm-weather-beach states, were the only areas consideredto be significantly more desiral’1e.
It is suggested that it is advantageous for a
state to make an extra effort to create a state imagewhich las: ’ .
1. a predominantly mountainous landscape,2. moderate summer temperatures,3. moderate amounts of winter snow, .
4. residents with incomes above national aver-
age,5. residents with middle-of-the-road political
tendencies,6. residents receptive to vacation visitors from
other states,
7. residents exliibiting a progressive attitude,and
8. residents who generally look and dress like
the contemporary, average American.
Admittedly, it is difficult to generalize these
characteristics as best for every state since states withother characteristics such as oceans, lakes, swamps,and so forth, and those in different geographicalareas of the United States were not studied. How-
ever, because of Colorado’s relative appeal as a
vacation destination in both the Gallup VacationIndex and in this study, it is suggested that noncoastalstates should lieccl the advice that emulation of theabove characteristics might prove profitable in crcat-ing a favorable tourist destination image.
The response to these ratticr general recom-
mendations may be indifference because many tour-ist leaders argue that their states or regions fit theseor similar favorable characteristics. While this maybe true, it is questionable as to hoiv often pro-motion programs actually emphasize these charac-teristics. While many regions often boast about havingthe biggest fish, highest mountain, best museum,deepest snow, and a variety of other unique edificesand artifacts, seldom do they talk about their ownresidents and the everyday normalities which mayassure the potential visitor that the place is congenialand a lot like home.
Fact and perceived image of some state or tourist-recreation region chacateristics may not necessarilybe the same. Of course, this is the crux of image asit relates to tourism development. Whether hercep-tions are right or wrong is not as important as whatpotential visitors believe and whether or not they arethought to be congenial to the recreation region. Theuniqueness of an area is often considered a major as-set in tourism development and promotion. Whileunique natural environments, human listory, andculture often contribute to the success of a tourist-re-creation region, they could be overpowering to the
point of distorting image and hindering successful
development. Of critical importance is that the poten-tial tourist envisions that lie will be served by people ..
with values and halits like himself and liis accom-
modations, food, and services will be stamped &dquo;Ameri-canizcd.&dquo;
In order that these recommendations will notbe misinterpreted, it seems wortlnvhile to re-emphasizea couple of earlier points. Tltey arc interrelated.
In tlie first place, these recommendations arc
broad and general. Tourists are not all the same.
There are unique markets and correspondingly uni-quc opportunities for developing these markets. How-ever, the major portion of tourists who travel manyregions of the United States exhibit very similarcharacteristics, behavior, and needs.
Second, while it is not the intention of the authorto recommend &dquo;sameness&dquo; for all areas, there arc
some characteristics of a successful tourist region oraccommodation wliicli must be perceived by the po-
TABLE 6
VACATION PREFERENCES FOR/COLORADO. MONTANA,UTAH, AND WIrOMiNG EXPRESSED BY ALL RESPONDENTS
at Scientific library of Moscow State University on December 2, 2013jtr.sagepub.comDownloaded from

7
tential visitor as standard, within acceptable norms,or not grossly exotic. This seems particularly clefensi-ble in the case of accommodations, food, services, andpeople whom the visitor will utilize or’ contact.
Third, if the results of this study are relatedto the more general principles of image and hoivit affects the consumer, the recommendations seem
relatively reasonable. To paraphrase Herzog and Levy,cited earlier, the consumer prefers the product whichis congenial, meshes with, and reinforces, the waythe consumer thinks about himself-or the productwith an image most like his self-image. Only a casualcomparison of the data on how the respondents to
this study perceived the Colorado resident with a
general knowledge of most tourists would yield somestriking similarities. Likewise similar comparisonswith the perception of the Utah resident affords somegross differences. Colorado was the most preferreddestination or most likely product-buy, while Utaliwas the least preferred destination.
Finally, and unfortunately, this study did not
explore the relative significance of the various image’ variables for their impact upon respondent vacationpreferences or the perceived congeniality of the fourstates. Such an ‘analysis seems paramount in futurestudies. Most respondents perceived many of the re-creational attractions and activities to be impressivein all the states but with considerable differencesin land type, climate, and resident population char-acteristics. Thus the latter variables seemingly in-fluence choice of destination.
In conclusion, it is suggested that the perceptionsof potential visitors to a tourist-recreation region mayweigh very heavily upon the development and event-ual success of that region. Although the examples pre-sented here have had a narrow and western perspec-tive, similar examination should be given priority intourist-recreation region development no matter whereit may occur. All places have images-good, bad, andindifferent-that must be identified and either
changed or exploited.
STUDENT RESEARCH AWARDENTRIES DUE APRIL 15
The Travel Research Association is again spon-soring its annual student award which recognizes out-standing student research in the field of travel, tour-ism, and related subjects. The Association is interestedin innovative research design as well as in-clehtli ana-lysis of particular problems and motivation, market-ing, or administrative aspects of the field.
The research paper award consists of a cash
prize of $300 and air fare and lodging expenses to at-tend The Travel Research Association annual con-
ference to be held at the Del Coronado Hotel, SanDiego, California, September 7-10, 1975.
An entrant must be a student enrolled in a uni-
versity degree program at the undergraduate or mas-ter’s level, and must submit a 500-word abstract anda copy of the paper with a postmark not later thanApril 15, 1975, to Dr. Philip Taylor, TTRA StudentContest, Bureau of Business and Economic Research,The University of Arkansas, Fayetteville, Arkansas72701.
Previous contest winners were:
1968 Rita M. KeintzBoston CollegeDemand for International Travel to and -
from tlte United States
1969 Perry J. BrownUtah State University, Tourist Spending Developmcntal Patterns
1970 Brian .SulliranStanford UniversityA Comprehcnsivc Approach to the Recrea-<t07! Trip with Specific Reference to tlte
Cyprcss Hills
1971 Stacy Standley IIIUniversity of ColoradoThe lmpact of tlre I’ail Ski Resm.t: An hz-
put-Output Analysis1972 Hong Juay Lee and Kim Thiam Tan, Co-
winnersUniversity of Hawaii
’
A Tool for Intenzational Tourism Analysis1973 Per Anderssen and Roger Colberg, Co-
winnersUniversity of WashingtonW2tltivariafc Analysis in Tmvel Resenrcla: aTool for Tmvel Pacltagc Design andtllarlteting Segmentation
1974 Sheryl E. FergusonUniversity of WyomingGeneration of a T1&dquo;a1lsactio1ls Table F).om
Secondary Data for Interregional I1lput-Out-pttt A1lalysis of State and Substate Regio1ls
1U.S. Travel Service, United States Department of Commerce, Mar-kel Research of Attitudes of potential Travelers to the U.S.A., 1962, 108p.2Herta Herzog, "What Is a Product?:" Consumer Behavior and the
Behavioral Sciences, ed. Steuart H. Britt (New York: john Wiley andSons, Inc., 1967), pp. 353-355.3Edward J. Mayo, "Regional Images and Regional Travel Behavior,"
Research for Changing Travel patterns: Interpretation and Utilisation,Proceedings of The Travel Research Association, Fourth Annual Con-ference, August 12-13, 1973. pp. 211-218.4Aaron J. Spcctor, "Basic Dimensions of the Corporate Image,"
Journal of Marketing, Volume 25, Number 6, 1961, pp. 47-51.
5James F. Engel, ’’Motivation Research-Magic or Menace?,"Michigan Business Review, Volume 13, March 1961, pp. 28-32.6Walter A. Woods, "Where Should Research Start?," Printers’ Ink,
Volume 28, May 29, 19GI, pp. 98-99.
7Herta Herzog, "What Is a Product," Consumer Behavior andthe Behavioral Sciences, ed. Steuart H. Britt (New York: John Wileyand Sons, Inc., 1967). pp. 375-376.8Sidney J. Levy, "Symbols by Which We Buy," Advancing Market-
ing Efficiency, ed. Lynn H. Stockman (Chicago: American MarketingAssociation, 1939). pp. 409-416.
9Mayo, op. cit.10Carl von E. Bickert, Judith L. Oldham, and John J. Ryan, A
Profile of the Tourist Market in Colorado-1968 (Denver: Denver Re-search Institute. University of Denver, 1969), 130p.
at Scientific library of Moscow State University on December 2, 2013jtr.sagepub.comDownloaded from