im matterley undervalued assets fund outlook for 2013 · pdf fileim matterley undervalued...
TRANSCRIPT

IM Matterley Undervalued Assets Fund
Outlook for 2013
Review of 2012
Retained Cash Flow
Asset Allocation
US
Europe
Banks
Portfolio Attribution
Outlook 2013
How Are We Positioned for the Year Ahead?
Conclusion
Valuation Matrix
Review of 2012
The Fund rose by 23.6% while the market rose by 12.3%. As we look back at our outlook
document for 2012 our standpoint at the time could be summarised as follows:
The value case was well supported on both earnings and asset metrics. Based on
retained earnings, it was our view that the equity market was displaying similar
valuation to the depths of March 2009 and we expand on this later in the document.
We also felt that equities, in a low interest rate environment, would continue to
prove themselves as a provider of an attractive and rising income stream. Asset
allocation would as a result have to be a little more measured having been so
heavily skewed to bonds.
We remained optimistic about improving economic data from the US, in no small
part assisted by ongoing house price rises. We were not optimistic about Europe
but we saw the Long Term Refinancing Operation as a valuable first step by the
European Central Bank in acting as a central bank should in times of crisis.
Ultimately, however, the extent of our hope was that a moderation of bad news
would prove to be powerful to sentiment.
At a sector level, a material change of view was articulated in the banking sector
owing to strong cash generation and our belief that, in many instances, equity
holders in the sector had become superior to bond holders owing to the advent of
contingent convertible bonds.

Finally, while we acknowledged there was little visibility, our confidence in the
ability of the portfolio to make good progress was based upon the fact that it was
the cheapest it had been at the outset of any year since its inception.
Taking each of the above in turn, the comment that has raised most suspicion is that we
have felt that at times this year the equity market was displaying similar value to the
trough of March 2009. Below we illustrate a simple cash flow bridge based upon rights
issue activity and retained earnings since the start of 2009. If the running tally of close to
1500 index points is added to the starting level of the FTSE in 2009 of 4434, then it would
appear we are on almost absolute parity as we start 2013.
FTSE 100 Retained Earnings and Rights Issues in Index Points (2009-2013e)
Rights Issue Activity in Index Points
Retained Earnings in Index Points
Source: Matterley
While this can only ever be a guide to the value of the FTSE 100, given constituent change,
the point we are keen to make is that the floor is rising rapidly. This was first and foremost
the result of significant rights issue activity. Subsequently, retained earnings have taken
up the baton given that dividend payout ratios remain low in the context of history.
Retained Cash Flow
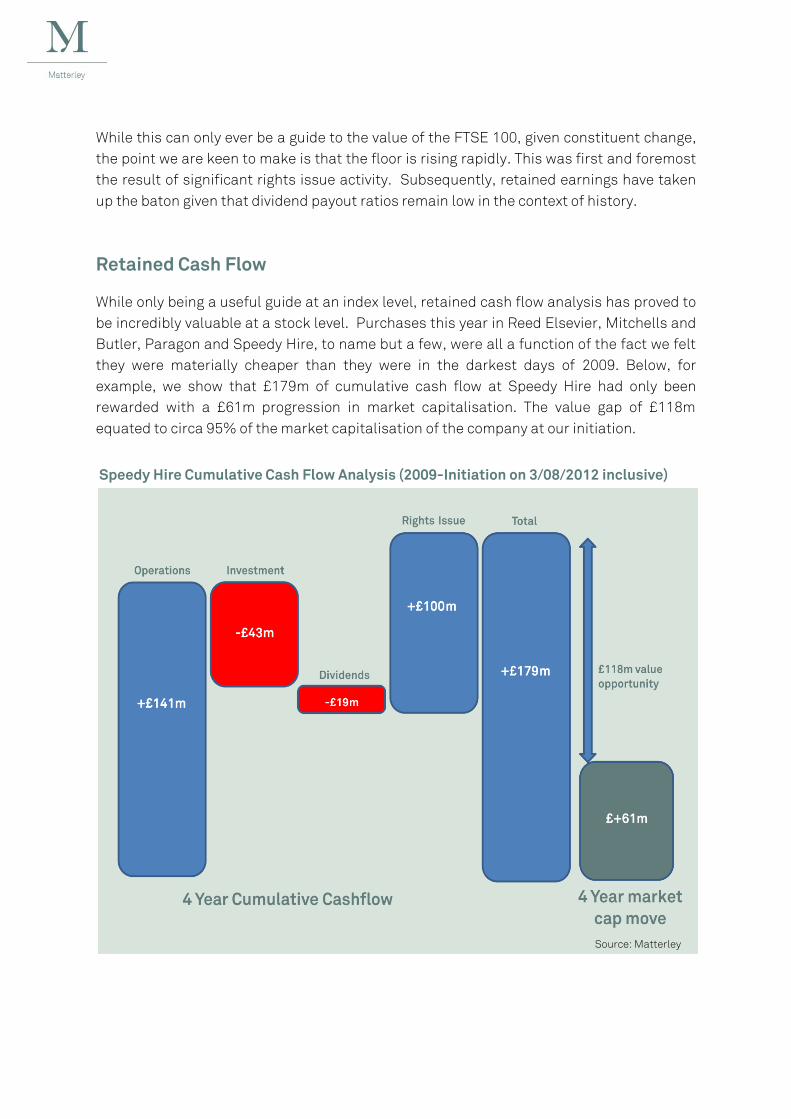
While only being a useful guide at an index level, retained cash flow analysis has proved to
be incredibly valuable at a stock level. Purchases this year in Reed Elsevier, Mitchells and
Butler, Paragon and Speedy Hire, to name but a few, were all a function of the fact we felt
they were materially cheaper than they were in the darkest days of 2009. Below, for
example, we show that £179m of cumulative cash flow at Speedy Hire had only been
rewarded with a £61m progression in market capitalisation. The value gap of £118m
equated to circa 95% of the market capitalisation of the company at our initiation.
Speedy Hire Cumulative Cash Flow Analysis (2009-Initiation on 3/08/2012 inclusive)
Source: Matterley

This cash generation, combined with low payout ratios, is allowing companies ample
opportunity in which to grow their dividends from a low base. Despite the fact that more
modest growth is forecast going forward, next year is still set to be a record dividend
distribution from the market.
Asset Allocation
It is therefore surprising to us that the retail buying patterns still favour bonds so heavily
and the source of cash, more often than not on a monthly basis, is UK equities.
Date Best Selling Net Retail Worst Selling Net Retail
Oct-12 Global Emerging Markets UK All Companies
Sep-12 Absolute Return – UK UK All Companies
Aug-12 £Strategic Bond UK All Companies
July -12 £ Corporate Bond Europe Excluding UK
June-12 £ Corporate Bond UK All Companies
May-12 £ Corporate Bond Europe Excluding UK
Apr-12 £ Corporate Bond Europe Excluding UK
Mar-12 £ Strategic Bond UK All Companies
Feb-12 £ Corporate Bond UK All Companies
Jan-12 £ Corporate Bond UK All Companies
Dec-11 £ Corporate Bond Europe Excluding UK
Nov-11 Mixed Investment 20-60% Shares Specialist
Oct-11 £ Strategic Bond UK All Companies
Source: Investment Management Association. Note: As of 01/01/2012 the Cautious Managed Sector has been re-named as
“Mixed Investment 20-60% Shares”.

The UK Equity market has also been falling out of favour with institutional investors in
recent years. Today, for example, UK pension funds allocate only 18% of their £1.5trn
worth to UK Equities.
Some of the reasons for this change are of course healthy, such as the development of
overseas equity markets. Others, however, are unhealthy in our view, namely the
extremely low bond yields we are experiencing as a result of Quantitative Easing, which is
causing material rises in the present value of pension liabilities. The response from
pension trustees to this move seems to be further investment in bonds to asset match
their liabilities to the best of their abilities in order to limit any further damage. From an
operating perspective, pension accounting rules also require companies to make
additional payments to plug the deficit which is diverting capital away from investment.
The government has already recognised the need to encourage corporates to spend their
accumulated cash reserves, but further to this a consultation process has been put
together to discuss whether current discount rates are appropriate. Any upward revision
of the allowable discount rate, be it using average gilt yields over a longer time frame for
example, would be good for investment and, as a result, economic growth. Ultimately, of
course it would be extremely good for equities, and it is difficult to envisage a scenario
whereby they remain as unpopular as they have been over the last year.
US
Source: Matterley
%
Percentage of UK pension funds allocated in UK Equities (1967-2011)
Recent political agreement over the ‘fiscal cliff’ has merely delayed the hard budgetary
decisions for another few months. While there is a still long way to go in deciding how to
reduce the US deficit, we believe that Obama now has the crucial advantage of being in his
second term ,and will therefore have a greater focus on economics rather than on his
political ideals. This will most likely allow him to compromise on the breadth of healthcare
spending which on the current trajectory is set to hit 20% of GDP. The Republicans will also
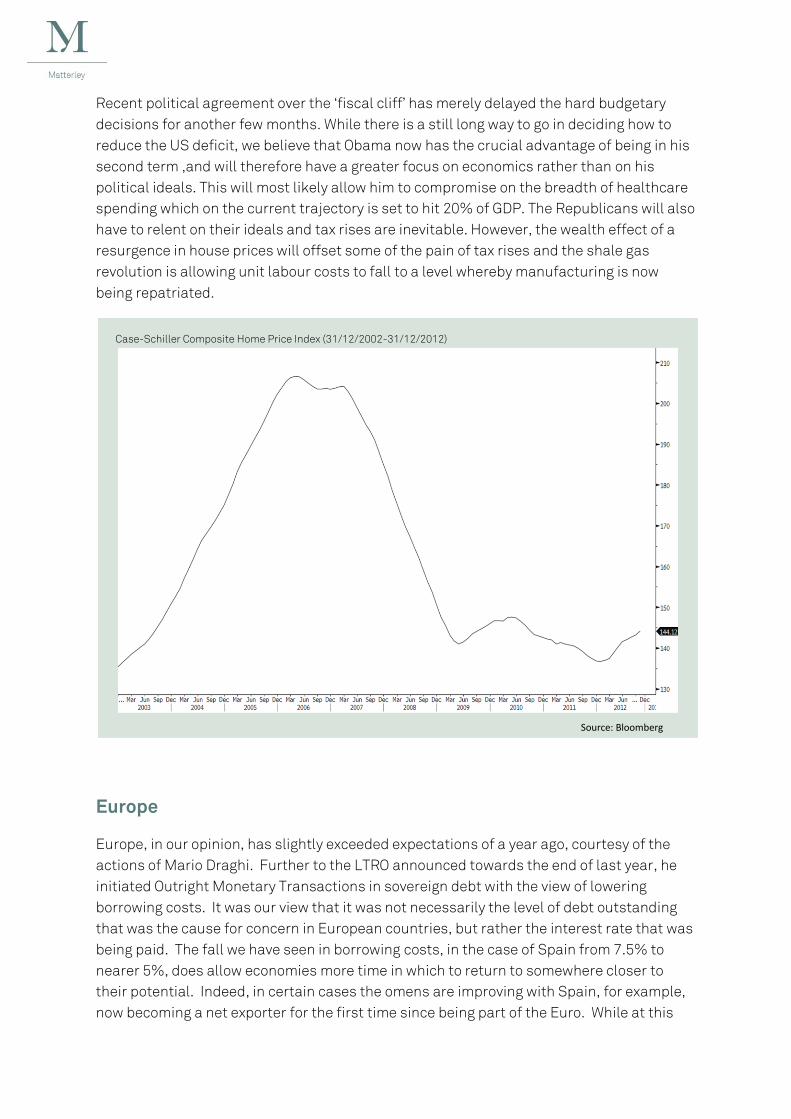
have to relent on their ideals and tax rises are inevitable. However, the wealth effect of a
resurgence in house prices will offset some of the pain of tax rises and the shale gas
revolution is allowing unit labour costs to fall to a level whereby manufacturing is now
being repatriated.
Europe
Europe, in our opinion, has slightly exceeded expectations of a year ago, courtesy of the
actions of Mario Draghi. Further to the LTRO announced towards the end of last year, he
initiated Outright Monetary Transactions in sovereign debt with the view of lowering
borrowing costs. It was our view that it was not necessarily the level of debt outstanding
that was the cause for concern in European countries, but rather the interest rate that was
being paid. The fall we have seen in borrowing costs, in the case of Spain from 7.5% to
nearer 5%, does allow economies more time in which to return to somewhere closer to
their potential. Indeed, in certain cases the omens are improving with Spain, for example,
now becoming a net exporter for the first time since being part of the Euro. While at this
Case-Schiller Composite Home Price Index (31/12/2002-31/12/2012)
Source: Bloomberg

stage we only whisper it cautiously we could not rule out the Eurozone being a source of
positive surprise in the year ahead relative to depressed expectations.
Banks
The banking sector has enjoyed a good run this year as satisfactory asset quality has
resulted in strong cash flow. This has caused gearing levels to fall closer to those of their
US counterparts and has given investors more confidence in book values.
Also, as mentioned a year ago we felt that equity investors in certain names in the
domestic sector were assuming unique territory in that they had assumed the status of
ranking superior to bond holders. Lloyds for example have £9.2bn of capital with
professional investors which will convert to equity at 59 p (over 100% above the share price
at the start of the year) in the event their Tier 1 Ratio breaches 5%. Barclays however in
recent months seems to have gone one better by issuing $3bn Contingent capital bonds.
The contingency is that if their Tier 1 Capital Ratio breaches 7% then the bondholders of
this instrument lose the right to both the coupon payments as well as the principal, and
there is no conversion into the equity. This is an extraordinary state of affairs, and it is not
immediately clear to us why people would buy such a bond. The upshot for equity holders,
however, is that the cost of capital is falling materially. While returns on equity may
struggle to get meaningfully above 10% it is still a level in our view that can justify a price
Pe
rce
nta
ge
Net Exports of Spanish Goods and Services as a Percentage of GDP (1995-2012)
Source: Eurostat

target above book value. In the case of Barclays this would still suggest a price target 50%
above the current level.
Portfolio Attribution
At the outset of last year the portfolio was the cheapest it has been since its inception and
this gave us great deal of confidence in its ability to make good progress during the year.
Pleasingly, almost all sectors have positively contributed but the one slight frustration is
financials. While good money was made in absolute terms it has been a slight relative drag
owing to the size of the sector and its strong performance. Good returns were registered
by the Fund in the first quarter but many shares in the sector were approaching their price
targets which encouraged us to reduce positions. While another extremely good entry
point was provided to us by the LIBOR scandal in June our feeling was that the size of the
fine could severely impair cash flow and this held us back from investing in the domestic
banks sector. We did increase Paragon, the buy to let lender, to be our largest active
position and this features as one of our key contributors at a stock level. However, we are
ultimately extremely frustrated that more money was not made in the sector.
At a stock level, corporate activity played its part with Aegis falling to a Japanese
competitor and Aer Lingus once again attracting the attention of Ryanair. Galliford Try, the
housebuilder and construction company, was a key contributor for the second year running
and underlines why conglomerate discounts remain a fertile hunting ground for us.
Portfolio Sector Attribution (01/01/2012-31/12/2012)
Source: Matterley

The most significant disappointment was Higland Gold which suffered a significant
derating from a modest starting valuation and now trades on a mere 4x 2013 earnings. The
reasons for this, in our view, were a significant stock overhang and a confused dividend
policy. The latter can and should be easily addressed and stock overhangs tend not to
weigh on fundamentals indefinitely. Relative to expectations the loss in Cairn Energy was
also hugely disappointing. Starting the year at a discount to cash and investments the
share price has broadly fallen in line with any investment in further exploration assets. A
share buyback from the company, effectively buying their significant exploration portfolio
at less than zero , would be entirely sensible in our opinion and we are ever hopeful of such
an outcome in the coming months.
Portfolio Stock Attribution (01/01/2012-31/12/2012)
ANGLO AMERICAN PLC
CAIRN ENERGY
VODAFONE PLC
AVIVA PLC
HIGHLAND GOLD & MINING PLC
Source: Matterley

Outlook for 2013
The rise in the equity market of 10.5% pre dividends has happened at a time when earnings
forecast have fallen modestly. As a result the earnings multiple of the market for 2013 has
risen to 11x. While not extreme in the context of history it is a rating that most likely
requires some sort of earnings growth for attractive capital appreciation to be achieved in
the year ahead. As things stand very modest growth is forecast but relative to consensus
we see three areas of possible positive surprise.
The first is the UK employment picture which continues to improve. It is easy to say that
this is in spite of, rather than because of, the coalition government but perhaps they
should receive some credit for the strides they have taken in reducing corporation tax. That
close to 500,000 jobs have been created in the year compares favourably to the 2 million
added in the US given that the US economy is over 6x larger than ours.
This has yet to feed through into any meaningful economic growth as disposable income
has remained subdued. It is our view, however, that after four years of falling disposable
income this is about to change owing in no small part to a rise in the income tax free
allowance from £8105 to £9205. This will result in as much £200 more on average for each
of the 31m workers in this country. This equates to slightly over £6bn or c 0.6% of UK GDP.
UK Employment Workforce Jobs By Industry All Jobs Index (2003-2012)
Source: Bloomberg

Further good news could also come in the form of a falling oil price. The chart below shows
the spot oil price and the futures price in white. The futures market has tended to be less
emotional than the spot market, and just as it ignored much of the fall in 2009 we think it is
interesting that the future price remains c $15 below the spot price today. Should the spot
price fall by $15 then the sensitivity to western GDP is as much as 1.5%. Factors that
might precipitate such a fall would include, improving supply and demand in the US as well
as technological improvements.
The final area where we think there could be upside surprise is in capital investment.
Much of the good news in the Autumn Statement was leaked beforehand, be it the tax free
threshold and the freeze in fuel duty, but the one bit of legislation we felt was new and
material was the tenfold increase in the tax free capital investment allowance. The one
UK Percentage Change in Disposable Income (2000-2015e)
Brent Crude v Brent Crude Future (2007-2012)
Source: Bloomberg
Source: Oriel

section of our society that has the money to spend today is our corporate sector. However,
what every politician has failed to do in the West is put them in a frame of mind whereby
they are willing to spend it. When this is combined with cutbacks in government spending
we have a situation when capital investment is well below even that of the early 90s. It is
our view, given the state of corporate balance sheets, that private sector capital
investment will increase significantly.
How are we positioned for the year ahead?
The frequently cited argument by bearish commentators is that earnings based metrics
are currently being flattered by unsustainably high operating margins. The analysis we
have carried out to some extent corroborates this view but as stock pickers we are still able
to find close to a third of the market operating below their 10 year average margins.
As an overlay to our strict valuation criteria, it stands to reason that this analysis is
allowing us to expose ourselves to stocks with both a cheap starting valuation and also the
propensity for earnings surprise.
UK Capital Investment as Percentage of GDP (1986-2012)
Source: Oriel
FTSE 350 Constituents: Percentage Above Or Below 10 Year Average Ebit Margin (31.12.2012)
Source: Matterley
Pe
rce
nta
ge
Percentage above or Below 10 Year Average Ebit Margin

Given our view of the trajectory of disposable income, we also think it is important to
challenge the largely consensus view that the end is nigh for consumer related areas. In
some instances, we believe we can expose ourselves to companies that are not only in a
position to beat conservative sales forecasts, but will also have the added benefit of falling
oil related costs.
The main message however, which we hope has been a consistent one, is that the portfolio
remains materially cheaper than the market as a whole. Below we show how the fund
compares to the market ex banks and life insurance, on four basic but extremely relevant
metrics. The significant sales uplift relative to the market is a function of the fact we seek
to expose ourselves to depressed company share prices where we believe there is a future.
A good starting point in establishing this is if sales and cash flow are being generated. The
earnings uplift is pleasing and when combined with the cash balance places the portfolio
on c 10x earnings. While not quite as cheap as a year ago it is still undemanding in both
absolute terms and relative to the market. It should also be extremely well rewarded if our
views on a possible growth surprise transpires during the year. When the cash balance is
taken in conjunction with the asset backing, we hope the portfolio will display defensive
qualities in the event of any pullback.
What do you get for every £1 invested? (Jan 2013)
Matterley Fund FTSE 100
Sales 156.1p 100.7p
Earnings 9.7p 8.0p
Tangible net assets 73.7p 34.0p
Net cash (Net debt) 4.5p -20.5p
Conclusion
We are perhaps surprisingly optimistic about the year ahead. However, the possibilities of
improving employment data, a rise in disposable income and capital investment as well as
a falling oil price, are not unreasonable. If this does unfold, the argument used by bearish
commentators that equities are only attractive relative to other expensive asset classes,
such as fixed interest, will quickly unravel. Indeed, with equities in mind, the saying goes
that a high price is paid for a happy consensus and it is our view that the consensus will be
happier by the end of the year than at any stage since the advent of the financial crisis in
2008. Within this, we hope that the portfolio will benefit disproportionately as it is
demonstrably cheaper than the market as a whole. While this is no guarantee of success,
it is a starting point that gives us a great deal of confidence in the year ahead.
Henry Dixon (7/01/2013)
Source: Matterley. Bloomberg consensus data for full year 2012e quoted on 31/12/12. Excludes
Banks and Life Insurance stocks and charges and expenses.

Valuation Matrix

Important Information
The information contained in this document does not constitute advice or a personal
recommendation, nor does it constitute an invitation to purchase units. Investment should be
made on the basis of the Prospectus and Simplified Prospectus, available on request. You are
recommended to seek advice concerning suitability from your investment adviser.
The information in this document is based upon sources we believe to be reliable, but its
accuracy cannot be guaranteed.
Please note past performance is not a reliable indicator of future returns. The value of
investments, and the income from them, can go down as well as up and may be affected by
exchange rate variations. The levels of taxation and their respective treatment depend on your
individual circumstances and the applicable law, which may be subject to change in the future.
The authorised corporate director of IM Matterley Investment Funds II is IFDS Managers Ltd
which is authorised and regulated by the Financial Services Authority, Registered Office: IFDS
House, St Nicholas Lane, Basildon, Essex, SS15 5FS.
The IM Matterley Undervalued Assets Fund is managed by Charles Stanley & Co. Limited, which is
authorised and regulated by the Financial Services Authority. This document has been issued
and approved for the purposes of section 21 of the Financial Services and Markets Act 2000 by
Charles Stanley & Co. Limited, which is authorised and regulated by the Financial Services
Authority. Unless a specific source is given, the source of all information within this document is
Charles Stanley & Co. Limited, with the exception of all share price data which is sourced from
Bloomberg. This document may also contain the fund managers' personal views and opinions
and does not necessarily reflect the views of Charles Stanley & Co Limited. Registered office 25
Luke Street, London EC2A 4AR. Registered in England no. 01903304.