ils annual report 2021
TRANSCRIPT

ILS Annual Report 2021 Alternative Capital: Continuing Growth Momentum

Table of Contents
Foreword . . . . . . . . . . . . . . . . . . . . . . . . . . . . . . . . . . . . . . . . . . . . . . . . . . 3
Aon Securities’ Annual Review of the Catastrophe Bond Market . . . . . . 4
Overview . . . . . . . . . . . . . . . . . . . . . . . . . . . . . . . . . . . . . . . . . . . . . . . . . . . . . . . . . .4
Global Catastrophic Loss Activity in H2 2020 and H1 2021 . . . . . . . . . . . . . . . . . .7
Catastrophe Bond Transaction Review by Quarter . . . . . . . . . . . . . . . . . . . . . . . . . .8
Secondary Market Overview . . . . . . . . . . . . . . . . . . . . . . . . . . . . . . . . . . . . . . . . . .16
COVID-19 . . . . . . . . . . . . . . . . . . . . . . . . . . . . . . . . . . . . . . . . . . . . . . . . . . . . . . . .17
ILS Transaction Activity . . . . . . . . . . . . . . . . . . . . . . . . . . . . . . . . . . . . . . 18
Capital Providers . . . . . . . . . . . . . . . . . . . . . . . . . . . . . . . . . . . . . . . . . . . . . . . . . . .18
Capital Sources . . . . . . . . . . . . . . . . . . . . . . . . . . . . . . . . . . . . . . . . . . . . . . . . . . . .18
Aon ILS Indices . . . . . . . . . . . . . . . . . . . . . . . . . . . . . . . . . . . . . . . . . . . . . . . . . . . .19
ILS Related Markets . . . . . . . . . . . . . . . . . . . . . . . . . . . . . . . . . . . . . . . . . 21
Collateralized Reinsurance Market Trends . . . . . . . . . . . . . . . . . . . . . . . . . . . . . . .22
Sidecars . . . . . . . . . . . . . . . . . . . . . . . . . . . . . . . . . . . . . . . . . . . . . . . . . . . . . . . . . .22
Industry Loss Warranties (ILW) . . . . . . . . . . . . . . . . . . . . . . . . . . . . . . . . . . . . . . . .23
Private Catastrophe Bond Placements . . . . . . . . . . . . . . . . . . . . . . . . . . . . . . . . . .25
Growth Areas within ILS . . . . . . . . . . . . . . . . . . . . . . . . . . . . . . . . . . . . . 28
Environmental, Social and Governance (ESG) & Socially Responsible Investment (SRI) . . . . . . . . . . . . . . . . . . . . . . . . . . . . . . . . . .28
Collateral Solutions . . . . . . . . . . . . . . . . . . . . . . . . . . . . . . . . . . . . . . . . . . . . . . . . .30
Public Sector/Residual Markets . . . . . . . . . . . . . . . . . . . . . . . . . . . . . . . . . . . . . . . .32
Corporate Sponsors . . . . . . . . . . . . . . . . . . . . . . . . . . . . . . . . . . . . . . . . . . . . . . . .33
Market Analysis by Region . . . . . . . . . . . . . . . . . . . . . . . . . . . . . . . . . . . 34
North America . . . . . . . . . . . . . . . . . . . . . . . . . . . . . . . . . . . . . . . . . . . . . . . . . . . . .34
Europe . . . . . . . . . . . . . . . . . . . . . . . . . . . . . . . . . . . . . . . . . . . . . . . . . . . . . . . . . . .40
Asia-Pacific . . . . . . . . . . . . . . . . . . . . . . . . . . . . . . . . . . . . . . . . . . . . . . . . . . . . . . . .40
Model Updates . . . . . . . . . . . . . . . . . . . . . . . . . . . . . . . . . . . . . . . . . . . . 43
North America . . . . . . . . . . . . . . . . . . . . . . . . . . . . . . . . . . . . . . . . . . . . . . . . . . . . .43
Europe . . . . . . . . . . . . . . . . . . . . . . . . . . . . . . . . . . . . . . . . . . . . . . . . . . . . . . . . . . .43
Asia-Pacific . . . . . . . . . . . . . . . . . . . . . . . . . . . . . . . . . . . . . . . . . . . . . . . . . . . . . . . .44

ILS Annual Report 2021 3
Foreword
It is my pleasure to bring to you the fourteenth edition of Aon Securities’ annual Insurance-Linked Securities (ILS) report .
The report aims to offer an authoritative insightful review and analysis of the ILS asset class and related developments in the
market . This report is intended to be an important and useful reference document, both for ILS market participants and those
with an active interest in the sector . Unless otherwise stated, its analyses cover the 12-month period ending June 30, 2021 .
The ILS market was tested by a number of events during the period under review across Asia-Pacific, Europe, the US, and
Australia (e .g . China seasonal floods, Japan Kyushu floods, Cyclone Ampham, Windstorm Ciara (also referred to as Sabine), US
Midwest derecho, Hurricanes Laura, Zeta, Sally and Isaias, winter storm Uri, California wildfires, and Australian hailstorms) and
the after effects of the COVID-19 Global pandemic . ILS markets have shown resilience, with record issuances in Q4 2020, and in
the 6-month period ending June 30, 2021 .
Aon's Weather, Climate & Catastrophe Insight 2020 Annual Report1 summarises: Direct economic losses and damage from natural
disasters in 2020 were estimated at $268 billion . While much lower than peak loss years in 2011 ($557 billion) and 2017 ($485
billion), it was above the average ($244 billion) and median ($246 billion) of the 21st Century . The economic losses were 12%
lower than the average and 1% lower than the median of the past decade (2010-2019) .
In the period under review, $13 billion of catastrophe bond issuance was secured (including Life and Health), an increase of $4
billion year on year . During this significant time in the market, ILS capital has increased to $97 billion from $91 billion last year .
By June 30, 2021, catastrophe bonds outstanding were $33 billion,13 .8% greater than June 30, 2020 at $29 billion .
The period under review witnessed both new issuers and repeat issuers coming to market, along with new geographical
coverages and innovations in the cat bond market . At $8 .5 billion, H1 2021 surpassed H1 2017 as the largest six-month period
of primary issuance on record . The primary market in Q2 2021 was particularly busy, with the issuance pipeline momentum
continuing through the second half of the year . With approximately $3 .7 billion of cat bonds set to mature, we expect this
market’s momentum to power through the second half of 2021 to potentially set a record full-year issuance, surpassing the
record in 2020 .
The 2021 edition of this annual ILS report, "Continuing Growth Momentum", covers a wide range of topics in the
ILS market, including:
• Aon Securities’ Annual Review of the Catastrophe Bond Market;
• A review of ILS Transaction activity;
• An overview of ILS Related Markets, including trends in ILW, Sidecars, and Private Placements;
• Growth Areas within ILS;
• A review of North America, Europe, and Asia-Pacific activity; and
• A review of Model Updates .
We hope you will find this report useful and informative, and if you have any questions relating to the data herein, or any queries
regarding any aspect of the ILS sector, please contact me or my colleagues .
Paul Schultz,
Chief Executive Officer, Aon Securities LLC
1 Aon – Impact Forecasting – Weather, Climate & Catastrophe Insight – 2020 Annual Report

4
Aon Securities’ Annual Review of the Catastrophe Bond Market
OverviewThe July 1, 2020 to June 30, 2021 year in review saw
continued strong growth in the catastrophe bond market,
with consistent quarterly issuances, and a record issuance
year of approximately $13 billion placed in the period under
review including Life and Health, versus $9 billion in the prior
year . There was a record Q4 issuance of $3 .7 billion followed
by the second largest Q2 issuance of $5 .6 billion over the
past 8 years .2
The year in review brought new issuers along with repeat
issuers, and the expansion of perils and geographies .
A selection of new and diverse issuers and new transactions
during the period were:
• Blackstone’s entry via Gryphon Mutual Insurance into the ILS
market with the $50 million Wrigley Re Ltd . Series 2021-1
Class A Notes which provide Blackstone managed funds
three years of per occurrence, parametric earthquake
coverage for their entities in the state of California .
• In another testament to the cat bond market being an avenue
to secure additional capacity, the Los Angeles Department of
Water and Power (LADWP) secured $50 million of coverage
for California Wildfire using an innovative and tailored
parametric solution .
• The debut catastrophe bond for Vermont Mutual Insurance
Company and affiliates, with a single Series 2021-1 Class A
tranche of notes upsized to $150 million, covering indemnity
losses from catastrophe events in the US Northeast; named
storm, earthquake, severe weather and fire .
• The Cosaint Re Pte . $150 million catastrophe bond, the first
issuance sponsored by Universal Insurance Holdings, came
to market covering US named storm reinsurance on an
indemnity and per occurrence basis, across a three-year
term, with coverage focused on Florida .
A selection of repeat issuers during the period were:
• Fidelis Insurance Bermuda executed their second and third
cat bonds after successfully placing their inaugural issuance
under the Herbie Re Ltd . program only several months
earlier in June . Herbie Re 2020-2 leveraged the strength of
the market to secure $275 million annual aggregate
protection against US earthquake and US named storms,
while Herbie Re Ltd . 2021-1 secured $150 million of global
annual aggregate capacity, representing the broadest
range of covered regions and perils for an insured industry
loss index cat bond at the time of issuance .
• Florida Citizens Property Insurance Corporation (Florida
Citizens) returned to the catastrophe bond market with its
largest issuance since 2014 and largest transaction in the
market in the period under review . Split across two Series
and three Classes, the Everglades Re II Ltd . 2021-1 and
2021-2 notes secured $950 million of indemnity coverage
for Florida Citizens’ Coastal and Personal Lines Accounts,
providing a key pillar of Florida Citizen’s risk transfer
program going into the 2021 Atlantic hurricane season .
• The California Earthquake Authority (CEA) returned to
market in the first quarter of 2021 to execute their
fourteenth cat bond transaction since their initial
Embarcadero series was issued in 2011 . The veteran
cedent sought protection via a single Class of Notes
which was upsized to $215 million of capacity .
• Tokio Marine & Nichido Fire Insurance Co ., Ltd . returned to
market for the fifth time under the Kizuna Re cat bond program .
This Kizuna iteration marks the first time Tokio Marine has used
the relatively new Singapore domicile for the issuance . The
series of Notes for $150 million covers the sponsor for Japan
earthquake risk on an aggregate indemnity basis .
• Assicurazioni Generali S .p .A . (AG) returned to the bond
market for its third Lion reinsurance transaction . The first
catastrophe bond to have specific ‘green’ features
incorporated, to match the ethos and initiatives of the
company . Generali is committed to the green ILS
framework it has created3 . With an Irish-domiciled SPV, a
single tranche of notes issued for (Euro) €200 million . The
notes provide Generali four years of indemnity per
occurrence reinsurance protection against losses from
European windstorms and Italian earthquakes .
The ILS market has continued growth momentum, as the
average transaction size for H1 2021 was $282 .3 million over
thirty different issuances; nineteen of those issuances came in
Q2, five behind Q2 2017 for the most issuances in a quarter . As a
comparison, the average deal size for H1 2020 was $241 .8
million over twenty-seven transactions . To further highlight the
success from the quarter, approximately 70% of all classes issued
in Q2 2021 both upsized and saw their spreads tighten to the
low ends of their initial guidance or better .
2 Aon Securities ILS Database
3 Generali – Press Release dated 24 February 2020

ILS Annual Report 2021 5
We are now beginning to see innovation in our market
broadening geographic and peril coverage . One such
example being Fidelis’ above mentioned Herbie Re Ltd .
2021-1 transaction, offering an attractive alternative to
worldwide ILW or UNL covering US (including US
Caribbean) and Canada named storms and earthquakes, US
and Canada severe thunderstorms, US and Canada winter
storms, US wildfires, Japan typhoons and earthquakes,
Europe windstorms, Italy earthquakes, Turkey earthquakes,
Australian tropical cyclones and earthquakes, and New
Zealand earthquakes, all on an index basis .
We also see the emergence of ESG/SRI cat bond collateral
components in the Lion reinsurance transaction mentioned
above, a growth area for the future . Corporate activity is
increasing and under active consideration . Also, LADWP are the
first municipal utility to access the catastrophe bond market .
The low market volatility compared to other asset classes
has re-demonstrated the value in this market that was
proven in the 2008 Financial Crisis, the 2010-2012
European Debt Crisis, and the COVID-19 market pause in
March and April 2020 . The fundamentals of this asset class
have not changed, and the characteristics of the
diversification provided by this market were well received
by investors .
We see the catastrophe bond market in a strong position .
Capital inflows over the past year have assisted respective
market and transaction upsizing, approximatively $4 billion
market issuance increase year on year refers . With prolonged
low interest rates and in certain global regions a continuing
negative interest rate environment as well as the low correlation
and diversification benefits, the demonstrated value of the ILS
markets will continue to drive capital to this space .
Exhibit 1: Catastrophe bond issuance by year, 2010 to 2021 (years ending June 30)
Source: Aon Securities LLC
Exhibit 2: Outstanding and cumulative catastrophe bond volume, 2010 to 2021 (years ending June 30)
Source: Aon Securities LLC
13,167 11,504 14,923 17,51322,422 23,387 22,562 25,821
30,109 30,538 29,860 33,74833,22337,605
44,03750,702
60,10267,083
72,273
83,59693,338
98,762107,774
121,058
- 10,000 20,000 30,000 40,000 50,000 60,000 70,000 80,000 90,000
100,000 110,000 120,000 130,000
2010 2011 2012 2013 2014 2015 2016 2017 2018 2019 2020 2021
USD
mill
ions
Property Outstanding L ife and Health
Outstanding Total Cumulative Property Issuances
Total Cumulative Bonds
USD
mill
ions
4,736 4,382
6,6656,431
9,400
6,981
5,190
11,323
9,742
5,424
9,012
13,284
0
2000
4000
6000
8000
10000
12000
14000
202120202019201820172016201520142013201220112010
Life and Health Issuance
Property Issuance

6
Issuer Domicile SummaryBermuda continued to be the largest issuer domicile for the
12-month period under review, as 38 issuances used the
jurisdiction, with Singapore accounting for 7, the Cayman
Islands 3, Ireland 2, and the UK 1 of the 51 total new issues .
Overall, as was the case in the 2020 review, Bermuda
continued to attract the majority of issuer domiciliation
under the period in review .
The Monetary Authority of Singapore (MAS) announced that
it is extending its ILS grant scheme until the end of 2022 .4
Exhibit 3: Number of transactions per issuer domicile
Domicile Period endingJune 30, 2020
Period endingJune 30, 2021
Bermuda 21 38
Singapore 5 7
Cayman 4 3
Ireland 3 2
USA 2 1
Grand Total 35 51
Source: Aon Securities LLC
New Issuer domicile developments – Hong KongOn July 17, 2020, the Hong Kong Legislative Council
passed the Insurance (Amendment) Bill 2020 . The bill
seeks to amend the Insurance Ordinance (Cap . 41) in order
to create new business opportunities for the insurance
sector . Key changes introduced by the bill include to
provide for a new regulatory regime for the ILS business
where the Hong Kong Insurance Authority (HKIA) have
been empowered to authorize a company to carry on
Special Purpose Business (SPB) .
The 2-year pilot ILS Grant Scheme of up to HKD $12 million
($1 .6 million) per issuance has been approved by the
Hong Kong Government to incentivize sponsors to the
domicile . The scheme grant in Singapore is equivalent to
approximately $1 .5 million and the HKIA scheme will have
similar qualifying requirements seen in Singapore such as
a minimum of 20% issuance costs to be billed locally and
a minimum investment size of $250,000 . However, the
licensing process of the HKIA at present may take anywhere
from 6 weeks to 2 months .
Further to the gazette of the Insurance (Amendment)
Ordinance 2020 and the Insurance (Special Purpose
Business) Rules on July 2020 which came into effect March
29, 2021, HKIA have since published a guideline (GL-33) for
authorization of Special Purpose Insurers (SPI) to carry on SPB
in or from Hong Kong . The GL-33 provides further guidelines
effective on June 30, 2021 . Additionally, the guideline also
highlights Rule 3(1) and Rule 3(4) of the SPB Rules, limiting
the scope of persons whom ILS may be offered or sold to .
The publication of the GL-33 represents another milestone of
the HKIA’s initiative in strengthening Hong Kong’s position as
a global risk management centre .
The addition of Hong Kong as a domicile will be pivotal
to the growth of the ILS market in the region, giving both
sponsors and investors to choose a location that may have
more suitability facets such as time zone and currency .
More importantly, Hong Kong provides a workable
connectivity to China, where recent increased competition
in traditional reinsurance motivates potential sponsors to
consider Capital Markets .
The Hong Kong and existing Singapore initiatives bode well
for the Asian market, and future growth developments .
4 Monetary Authority of Singapore

ILS Annual Report 2021 7
Global Catastrophic Loss Activity in H2 2020 and H1 2021
H2 2020Calendar year 2020 saw $97 billion in insured losses, which
represents a 37% increase from 2019 and a 40% increase over
the 20-year average . There remains material divergence of
economic loss ($268 billion) to insured loss ($97 billion) globally,
which demonstrates the persistent issue of protection gaps . The
US represented 76% of global insured losses over the annual
period . For comparison, the US share of global insured losses
has averaged at 57 percent during the 21st Century .
The year 2020 saw an active hurricane season with a record
frequency of named storms (30 events), 13 hurricanes, and 6
major hurricanes, the US mainland saw 12 of those named
storms (including six hurricanes) make landfall . The severe
convective storm (SCS) peril surpassed 2011, previously
considered the benchmark year for SCS, as the costliest severe
weather season on record with $63 billion in economic losses
(versus $53 billion in 2011) . It was led by the historic derecho
that swept across the Midwest on August 8-12 with economic
losses of $12 .6 billion . Wildfires in the Western US also
prompted a modern era record for acres burned and the third-
highest annual peril payouts for insurers on record (only
surpassed by 2017 and 2018) . Hurricane Laura, which impacted
the US and Caribbean, was the single largest event, with an
insured loss of $10 billion .
COVID-19 meant the insurance industry faced challenges in
attempting to accelerate the claims process, while balancing
multiple large-scale disasters, pending litigation from COVID-
19-related incidents, a disrupted supply chain, and other
complex scenarios . However, overall, the industry proved fairly
resilient through effective risk transfer, capital management and
capital deployment .
Source: Aon – Impact Forecasting – Weather, Climate & Catastrophe Insight - 2020 Annual Report
H1 2021The first half of 2021 has seen $93 billion in economic losses
from property catastrophe events, which is 16% below
the 20-year H1 average . Though well below the average
economic loss, total insured losses of $42 billion to date are
39% above the 21st century H1 average .
The US Polar Vortex event (Uri) in mid-February resulted in
$22 billion of economic loss, with high insurance penetration
translating to $15 billion insured loss . This was the costliest
event ever recorded for the peril of severe convective storm
and winter storm .
Western and Central Europe experienced $4 .5 billion of
insured loss from major storms and flooding during mid to
late June, with this number possibly set to rise . Ten separate
severe convective storm events (including hail, wind and
heavy rain) in the US caused approximately $500 million
of insured loss, which represents a reduced frequency
to H1 2020 . A number of countries experienced record
temperatures, such as Canada and parts of Africa, however
this resulted in no material industry loss events .
Source: Aon - Impact Forecasting - Global Catastrophe Recap First Half of 2021

8
Catastrophe Bond Transaction Review by Quarter
Q3 2020Historically, third quarter catastrophe bond issuance is the
low point in the quarterly issuance cycle compared to the
remainder of the year due to (re)insurance purchasing trends .
We observed four issuances in Q3 2020 totalling $742 million5,
up from zero in the year prior .
Hypatia Ltd .
Convex Re sponsored the Hypatia Ltd . Series 2021-1, their first
catastrophe bond transaction, with the Class A and B tranches
covering US named storms and earthquake perils totalling $300
million . Both note classes priced below the initial guidance at
6 .75% and 9 .75% respectively . Each class of notes utilizes an
industry loss index trigger on an annual aggregate basis for a
3-year term .
Matterhorn Re Ltd .
Matterhorn Re Ltd . Series 2020-4 came back to the market
with a dual tranche catastrophe bond issue covering US named
storms perils totalling $240 million . Class A priced at the tight
end of guidance at 10% and Class B priced at 86 .25% of par
lower than guidance . Each class of notes utilizes an industry
loss index trigger on a per occurrence basis for an approximate
18-month term .
SD Re Ltd .
Sempra Energy sponsored the SD Re Ltd Series 2020-1
catastrophe bond transaction, with a single note class covering
California wildfires totalling $90 million, utilizing an indemnity
trigger on an annual aggregate basis for an approximate 3-year
term . The notes priced at 9 .75% at the mid point of guidance .
Azzurro Re II DAC
UnipolSai Assicurazioni S .p .A sponsored the Azzurro Re II DAC
Series 2020-1 catastrophe bond transaction, with a single note
class covering Europe earthquake risk totalling (Euro) €100
million (equivalent to $112 million), utilizing an indemnity
trigger on a per occurrence basis for a 4-year term . The notes
priced at 4 .50% at the mid point of guidance .
We expect future Q3 issuance growth as new and opportunistic
issuers continue to evaluate the value of ILS capital in mitigating
climate risks .
Exhibit 4: Q3 2020 catastrophe bond issuance
Beneficiary Issuer Series ClassIssue Size (USD million)
Covered Perils Trigger Recovery Collateral
Swiss Reinsurance Company Ltd .
Matterhorn Re Ltd .
Series 2020-4 Class A $65 .00 US NS Industry
Index Occurrence MMF
Swiss Reinsurance Company Ltd .
Matterhorn Re Ltd .
Series 2020-4 Class B $175 .00 US NS Industry
Index Occurrence MMF
Sempra Energy SD Re Ltd . Series 2020-1 Class A $90 .00
CAL WF (originating from power/transformation system of insured)
Indemnity Annual Aggregate MMF
UnipolSai Assicurazioni S .p .A
Azzurro Re II DAC, an Irish special purpose
Series 2020-1 Class A $112 .44 EU EQ Indemnity Occurrence EBRD
Convex Re Limited . Hypatia Ltd . Series
2020-1 Class A $150 .00 US NS & EQ Industry Index
Annual Aggregate MMF
Convex Re Limited . Hypatia Ltd . Series
2020-1 Class B $150 .00 US NS & EQ Industry Index
Annual Aggregate MMF
Total $742.44
Source: Aon Securities LLC
5 Assumes 1 .12 EUR/USD conversion as of the issuance date

ILS Annual Report 2021 9
Q4 2020
Herbie Re Ltd .
Fidelis Insurance executed their second cat bond in October
after successfully placing their inaugural issuance only a few
months earlier in June . The strength of the market and the
support from investors on the Series 2020-1 transaction
allowed Fidelis to secure annual aggregate protection against
US earthquake and US named storms (including DC, Puerto
Rico and the US Virgin Islands) across different points in the risk
curve . Each class of notes utilizes an industry loss index trigger
on an annual aggregate basis and provides for either a 4-year
or a 2-year term . Classes A and B priced below the guidance at
6 .25% and 16 .00% respectively with Class B pricing at the tight
end of guidance at 9 .00% . The transaction was well received
by the market having upsized to $275 million across the three
tranches, after initially seeking $175 million .
Four Lakes Re Ltd .
The market was pleased by the return of American Family
Mutual Insurance to the cat bond market in November 2020,
10 years after their first transaction in 2010 . Given the evolution
of the market over the last decade AmFam was able to source
significantly broader peril coverage than their previous
deals, successfully upsizing their transaction that provides for
indemnity, per occurrence protection against US multi-peril
offering . Class A priced per guidance at 7 .00% and Class B at
9 .50% at the upper end of guidance . The two-tranche offering
initially targeted $150 million, however, due to positive investor
demand and market receptiveness, AmFam placed a $175
million deal .
Power Protective Re Ltd .
The Los Angeles Department of Water and Power secured $50
million of coverage for California Wildfires at a price of 10 .75%
using an innovative and tailored parametric solution . LADWP
are the first municipal utility to access the catastrophe bond
market and despite market stresses in the wildfire market,
LADWP were able to successfully complete their transaction .
The tailored recovery mechanism included a parametric
trigger based on reconstruction cost value in a pre-defined
area, and to reduce potential basis risk, leveraged a stepped
pay out function based on the severity of the event .
Exhibit 5: Q4 2020 catastrophe bond issuance
Beneficiary Issuer Series ClassIssue Size (USD million)
Covered Perils Trigger Recovery Collateral
California Earthquake Authority
Ursa Re Ltd . Series 2020-1
Class AA $425 .00 CAL EQ Indemnity Annual
Aggregate MMF
California Earthquake Authority
Ursa Re Ltd . Series 2020-1 Class D $350 .00 CAL EQ Indemnity Annual
Aggregate MMF
Fidelis Insurance Bermuda Limited Herbie Re Ltd . Series
2020-2 Class A $100 .00 US, PR, USVI: NS or EQ
Industry Index
Annual Aggregate MMF
Fidelis Insurance Bermuda Limited Herbie Re Ltd . Series
2020-2 Class B $150 .00 US, PR, USVI: NS or EQ
Industry Index
Annual Aggregate MMF
Fidelis Insurance Bermuda Limited Herbie Re Ltd . Series
2020-2 Class C $25 .00 US, PR, USVI: NS or EQ
Industry Index
Annual Aggregate MMF
United Services Automobile Association
Residential Reinsurance 2020 Limited
Series 2020-2 Class 1 $50 .00
US TC, EQ, WS, ST, WF, VE, MI, OP
Indemnity Occurrence MMF
United Services Automobile Association
Residential Reinsurance 2020 Limited
Series 2020-2 Class 3 $150 .00
US TC, EQ, WS, ST, WF, VE, MI, OP
Indemnity Occurrence MMF

10
Beneficiary Issuer Series ClassIssue Size (USD million)
Covered Perils Trigger Recovery Collateral
United Services Automobile Association
Residential Reinsurance 2020 Limited
Series 2020-2 Class 4 $200 .00
US TC, EQ, WS, ST, WF, VE, MI, OP
Indemnity Occurrence MMF
American Family mutual Insurance Company, S .I . (AFMICSI)
Four Lakes Re Ltd . Series 2020-1 Class A $100 .00
US NS, EQ, ST, WS, WD, VE, MI
Indemnity Occurrence MMF
American Family mutual Insurance Company, S .I . (AFMICSI)
Four Lakes Re Ltd . Series 2020-1 Class B $75 .00
US NS, EQ, ST, WS, WD, VE, MI
Indemnity Occurrence MMF
Alphabet, Inc . Phoenician Re Ltd .
Series 2020-1 Class A $237 .50 CAL EQ Indemnity Occurrence MMF
Swiss Reinsurance Company Ltd .
Matterhorn Re Ltd .
Series 2020-5 Class A $150 .00 US NS Industry
Index Occurrence EBRD
Swiss Reinsurance Company Ltd .
Matterhorn Re Ltd .
Series 2020-5 Class B $150 .00 US NS Industry
Index Occurrence EBRD
Los Angeles Department of Water and Power
Power Protective Re Ltd .
Series 2020-1 Class A $50 .00 CAL WF Parametric Occurrence MMF
AXIS Capital Northshore Re II Limited
Series 2021-1 Class A $150 .00
US, PR, USVI, CAN: NS, EQ, WS
Industry Index
Annual Aggregate MMF
Brit Syndicates Limited
Sussex Capital UK UCC Limited
Series 2020-1 - $300 .00 US, PR, USVI:
NS, EQIndustry index
Annual Aggregate MMF
Alphabet, Inc . Phoenician Re Ltd .
Series 2020-2 Class A $95 .00 CAL EQ Indemnity Occurrence MMF
American Strategic Insurance Group
Bonanza Re Ltd . Series 2020-2 Class A $200 .00 US HU Indemnity Occurrence MMF
American Strategic Insurance Group
Bonanza Re Ltd . Series 2020-2 Class B $95 .00 NS, WS, WF,
EQ, ST Indemnity Annual Aggregate MMF
Liberty Mutual Insurance Company
Mystic Re IV Ltd . Series 2021-1 Class A $300 .00 US, PR, USVI,
CAN: NS, EQIndustry Index Occurrence MMF
Hamilton Re Ltd . Easton Re Pte . Ltd .
Series 2020-1 Class A $150 .00 US NS, EQ Industry
index Occurrence MMF
Allied World Assurance Company
2001 CAT Re Ltd . Series 2020-1 Class A $210 .00
US, PR, USVI: NS, EQ, ST, EU Wind
Industry Index
Annual Aggregate MMF
Total $3,712.50
Source: Aon Securities LLC
Exhibit 5: Q4 2020 catastrophe bond issuance (continued)

ILS Annual Report 2021 11
Q1 2021
Ursa Re II Ltd .
The California Earthquake Authority (CEA) returned to market
in the first quarter of 2021 for their fourteenth cat bond
transaction since their initial Embarcadero series was issued
in 2011 . The transaction sought protection via a single class
of notes which was initially marketed for $150 million of
capacity at a target pricing range of 6 .75% to 7 .25% . Strong
investor support allowed the transaction to upsize to $215
million at a reduced risk interest spread of 6 .25% .
The CEA capitalized on strong market support in 2020 having
issued three transactions from May 2020 . Carrying on from
this 2020 momentum, with this Ursa Re II issuance in early
2021, the CEA was able to secure $1 .69 billion in support
across these four transactions within an approximately
10-month period .
Cosaint Re Pte .
The Cosaint Re Pte . $150 million catastrophe bond, the first
issuance sponsored by Universal Insurance Holdings, came
to market covering US named storm reinsurance on an
indemnity and per occurrence basis, across a three-year term,
with coverage focused on Florida . The notes priced below
the guidance at 9 .25% .
Kizuna Re III Pte . Ltd .
Tokio Marine & Nichido Fire Insurance Co ., Ltd . returned to
market for the fifth time under the Kizuna Re cat bond program .
This Kizuna iteration marks the first time Tokio Marine has used
the relatively new Singapore domicile for the issuance . The
series of notes covers the sponsor for Japan earthquake risk on
an aggregate indemnity basis . The structure of the program is
similar to previous Kizuna transactions which allows for a three-
year aggregate accumulation of losses within a 5-year overall
term of the notes . The transaction marketed for $150 million
of capacity at an initial price guidance of 2 .25% to 2 .50%;
however, due to strong investor support for the peril/region and
structure, it priced at a 2 .00% risk interest spread .
Sakura Re Ltd .
Sompo Japan and Sompo International came to market
with Sakura Re Series 2021-1 in Q1 . Sompo Japan has been
a consistent cat bond sponsor, with Sakura Re being their
fourth time accessing the cat bond market since 2014 . Sakura
Re represents the initial foray into the cat bond market for
the current Sompo International Group and the first joint
issuance by the newly combined entities of Sompo Japan and
Sompo International .
The transaction offered a progressive multi peril and multi
region structure with second event limit sharing features
between Sompo Japan and Sompo International subject
business . The unique structural feature incorporated into
the bond acts as a quasi-reinstatement feature that enables
additional limit of capacity to be accessed following an
initial large Japan typhoon or US earthquake from the
alternate class of notes . In addition, the business mix of the
US earthquake exposure was exclusively commercial and
industrial lines of business, which are underrepresented risks
in the cat bond market .
The transaction was issued across two classes of notes,
with Class A primarily covering Japan typhoons and Class B
primarily covering US earthquakes, both on an indemnity,
occurrence basis . The Class A notes priced below the
guidance at 2 .25% and the Class B notes priced just below
the mid point at 4 .00% . Each class was initially marketed at
$100 million but were upsized to $200 million due to strong
investor support .

12
Exhibit 6: Q1 2021 catastrophe bond issuance
Beneficiary Issuer Series ClassIssue Size (USD million)
Covered Perils Trigger Recovery Collateral
Bayview MSR Opportunity Master Fund, L .P .
Sierra Ltd . Series 2021-1 Class A $150 .00 US EQ Parametric
Index Occurrence MMF
Bayview MSR Opportunity Master Fund, L .P .
Sierra Ltd . Series 2021-1 Class B $50 .00 US EQ Parametric
Index Occurrence MMF
Federal Emergency Management Agency
FloodSmart Re Ltd .
Series 2021-1 Class A $450 .00 US, DC, PR,
VI: FL Indemnity Occurrence MMF
Federal Emergency Management Agency
FloodSmart Re Ltd .
Series 2021-1 Class B $125 .00 US, DC, PR,
VI: FL Indemnity Occurrence MMF
California Earthquake Authority
Ursa Re Ltd . Series 2021-1 Class F $215 .00 CAL EQ Indemnity Annual
Aggregate MMF
North Carolina Insurance Underwriting Association
Cape Lookout Re Ltd .
Series 2021-1 Class A $250 .00 NC NS, ST Indemnity Annual
Aggregate MMF
Security First Insurance Company
First Coast Re III Pte . Ltd .
Series 2021-1 Class A $225 .00 FL NS, ST Indemnity Occurrence
Cascading MMF
Universal Property and Casualty Insurance Company (UPCIC)
Cosaint Re Pte . Series 2021-2 Class A $150 .00
US NS: AL, DE, FL, GA, HI, IL, IN, IA, MD . MA, MI, MN, NH, NJ, NY, NC, PA, SC, TN, VA, WI
Indemnity Occurrence MMF
Tokio Marine & Nichido Fire Insurance Co ., Ltd .
Kizuna Re III Pte . Ltd .
Series 2021-1 Class A $150 .00 JP EQ Indemnity Aggregate MMF
Sompo Japan Insurance & affiliates
Sakura Re Ltd . Series 2021-1 Class A $200 .00
JP EQ, Typhoon and Flood, US EQ
Indemnity Occurrence MMF
Sompo Japan Insurance & affiliates
Sakura Re Ltd . Series 2021-1 Class B $200 .00
JP EQ, Typhoon and Flood, US EQ
Indemnity Occurrence MMF
Palomar Specialty Insurance Company
Torrey Pines Re Ltd .
Series 2021-1 Class A $200 .00 US EQ Indemnity Occurrence MMF
Palomar Specialty Insurance Company
Torrey Pines Re Ltd .
Series 2021-1 Class B $200 .00 US EQ Indemnity Occurrence MMF
State Farm Fire and Casualty Company
Merna Re II Ltd . Series 2021-1 Class A $350 .00
50 US States, DC, excl . CA, FL, TX
Indemnity Occurrence MMF
Total $2,915.00
Source: Aon Securities LLC

ILS Annual Report 2021 13
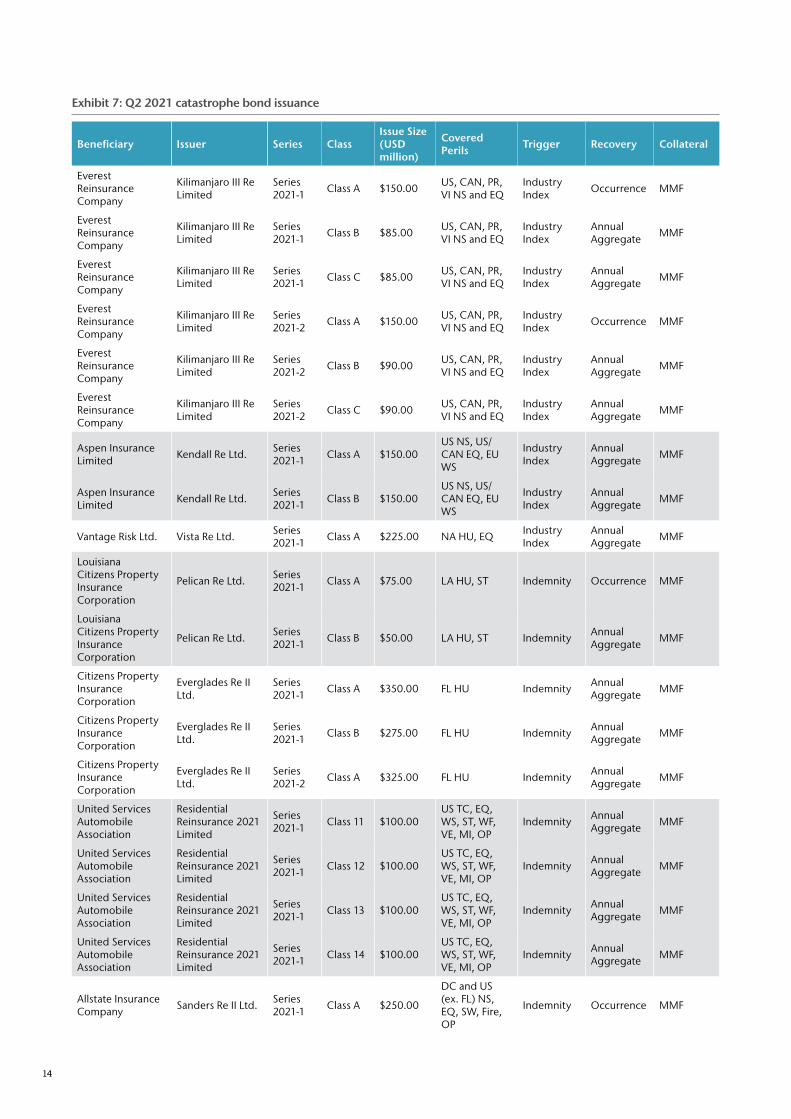
Q2 2021
Everglades Re II Ltd . 2021-1 and 2021-2
Florida Citizens returned to the catastrophe bond market
with its largest issuance since 2014 and largest transaction in
the market in the period under review .
Split across two Series and three Classes, the Everglades
Re II Ltd . 2021-1 and 2021-2 notes secured $950 million of
indemnity coverage on an annual aggregate basis for Florida
Citizens’ Coastal and Personal Lines Accounts to cover Florida
Hurricane risk, providing a key pillar of Florida Citizen’s risk
transfer program going into the 2021 Atlantic hurricane
season . All note classes priced at the tight end of guidance,
the Class A-1 and A-2 notes priced at 5 .75% and the Class B-1
notes priced at 6 .75% .
Kilimanjaro III Re Ltd . 2021-1 and 2021-2
Everest Re returned to the bond market with six tranches of
Kilimanjaro Re III Ltd . 2021-1 and 2021-2 notes, to maintain its
status as the largest sponsor of retrocessional bonds globally .
The bonds replace part of its maturing US and Canada multi-
peril retrocession cat bonds .
A total limit of $650 million was purchased, across a range
of risk levels and triggers (aggregate and occurrence) . Like
other recent issuances from Everest Re, Kilimanjaro III Re 2021
placement features two series, each with three tranches of
notes, with the only difference being tenure of coverage . This
allows Everest Re to stagger bond renewals and allows the
company to test investor appetite over time .
All note classes priced below the guidance, the Class A-1 and
A-2 notes priced at 11 .25%, the Class B-1 and B-2 notes priced
at 4 .50%, and the Class C-1 and C-2 notes priced at 4 .25% .
Sanders Re II Ltd . 2021-1
Allstate is a regular issuer of cat bonds, with this representing
the fourteenth Sanders Re Ltd . tranche ceded to the market .
Sanders Re II Ltd . issued a single tranche of notes, with a target
issuance size of $200 million, which upsized to $250 million .
The notes provide Allstate and subsidiaries with four years of
indemnity protection on a per occurrence basis . The notes
are exposed to US named storm, earthquake, severe weather,
wildfires and other perils, but will not cover Florida and
priced at tight end of guidance (3 .50% risk interest spread) .
Herbie Re Ltd . 2021-1
This third catastrophe bond transaction sponsored by Fidelis,
in fairly quick succession, secured annual aggregate
cover on a global basis, resulting in the broadest set of perils
and geographies covered in an industry loss index bond
at the time of issuance . Herbie Re Ltd ., Fidelis’ Bermuda-
domiciled special purpose insurer, issued a single tranche of
4-year annual aggregate Series 2021-1 Notes, with coverage
resembling a worldwide ILW .
The covered perils and regions included: North America
named storm and earthquake, US severe thunderstorm, US
wildfires, US winter storms, US Caribbean earthquake, Japan
typhoon, Japan earthquake, Canada severe storm, Canada
winter storm, European windstorm, Italy earthquake, Turkey
earthquake, Australia earthquake, Australia tropical cyclone,
and New Zealand earthquake .
The transaction tripled in size during marketing to $150
million and priced below initial guidance at 17 .25% .
Lion III Re DAC
Assicurazioni Generali S .p .A . returned to the bond market for
its third Lion reinsurance transaction . The first catastrophe
bond to have specific ‘green’ features incorporated, to
match the ethos and initiatives of the company . Generali is
committed to the green ILS framework it has created . With
an Irish-domiciled SPV, a single tranche of notes issued for
(Euro) €200 million . The notes provide Generali four years
of indemnity per occurrence reinsurance protection against
losses from European windstorms and Italian earthquakes .
Green and ESG credentials may have assisted the marketing of the
bond, which placed below the tight end of guidance at 3 .50% .
Baldwin Re Ltd . 2021
Debut catastrophe bond for Vermont Mutual Insurance
Company and affiliates, with a single Series 2021-1 Class A
tranche of notes upsized to $150 million, covering indemnity
losses from catastrophe events in the US Northeast; named
storms, earthquake, severe weather and fire .
The notes closed below the tight end of pricing, at 2 .25% .
Titania Re Ltd . 2021
The first catastrophe bond issued by Lloyd’s syndicate Ariel Re
1910 in a single $150 million tranche of notes, to cover US and
Canada named storms and earthquake . The notes contained an
industry loss index trigger providing annual aggregate protection
and priced below the tight end of guidance at 4 .50% .
14
Exhibit 7: Q2 2021 catastrophe bond issuance
Beneficiary Issuer Series ClassIssue Size (USD million)
Covered Perils Trigger Recovery Collateral
Everest Reinsurance Company
Kilimanjaro III Re Limited
Series 2021-1 Class A $150 .00 US, CAN, PR,
VI NS and EQIndustry Index Occurrence MMF
Everest Reinsurance Company
Kilimanjaro III Re Limited
Series 2021-1 Class B $85 .00 US, CAN, PR,
VI NS and EQIndustry Index
Annual Aggregate MMF
Everest Reinsurance Company
Kilimanjaro III Re Limited
Series 2021-1 Class C $85 .00 US, CAN, PR,
VI NS and EQIndustry Index
Annual Aggregate MMF
Everest Reinsurance Company
Kilimanjaro III Re Limited
Series 2021-2 Class A $150 .00 US, CAN, PR,
VI NS and EQIndustry Index Occurrence MMF
Everest Reinsurance Company
Kilimanjaro III Re Limited
Series 2021-2 Class B $90 .00 US, CAN, PR,
VI NS and EQIndustry Index
Annual Aggregate MMF
Everest Reinsurance Company
Kilimanjaro III Re Limited
Series 2021-2 Class C $90 .00 US, CAN, PR,
VI NS and EQIndustry Index
Annual Aggregate MMF
Aspen Insurance Limited Kendall Re Ltd . Series
2021-1 Class A $150 .00US NS, US/CAN EQ, EU WS
Industry Index
Annual Aggregate MMF
Aspen Insurance Limited Kendall Re Ltd . Series
2021-1 Class B $150 .00US NS, US/CAN EQ, EU WS
Industry Index
Annual Aggregate MMF
Vantage Risk Ltd . Vista Re Ltd . Series 2021-1 Class A $225 .00 NA HU, EQ Industry
IndexAnnual Aggregate MMF
Louisiana Citizens Property Insurance Corporation
Pelican Re Ltd . Series 2021-1 Class A $75 .00 LA HU, ST Indemnity Occurrence MMF
Louisiana Citizens Property Insurance Corporation
Pelican Re Ltd . Series 2021-1 Class B $50 .00 LA HU, ST Indemnity Annual
Aggregate MMF
Citizens Property Insurance Corporation
Everglades Re II Ltd .
Series 2021-1 Class A $350 .00 FL HU Indemnity Annual
Aggregate MMF
Citizens Property Insurance Corporation
Everglades Re II Ltd .
Series 2021-1 Class B $275 .00 FL HU Indemnity Annual
Aggregate MMF
Citizens Property Insurance Corporation
Everglades Re II Ltd .
Series 2021-2 Class A $325 .00 FL HU Indemnity Annual
Aggregate MMF
United Services Automobile Association
Residential Reinsurance 2021 Limited
Series 2021-1 Class 11 $100 .00
US TC, EQ, WS, ST, WF, VE, MI, OP
Indemnity Annual Aggregate MMF
United Services Automobile Association
Residential Reinsurance 2021 Limited
Series 2021-1 Class 12 $100 .00
US TC, EQ, WS, ST, WF, VE, MI, OP
Indemnity Annual Aggregate MMF
United Services Automobile Association
Residential Reinsurance 2021 Limited
Series 2021-1 Class 13 $100 .00
US TC, EQ, WS, ST, WF, VE, MI, OP
Indemnity Annual Aggregate MMF
United Services Automobile Association
Residential Reinsurance 2021 Limited
Series 2021-1 Class 14 $100 .00
US TC, EQ, WS, ST, WF, VE, MI, OP
Indemnity Annual Aggregate MMF
Allstate Insurance Company Sanders Re II Ltd . Series
2021-1 Class A $250 .00
DC and US (ex . FL) NS, EQ, SW, Fire, OP
Indemnity Occurrence MMF

ILS Annual Report 2021 15
Beneficiary Issuer Series ClassIssue Size (USD million)
Covered Perils Trigger Recovery Collateral
Great American Insurance Company
Riverfront Re Ltd . - Class A $235 .00US, DC, CAN NS, EQ, ST, WS, WF, VE, MI
Indemnity Occurrence MMF
Great American Insurance Company
Riverfront Re Ltd . - Class B $70 .00US, DC, CAN NS, EQ, ST, WS, WF, VE, MI
Indemnity Occurrence MMF
Fidelis Insurance Bermuda Limited Herbie Re Ltd . Series
2021-1 Class A $150 .00
US/CAN: NS EQ ST WS, US: WF, JP: TY EQ, EU: Wind, IT, TRK, AU, NZ: EQ, AU: TC
Industry Index
Annual Aggregate MMF
St . Johns Insurance Company
Putnam Re Pte . Ltd .
Series 2021-1 Class A $120 .00 FL and SC NS Indemnity Occurrence MMF
Texas Windstorm Insurance Association
Alamo Re Ltd . Series 2021-1 Class A $500 .00 TX NS, ST Indemnity Annual
Aggregate MMF
Syndicate 1910 (Ariel Re) Titania Re Ltd . Series
2021-1 Class A $150 .00US, DC, PR, VI, CAN: NS and EQ
Industry Index
Annual Aggregate MMF
Liberty Mutual Insurance Company
Mystic Re IV Ltd . Series 2021-2 Class A $225 .00
US, CAN, Caribbean NS, EQ
Indemnity Occurrence MMF
Liberty Mutual Insurance Company
Mystic Re IV Ltd . Series 2021-2 Class B $75 .00
US, CAN, Caribbean NS, EQ
Indemnity Occurrence MMF
Gryphon Mutual Insurance Company
Wrigley Re Ltd . Series 2021-1 Class A $50 .00 CA EQ Parametric Occurrence MMF
Tokio Marine & Nichido Fire Insurance Co ., Ltd .
Umigame Re Pte Ltd .
Series 2021-1
Class A-1 $100 .00 JP Typhoon
and Flood Indemnity Occurrence MMF
Tokio Marine & Nichido Fire Insurance Co ., Ltd .
Umigame Re Pte Ltd .
Series 2021-1
Class A-2 $50 .00 JP Typhoon
and Flood Indemnity Occurrence MMF
Tokio Marine & Nichido Fire Insurance Co ., Ltd .
Umigame Re Pte Ltd .
Series 2021-1 Class B $50 .00 JP Typhoon
and Flood Indemnity Occurrence MMF
State Farm Florida Insurance Company
Merna Re II Ltd . Series 2021-2 Class A $300 .00
US FL NS and Convective Storm
Indemnity Occurrence MMF
Assicurazioni Generali S .p .A Lion III Re DAC - - $239 .00 EU WS and
IT EQ Indemnity Occurrence EBRD
Vermont Mutual Insurance Com-pany
Baldwin Re Ltd . Series 2021-1 Class A $150 .00
CT, ME, MA, NH, NY, RI, and VT: NS, EQ, ST, WF, and other perils events
Indemnity Occurrence MMF
Renaissance Reinsurance Ltd . & DaVinci Reinsurance Ltd .
Mona Lisa Re Ltd . Series 2021-1 Class A $250 .00
NS: US, DC, PR USVI; EQ: US, DC, Canada, PR, USVI
Industry Index
Annual Aggregate MMF
Total $5,614.00
Source: Aon Securities LLC
Exhibit 7: Q2 2021 catastrophe bond issuance (continued)

16
Secondary Market Overview
Q3 2020 Historically, the third quarter of the year is the lightest by
traded volume compared to the rest of the year as primary
issuance halts and investors monitor the waters during
hurricane season . This was true once again as offers were
scarce, especially compared to the prior quarter when
COVID-19 escalated and some investors liquidated pieces
of their ILS portfolios . Because of the low volume of offers,
some investors were more permissive to increase their bids,
and, in some cases, we saw bonds trade at premiums . Over
the course of the quarter, secondary spreads tightened
moderately, a healthy response to the initial widening caused
by COVID-19 . This tightening of spreads was not the case for
every cat bond, as some widened as their aggregate towers
were eroded by the various events this summer including
California Wildfires, Hurricanes Isaias, Laura and Sally, as well
as the derecho in Iowa .
Q4 2020As the primary issuance pipeline picked up after a quiet Q3,
so did the volume of trading, which consistently increased
over the course of the quarter . Secondary spreads continued
to rebound moderately as they reflected the rates achieved
in the primary market . Index based transactions made
up approximately 75% of the new issuances and 45% of
secondary trades in December, despite only representing
approximately one third of the outstanding cat bond market
at the time .
Q1 2021Capital inflows and $2 .06 billion in maturities created a
wave of demand for cat bonds in the first quarter of 2021 .
$2 .57 billion of primary issuances, the third most for a first
quarter in 10 years, could not meet the increasing demand
and investors turned to the secondary market in search of
bonds . Investors were looking to put cash to work, but the
market was mostly one-sided . As the quarter progressed
and the primary market reopened, more offers came and
trading gradually increased, but remained quiet compared
to past quarters . Spreads tightened to levels last seen
in early 2019 and were down approximately 15-20% on
average from last year’s wides that were a result of the initial
COVID-19 outbreak . Some aggregate bonds that had already
seen losses building from past 2020 events traded at large
discounts following the winter storms in Texas, but overall,
the market tightened .
Q2 2021As the issuance pipeline brought twenty transactions, a
near record for the most cat bond issuances in a quarter, the
secondary market began seeing more offers with investors
rebalancing their portfolios . The market consistently saw 20+
trades on a weekly basis starting in mid-April and secondary
spreads followed the tightening seen in the primary market
as trades were often executed through the offer side of most
pricing sheets . Towards the end of June, spreads started to
consolidate around levels last seen in 2018, approximately
15-20% tighter than this time last year . Bonds facing potential
losses from 2020 events saw improved reporting through
the quarter . Some traded as a result of the positive news
while others saw their indicative prices increase to reflect the
positive reports .

ILS Annual Report 2021 17
COVID-19
COVID-19’s coinciding impact to a natural disaster response
from a humanitarian perspective was enormous . World
organizations such as the United Nations (UN) pleaded for
financial support and volunteers to help people in need .
The insurance industry was faced with enormous challenges
in trying to accelerate the claims process while balancing
multiple large-scale disasters, pending litigation from
COVID-19 related incidents, increased replacement costs due
to a disrupted supply chain, and other complex scenarios .
However, the re/insurance industry managed to weather the storm successfully as continued strong capitalization allowed all disasters to be comfortably managed where cover was in place.
Perhaps the biggest takeaway from 2020 was the recognition
of how concurrent events can have major global implications .
These “compounded” or “connected extremes” will provide
critical learning opportunities for better planning as the
world becomes increasingly complex and faces growing
or emerging risks . 2020 also highlighted topics such as the
protection gap to address the underserved, increasingly
vulnerable populations, the need for additional investment
around risk mitigation strategies to navigate new forms of
volatility, and the growing influence from climate change on
daily life .
Source: Aon – Impact Forecasting – Weather, Climate & Catastrophe Insight – 2020 Annual Report

18
71%
4%
16%
10%
Capital Providers Over the past twelve months, many investors accumulated
a considerable amount of fresh capital from maturities and
continued success in capital raising . Particularly, ILS Funds
and Institutional Investors raised significant capital as their
investors continued to focus on the diversifying nature and
liquidity benefits of cat bonds . Together, the two provided
approximately 87% of the total capacity for new issuances
brought to market by Aon Securities during the period under
review and Institutional Investors recorded an increase in
market share from 11% to 16% . Despite reinsurers decreasing
their level of contribution over the past twelve months and
Multi-Strategy Funds’ contribution remaining constant, both
were meaningful supporters of the approximately $13 billion
of new issuances over the last four quarters .
Exhibit 8a and 8b: Investors by category (years ending June 30)
Capital SourcesSwitzerland and France saw their contribution to new
issuances brought to market by Aon Securities increase as
many European UCITS funds continued to be very successful
in their capital raising efforts over the past twelve months .
The US and UK’s contribution remained stable year-over-
year and the “Other” category, encompassing investors from
Canada, Germany, Japan and Sweden, marginally decreased
by a percentage point . Bermuda also saw its market
contribution decrease compared to other countries .
74%4%
11%
11%
ILS Transaction Activity
ILS Fund
Institution Multi-Strat Fund
Reinsurer
ILS Fund
Institution Multi-Strat Fund
Reinsurer
2021
2020
46%9%
23%
6% 8%8%
46%
12%
20%
7% 8%
7%
UK
US France
Bermuda Switzerland Other
UK
US France
Bermuda Switzerland Other
2021
2020
Source: Aon Securities LLC Source: Aon Securities LLC
Exhibit 9a and 9b: Investors by country/region (years ending June 30)
ILS Annual Report 2021 19
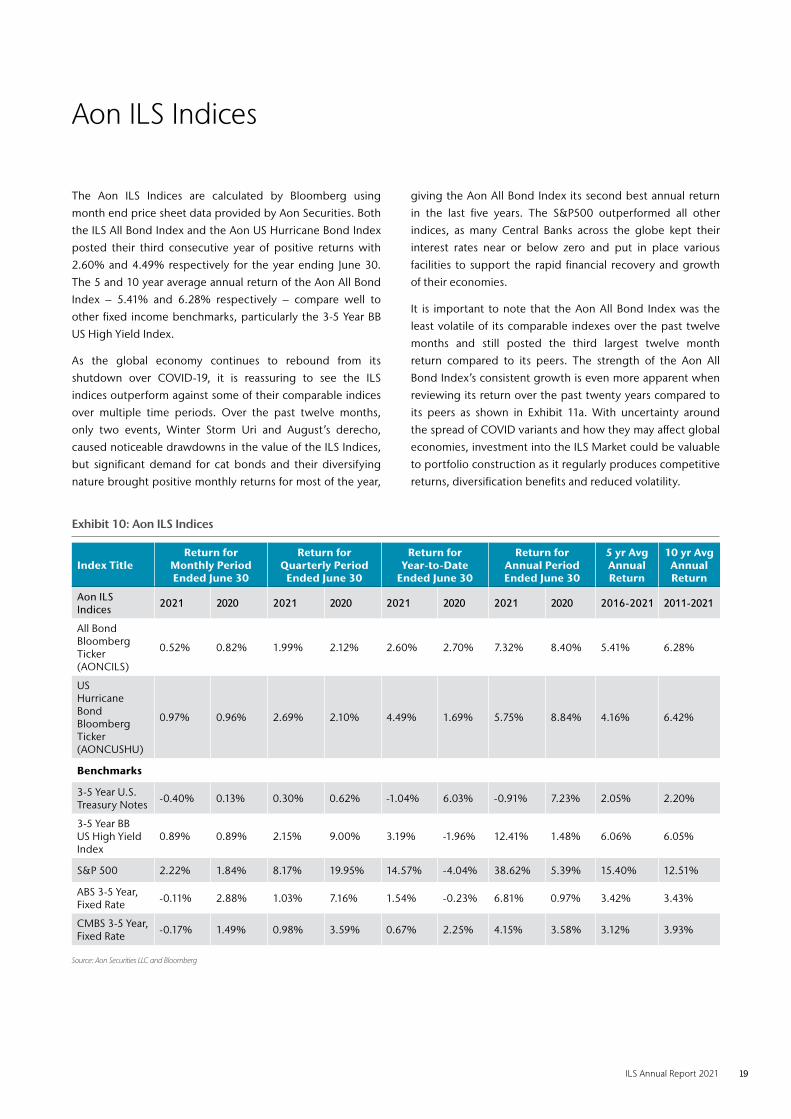
Aon ILS Indices
The Aon ILS Indices are calculated by Bloomberg using
month end price sheet data provided by Aon Securities . Both
the ILS All Bond Index and the Aon US Hurricane Bond Index
posted their third consecutive year of positive returns with
2 .60% and 4 .49% respectively for the year ending June 30 .
The 5 and 10 year average annual return of the Aon All Bond
Index – 5 .41% and 6 .28% respectively – compare well to
other fixed income benchmarks, particularly the 3-5 Year BB
US High Yield Index .
As the global economy continues to rebound from its
shutdown over COVID-19, it is reassuring to see the ILS
indices outperform against some of their comparable indices
over multiple time periods . Over the past twelve months,
only two events, Winter Storm Uri and August’s derecho,
caused noticeable drawdowns in the value of the ILS Indices,
but significant demand for cat bonds and their diversifying
nature brought positive monthly returns for most of the year,
giving the Aon All Bond Index its second best annual return
in the last five years . The S&P500 outperformed all other
indices, as many Central Banks across the globe kept their
interest rates near or below zero and put in place various
facilities to support the rapid financial recovery and growth
of their economies .
It is important to note that the Aon All Bond Index was the
least volatile of its comparable indexes over the past twelve
months and still posted the third largest twelve month
return compared to its peers . The strength of the Aon All
Bond Index’s consistent growth is even more apparent when
reviewing its return over the past twenty years compared to
its peers as shown in Exhibit 11a . With uncertainty around
the spread of COVID variants and how they may affect global
economies, investment into the ILS Market could be valuable
to portfolio construction as it regularly produces competitive
returns, diversification benefits and reduced volatility .
Exhibit 10: Aon ILS Indices
Index TitleReturn for
Monthly PeriodEnded June 30
Return for Quarterly Period
Ended June 30
Return for Year-to-Date
Ended June 30
Return for Annual PeriodEnded June 30
5 yr Avg Annual Return
10 yr Avg Annual Return
Aon ILS Indices 2021 2020 2021 2020 2021 2020 2021 2020 2016-2021 2011-2021
All Bond Bloomberg Ticker (AONCILS)
0 .52% 0 .82% 1 .99% 2 .12% 2 .60% 2 .70% 7 .32% 8 .40% 5 .41% 6 .28%
US Hurricane Bond Bloomberg Ticker (AONCUSHU)
0 .97% 0 .96% 2 .69% 2 .10% 4 .49% 1 .69% 5 .75% 8 .84% 4 .16% 6 .42%
Benchmarks
3-5 Year U .S . Treasury Notes -0 .40% 0 .13% 0 .30% 0 .62% -1 .04% 6 .03% -0 .91% 7 .23% 2 .05% 2 .20%
3-5 Year BB US High Yield Index
0 .89% 0 .89% 2 .15% 9 .00% 3 .19% -1 .96% 12 .41% 1 .48% 6 .06% 6 .05%
S&P 500 2 .22% 1 .84% 8 .17% 19 .95% 14 .57% -4 .04% 38 .62% 5 .39% 15 .40% 12 .51%
ABS 3-5 Year, Fixed Rate -0 .11% 2 .88% 1 .03% 7 .16% 1 .54% -0 .23% 6 .81% 0 .97% 3 .42% 3 .43%
CMBS 3-5 Year, Fixed Rate -0 .17% 1 .49% 0 .98% 3 .59% 0 .67% 2 .25% 4 .15% 3 .58% 3 .12% 3 .93%
Source: Aon Securities LLC and Bloomberg

20
Exhibit 11a: Aon All Bond Index versus financial benchmarks
-50%
50%
150%
250%
350%
450%
550%
650%
Jun-
02
Jun-
03
Jun-
04
Jun-
05
Jun-
06
Jun-
07
Jun-
08
Jun-
09
Jun-
10
Jun-
11
Jun-
12
Jun-
13
Jun-
14
Jun-
15
Jun-
16
Jun-
17
Jun-
18
Jun-
19
Jun-
20
Jun-
21
Source: Aon Securities LLC and Bloomberg
Exhibit 11b: Historical performance of Aon ILS Indices
Source: Aon Securities LLC and Bloomberg
-50%
0%
50%
100%
150%
200%
250%
300%
350%
400%
Dec
-00
Jun-
01D
ec-0
1Ju
n-02
Dec
-02
Jun-
03D
ec-0
3Ju
n-04
Dec
-04
Jun-
05D
ec-0
5Ju
n-06
Dec
-06
Jun-
07D
ec-0
7Ju
n-08
Dec
-08
Jun-
09D
ec-0
9Ju
n-10
Dec
-10
Jun-
11D
ec-1
1Ju
n-12
Dec
-12
Jun-
13D
ec-1
3Ju
n-14
Dec
-14
Jun-
15D
ec-1
5Ju
n-16
Dec
-16
Jun-
17D
ec-1
7Ju
n-18
Dec
-18
Jun-
19D
ec-1
9Ju
n-20
Dec
-20
Jun-
21
Aon ILS Index
AONCUS HU Index
Aon ILS Index
3-5 Yr BB US High Yield Index HFRX Global Hedge Fund Index
S&P 500 Total Return Index
3-5 Yr US Fix ABS ICE BofAML 3-5 Years US Fixed Rate

ILS Annual Report 2021 21
ILS Related Markets
As of H1 2021, Aon estimates the total ILS capital markets
capacity to be $97 billion which is comprised of Collateralized
Reinsurance, Catastrophe Bonds, ILW, and Sidecars . This total
value represents an increase of approximately $3 billion from
last year’s estimate at the time of writing .
Prior to the COVID-19 pandemic outbreak, a large portion of
the ILS investor universe were experiencing favorable capital
positions and positive fund flows; with the success of the
vaccination programs worldwide, investor confidence seems
to have continued where it left off .
The market has bounced back from the impact of recent
natural catastrophe losses and COVID-19 uncertainty, to
show healthy growth in supply . The bond market saw a
record annual issuance in 2020 of around $11 billion, over
double the $5 .4 billion issued in 2019 .
Exhibit 12: Alternative market development
5 7 8 1117
22 19 22 24 28
4450
6472
8089
97 95 94 97
0
10
20
30
40
50
60
70
80
90
100
Lim
it U
SD b
illio
ns
Source: Aon Securities LLC
Exhibit 13: Global reinsurer capital
Source: Individual Company Reports, Aon Reinsurance Solutions, Aon Securities LLC
4%5% 6% 6%
5%6%
9% 9%
11%13%
14%15%
17% 15%
14% 15%
0%
2%
4%
6%
8%
10%
12%
14%
16%
18%
0
100
200
300
400
500
600
700
USD
bill
ion
s
Collateralized Re and Other
Sidecars ILW
Catastrophe Bonds
Traditional Capital
Alternative Capital Share of Total Reinsurance Capital
Alternative Capital

22
Collateralized Reinsurance Market TrendsAon expects the Collateralized Reinsurance segment to
continue to expand, as capital continues to flow into the
sector targeting a variety of strategies . Although the segment
continues to form the largest part of the ILS market by
capacity volume, some investors have allocated additional
capital into more liquid, tradeable instruments .
Investor appetite for collateralized reinsurance can be more
sensitive to loss activity than catastrophe bonds, due to the
propensity for losses at lower return periods .
Funds looking to deploy reinsurance and retrocession
capacity continue to target fronters or establish their own
rated platform with market leading credit ratings, to leverage
the strength of these balance sheets .
Sidecars From H1 2020 to H1 2021, Aon Securities estimates that the
Sidecar market has increased from $6 .8 billion to $8 billion .
Generally, demand from cedents continues to outmatch capital
supply from investors, despite this increase in limit .
The Sidecar market had previously been trending downwards,
with recent catastrophe loss activity and the COVID-19 outbreak
causing further flight from the asset class . However, the impact
of COVID-19 has been diluted due to the stabilisation of loss
positions . The most material impact has been seen in Europe,
where business interruption contractual coverage tended to
be most expansive; thus, Sidecars with limited commercial
European business tended to outperform the market .
One notable development in January 2021 was Peak Re
successfully upsizing their Lion Rock Re Retrocessional Sidecar
from $77 million to $107 million . Still the only Sidecar in Asia,
Lion Rock Re allows Peak Re fluid access to the capital markets .
2021 winter storm Uri, in the southern states of the US, added
material unmodeled loss to a number of Sidecar portfolios,
providing for further discussions between fund managers and
investors . Veteran Sidecar sponsors continued to fortify their
relationships with the capital markets with repeat issuances,
however some were required to compromise on terms to
achieve scale .
Historically, the Sidecar market has been weighted towards
portfolios of reinsurance treaties concentrated in US peak
perils, namely Florida hurricane and California earthquake . As
alternative capital continues to migrate down the risk chain,
many investors are drawn to sharing the underwriting result
of quality writers of globally distributed portfolios, helping to
diversify away from peak peril exposures .
Sidecars continue to offer strategic value to (re)insurer sponsors
by providing a third party capital platform with increasing
benefits over the medium to long-term . Given the ongoing
potential pricing dislocation following the catastrophe events
of the last five years, leveraging all capital sources has become
increasingly important to sponsors . Demand for third party
capital therefore remains strong; however, this materially
outweighs capital supply at the moment .
ILS Annual Report 2021 23
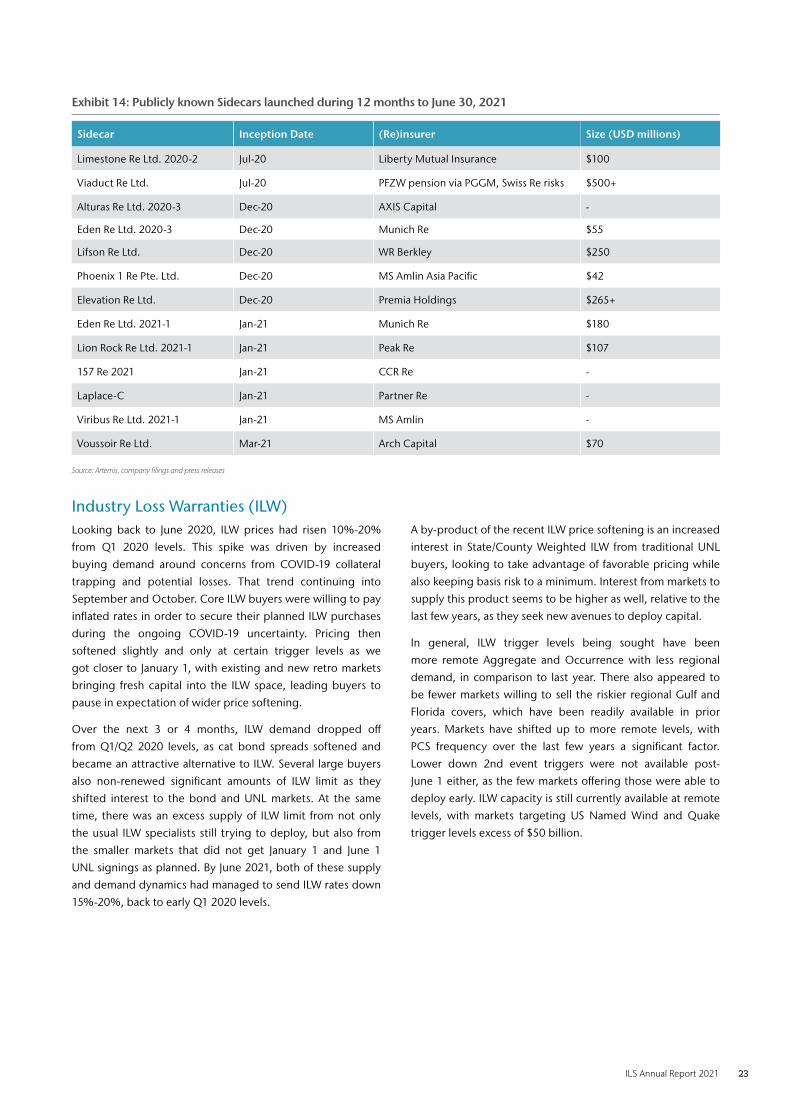
Exhibit 14: Publicly known Sidecars launched during 12 months to June 30, 2021
Sidecar Inception Date (Re)insurer Size (USD millions)
Limestone Re Ltd . 2020-2 Jul-20 Liberty Mutual Insurance $100
Viaduct Re Ltd . Jul-20 PFZW pension via PGGM, Swiss Re risks $500+
Alturas Re Ltd . 2020-3 Dec-20 AXIS Capital -
Eden Re Ltd . 2020-3 Dec-20 Munich Re $55
Lifson Re Ltd . Dec-20 WR Berkley $250
Phoenix 1 Re Pte . Ltd . Dec-20 MS Amlin Asia Pacific $42
Elevation Re Ltd . Dec-20 Premia Holdings $265+
Eden Re Ltd . 2021-1 Jan-21 Munich Re $180
Lion Rock Re Ltd . 2021-1 Jan-21 Peak Re $107
157 Re 2021 Jan-21 CCR Re -
Laplace-C Jan-21 Partner Re -
Viribus Re Ltd . 2021-1 Jan-21 MS Amlin -
Voussoir Re Ltd . Mar-21 Arch Capital $70
Source: Artemis, company filings and press releases
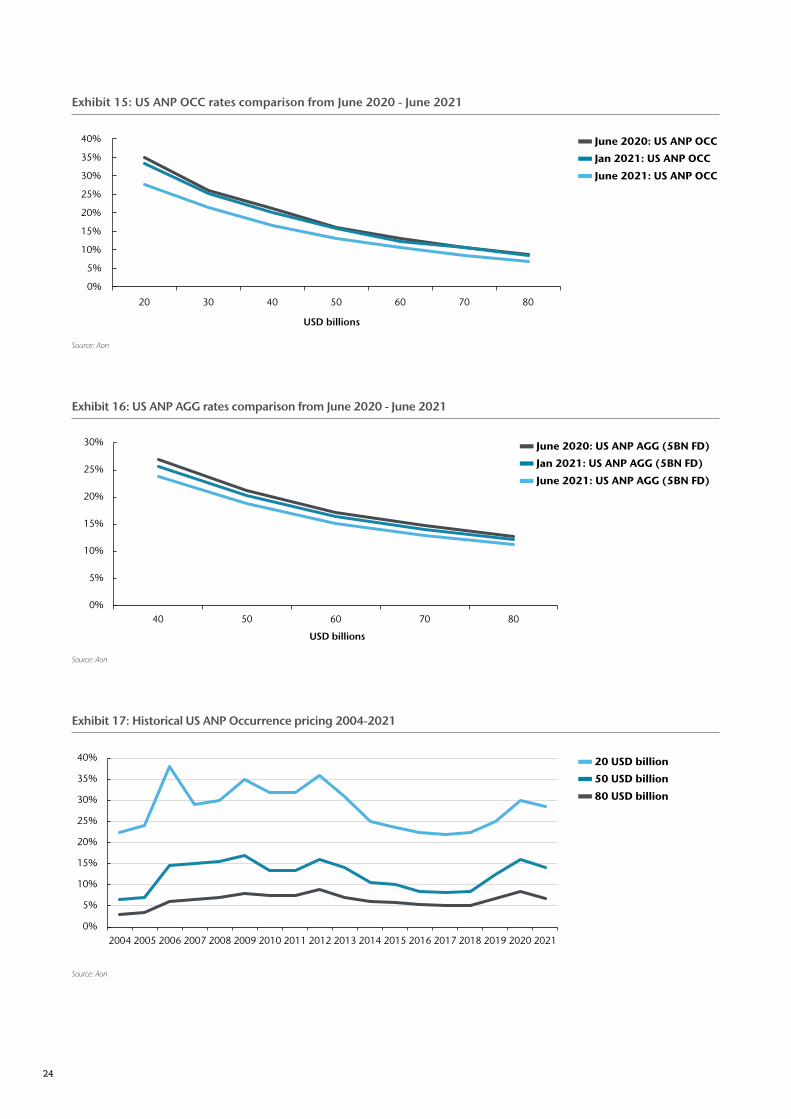
Industry Loss Warranties (ILW)Looking back to June 2020, ILW prices had risen 10%-20%
from Q1 2020 levels . This spike was driven by increased
buying demand around concerns from COVID-19 collateral
trapping and potential losses . That trend continuing into
September and October . Core ILW buyers were willing to pay
inflated rates in order to secure their planned ILW purchases
during the ongoing COVID-19 uncertainty . Pricing then
softened slightly and only at certain trigger levels as we
got closer to January 1, with existing and new retro markets
bringing fresh capital into the ILW space, leading buyers to
pause in expectation of wider price softening .
Over the next 3 or 4 months, ILW demand dropped off
from Q1/Q2 2020 levels, as cat bond spreads softened and
became an attractive alternative to ILW . Several large buyers
also non-renewed significant amounts of ILW limit as they
shifted interest to the bond and UNL markets . At the same
time, there was an excess supply of ILW limit from not only
the usual ILW specialists still trying to deploy, but also from
the smaller markets that did not get January 1 and June 1
UNL signings as planned . By June 2021, both of these supply
and demand dynamics had managed to send ILW rates down
15%-20%, back to early Q1 2020 levels .
A by-product of the recent ILW price softening is an increased
interest in State/County Weighted ILW from traditional UNL
buyers, looking to take advantage of favorable pricing while
also keeping basis risk to a minimum . Interest from markets to
supply this product seems to be higher as well, relative to the
last few years, as they seek new avenues to deploy capital .
In general, ILW trigger levels being sought have been
more remote Aggregate and Occurrence with less regional
demand, in comparison to last year . There also appeared to
be fewer markets willing to sell the riskier regional Gulf and
Florida covers, which have been readily available in prior
years . Markets have shifted up to more remote levels, with
PCS frequency over the last few years a significant factor .
Lower down 2nd event triggers were not available post-
June 1 either, as the few markets offering those were able to
deploy early . ILW capacity is still currently available at remote
levels, with markets targeting US Named Wind and Quake
trigger levels excess of $50 billion .
24
Exhibit 15: US ANP OCC rates comparison from June 2020 - June 2021
0%
5%
10%
15%
20%
25%
30%
35%
40%
20 30 40 50 60 70 80
USD billions
Source: Aon
Exhibit 16: US ANP AGG rates comparison from June 2020 - June 2021
Source: Aon
0%
5%
10%
15%
20%
25%
30%
40 50 60 70 80
USD billions
Exhibit 17: Historical US ANP Occurrence pricing 2004-2021
Source: Aon
0%
5%
10%
15%
20%
25%
30%
35%
40%
2004 2005 2006 2007 2008 2009 2010 2011 2012 2013 2014 2015 2016 2017 2018 2019 2020 2021
June 2020: US ANP OCC
Jan 2021: US ANP OCC
June 2021: US ANP OCC
June 2020: US ANP AGG (5BN FD)
Jan 2021: US ANP AGG (5BN FD)
June 2021: US ANP AGG (5BN FD)
20 USD billion
50 USD billion
80 USD billion

ILS Annual Report 2021 25
Private Catastrophe Bond PlacementsDuring the first half of 2021, the private placement cat
bond market witnessed a healthy resurgence of utilization
compared to recent years with 16 known deals placed in
the market through the end of June 2021 as compared to 12
deals through a similar time period during 2020 .
There was a record number of privately placed catastrophe
bond transactions issued in the first quarter of 2021 . The
dollar-value of issuance from these deals came in above the
ten-year average for the period .
Hence the market experienced larger issuance sizes for several
deals with the recent $250 million issuance of Artex’s Aquarelle
bonds, and a couple of Hannover Re sponsored Seaside
Re bonds at $40 million and $50 million, respectively . This
incremental shift to larger issuance sizes continues to prove
that syndicated deals are supported in the private market . The
notional limit of these larger syndicated deals through June
of 2021 represented 72% of total volume over that period
compared to 51% of total volume throughout all of 2020 .
Certain sponsors like Hamilton Re migrated from utilizing
ILS private placements in late December 2019 into a more
traditional cat bond format during late 2020 / early 2021 . This
demonstrates that private placements remain a constructive
way for ILS sponsors to incrementally form growing
relationships with the ILS market .
These types of private notes have traded in the secondary
market via trading desks affiliated with the placement agent
as well as independent secondary desks . Typically, investors
who can trade these notes are represented by most if not all
of the dedicated and sophisticated ILS managers operating
within the ecosystem .
Smaller non-syndicated notes also experienced strong
issuance, where many of these bonds are sponsored /
established by either the fund investing in the notes or
through a rated fronting entity providing this service,
within its broader leveraged fronting relationship with the
respective ILS fund . Typically, these notes are smaller in size
below $30 million, but can be larger . The ability to issue
smaller size deals opens the door for additional creative
solutions . For example, the private placement market
embraced ESG issues through a very small $3 million private
issuance (Dunant Re IC) backed by the Danish Red Cross to
cover parametric volcano risk whose payout would benefit
affected communities .
The last half of 2020 and the first half of 2021 provided
continued evidence that collateral extensions related to loss
events continue to work . Like traditional bonds, collateral
can be held beyond the risk maturity if loss occurrences are
approaching the trigger . During 2020, we witnessed quite
a few private bonds within Hannover Re’s Seaside program
extend their maturity to allow for further loss development .
The scheduled maturity for the notes were for January 2021,
and the maturity was extended further into 2021 .

26
Exhibit 18: Private placement notional and deal count (not all known) (years ending June 30)
Source: Artemis
$537$455
$670$797
$498
$662 $711
19
12
19
22
24
28
23
0
5
10
15
20
25
30
0
100
200
300
400
500
600
700
800
900
2015 2016 2017 2018 2019 2020 2021
Dea
l Cou
nt
Not
ion
al U
SD m
illio
ns
Exhibit 19: Private placements (Syndicated vs. Non-syndicated)1 (years ending June 30)
USD
mill
ions
0
10
20
30
40
50
60
70
80
90
100
2021202020192018201720162015
38%
62%
22%
78%
18%
82%
20%
80%
72%
28%
49%
51%
28%
72%
1 Syndicated private placement defined as being a series of notes > $30 million notional Source: Artemis
Syndicated Non-Syndicated
Notional Deal Count (Not All Known)

ILS Annual Report 2021 27
Exhibit 20: Private placement catastrophe bond transactions1
Date Issuer Series Size (USD millions) Trigger Peril
Jul-20 Randolph Re 2020-1 $50 .25 Indemnity California Fire
Jul-20 Eclipse Re Ltd . 2020-03A $16 .59 unknown Unknown Property Cat Risk
Jul-20 Eclipse Re Ltd . 2020-04A $40 .00 unknown Property Cat Risk
Sep-20 ILN SAC Ltd 2020-1 $10 .00 Industry Loss Index US Property Cat Risk
Oct-20 Artex SAC Limited Tenby $30 .00 unknown Property Cat Risk
Oct-20 Eclipse Re Ltd . 2020-06A $20 .00 unknown US Property Cat Risk
Oct-20 Cerulean Re SAC Ltd . 2020-B $12 .60 unknown Property Cat Risk
Jan-21 Seaside Re (Kaith Re) 2021-1 $23 .90 unknown US Property Cat Risk
Jan-21 Seaside Re (Kaith Re) 2021-11 $3 .75 unknown US Property Cat Risk
Jan-21 Seaside Re (Kaith Re) 2021-12 $5 .75 unknown US Property Cat Risk
Jan-21 Seaside Re (Kaith Re) 2021-21 $4 .00 unknown US Property Cat Risk
Jan-21 Seaside Re (Kaith Re) 2021-22 $4 .00 unknown US Property Cat Risk
Jan-21 Seaside Re (Kaith Re) 2021-23 $5 .00 unknown US Property Cat Risk
Jan-21 Seaside Re (Kaith Re) 2021-31 $40 .00 unknown US Property Cat Risk
Jan-21 Seaside Re (Kaith Re) 2021-41 $3 .75 unknown US Property Cat Risk
Jan-21 Seaside Re (Kaith Re) 2021-42 $6 .25 unknown US Property Cat Risk
Jan-21 Seaside Re (Kaith Re) 2021-51 $50 .00 unknown US Property Cat Risk
Jan-21 Eclipse Re Ltd . 2021-01A $80 .00 unknown Property Cat Risk
Mar-21 Dunant Re IC 2021-1 $3 .00 Parametric Volcano
Mar-21 Asago Asago III $18 .30 unknown Japan Earthquake
Apr-21 Eclipse Re Ltd . 2021-02A $8 .70 unknown Property Cat Risk
Apr-21 Isosceles Insurance Ltd . 2021-B1 $25 .00 unknown Property Cat Risk
May-21 Artex SAC Limited Aquarelle $250 .00 unknown Property Cat Risk
1 Note that not all Private Placement transaction information is availableSource: Artemis

28
Environmental, Social and Governance (ESG) & Socially Responsible Investment (SRI)The events of the last 18 months have dramatically
accelerated the shift towards ESG . COVID-19 and the recent
focus on social factors, while extreme temperatures, historic
and catastrophic flooding and political changes have
galvanized action on environmental issues . Indeed, a host of
stakeholders, including investors, insurers, regulatory bodies,
asset managers, and corporate issuers, have all increasingly
embraced ESG factors as part of their risk management
framework .
Drivers of ESG
InvestorsSurveys consistently show that ESG is increasingly important
to institutional investors . For example:
• The Synpulse ESG Market Study6 states that investor demand,
reputation, and risk management are key drivers of ESG . The
reality today, however, is that ESG is still in early stages of
application . Key areas of improvement include: Implementing
a framework more thoroughly and sustainably; Defining
tangible key performance indicators (KPIs) and measurable
goals; Enabling target oriented external and internal reporting .
• Natixis Asset Management found an 18% jump in
institutional investors implementing ESG between their
2019 and 2021 surveys, with the totals growing from 61
percent to 72 percent .7
We understand that there has been a significant increase in
dedicated responsible investment personnel in recent years .
In addition, the United Nations Principles for Responsible
Investment (PRI) continued to see growth in asset owner
signatories and assets under management .
Exhibit 21: Growth of asset owner signatories to the UN PRI
Source: UN PRI
Growth Areas within ILS
6 Synpulse ESG Market Study
7 Natixis, ESG investing survey insight report

ILS Annual Report 2021 29
8 Corelogic, 2020 climate change catastrophe report9 Aon, Impact Forecasting 10 Aon, Impact Forecasting11 UN PRI regulation database (The PRI, a UN-supported network of investors, works to promote sustainable investment through the
incorporation of Environmental, Social and Governance investment principles)12 UNEP FI, PSI TCFD global announcement
InsurersAs natural catastrophes and weather related events continue
to make headlines, they are also bringing more attention to
ESG . 2020 marked the sixth straight year with more than ten
weather and climate events surpassing $1 billion in economic
losses, according to CoreLogic8 . Aon’s own Weather, Climate &
Catastrophe Insight report found that natural disasters caused
$268 billion in global economic losses in 2020, $97 billion of
which was insured9 . In the United States, where 76 percent of
global losses were concentrated, the economic toll from natural
disasters surged 28 percent above the average of the past
decade .10 As a result of these and other ESG related risks, ratings
agencies like AM Best and DBRS Morningstar, among others,
now evaluate how well or how poorly insurers incorporate ESG
risk management . In addition, organizations like the Principles
for Sustainable Insurance have attracted firms around the world
who wish to formally embrace ESG .
Regulatory BodiesMore and more, regulatory bodies are homing in on
environmental, social and governance issues . The PRI11 has
identified more than 650 mandatory and voluntary ESG
regulations and disclosure requirements globally11 and that
number continues to grow . In addition, a wealth of disclosure
requirements coming online in the UK and under discussion
in the United States and Canada will compel firms to provide
more transparency around ESG and climate change risks and
opportunities .
Asset ManagersEarlier this year, we saw the implementation of the European
Union’s Sustainable Finance Disclosure Regulation (SFDR),
which included three classifications for investment funds to
help prevent greenwashing .
• Article 6 funds do not integrate sustainability practices into
their investment structure
• Article 8 funds are classified as “environmental and socially
promoting”
• Article 9 funds target sustainable investments
Given the increased interest in ESG and sustainability from
investors, these classifications could make it easier for
investors to understand the sustainability of the funds in
which they invest .
Corporate IssuersCorporate issuers must increasingly disclose exposure to
ESG risks through proxy statements, annual financial reports
and sustainability reporting . In addition to keeping up with
regulatory changes globally, this information influences
scores from the roughly two dozen ESG ratings providers,
which can influence everything from insurability to
recruitment to access to finance .
Insurance-linked Securities, Catastrophe Bonds and ESGWith stakeholders coalescing around ESG in such a profound
way, it is perhaps no surprise that ESG is rapidly evolving
within the world of Insurance Linked Securities (ILS) and
catastrophe bonds (cat bonds) . As investors increasingly
focus on ESG and sustainability in their investment decision-
making, the primary source of capital for ILS offerings is
pushing the industry to embrace ESG . In addition, as climate
change initiatives accelerate and global stakeholders look for
ways to manage the volatility caused by global warming, ILS
and cat bonds seem to have a natural role .
Environmental FactorsThe linkage between ILS and cat bonds to environmental
factors is not difficult to discern . ILS issuers must monitor
changes to the climate (rising ocean temperature, for
example) and evolving weather trends in order to determine
the probability of natural catastrophes . Efforts are currently
underway to help insurers and reinsurers better understand
their exposure to climate change, with the UN Principles
for Sustainable Insurance piloting a project to use the Task
Force for Climate Related Financial Disclosure (TCFD) as a
framework for assessing this evolving risk .12
The TCFD framework allows firms to focus on the environmental
risks due to climate change by focusing on the following four
pillars:
• Governance – how does the firm oversee and report on
climate change risk?
• Strategy – how do firms structure their risk management
strategy to mitigate the physical and operational/transitional
impacts of climate change, while also identifying business
opportunities created in the transition?
• Risk management - how does the firm assess and manage
climate change risks?

30
• Metrics and targets – what methodologies and data are behind
disclosed statistics and metrics, and how does the organization
plan to manage into a new climate-resilient paradigm?
Social FactorsILS and cat bonds have a social role to play as well . Over the
last ten years, we’ve witnessed the significant protection
gap that persists between developed and emerging
economies . For example, in the last decade only 12 percent
of economic losses in Asia were covered by insurance .
In Latin America and Africa, virtually all losses were
uninsured, leaving local populations dependent on federal
or international financial support to aid in recovery . The
expansion of tools like cat bonds, insurance-linked securities
and parametric coverage are just some of the tools that help
bridge the coverage gap, providing much needed resilience
to the local and global economy .
In fact, in a 2014 World Bank working paper, it was
concluded that the insurance sector had a key role to play in
fostering inclusive economic growth . The paper concluded
that “that the insurance sector contributes at a basic level
to inclusive economic growth and the effectiveness of the
credit function . It also shows that the latter impact may
be particularly fundamental in assisting the poor to avoid
poverty traps and to progress economically .”13 The paper
went on to provide a potential framework for natural disaster
relief funding, with ILS and reinsurance playing a major role
for lower frequency, higher severity events .
We have already seen a few ILS funds achieve Article 8 fund
classification status under the SFDR, showing the continued
movement of insurance-linked securities into the world
of sustainability . Some examples are AXA IM, Leadenhall
Capital Partners, Plenum and Twelve Capital . Over the
coming months and years, we expect to see investors, ILS
practitioners and other key stakeholders further increase
their commitment to ESG .
Collateral Solutions Debt securities from highly rated international institutions,
as permitted investments, have historically been widely used
in in new catastrophe bond transactions, mainly in the form
of putable floating rate notes issued by the International
Bank for Reconstruction and Development (IBRD) and the
European Bank for Reconstruction and Development (EBRD) .
These solutions offer ESG benefits, and in the past offered
higher total yield than Money Market Funds (MMF), however
this has converged in recent years, causing a greater take-up
of traditional MMF, and likely ESG MMF in the near future . US
interest rates remain low and European interest rates remain
negative . The exhibit below shows that LIBOR remains
positive, but low, and EURIBOR remains negative .
Exhibit 22: EURIBOR and LIBOR development
Source: Aon Securities LLC, Bloomberg
-0.60%
-0.50%
-0.40%
-0.30%
-0.20%
-0.10%
0.00%
0.10%
0.20%
0.30%
0.40%
0.50%
13 World Bank, insurance and inclusive growth
EUR006M EURIBOR Index
US0006M LIBOR Index

ILS Annual Report 2021 31
We do however expect both investors and sponsors to
continue to be incentivized to pursue innovative collateral
solutions, subject to rates becoming tenable, in order to
increase the overall yield of a transaction, while retaining a
high level of credit worthiness, and ESG benefits .
Generali have recognised the potential for (re)insurance
linked investments to have green or ESG credentials . Their
latest bond issued in 2021, Lion III Re DAC, utilizes Generali’s
Green ILS framework, with three specific “green” features .
Firstly, the bond will free up capital from Generali’s balance-
sheet to be used for green projects . The six categories
of Eligible Projects include: Green Buildings; Renewable
Energy Electricity and Heat Production; Energy Efficiency;
Clean Transportation; Sustainable Water Management;
and Recycling, re-use & waste management . Secondly,
the collateral will be invested specifically into green bonds
issued by the EBRD . The final feature relates to the reporting
of these green projects . This is the first catastrophe bond
issuance to have all three of these ESG ILS features, and
shows the commitment of Generali to ESG .
Secured Overnight Funding Rate (SOFR)SOFR is a relatively new reference rate and its composition
and characteristics are not the same as LIBOR . A number of
mortgage cat bond transactions have begun using SOFR as
a reference rate as well as the recent IBRD CAR 130 property
and casualty transaction covering named storms which
launched in June 2021 .
On June 22, 2017, the Alternative Reference Rates Committee
(ARRC) convened by the Board of Governors of the Federal
Reserve System and the Federal Reserve Bank of New York
(FRBNY) identifies SOFR as the rate that, in the consensus
view of the AARC, represented best practice for use in certain
new US dollar derivatives and other financial contracts . SOFR
is a broad measure of the cost of borrowing cash overnight
collateralized by US treasury securities, and has been
published by the FRBNY since April 2018 . The FRBNY began
publishing historical indicative SOFR in 2014 .
The composition and characteristics of SOFR are not the
same as those of LIBOR, and SOFR is fundamentally different
for two key reasons . First, SOFR is a secured rate, while LIBOR
is an unsecured rate . Second SOFR is an overnight rate, while
LIBOR is a forward looking rate that represents interbank
funding over different maturities (e .g . 3 months) . As a result
there can be no assurance that SOFR (including compounded
SOFR) will perform in the same way as LIBOR would have at
any time, as a result of changes in interest and yield rates in
the market, market volatility or global or regional economic,
financial, political, regulatory, judicial or other events .
Exhibit 23: IBRD and EBRD notes program description
Source: International Bank for Reconstruction and Development, European Bank for Reconstruction and Development
IBRD notes EBRD notes
The International Bank for Reconstruction and Development (IBRD) is a World Bank institution that provides loans and other assistance primarily to middle income countries . To fund development projects in member countries, the IBRD finances its loans from its own equity and from money borrowed in the capital markets through the issuance of IBRD notes . IBRD notes are unsubordinated, unsecured notes persuant to the IBRD's existing Global Debt Issuance Facility . The IBRD is rated Aaa by Moody's and AAA by Standard & Poor's .
The European Bank for Reconstruction and Development (EBRD) was founded in 1991 to create a new post-Cold War era in Central and Eastern Europe . It is owned by 65 countries, as well as the European Union and European Investment Bank . The EBRD helps finance its development goals through the issuance of unsecured notes pursuant to its Global Medium Term Note Programme . The EBRD is rated Aaa by Moody's, AAA by Standard & Poor's and AAA by Fitch .

32
Public Sector/Residual Markets The year under review witnessed the return of several key
public sector and residual market sponsors, along with
an innovative inaugural transaction from a new public
sector entity . Legacy sponsors, the Federal Emergency
Management Agency, Texas Windstorm Association,
Louisiana Citizens Property Insurance Corporation, Florida
Citizens Property Insurance Corporation, North Carolina
Insurance Underwriting Association, and the California
Earthquake Authority all returned to the ILS market to secure
additional capacity to bolster their existing risk transfer
programs . The ILS market also welcomed a new public sector
sponsor in the Los Angeles Department of Water and Power,
who tapped the catastrophe bond market to secure a unique
wildfire cover to mitigate their exposure to a key climate
driven risk . Further, the trailing 12-month period illustrated
the flexibility of solutions available in the ILS market to
improve the resiliency of public sector entities and residual
markets in the wake of a natural catastrophe, with sponsors
utilizing different trigger types, recovery mechanics, and
multiple issuance vehicles, maximizing the value of the
capital markets’ as a key source of risk transfer capacity .
Exhibit 24: Outstanding property bonds
Source: Aon Securities LLC
0
500
1000
1500
2000
2500
CEA FEMA TWIA Citizens Property
IBRD NCIUA State Compen-
sation
LA Citizens
Pool Re LADWP
USD
mill
ion
s
A few notable developments have included:
Florida Citizens Property Insurance Corporation (Florida
Citizens), the not for profit, tax exempt, government entity
created to provide property insurance to eligible Florida
property owners returned to the catastrophe bond market
with its largest issuance since 2014 . Split across two Series
and three Tranches, the Everglades Re II Ltd . 2021-1 and
2021-2 notes secured $950 million of indemnity coverage
for Florida Citizens’ Coastal and Personal Lines Accounts,
providing a key pillar of Florida Citizen’s risk transfer program
going into the 2021 Atlantic hurricane season .
The California Earthquake Authority (CEA), an instrumentality
of the State of California, and one of the world’s largest
providers of residential earthquake insurance, continued
its extensive use of the catastrophe bond market through
two separate transactions under the Ursa Re II Ltd . program
during the period under review . The combined transactions
secured $990 million in limit across three classes of notes,
taking the CEA’s catastrophe bond capacity to $2 .34 billion in
notional amount .
In its debut to the ILS market, the Los Angeles Department
of Water and Power (LADWP) sponsored the first wildfire
parametric catastrophe bond via Power Protective Re Ltd . In
addition to the novel wildfire parametric structure, it was the
first catastrophe bond globally to benefit a municipal utility
anywhere in the world . This inaugural transaction features
an innovative trigger structure based on reconstruction
cost values within a wildfire perimeter, working to match
the expected liability or out of pocket expenses due from
LADWP, enhancing their disaster insurance and resilience
from a climate risk exposed peril .
2018 2019 2020 2021

ILS Annual Report 2021 33
Corporate Sponsors
Growth in CorporatesWith increasing focus and uncertainty surrounding climate
change and traditional (re)insurance market dislocation,
interest in the capital markets is at a peak for corporate
entities . Several leading forces and benefits include offsetting
the immediate impacts to business interruption, employee
benefits, and property damages, while mitigating credit risk
via collateralized capacity and mitigating price volatility with
cat bonds offering multi year capacity and pricing .
Indemnity and parametric ILS solutions, for instance, can
offer corporate entities a new pool of capital providers
to obtain additional capacity or limit, divergent from the
standard writers making up many corporations’ risk transfer
programs . Indemnity solutions can maintain alignment
and concurrency with current insurance program(s),
while putting any potential supply-demand imbalance
in the hands of the corporate . Parametric solutions offset
immediate business interruption and out of pocket expenses,
while rapidly injecting capital to aid in rebuilding and
reconstruction efforts .
These strategic risk transfer benefits and the developing
importance of sustainability and ESG initiatives have led to
the growth in corporate sponsors over the years .
Notably, Q2 2021 saw Blackstone’s entry via Gryphon Mutual
Insurance into the ILS market with the Wrigley Re Ltd . Series
2021-1 transaction . The $50 million Class A Notes provide
Blackstone managed funds three years of per occurrence,
parametric earthquake coverage for their entities in the state
of California . In addition to attractively priced California
earthquake capacity, the Notes also provide valuable
coverage for gaps in current policies such as TIV retention
requirements, sublimit gaps and exclusions within its
traditional program . Blackstone's cat bond helps strengthen
its risk transfer program by accessing new markets, allowing
multi-year capacity and pricing, managing market cycles and
mitigating credit risk with collateralized limits . Due to a high
level of investor interest, the transaction priced 20% below
initial mid-point of guidance .
Other transactions for the year include repeat corporate
sponsors Bayview Asset Management LLC, and Sempra Energy,
further cementing themselves as core ILS participants .
Collectively (including Blackstone), corporate sponsors have
transferred over $1 .6 billion of risk to the capital markets from
2018 through H1 2021 .
Exhibit 25: Select Corporate catastrophe bond issuance 2018 – 2021
Source: Aon Securities LLC
0
50
100
150
200
250
300
350
400
450
Bayview KaiserPermanente
Sempra PG&E Blackstone
USD
mill
ion
s
For the aforementioned reasons, as well as others, corporates,
institutions and governments are increasingly issuing green
bonds to increase market appeal to a broader investor class
and to be environmentally and socially responsible . At the
50th World Economic Forum meeting, 140 of the world’s
largest companies committed themselves to support efforts to
develop a core set of qualitative disclosures to their investors
and stakeholders, called “Stakeholder Capitalism” . Potential
corporate sponsors could provide more opportunities to
multiple types of investors by closing their natural catastrophe
protection gap with primary and secondary parametric triggers .
2018 2019 2020 2021
34
North America A diverse set of sponsors, including corporates, insurers,
reinsurers and government entities have found value in the
ILS market across a broad range of perils, geographies, trigger
types and expected loss levels .
While the H1 2021 North America property catastrophe risk
adjusted ROLs were up 5% to 10% in the traditional market,
the ILS market demonstrated strength on strength, combining
record issuance volume with spread reductions of 10% to 15%
compared to mid year 2020 . The strength of the ILS market
can be attributed to greater investor interest in ILS as an asset
class on the heels of the COVID-19 pandemic and lack of yield
in the broader markets . ILS investor assets under management
are estimated to have grown around $3 billion from last year’s
estimate at the time of writing .14
This positive capacity and pricing environment led to impressive
growth across the ILS market, a nearly 47% increase over the
same period ended H2 2020 .
A selection of new and diverse issuers and new transactions
during the period were:
• The debut catastrophe bond for Vermont Mutual Insurance
Company and affiliates via Baldwin Re Ltd ., with a single
Series 2021-1 Class A tranche of notes upsized to $150
million, covering indemnity losses from catastrophe events
in the US Northeast; named storm, earthquake, severe
weather and fire .
• Blackstone’s entry via Gryphon Mutual Insurance into
the ILS market with the $50 million Wrigley Re Ltd . Series
2021-1 Class A Notes which provide Blackstone managed
funds three years of per occurrence, parametric earthquake
coverage for their entities in the state of California .
• The Cosaint Re Pte . $150 million catastrophe bond, the
first issuance sponsored by Universal Insurance Holdings,
came to market covering US named storm reinsurance on
an indemnity and per occurrence basis, across a three-year
term, with coverage focused on Florida .
A selection of repeat issuers during the period were:
• Fidelis Insurance Bermuda executed their second and third
cat bonds after successfully placing their inaugural issuance
under the Herbie Re Ltd . program in June . Herbie Re 2020-2
leveraged the strength of the market to secure $275 million
annual aggregate protection against US earthquake and US
named storms, while Herbie Re Ltd . 2021-1 secured $150
million of global annual aggregate capacity, representing
the broadest range of covered regions and perils for an
insured industry loss index cat bond at the time of issuance .
• Florida Citizens returned to the catastrophe bond market
with its largest issuance since 2014 and largest transaction
in the market in the period under review . Split across two
Series and three Classes, the Everglades Re II Ltd . 2021-1 and
2021-2 notes secured $950 million of indemnity coverage
for Florida Citizens’ Coastal and Personal Lines Accounts .
A selection of state sponsors during the period were:
• Texas Windstorm Insurance Association, Louisiana Citizens
and the North Carolina Insurance Underwriting Association
all returned to the ILS market for a combined $1 .29 billion in
new issuance for the trailing 12 months .
• First time sponsor, the Los Angeles Department of Water
and Power (LADWP) entered the market with their $50
million Power Protective Re Ltd . Series 2020-1 issuance .
The novel Power Protective Re transaction provides LADWP
with three years of parametric wildfire coverage in the state
of California, featuring a stepped payout trigger .
Positive market momentum, combined with over $3 .66 billion
maturing in the second half of 2021, could lead to record
issuance volume for the full year in North America .
Market Analysis by Region
14 Aon Securities LLC

ILS Annual Report 2021 35
Exhibit 26: Trailing year’s catastrophe bond issuances by government sponsor
Source: Aon Securities LLC
0 200 400 600 800 1000 1200
LADWP
LA Citizens
NCIUA
TWIA
FEMA
Citizens Property
CEA
Issue Size USD millions
Exhibit 27: H2 2020 property catastrophe bonds covering North America perils
Beneficiary Issuer Series ClassIssue Size (USD million)
Domicile Perils Description
Peril Ctgry Trigger Recovery
Swiss Re Matterhorn Re Ltd .
Series 2020-4 Class A $65 .00 Bermuda US NS US HU Industry
Index Occurrence
Swiss Re Matterhorn Re Ltd .
Series 2020-4 Class B $175 .00 Bermuda US NS US HU Industry
Index Occurrence
Sempra SD Re Ltd . Series 2020-1 Class A $90 .00 Bermuda
CAL WF (originating from power/transformation system of insured)
US WF Indemnity Annual Aggregate
Convex Hypatia Ltd . Series 2020-1
Class A $150 .00 Bermuda US NS & EQ US MP Industry Index
Annual Aggregate
Class B $150 .00 Bermuda US NS & EQ US MP Industry Index
Annual Aggregate
CEA Ursa Re Ltd . Series 2020-1
Class AA $425 .00 Bermuda CAL EQ US EQ Indemnity Annual Aggregate
Class D $350 .00 Bermuda CAL EQ US EQ Indemnity Annual Aggregate
Fidelis Herbie Re Ltd .
Series 2020-2
Class A $100 .00 Bermuda US, PR, USVI: NS or EQ US MP Industry
IndexAnnual Aggregate
Class B $150 .00 Bermuda US, PR, USVI: NS or EQ US MP Industry
IndexAnnual Aggregate
Class C $25 .00 Bermuda US, PR, USVI: NS or EQ US MP Industry
IndexAnnual Aggregate
USAA
Residential Reinsurance 2020 Limited
Series 2020-2 Class 1 $50 .00 Cayman
US TC, EQ, WS, ST, WF, VE, MI, OP
US MP Indemnity Occurrence
USAA
Residential Reinsurance 2020 Limited
Series 2020-2
Class 3 $150 .00 CaymanUS TC, EQ, WS, ST, WF, VE, MI, OP
US MP Indemnity Occurrence
Class 4 $200 .00 CaymanUS TC, EQ, WS, ST, WF, VE, MI, OP
US MP Indemnity Occurrence
2020 2021

36
Beneficiary Issuer Series ClassIssue Size (USD million)
Domicile Perils Description
Peril Ctgry Trigger Recovery
AmFam Four Lakes Re Ltd .
Series 2020-1
Class A $100 .00 Bermuda US NS, EQ, ST, WS, WD, VE, MI US MP Indemnity Occurrence
Class B $75 .00 Bermuda US NS, EQ, ST, WS, WD, VE, MI US MP Indemnity Occurrence
Alphabet Phoenician Re Ltd .
Series 2020-1 Class A $237 .50 Bermuda CAL EQ US EQ Indemnity Occurrence
Swiss Re Matterhorn Re Ltd .
Series 2020-5
Class A $150 .00 Bermuda US NS US HU Industry Index Occurrence
Class B $150 .00 Bermuda US NS US HU Industry Index Occurrence
LADWPPower Protective Re Ltd .
Series 2020-1 Class A $50 .00 Bermuda CAL WF US WF Parametric Occurrence
AXIS Northshore Re II Limited
Series 2021-1 Class A $150 .00 Bermuda
US, PR, US VI, CAN: NS, EQ,WS
WW MP
Industry Index
Annual Aggregate
BritSussex Capital UK UCC Limited
Series 2020-1 - $300 .00 UK US, PR, USVI:
NS, EQ US MP Industry index
Annual Aggregate
Alphabet Phoenician Re Ltd .
Series 2020-2 Class A $95 .00 Bermuda CAL EQ US EQ Indemnity Occurrence
ASIG Bonanza Re Ltd .
Series 2020-2
Class A $200 .00 Bermuda US HU US HU Indemnity Occurrence
Class B $95 .00 Bermuda NS, WS, WF, EQ, ST US MP Indemnity Annual
Aggregate
Liberty Mutual
Mystic Re IV Ltd .
Series 2021-1 Class A $300 .00 Bermuda US, PR, USVI,
CAN: NS, EQ US MP Industry Index Occurrence
Hamilton Easton Re Pte . Ltd .
Series 2020-1 Class A $150 .00 Singapore US NS, EQ US MP Industry
index Occurrence
Allied World 2001 CAT Re Ltd .
Series 2020-1 Class A $210 .00 Bermuda
US, PR, USVI: NS, EQ, ST, EU Wind
WW MP
Industry Index
Annual Aggregate
Source: Aon Securities LLC
Exhibit 28: H1 2021 property catastrophe bonds covering North America perils
Beneficiary Issuer Series ClassIssue Size (USD million)
Domicile Perils Description
Peril Ctgry Trigger Recovery
Bayview Sierra Ltd . Series 2021-1
Class A $150 .00 Bermuda US EQ US EQ Parametric Index Occurrence
Class B $50 .00 Bermuda US EQ US EQ Parametric Index Occurrence
FEMA FloodSmart Re Ltd .
Series 2021-1
Class A $450 .00 Bermuda US, DC, PR, VI: FL US HU Indemnity Occurrence
Class B $125 .00 Bermuda US, DC, PR, VI: FL US HU Indemnity Occurrence
CEA Ursa Re Ltd . Series 2021-1 Class F $215 .00 Bermuda CAL EQ US EQ Indemnity Annual
Aggregate
NCIUACape Lookout Re Ltd .
Series 2021-1 Class A $250 .00 Bermuda NC NS, ST US MP Indemnity Annual
Aggregate
Exhibit 27: H2 2020 property catastrophe bonds covering North America perils (continued)
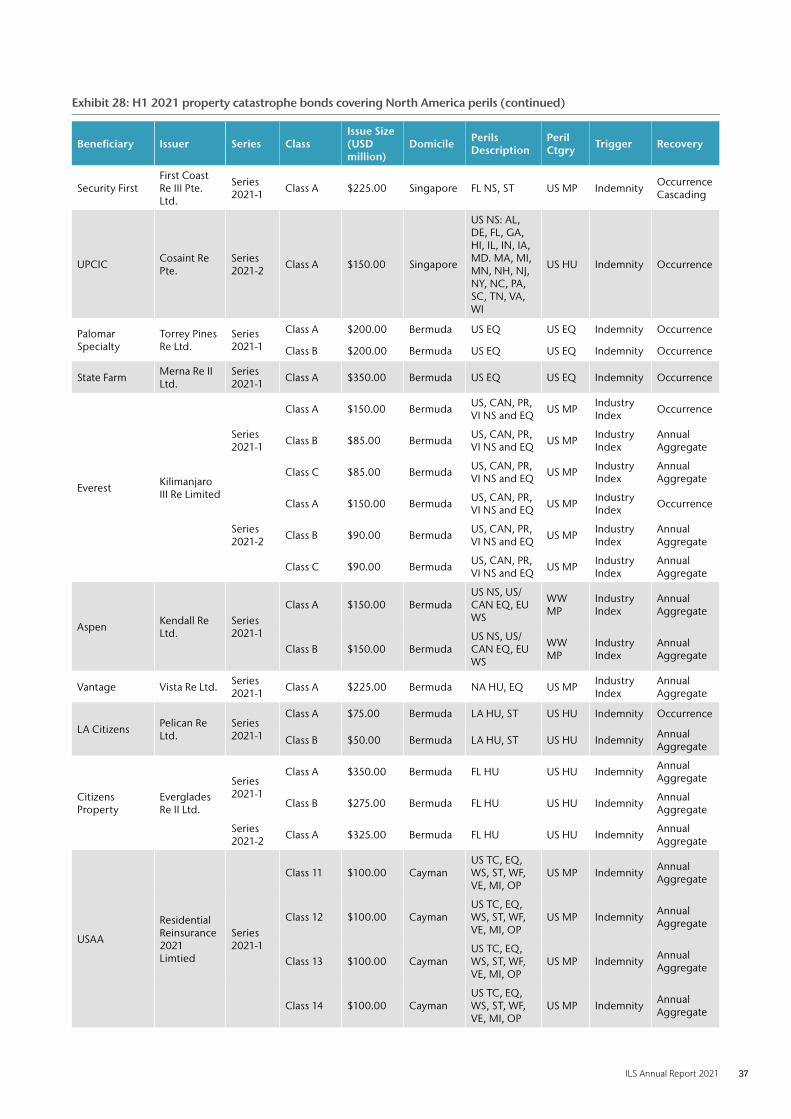
ILS Annual Report 2021 37
Beneficiary Issuer Series ClassIssue Size (USD million)
Domicile Perils Description
Peril Ctgry Trigger Recovery
Security FirstFirst Coast Re III Pte . Ltd .
Series 2021-1 Class A $225 .00 Singapore FL NS, ST US MP Indemnity Occurrence
Cascading
UPCIC Cosaint Re Pte .
Series 2021-2 Class A $150 .00 Singapore
US NS: AL, DE, FL, GA, HI, IL, IN, IA, MD . MA, MI, MN, NH, NJ, NY, NC, PA, SC, TN, VA, WI
US HU Indemnity Occurrence
Palomar Specialty
Torrey Pines Re Ltd .
Series 2021-1
Class A $200 .00 Bermuda US EQ US EQ Indemnity Occurrence
Class B $200 .00 Bermuda US EQ US EQ Indemnity Occurrence
State Farm Merna Re II Ltd .
Series 2021-1 Class A $350 .00 Bermuda US EQ US EQ Indemnity Occurrence
Everest Kilimanjaro III Re Limited
Series 2021-1
Class A $150 .00 Bermuda US, CAN, PR, VI NS and EQ US MP Industry
Index Occurrence
Class B $85 .00 Bermuda US, CAN, PR, VI NS and EQ US MP Industry
IndexAnnual Aggregate
Class C $85 .00 Bermuda US, CAN, PR, VI NS and EQ US MP Industry
IndexAnnual Aggregate
Series 2021-2
Class A $150 .00 Bermuda US, CAN, PR, VI NS and EQ US MP Industry
Index Occurrence
Class B $90 .00 Bermuda US, CAN, PR, VI NS and EQ US MP Industry
IndexAnnual Aggregate
Class C $90 .00 Bermuda US, CAN, PR, VI NS and EQ US MP Industry
IndexAnnual Aggregate
Aspen Kendall Re Ltd .
Series 2021-1
Class A $150 .00 BermudaUS NS, US/CAN EQ, EU WS
WW MP
Industry Index
Annual Aggregate
Class B $150 .00 BermudaUS NS, US/CAN EQ, EU WS
WW MP
Industry Index
Annual Aggregate
Vantage Vista Re Ltd . Series 2021-1 Class A $225 .00 Bermuda NA HU, EQ US MP Industry
IndexAnnual Aggregate
LA Citizens Pelican Re Ltd .
Series 2021-1
Class A $75 .00 Bermuda LA HU, ST US HU Indemnity Occurrence
Class B $50 .00 Bermuda LA HU, ST US HU Indemnity Annual Aggregate
Citizens Property
Everglades Re II Ltd .
Series 2021-1
Class A $350 .00 Bermuda FL HU US HU Indemnity Annual Aggregate
Class B $275 .00 Bermuda FL HU US HU Indemnity Annual Aggregate
Series 2021-2 Class A $325 .00 Bermuda FL HU US HU Indemnity Annual
Aggregate
USAA
Residential Reinsurance 2021 Limtied
Series 2021-1
Class 11 $100 .00 CaymanUS TC, EQ, WS, ST, WF, VE, MI, OP
US MP Indemnity Annual Aggregate
Class 12 $100 .00 CaymanUS TC, EQ, WS, ST, WF, VE, MI, OP
US MP Indemnity Annual Aggregate
Class 13 $100 .00 CaymanUS TC, EQ, WS, ST, WF, VE, MI, OP
US MP Indemnity Annual Aggregate
Class 14 $100 .00 CaymanUS TC, EQ, WS, ST, WF, VE, MI, OP
US MP Indemnity Annual Aggregate
Exhibit 28: H1 2021 property catastrophe bonds covering North America perils (continued)

38
Beneficiary Issuer Series ClassIssue Size (USD million)
Domicile Perils Description
Peril Ctgry Trigger Recovery
Allstate Sanders Re II Ltd .
Series 2021-1 Class A $250 .00 Bermuda
DC and US (ex . FL) NS, EQ, SW, Fire, OP
US MP Indemnity Occurrence
GAIC Riverfront Re Ltd . -
Class A $235 .00 Bermuda
US, DC, CAN NS, EQ, ST, WS, WF, VE, MI
WW MP Indemnity Occurrence
Class B $70 .00 Bermuda
US, DC, CAN NS, EQ, ST, WS, WF, VE, MI
WW MP Indemnity Occurrence
Fidelis Herbie Re Ltd .
Series 2021-1 Class A $150 .00 Bermuda
US/CAN: NS EQ ST WS, US: WF, JP: TY EQ, EU: Wind, IT, TRK, AU, NZ: EQ, AU: TC
WW MP
Industry Index
Annual Aggregate
SJIC Putnam Re Pte . Ltd .
Series 2021-1 Class A $120 .00 Singapore FL and SC NS US HU Indemnity Occurrence
TWIA Alamo Re Ltd .
Series 2021-1 Class A $500 .00 Bermuda TX NS, ST US MP Indemnity Annual
Aggregate
Ariel Re Titania Re Ltd .
Series 2021-1 Class A $150 .00 Bermuda
US, DC, PR, VI, CAN: NS and EQ
US MP Indemnity Annual Aggregate
Liberty Mutual Mystic Re IV Ltd .
Series 2021-2
Class A $225 .00 BermudaUS, CAN, Caribbean NS, EQ
WW MP Indemnity Occurrence
Class B $75 .00 BermudaUS, CAN, Caribbean NS, EQ
WW MP Indemnity Occurrence
Blackstone Wrigley Re Ltd .
Series 2021-1 Class A $50 .00 Bermuda CA EQ US EQ Parametric Occurrence
State Farm Merna Re II Ltd .
Series 2021-2 Class A $300 .00 Bermuda FL HU, ST US HU Indemnity Occurrence
Vermont Mutual
Baldwin Re Ltd .
Series 2021-1 Class A $150 .00 Bermuda
CT, ME, MA, NH, NY, RI, and VT: NS, EQ, ST, WF, and other perils events
US MP Indemnity Occurrence
Renaissance Re Mona Lisa Re Ltd .
Series 2021-1 Class A $250 .00 Bermuda
NS: US, DC, PR USVI; EQ: US, DC, Canada, PR, USVI
US MP Industry Index
Annual Aggregate
Source: Aon Securities LLC
Exhibit 28: H1 2021 property catastrophe bonds covering North America perils (continued)

ILS Annual Report 2021 39
Florida In territories where catastrophe modeling output has
historically driven pricing discussions in prior years,
reinsurers increased their focus on actual loss experience . As
a result, programs with poor experience relative to modeled
loss were under more price pressure than programs that
have performed at or better than modeled expected loss .
Sponsors who experienced loss creep were subject to higher
pricing . ILS investors affected by non-hurricane losses in
more recent years proved more hesitant than historically,
particularly lower down in programs . Additionally, insurers
with portfolios containing exposure outside Florida that were
significantly impacted by losses during the 2020 hurricane
season negatively affected their ability to secure capacity
during 2021 renewals .
For the overall market, additional limit secured by a few
insurers this season was offset by many insurers purchasing
less limit due to de-risking efforts, and to some degree, the
Florida Hurricane Catastrophe Fund (FHCF) electing to forgo
reinsurance protection for 2021 .
Florida wind and severe storm specific catastrophe bond
issuances in 2021 totaled $1 .475 billion, over double the
amount issued in 2020 . This is partially due to renewals of
maturing catastrophe bonds, as well as due to the general
evolution of the market . ILS investors expressed more interest
and value in single state, single peril covers .
2021 saw the return of Florida Citizens with the combined
$950 million Everglades Re II 2021-1 and 2021-2 issuances .
Initially, Citizens targeted $500 million across two Series and
three Tranches of notes, but ultimately secured $950 million,
signaling strong support from the ILS markets for single-state,
peak peril risk . The $350 million 2021-1 Class A tranche and
$275 million 2021-1 Class B tranche covered Citizens’ Coastal
Account whereas the $325 million 2021-2 Class A tranche
covered Citizens’ Personal Lines Accounts .
State Farm Florida Insurance Company was able to reap the
benefits of the abundant capacity for cleanly structured,
single state, indemnity per occurrence transactions . The
$300 million Merna Re II Ltd . Series 2021-2 issuance was well
received by the market due to the aforementioned reasons,
but also due to the fact that the deal granted ILS investors
access to an additional, diversified State Farm portfolio .
The Merna Re 2021-2 issuance provided State Farm Florida
Insurance Company with named storm and severe weather
cover over a three-year period . St . John’s Insurance Company,
another new entrant to the ILS market, secured $120 million
of named storm capacity via the Putnam Re 2021-1 issuance .
Exhibit 29: Catastrophe bond issuance by Florida sponsor 2015 – 2021
Source: Aon Securities LLC
0 200 400 600 800 1,000 1,200 1,400 1,600 1,800
Safepoint
St Johns
Avatar
Castle Key
State Farm Florida
Heritage
American Integrity
Security First
Citizens Property
USD millions
2020 2021
2018 2019
2016 2017
40
Europe During the 12 month period ending June 30, 2021, two
Europe only catastrophe bonds were brought to market:
Azzurro Re II 2020-1 (sponsored by UnipolSai Assicurazioni
S .p .A .) and Lion III Re DAC (sponsored by Assicurazioni
Generali S .p .A) . Both bonds were issued by Italian insurance
companies to provide indemnity reinsurance coverage, and
both have their special purpose vehicle domiciled in Ireland .
Unipol’s bond had an issuance size of €100 million and
provided the experienced sponsor with coverage for Europe
earthquake . Generali came back to market with their third
Lion Re series issuance, achieving (Euro) €200 million for
Europe windstorm and Italy earthquake .
Aon Securities continues to see modest demand from
prospective sponsors for ILS coverage, due in part to the
continued competitiveness of the European traditional
market . This is coupled with a negative interest rate
environment for Euro-denominated currencies, restricting
the range of viable collateral solutions available to European
sponsors . Prospective sponsors are predominantly insurance
companies targeting reinsurance coverage, on a mix of
aggregate and occurrence bases .
Negative interest ratesInterest rates in the European Union remain negative, as they
have been since 2013 . The transfer of European risk to the
capital markets, as Euro assets remain costly to hold as collateral,
either in the form of European Money Market Funds or Euro
denominated medium term notes . European cedents have been
looking further afield to generate a return on their collateral,
or have issued in US dollars to avoid negative European rates,
however this does expose the company to interest rate risk .
Asia-Pacific
The Asia-Pacific RegionDuring the 12 month period ending June 30, 2021, three new
144A catastrophe bonds in Asia were issued which tested
deal structures and trigger mechanisms in the region:
• In March 2021, Tokio Marine & Nichido Fire Insurance
issued a single $150 million tranche of Kizuna III Re Series
2021-1 notes covering Japan earthquake . Similar to previous
Kizuna cat bonds, Kizuna III is a five-year transaction with
three, three-year rolling aggregate risk periods and was
priced below initial price guidance .
• Also, in March 2021, Sompo Japan returned to the ILS
market for the first time in 4 years with the issuance of
Sakura Re 2021-1 . The transaction was jointly sponsored
by Sompo Japan and Sompo International . The two
tranches of the multi peril and multi region structure
were designed to share the limit of the notes between
two group companies after a triggering event . The
transaction was significantly oversubscribed resulting in
upsizing two times of the original target of $200 million
to $400 million . Furthermore, both tranches were also
priced below guidance .
• Umigame Re 2021-1 was the second catastrophe bond
issuance by Tokio Marine in 2021 . The sponsor sought the
Japan typhoon and flood cover by issuing three tranches of
Notes . This novel structure allowed for one tranche to act
as a first event coverage to a higher layer, or a second or
subsequent coverage to a lower layer . All three tranches of
$200 million were priced below guidance .
During the same period, there were redemptions of three
transactions totaling $980 million of Notes covering perils in
Asia that outpaced new issuances .
In January 2021, two tranches totaling $300 million of Nakama
Re 2015-1 matured without being renewed . In April, $480
million Aozora Re Ltd 2017-1 notes matured which was partly
replaced by $200 million Sakura Re 2021-1 Class A . Tokio
Marine redeemed two tranches of Kizuna Re II 2018-1 totaling
$200 million in April 2021 as there had been no eligible events
during the first three years of the transaction .
As the redemption of catastrophe bonds covering Asia
outpaced new issuances coupled with the redemption of
other non-US catastrophe bonds, investors’ demand for
catastrophe bonds covering Asia remains strong .
Further to the early success of the Singapore domicile, the
Monetary Authority of Singapore (MAS) decided to extend
the ILS grant scheme until the end of 2022, which will further
incentivize sponsors to the Asian region for this year . Kizuna Re
III 2021-1 and Umigame Re 2021-1 took advantage of the ILS
grant scheme to improve the economics of the transaction .
Following in similar footsteps, the Hong Kong Insurance
Authority (HKIA) have launched a 2 year pilot ILS grant
scheme . Such developments suggest a positive outlook for
ILS in Asia .

ILS Annual Report 2021 41
April 1st Traditional Renewals in Japan2020 Japanese renewals were impacted by COVID-19, stock
market turmoil, and cuts in interest rates .
After significant losses in 2018 and 2019, 2020 was a relatively
benign year from a catastrophe loss perspective . However,
we continued to see some smaller cat losses impacting non-
life insurers’ retentions and some of the frequency covers . In
addition, several high-profile fire losses were reported .
As a result of the 2018 and 2019 typhoon seasons, reinsurers
have changed their view of Japan typhoon risk . This has
also bifurcated the treaty market – those who previously
preferred being overweight on higher ROL layers to move to
an across the board support, and those who aimed to shift
their entire capacity to higher layers
Reinsurance structures and retention levels generally remained
unchanged with some non-life clients buying additional
wind capacity at the top end of programmes . Reinsurers
continued to seek price increases in the non-life insurance
sector reflecting general market pricing movements as well
as the recent loss experience and, in some cases, further
development of losses from 2018 and 2019 .
Once FOTs were finalised, we saw strong appetite from the
majority of reinsurers and placements were completed with
healthy over placement . Those reinsurers who managed to
raise additional capital or capacity via retrocession offered
significantly more capacity this year .
In parallel to pricing negotiations, wording negotiations on
Communicable Disease and Cyber exclusions consumed a
significant part of the renewal attention from early February
to the end of March . For named peril contracts purchased
by mutual insurers, reinsurers accepted the standard LMA
5503/05 and LMA 5410 clauses . In the non-life sector,
amended versions of these clauses were supported by
reinsurers to avoid gaps in cover from the primary insurance
coverage in Japan .
Certain reinsurers took a harder stance on exclusions than
others, a behaviour that appears to be linked to their
individual COVID-19 loss experience .
The facultative market, on the other hand, has seen rate
tightening over the last four years since US hurricane
loses from Harvey, Irma, and Maria . Also, underwriting
discipline has continued in the current COVID-19 business
environment . Market leading underwriters shared the view
that US property reinsurance pricing is nearing the peak,
and do not expect continuous pricing remediation at the
same level as for previous years . There are a number of new,
and existing markets who look to write Japanese property
business, which helps to serve demands from cedents to
protect the underwriting results of their portfolio . Reinsurers
who are purchasing retro, claim that retro pricing increase
is still far greater than the rate changes in their assumed
reinsurance portfolio .
Australia – New ZealandReinsurer appetite and demand remained stable across the
ANZ market during the July 1 renewal as existing markets had
surplus capital to deploy and new entrants looked to expand
their portfolio in the region . Pricing increases were modest
to fair with loss impacted layers seeing increases of between
+5% to +10% and clean layers increasing +2 .5% to +5% .
While there was no new cat bond activity, the overall
increase in traditional pricing creates a more competitive
market between traditional and alternative markets,
particularly at more remote risk levels . Additionally, as local
reinsurance programs continue to grow, sponsors will be
increasingly motivated to broaden their accessible pool of
capital which the ILS markets can provide .
ILS managers did however participate in the collateralized
reinsurance market during the year, with an outsized
presence in low layer aggregate layers vis a vis catastrophe
excess of loss programs . Most of the ILS capacity is sourced
through fronting arrangements to improve returns, however,
continued persistence in low severity hailstorm, bushfire
and flood losses creates a less attractive environment for
investors; as a result, ILS participation in such layers remains
flat to slightly down .
Natural catastrophe lossesAsia-Pacific (APAC) economic losses and damage from natural
disasters in 2020 were estimated at $101 billion . While this is
lower than the previous year of $107 billion, we saw an increase
in the number of billion dollar loss events by 2 to 16 . Seasonal
flooding in China, Japan and India, and further hailstorms in
Australia accounted for 7 of these events . From an industry
perspective, only $12 billion (or 12%) of the economic cost was
covered by public and private insurance entities . Based on the
annual data from 2000 to 2019, insured losses were 9% lower
than the average but 88% higher than the median . Compared
to EMEA and the United States, APAC remains a region where
the protection gap continues to be a concern .
The Asian continent was heavily affected by one of the
most prolific monsoon seasons in decades . The transitional
shift from ENSO-neutral to La Niña played a pivotal role in

42
hundreds of major rivers breaching flood stage . The hardest
hit areas were felt in China, where the seasonal Mei-yu front
brought the most rainfall since 1998 . More than 1 .4 million
homes were damaged, and vast swaths of agriculture land
submerged . The total economic cost in China alone was
$35 billion and accounted for 30% of global economic flood
cost, though only a small fraction of this total was recovered
by insurance . Similar flooding was recorded in nearby Japan,
where on stretch from July 3-15 on Kyushu Island prompted
several prefectural and national rainfall records . Total
damage from that event alone topped $8 .5 billion, of which
$2 .0 billion was insured . Further flooding on the Korean
Peninsula occurred following one of the region’s wettest
and longest monsoon seasons in recent memory . Multiple
typhoon landfalls (Bavi, Mysak, and Hiashen) only made flood
conditions worse in South Korea .
Summer monsoon flooding was also seen on the Indian
subcontinent . Heavy rains coupled with convective storms
from June to September triggered severe flash flooding in
central and northern India, resulting in a total financial cost
of $7 .5 billion . It also resulted in more than 1,900 fatalities;
making it the deadliest loss of life global event in 2020 .
Even more flooding occurred in India’s southwestern
states in October after multiple tropical lows came ashore .
The combined damage toll added another $4 billion .
Neighbouring countries of Pakistan, Nepal, and Bangladesh
were also impacted by exceedingly active flooding season
and the combined economic toll reached into the billions .
Tropical cyclone activity in Asia, while well below
climatological levels in 2020, still resulted in significant and
disastrous impacts . Most notable was Super Typhoon Goni’s
record setting Category 5 landfall in the Philippines . The
195 mph (315 kph) storm was the strongest ever recorded
globally . Other strong typhoon striking the Philippines
included Vamco and Molave . The country cited hundreds of
thousands of homes and other properties being damaged or
destroyed, and a combined economic toll topping $2 billion .
Several of the same tropical cyclones also struck Vietnam . In
October alone, storms Lifa, Nangka, Saudel, and Molave all
came ashore in Vietnam and spawned catastrophic flooding
in central sections of the country . Government officials cited
damage costs of $1 .4 billion in October alone . Remnants
from these storms would later traverse neighbouring
countries of Laos, Cambodia, and Thailand .
Natural peril activity was also elevated in Oceania . Australia
was impacted by a series of notable severe thunderstorm
events, that were dominated by the hail sub-peril . One
stretch on January 19-20 saw the major metro regions of
Sydney, Brisbane, Canberra, and Melbourne all struck by
hailstorms that left an insurance bill topping $1 .4 billion from
131,000 claims . Other hailstorms affected Queensland in
April and October and resulted in additional insured payouts
in the hundreds of millions ($); while a powerful East Coast
Low left widespread wind and flood damage from February
4-11 in Queensland and New South Wales .
Exhibit 30: Top 5 most significant events in APAC July 2020 – June 2021
Date Event Impacted Countries Fatalities Economic Loss
(USD billions) Insured Loss
Jun - Sep 20 Flooding China 280 $35 $2 .0
Jul-20 Flooding Japan 82 $8 .5 $2 .0
Jun - Sep 20 Flooding India 1,922 $7 .5 $0 .805
Sep-20 Typhoon Haishen Japan, China, Korea 4 $4 .0 $1 .6
Oct-20 Flooding India 152 $4 .0 -
Sources: Aon - Impact Forecasting - Weather, Climate & Catastrophe Insight - 2020 Annual Report

ILS Annual Report 2021 43
Model Updates
North America
US Hurricane
AIR released a new hurricane model in 2021 . AIR v9 includes
two event sets . The primary event set is unchanged from
the previous version except for some updates to select
historical footprints . The second event set is to be used for
rate filings in Florida . This version incorporates the 2017 and
2018 hurricane seasons from HURDAT2 in compliance with
the Florida Loss Commission . This version of the model also
includes minor updates to vulnerability .
CoreLogic is releasing a new hurricane model in 2021 that
will incorporate additional recent hurricane seasons from
HURDAT2 in compliance with the Florida Loss Commission .
This model will also incorporate several vulnerability updates
to wind borne debris regions, autos, and mobile homes .
Impact Forecasting (IF)15 submitted their Florida Hurricane
Model to the Florida Loss Commission and the model was
approved for use in rate filings in June 2021 . The IF Florida
Hurricane model includes a new stochastic event set
featuring 200k years of simulation and component-based
vulnerability curves that are validated using nearly $12 billion
in location-level claims .
RMS released a new hurricane model in 2021 that will
include hazard updates in line with the requirements of the
Florida Loss Commission . Additionally, RMS has introduced
several vulnerability updates that impact all coverages . For
use with Florida rate filings only, RMS has introduced a new
alternate view of vulnerability that considers recent building
code requirements that require a full roof replacement when
at least 25% roof damage has occurred .
US Inland FloodKatRisk v4 includes several vulnerability enhancements to
the inland flood model to better support commercial risks
and risks with basements and/or unknown story heights .
Additionally, this version of the model includes updated
FEMA flood zones, base flood elevation (BFE), and levee
defense systems .
Europe
WindThere have been no updates in European wind models within
RMS, AIR or CoreLogic .
Impact Forecasting provided an update to the Europe
windstorm model to include Central and Eastern European
territories .
FloodRMS updated their European HD16 flood model with changes
to the hazard and vulnerability .
Impact Forecasting updated flood models in Hungary
and Austria .
Hail/CSEuropean hail models have been released in RMS HD1 and IF
which cover most of continental Europe .
EarthquakeThere have been no further updates from any earthquake
model in Europe .
The last update was Turkey in the CoreLogic . This includes
more accurate geometry of the Marmara segment of North
Anatolian fault based on the latest studies published between
2005 and 2019, and an update of both time dependent and
time independent event rates .
15 Impact Forecasting – Aon’s catastrophe model developers, that help analyze the financial implications of catastrophic events
16 RMS HD products are subject to licence

44
Asia-Pacific AIR have recently announced the release of Touchstone 2021
with an updated Japan Industry Exposure Database (IED)
including less wooden residential buildings and increase in
steel and concrete . Also, the distribution of properties was
updated when disaggregation and average properties are
switched on .
The new AIR Japan typhoon model generally trends
towards increased modelled loss . There is a major update
to the vulnerability curve due to a mismatch between
modelled losses versus actual market losses for 2018/2019
Typhoons in the region . AIR had also released a new Japan
earthquake model . EQ event data sets have been updated
based on Headquarter for Earthquake Research Promotion
(HERP) 2019 model while the probability for ignition of fire
following decreased .
RMS HD had also updated their Japanese perils . Typhoon
and flood models had the recent 2018 and 2019 typhoons
incorporated . Earthquake and tsunami on the other hand,
had sub perils for tsunami, fire following, liquefaction, and
landslides .
For Oceania, AIR announced the release of their Australia
earthquake model . These updates were prompted by findings
in the National Seismic Hazard Model from Geoscience
Australia (GA), which challenged established conceptions of
Australia’s seismic hazard and generally decreased the view of
seismic hazard significantly .
RMS also announced the release of their HD Inland Flood
Model which is the world’s first fully probabilistic flood
model for the country . As with earthquake, the New
Zealand flood model is built with exceptional data obtained
from local organizations and institutions, including the
National Institute of Water and Atmospheric Research
(NIWA), Land Information New Zealand (LINZ), local
and regional councils and the ICNZ . A similar HD flood
model was also released for South East Asia which covers
Indonesia, Malaysia, and Thailand .
No updates to APAC region in CoreLogic RQE v19 .2 released
in 2020, although there are planned reviews to Australia
Wildfire, Australia Cyclone, and India Cyclone and India EQ
after 2020 .

ContactPaul SchultzChief Executive Officer, Aon Securities LLC+1 312 381 5256paul .schultz@aon .com
© Aon Securities LLC 2021 | All Rights Reserved
Aon Securities LLC is providing this document, ILS Annual Report 2021 Alternative Capital: Continuing Growth Momentum, and all of its contents (collectively, the
“Document”) for general informational and discussion purposes only, and this Document does not create any obligations on the part of Aon Securities LLC, Aon Securities
Limited, Aon Solutions Ireland Limited and their affiliated companies (collectively, “Aon”) . This Document is not intended and should not be construed as advice, opinions
or statements with respect to any specific facts, situations or circumstances and Recipients should not take any actions or refrain from taking any actions, make any decisions
(including any business or investment decisions), or place any reliance on this Document (including without limitation on any forward-looking statements) .
This Document is not intended, nor shall it be construed as (1) an offer to sell or a solicitation of an offer to buy any security or any other financial product or asset, (2) an offer,
solicitation, confirmation or any other basis to engage or effect in any transaction or contract (in respect of a security, financial product or otherwise), or (3) a statement of
fact, advice or opinion by Aon or its directors, officers, employees, and representatives (collectively, the “Representatives”) . Any projections or forward-looking statements
contained or referred to in this Document are subject to various assumptions, conditions, risks and uncertainties (which may be known or unknown and which are inherently
unpredictable) and any change to such items may have a material impact on the information set forth in this Document .
Actual results may differ substantially from those indicated or assumed in this Document . No representation, warranty or guarantee is made that any transaction can be
effected at the values provided or assumed in this Document (or any values similar thereto) or that any transaction would result in the structures or outcomes provided
or assumed in this Document (or any structures or outcomes similar thereto) . Aon makes no representation or warranty, whether express or implied, that the products or
services described in this Document are suitable or appropriate for any sponsor, issuer, investor or participant, or in any location or jurisdiction .
The information in this document is based on or compiled from sources that are believed to be reliable, but Aon has made no attempts to verify or investigate any such
information or sources . Aon undertakes no obligation to review, update or revise this Document based on changes, new developments or otherwise, nor any obligation to
correct any errors or inaccuracies in this Document .
This Document is made available on an “as is” basis, and Aon makes no representation or warranty of any kind (whether express or implied), including without limitation in
respect of the accuracy, completeness, timeliness, or sufficiency of the Document .
Aon does not provide and this Document does not constitute any form of legal, accounting, taxation, regulatory, or actuarial advice . Recipients should consult their own
professional advisors to undertake an independent review of any legal, accounting, taxation, regulatory, or actuarial implications of anything described in or related to this
Document . Aon and its Representatives may have independent business relationships with, and may have been or in the future will be compensated for services provided
to, companies mentioned in this Document . To the maximum extent permitted by law, Aon and its Representatives disclaim any and all liability relating to this Document,
and neither Aon nor any of its Representatives shall have any liability to any party for any claim, loss, damage or liability in any way arising from, relating to, or in connection
with this Document (including without limitation any actions or inactions, reliance or decisions based upon this Document) or any errors in or omissions from this Document
(including without limitation the correctness, accuracy, completeness, timeliness, sufficiency, quality, pricing, reliability, performance, adequacy, or reasonableness of the
information contained in this Document) . To the maximum extent permitted by law, neither Aon nor its Representatives will be liable, in any event, for any special, indirect,
consequential, or punitive loss or damage of any kind arising from, relating to or in connection with this Document .

About Aon Aon plc (NYSE:AON) is a leading global professional services firm providing a broad range of risk, retirement and health solutions. Our 50,000 colleagues in 120 countries empower results for clients by using proprietary data and analytics to deliver insights that reduce volatility and improve performance.
© Aon plc 2021 . All rights reserved .The information contained herein and the statements expressed are of a general nature and are not intended to address the circumstances of any particular individual or entity. Although we endeavor to provide accurate and timely information and use sources we consider reliable, there can be no guarantee that such information is accurate as of the date it is received or that it will continue to be accurate in the future. No one should act on such information without appropriate professional advice after a thorough examination of the particular situation.
www.aon.com