ilo strategy social health protection · support the effective governance of social security...
TRANSCRIPT

Social Health Protection
An ILO strategy towards universal access to health care

The Social Security Department of the International Labour Office (ILO) is the unit through which the ILO provides technical assistance and advice to its member countries in the area of social security policy and governance; develops policies to support the extension of social security to all and social inclusion; promotes international social security standards and develops and disseminates tools to support the effective governance of social security schemes.
In 2001, the International Labour Conference (ILC) reached a consensus that high priority should be given to policies and initiatives to extend social security to those who are not presently covered. Accordingly, the ILC directed the ILO to launch a major campaign to promote the extension of social security coverage. The Social Security Policy Briefings series is produced in the framework of the Campaign; it aims to set out the views of the Social Security Department in areas of particular importance, and so provide guidance to ILO member countries in the formulation of their social security policies.
It thus complements the existing Issues in Social Protection Discussion papers series and the Extension of Social Security series published by the Social Security Department by making available a comprehensive set of information tools.
International Labour Office Social Security Department
4, route des Morillons CH-1211 Geneva 22 – Switzerland
Tel.: (+ 41 22) 799 75 65 Fax: (+ 41 22) 799 79 62
[email protected] http://www.ilo.org/secsoc

SOCIAL SECURITY POLICY BRIEFINGS
Paper 1
Social Health Protection
An ILO strategy towards universal access to health care
Global Campaign on Social Security and Coverage for All
Social Security Department
International Labour Office
Copyright © International Labour Organization 2008 First published 2008 Publications of the International Labour Office enjoy copyright under Protocol 2 of the Universal Copyright Convention. Nevertheless, short excerpts from them may be reproduced without authorization, on condition that the source is indicated. For rights of reproduction or translation, application should be made to ILO Publications (Rights and Permissions), International Labour Office, CH-1211 Geneva 22, Switzerland, or by email: [email protected]. The International Labour Office welcomes such applications.
Libraries, institutions and other users registered with reproduction rights organizations may make copies in accordance with the licences issued to them for this purpose. Visit www.ifrro.org to find the reproduction rights organization in your country.
Social health protection. An ILO strategy towards universal access to health care. Social security policy briefings; Paper 1/ International Labour Office, Social Security Department – Geneva: ILO, 2008
ISBN 978-92-2-121161-7 (print) & 978-92-2-121162-4 (web pdf)
International Labour Office; Social Security Dept health insurance / medical care / access to care / scope of coverage / social security financing / role of ILO 02.07.1 Soon available in French: La protection sociale de la santé. Stratégie de l’OIT pour un accès universel aux soins de santé; and in Spanish: Protección Social de la Salud. Una estrategia de la OIT para el acceso universal a la asistencia médica.
ILO Cataloguing in Publication Data
The designations employed in ILO publications, which are in conformity with United Nations practice, and the presentation of material therein do not imply the expression of any opinion whatsoever on the part of the International Labour Office concerning the legal status of any country, area or territory or of its authorities, or concerning the delimitation of its frontiers.
The responsibility for opinions expressed in signed articles, studies and other contributions rests solely with their authors, and publication does not constitute an endorsement by the International Labour Office of the opinions expressed in them.
Reference to names of firms and commercial products and processes does not imply their endorsement by the International Labour Office, and any failure to mention a particular firm, commercial product or process is not a sign of disapproval.
ILO publications and electronic products can be obtained through major booksellers or ILO local offices in many countries, or direct from ILO Publications, International Labour Office, CH-1211 Geneva 22, Switzerland. Catalogues or lists of new publications are available free of charge from the above address, or by email: [email protected]
Visit our website: www.ilo.org/publns
Printed in Switzerland

ILO Strategy Social Health Protection v
Contents
Page
Foreword ........................................................................................................................................... xi
1. Introduction............................................................................................................................. 1
2. What is social health protection? ............................................................................................ 3
3. Financing social health protection: The current situation ....................................................... 7
4. Coverage of social health protection and access to health services ........................................ 17
a. ILO concepts and definitions of coverage and access.................................................. 17
b. Trends in formal social health protection coverage and corresponding data................ 19
c. The formal and informal economy and the need for social health protection .............. 21
d. The lack of access to health services: An attempt to estimate the scale ....................... 24
e. Measuring the access deficit ......................................................................................... 27
f. Some observations on recent developments in social health protection....................... 30
5. Rationalizing the use of pluralistic financing mechanisms: An ILO strategy for achieving universal coverage in social health protection ........................................................................ 33
a. Overall concept of the ILO strategy on rationalizing the use of pluralistic financing mechanisms................................................................................................................... 33
b. Core elements of the ILO strategy on rationalizing the use of pluralistic financing mechanisms................................................................................................................... 34
i. Assessing the coverage gap and the access deficit ............................................. 34
ii. Developing a national coverage plan.................................................................. 34
iii. Strengthening national capacities for implementation ....................................... 47
6. Conclusion .............................................................................................................................. 49
Appendix I. Country experiences: A brief overview........................................................................ 51
a. Africa.................................................................................................................. 51
b. Asia..................................................................................................................... 59
c. Europe ................................................................................................................ 68
d. Latin America..................................................................................................... 71
Appendix II. Estimated access deficit and formal coverage in social health protection .................. 77
Appendix III. ILO Tool Box ............................................................................................................ 91
References ......................................................................................................................................... 95
vi ILO Strategy Social Health Protection
List of Tables
2.1. Sources of funds for social health protection.......................................................................... 5
3.1. Sources of social health protection financing by country income level.................................. 10
3.2. Percentage of the household financial mechanisms to cope with health care expenses, South Africa, Kenya and Senegal, 2005 ................................................................................. 12
4.1. Historical development of formal health protection coverage................................................ 20
4.2. Formal coverage in social health insurance protection in selected countries of Africa and Asia................................................................................................................................... 22
4.3. Percentage of the population with formal health protection coverage in selected Latin American countries and selected years within 1995-2004 ............................................ 22
4.4. Estimated accesss deficit in selected countries ....................................................................... 30
5.1. Health care coverage and access map specimen ..................................................................... 36
5.2. Scope of health financing mechanisms ................................................................................... 39
5.3. Overview: Pros and cons of key financing mechanisms for social health protection............. 40
List of Figures
2.1. Flow of funds .......................................................................................................................... 4
3.1. Income level of countries and death at ages 0-4 and 60+, 2006 ............................................. 7
3.2. Percentage of causes of death in low-,middle- and high-income countries, 2001 .................. 8
3.3. Financing of global health expenditure, 2004......................................................................... 8
3.4. Out-of-pocket expenditure as a percentage of total health expenditure, selected countries, 2006........................................................................................................................ 9
3.5. Percapital health expenditure in US$, by country income level, 2004 ................................... 9
3.6. Total health expenditure as a percentage of GDP and public expenditure on health as a percentage of total health expenditure by country income level, 2004............................ 10
3.7. Sources of health protection by region, 2001.......................................................................... 11
3.8. Total health expenditure as a percentage of GDP, selected low income countries, 2006....... 11
3.9. Spiralling health and poverty trap........................................................................................... 12
3.10. Public expenditure on health as a percentage of total health expenditure, selected OECD countries, 1990, 2000, 2005 .................................................................................................... 13
3.11. Total expenditure on health per capita, US$ purchasing power parity, selected OECD countries, 1960-2005............................................................................................................... 15
4.1. Achieving universal coverage in social health insurance........................................................ 20
4.2. Out-of-pocket expenditure, selected low-income countries, 2006.......................................... 23
4.3. Percentage of poor people in developing countries lacking in access to health services........ 25
4.4. Density of health professionals ............................................................................................... 26
4.5. Regression between access deficit and Human Poverty Index (HPI) ..................................... 28
4.6. Regression between access deficit and Human Development Index (HDI) ........................... 29
A.1. Comparison of selected countries in Africa ............................................................................ 51
A.2. Ghana National Health Insurance sources of funds ................................................................ 55
A.3. Comparison of selected countries in Asia............................................................................... 59
A.4. Comparison of selected countries in Latin America ............................................................... 71

ILO Strategy Social Health Protection vii
List of Boxes
5.1. Health budget for Thailand ..................................................................................................... 37
5.2. Checklist for key policies on health care financing ................................................................ 42
5.3. Checklist for policies on building rational linkages between different health financing mechanisms............................................................................................................................. 43
5.4. Checklist for key policies adequate benefit packages and protection from catastrophic spending.............................................................................................................. 44
5.5. ILO Convention No. 102 / Article 10 ..................................................................................... 45
5.6. Checklist for key policies on creating institutional and organizational efficiency ................. 47
List of Appendix Tables
1. Selected indicators of social health protection in Benin ......................................................... 52
2. Selected indicators of social health protection in Burkina Faso ............................................. 53
3. Selected indicators of social health protection in Egypt ......................................................... 54
4. Selected indicators of social health protection in Ghana ........................................................ 56
5. Selected indicators of social health protection in Kenya ........................................................ 56
6. Selected indicators of social health protection in Senegal ...................................................... 58
7. Selected indicators of social health protection in Tunisia....................................................... 59
8. Selected indicators of social health protection in China ......................................................... 61
9. Selected indicators of social health protection in the Republic of Korea ............................... 62
10. Selected indicators of social health protection in India........................................................... 63
11. Selected indicators of social health protection in Indonesia ................................................... 63
12. Selected indicators of social health protection in Philippines................................................. 64
13. Thailand’s Social Helath Protection Mechanisms .................................................................. 66
14. Selected indicators of social health protection in Thailand..................................................... 67
15. Selected indicators of social health protection in Albania ...................................................... 69
16. Selected indicators of social health protection in Belarus....................................................... 70
17. Selected indicators of social health protection in Georgia...................................................... 71
18. Selected indicators of social health protection in Chile .......................................................... 72
19. Selected indicators of social health protection in Colombia ................................................... 73
20. Selected indicators of social health protection in Costa Rica ................................................. 74
21. Selected indicators of social health protection in Ecuador ..................................................... 75
22. Selected indicators of social health protection in Peru ........................................................... 76
A2.1. Estimated access deficit in social health protection................................................................ 77
A2.2. Formal coverage in social health protection ........................................................................... 83


ILO Strategy Social Health Protection ix
Common Acronyms
ILO International Labour Office
ADB Asian Development Bank
GDP Gross Domestic Product
GTZ Deutsche Gesellschaft für Technische Zusammenarbeit/ German Technical Cooperation
HDI Human Development Index
HPI Human Poverty Index
IHPP International Health Policy Programme
NHA National Health Accounts
MDG(s) Millennium Development Goal(s)
MOH Ministry of Health
OECD Organization for Economic Co-operation and Development
OOP Out-of-Pocket Payments
PRSP Poverty Reduction Strategy Papers
SHI Social Health Insurance
STEP Strategies and Tools Against Exclusion and Poverty
THE Total Health Expenditure
UN United Nations
WHO World Health Organization

ILO Strategy Social Health Protection xi
Foreword
This paper is the first in the series presented by the Social Security Department of the ILO in the field of social health protection, and is a contribution to the assignment bestowed on the International Labour Organization (ILO) by the International Labour Conference, namely to launch the Global Campaign on Social Security Coverage for All.
We hope that it marks the beginning of a wider debate between ILO constituents, researchers, practitioners, decision-makers and other stakeholders in social health protection, on ways to provide coverage to the majority of the world’s population. We also anticipate that it will ensure that the human rights to both health and social security, as laid down in the United Nations Universal Declaration of Human Rights, will become a reality in the shortest possible time. In the course of that debate we shall almost certainly have to modify some of our views, but we hope that the basic approach that underpins our thinking, that is, a rights-based approach that advocates universal access to social health protection, is flexible and open enough to achieve a wide consensus on the two central objectives of social security: poverty alleviation and granting to all people the opportunity to live their lives free of debilitating insecurity.
Xenia Scheil-Adlung wrote the draft of this policy paper and Jens Holst provided the statistical data and some country information. The paper has much benefited from the valuable comments made by ILO constituents, colleagues from various international organizations and experts. Many other people have also contributed to the paper, either by drafting major parts thereof, or by providing comments in writing or orally during various meetings and discussions.
Equally important has been the support by Department staff and colleagues from the field through their practical and conceptual work for the Department, as well as research and technical cooperation activities on various topics carried out throughout the world. All this experience has helped us to draw the policy conclusions presented in this revised version of the paper on social health protection. Its central messages have been discussed in various forums within and outside the ILO, in consultation with ILO constituents, various international organizations, bilateral institutions, and universities.
We are grateful to ILO constituents and others who commented on the draft for consultation of Social health protection: An ILO strategy towards universal access to health care. They also provided important inputs and supported the further development of the ILO approach in achieving universal coverage in social health protection. The vast majority of these comments are duly reflected in the current paper; only few could not be incorporated due to incompatibility with one or more parts of the strategy. We should like to thank ILO constituents from the following countries for their valuable inputs: Australia, Austria, Finland, France, Hungary, Italy, Jamaica, Jordan, Republic of Korea, Latvia, Lebanon, Lithuania, Mexico, Morocco, Myanmar, New Zealand, Peru, Portugal, Switzerland, Thailand, Tunisia and Trinidad and Tobago.
Michael Cichon Director
Xenia Scheil-Adlung Health Policy Coordinator

ILO Strategy Social Health Protection 1
1. Introduction
The affordability of health care is a key issue in most countries. In high-income countries, increasing costs, financial constraints of public budgets and economic considerations regarding international competitiveness have all made social health protection reform a political priority. In many high-, middle- and low-income countries, providing affordable health care is high on the development agenda, given the large numbers of people lacking sufficient financial means to access health services; worldwide, millions of people are pushed into poverty every year by the need to pay for health care.
The denial of access to medically necessary health care has significant social and economic repercussions; aside from effects on health and poverty, the close links between health, the labour market and income generation has an impact on economic growth and development. This may be attributed to the fact that healthier workers have a higher productivity - and labour supply increases if morbidity and mortality rates are lower. Generally, social protection builds human capital that yields economic profits through gains in productivity and higher macroeconomic growth.
Universal social health protection ensures that all people in need have effective access to at least adequate care and is thus a key mechanism for achieving these objectives. It is designed to alleviate the burden caused by ill health, including death, disability and loss of income. Social health protection coverage also reduces the indirect costs of disease and disability, such as lost years of income due to short and long-term disability, care of family members, lower productivity, and the impaired education and social development of children due to sickness. It hence plays a significant role in poverty alleviation.
For many years, it was commonly thought that introducing and extending social health protection in developing countries was premature because they were not economically mature enough to shoulder the financial burden associated with social security. It was argued that attention should first be focused on macroeconomic growth and that the redistribution through social transfers in cash or in kind should be postponed to such a time when the economy had reached a relatively high level of prosperity. That view associated social health protection only with consumption costs.
At present, social health protection is increasingly seen as contributing to building human capital that yields economic profits through gains in productivity and higher macroeconomic growth.
The current debate 1 also focuses on the links between ill health and poverty: these links play an important role in Poverty Reduction Strategy Papers (PRSPs) and have been addressed in the Millennium Development Goals (MDGs) aimed at halving extreme poverty and improving health by the year 2015. Implementing universal social
1 Social health protection has been highlighted at the G8 Summit 2007 in Heiligendamm
(Germany) and will also be an important issue at the G8 Summit in Japan 2008 as well as figuring prominently in several international health initiatives.
Everyone, as a member of society, has the right to social security and is entitled to realization, through national effort and international co-operation and in accordance with the organization and resources of each State, of the economic, social and cultural rights indispensable for his dignity and the free development of his personality. [Art. 22, Universal Declaration of Human Rights, 1948]

2 ILO Strategy Social Health Protection
health protection might turn out to be a milestone for achieving the MDGs by that target date.
The ILO supports the MDGs through its Decent Work Agenda and in the context of fair globalization. The four pillars of this approach include:
1. Employment - the principal route out of poverty is through work and income.
2. Rights – the absence of which will not empower people to escape from poverty.
3. Social protection - as a safeguard of income and underpins health.
4. Dialogue - the participation of employers’ and workers’ organizations in shaping and ensuring appropriate and sustainable government policy for poverty reduction.
The ILO approach to social health protection is founded on the human rights to health and social security - and on the significance of such protection with regard to rights at work and employment. Since the ILO’s founding in 1919, it has emphasized the role of social health protection in reducing poverty, generating income and increasing wealth.
The relevance of social health protection for the Organization may be illustrated by the fact that in the Social Security (Minimum Standards) Convention, 1952 (No. 102), health ranks first among the contingencies covered. The importance of strengthening linkages between rights, employment and development was underlined in the report of the ILO World Commission on the Social Dimension of Globalization (ILO, 2004a).
In view of the alarming deficit in social health protection coverage in many countries and ILO's long experience in this field, a new strategy has been developed to contribute towards achieving universal coverage at a global level. This strategy reinforces the agreement on social security reached among representatives of governments, workers' and employers' organizations at the International Labour Conference in 2001 to give highest priority to "policies and initiatives that can bring social security to those who are not covered by existing systems". It is part of the Global Campaign on Social Security and Coverage for All.
The ILO strategy responds to the needs of uncovered population groups in many developing countries, the informalization of economies and persisting high rate of health related poverty and unemployment. It explicitly recognizes the contribution of all existing forms of social health protection and optimizes their outcomes with a view to achieving universal coverage.
This paper aims to set forth some basic notions about the ILO strategy on rationalizing the use of pluralistic financing mechanisms. It is based on the most recent information on social health protection coverage. After a brief introduction on the ILO's concept of social health protection, the paper outlines global patterns of social health protection financing and coverage. Given the lack of data in social health protection coverage, the paper proposes a new indicator aimed at providing, for the first time, some assessment of the global deficit in access to health services. The ILO strategy takes account of the significant gaps revealed by the ILO access deficit indicator and suggests new pragmatic policies to close the gaps, based on a rational and coherent approach.
ILO Strategy Social Health Protection 3
2. What is social health protection?
Based on the core values of equity, solidarity and social justice, the ILO defines social health protection as a series of public or publicly organized and mandated private measures against social distress and economic loss caused by the reduction of productivity, stoppage or reduction of earnings, or the cost of necessary treatment that can result from ill health.
Equity, solidarity and social justice are understood here as basic characteristics of universal access to social health protection founded on burden sharing, risk pooling, empowerment and participation. It is up to national governments and institutions to put these values into practice.
Achieving universal social health protection coverage - defined as effective access to affordable quality health care and financial protection in case of sickness - is a central objective for the ILO. In this context, coverage refers to social protection in health, taking into account the:
� size of the population covered;
� financial and geographical accessibility of covered services;
� extent to which costs of a benefit package are covered; and
� quality and adequacy of services covered.
Social health protection consists of various financing and organizational options intended to provide adequate benefit packages for protection against the risk of ill health and related financial burden and catastrophe.
There are various mechanisms to finance health services. These range from tax-funded national health services, vouchers and conditional cash benefits, to contribution-based mandatory social health insurance and mandated or regulated private non-profit health insurance schemes (with a clearly defined role in a pluralistic national health financing system comprising a number of different subsystems), as well as mutual and community-based non-profit health insurance schemes. These mechanisms normally involve the pooling of risks between covered persons - and many of them explicitly include cross subsidizations between the rich and the poor. Some form of cross subsidization between the rich and the poor exists in all social health protection systems, otherwise the goal of universal access could not be pursued or attained.
Generally, the following main resources may be used for funding:
� Taxes: Social health protection may be funded from general government revenue such as direct or indirect tax from various levels, including national and local tax in addition to general or earmarked tax. Direct taxes are levied on individuals, households and enterprises and comprise property taxes, personal income tax and corporate profit taxes. Indirect taxes, on the other hand, are obtained from goods and services (e.g. excise / “sin tax” on consumption of tobacco products). Payments related to indirect tax are based on consumption and not on overall income. General taxes can be drawn from different sources and therefore have a broad revenue base; nonetheless, allocation for health care is subject to annual public spending
Social health protection is a series of public or publicly organized and mandated private measures against social distress and economic loss caused by the reduction of productivity, stoppage or reduction of earnings or the cost of necessary treatment that can result from ill health.

4 ILO Strategy Social Health Protection
negotiations. Hypothecated taxes are earmarked for health and may be less susceptible to political influence. Taxes are often used for various forms of social health protection funding. Besides financing national health services, vouchers or conditional cash benefits, taxes are used as subsidies for mixed health protection schemes such as national health insurances, whereby government revenues are used to subsidize the poor. In addition, government revenues may be used as subsidies for social health insurance, community-based and private health insurance, as shown in figure 2.1. Subsidies might cover costs for the poor, deficits, specific services, start-up or investment costs.
Figure 2.1. Flow of funds
� Contributions or payroll taxes: Contributions are collected to fund social health insurance schemes. Contributions are usually mandatory and not risk-related but based on earned income that is collected from the payroll. Employers and employees share contributions. This usually involves formal labour markets, which translates to coverage extended to formal economy workers and their families. International experience shows employee contributions might be as low as 1 per cent of covered monthly earnings, as in Egypt (International Social Security Association, 2007, p.78), and 2.5 per cent in Jamaica (International Social Security Association, 2005, p.135). In the case of employers’ contributions, Egypt provides for 4 per cent of covered monthly payroll and Jamaica for 8.5 per cent 2 of their employees’ gross income. In many countries, contributions are based on the ability to pay and access to health services depends on needs. Contributions may be collected by a single national health insurance fund – or by one or more social health insurance funds which are often independent from the government but subject to regulations.
� Premiums: Premiums are collected by private insurance schemes, including community-based health insurance schemes and private commercial funds. Community-based schemes are usually voluntary and managed by organizations of informal economy workers, community based and non-government entities, cooperatives, trade unions and faith-based groups. Premiums are often flat-rate and services frequently limited. Premiums for private commercial health insurance funds
2 Information provided to ILO by the Jamaica Employers Federation, October 2007.
National health
services
Vouchers
Conditional cash
benefits
Social health insurance
National health insurance
Community-based health insurance Private commercial health
insurance
Providers
ILO Strategy Social Health Protection 5
are usually voluntary and risk-based. People in high-risk groups pay more and those with lower risks pay less. Benefits and services vary depending on the insurance company and insured persons.
� Out-of-pocket payments (OOP): OOPs are often used as a source of funding. However, the ILO does not consider them as a means of financing social health protection. They involve payments made directly to the health care providers at the point of delivery, based on the services utilized, and may be paid partially or in full. They may take the form of direct payments, formal cost sharing or informal payments. Reference is made to direct payments when the consumer pays the full amount of health services not covered by any form of protection. Formal cost sharing (user fees), on the other hand, involves expenditures on health services which are included in the benefit package but are not fully covered, e.g. in order to set incentives.
Apart from the above-mentioned sources, there are other sometimes significant sources of health funding such as donations, grants, loans, employers’ funds and savings accounts. However, these are not further discussed here.
Each mechanism of funding is characterized by specific forms of collecting funds, risk pooling and purchasing of health services. The collection of funds involves an entity which pays (e.g. citizen, insured); a specific type or means of payment (taxes, contributions, and premiums); and an institution which collects the payment - the government (central, regional or local), social security institution, private insurance funds or health providers (table 2.1). Risk pooling refers to sharing of financial risks and accumulating funds for health services. The purchasing of health services involves the shifting of the funds to health service providers for - and on behalf of - the covered population.
Virtually all countries have established systems based on multiple financing mechanisms that combine two or more of the mentioned sources of funding - and the ILO explicitly and pragmatically recognizes the pluralistic nature of national health protection systems. The ILO advises the promotion of systemic combinations of national financing systems that provide:
(a) universal and equitable access to health services;
(b) financial protection in case of sickness; and
(c) overall efficient and effective delivery of health services.
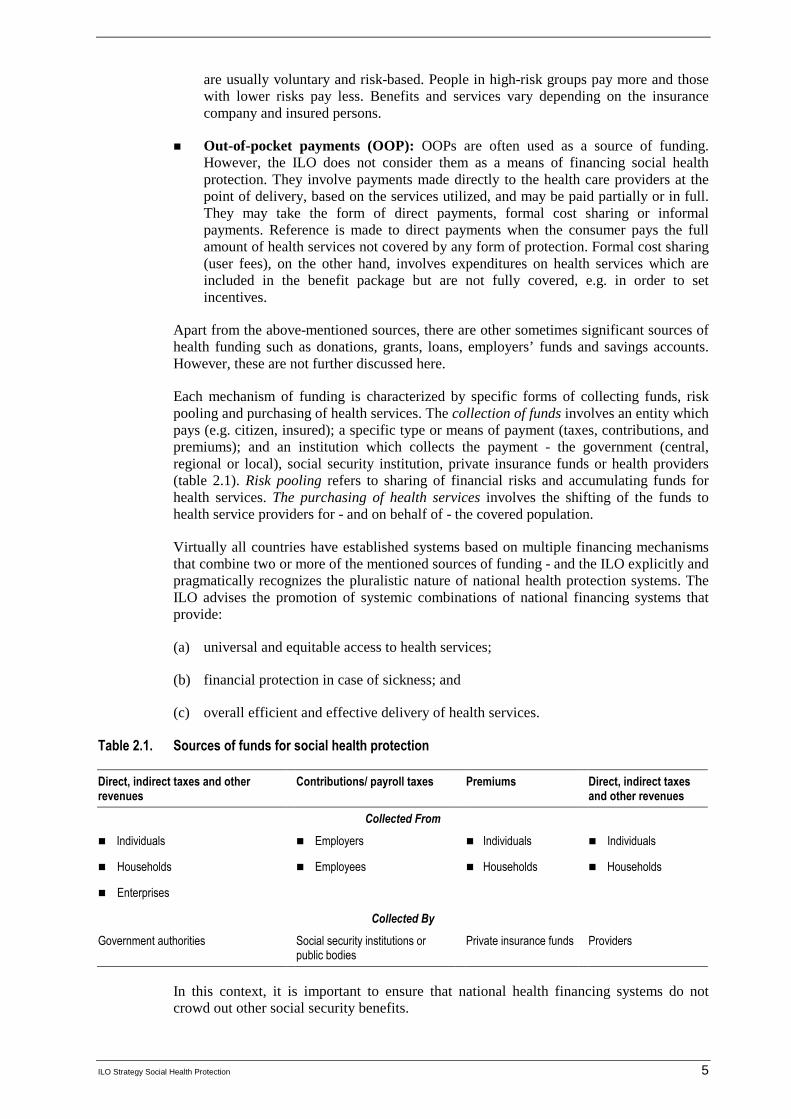
Table 2.1. Sources of funds for social health protection
Direct, indirect taxes and other revenues
Contributions/ payroll taxes Premiums Direct, indirect taxes and other revenues
Collected From
� Individuals � Employers � Individuals � Individuals
� Households � Employees � Households � Households
� Enterprises
Collected By
Government authorities Social security institutions or public bodies
Private insurance funds Providers
In this context, it is important to ensure that national health financing systems do not crowd out other social security benefits.
6 ILO Strategy Social Health Protection
When striving to achieve universal social health protection, organizing and financing health protection are not enough in themselves; economic and social factors also play a pivotal role and attempts must be made to address poverty, support the formalization of the informal economy and create decent workplaces. Social health protection thus cannot be pursued in isolation; it is - and should always be seen as – part and parcel of an overall national social protection strategy.
Furthermore, achieving universal coverage involves developing specific regulations and arrangements that focus on efficiency of organization including purchasing and provider payments; distribution of resources and services across different categories of care and geographic areas; quality; and participation of social partners and civil society. The concrete nature of these related arrangements significantly impacts on the adequacy and availability of care, access to health services, and ultimately on the overall cost of the social health protection system. A key to this goal is to engage in social and national dialogue.
Social dialogue can play a major role in the development and reform of health services by providing the social partners with the opportunity of expressing their own interests and concerns. It allows them to advance together when they have many interests in common and may also help them to reach compromises about matters on which they have different views. Social dialogue in improving health services is based on certain values and principles to which all social partners subscribe (ILO, 2005d, p.6).
The importance of social health protection can be appreciated by looking into its current situation globally, regionally and nationally. The following chapter highlights recent developments and gaps in social health protection.
ILO Strategy Social Health Protection 7
3. Financing social health protection: The current situation
It has been argued that high and sustained economic growth increases demand for employment. By the same token, improvement in earning capacity can lead to increases in labour productivity and growth. Furthermore, economic development has the potential to reduce poverty and promote economic productivity (ADB, 2004) – and a prerequisite for labour productivity is health. It is estimated that an increase of 10 per cent in average life expectancy leads to an increase in annual economic growth of 0.3 to 0.4 per cent (WHO, 2002). Although investment in health through social health protection is vital, it is also fraught with complexities. Challenges in financing social health protection are multidimensional and may be related to socio-economic, demographic and health trends within countries and around the globe.
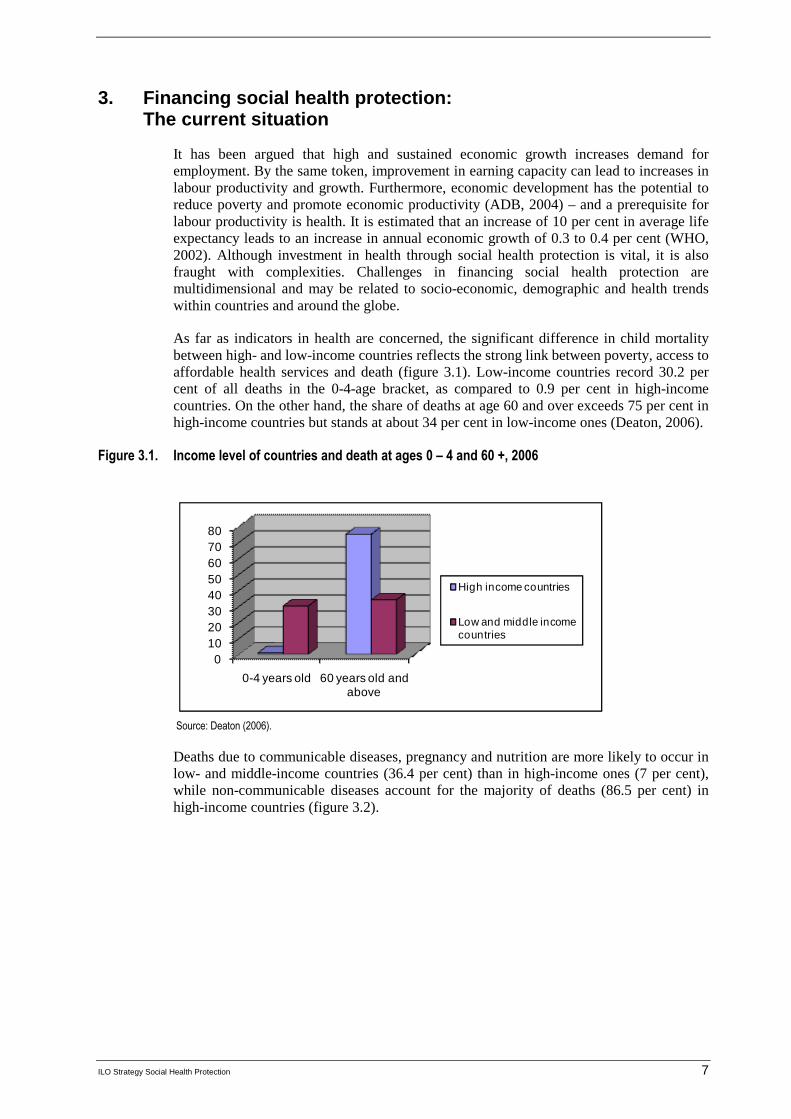
As far as indicators in health are concerned, the significant difference in child mortality between high- and low-income countries reflects the strong link between poverty, access to affordable health services and death (figure 3.1). Low-income countries record 30.2 per cent of all deaths in the 0-4-age bracket, as compared to 0.9 per cent in high-income countries. On the other hand, the share of deaths at age 60 and over exceeds 75 per cent in high-income countries but stands at about 34 per cent in low-income ones (Deaton, 2006).
Figure 3.1. Income level of countries and death at ages 0 – 4 and 60 +, 2006
01020304050607080
0-4 years old 60 years old and above
High income countries
Low and middle income countries
Source: Deaton (2006).
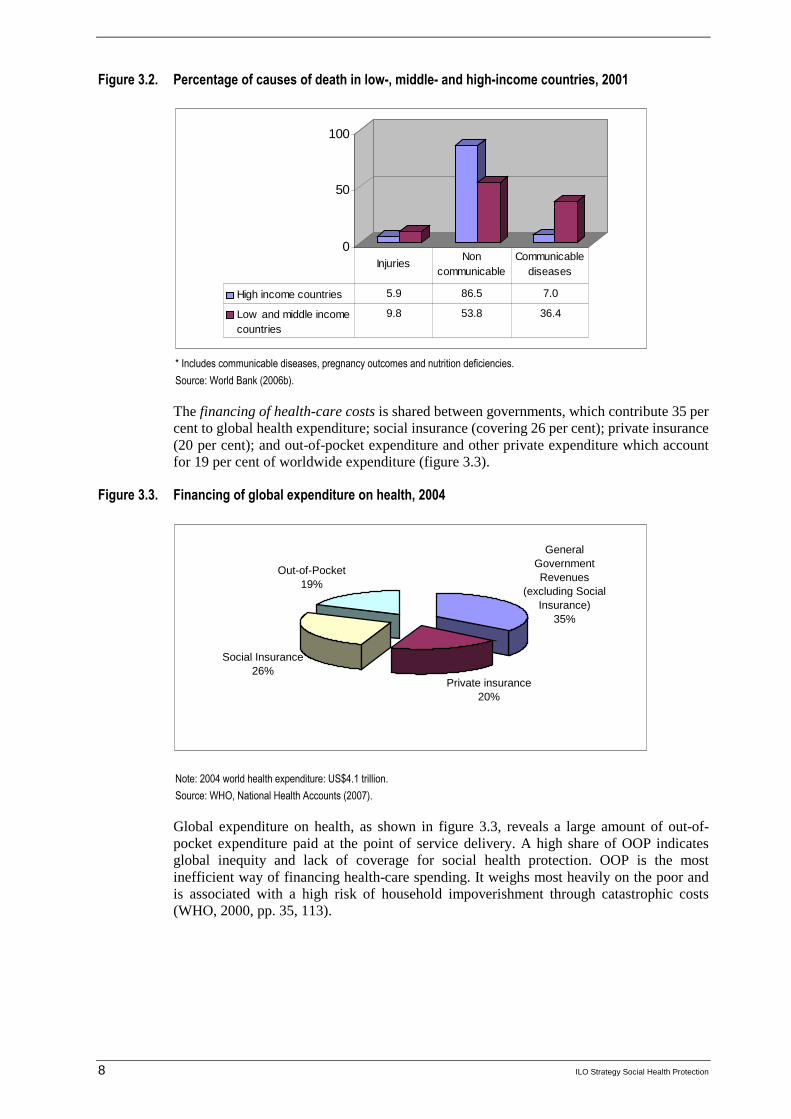
Deaths due to communicable diseases, pregnancy and nutrition are more likely to occur in low- and middle-income countries (36.4 per cent) than in high-income ones (7 per cent), while non-communicable diseases account for the majority of deaths (86.5 per cent) in high-income countries (figure 3.2).
8 ILO Strategy Social Health Protection
Figure 3.2. Percentage of causes of death in low-, middle- and high-income countries, 2001
0
50
100
High income countries 5.9 86.5 7.0
Low and middle incomecountries
9.8 53.8 36.4
InjuriesNon
communicable Communicable
diseases
* Includes communicable diseases, pregnancy outcomes and nutrition deficiencies.
Source: World Bank (2006b).
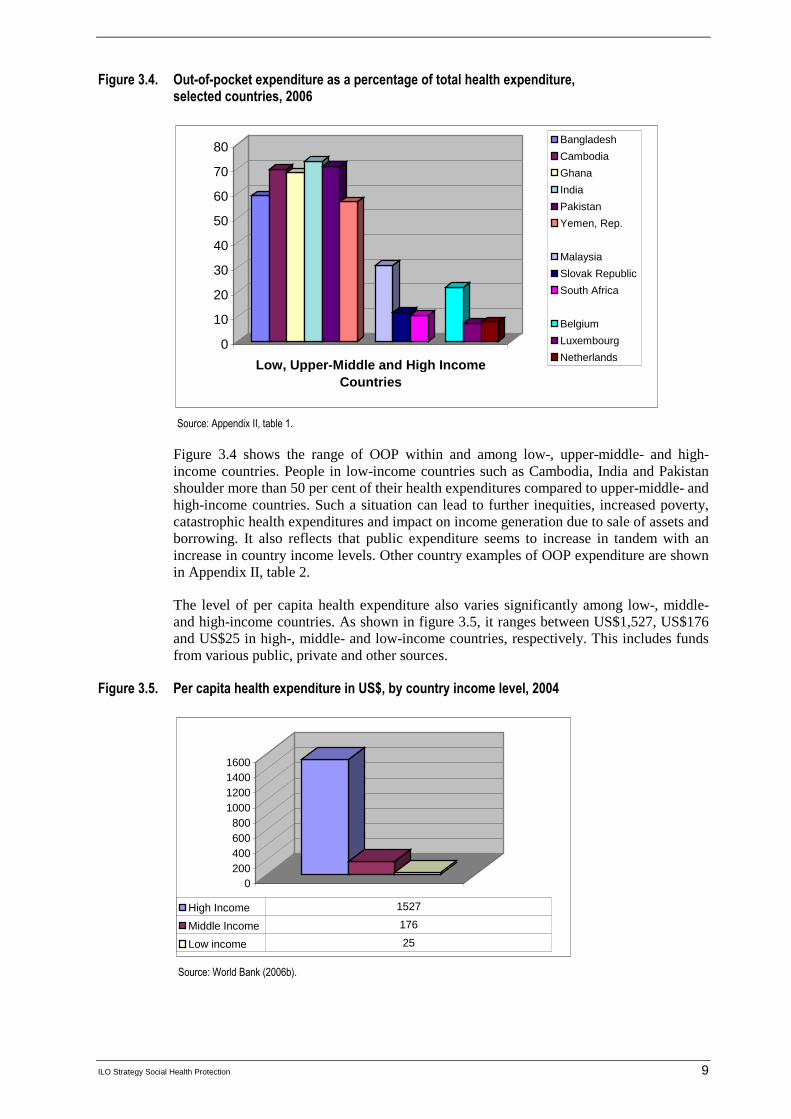
The financing of health-care costs is shared between governments, which contribute 35 per cent to global health expenditure; social insurance (covering 26 per cent); private insurance (20 per cent); and out-of-pocket expenditure and other private expenditure which account for 19 per cent of worldwide expenditure (figure 3.3).
Figure 3.3. Financing of global expenditure on health, 2004
General Government Revenues
(excluding Social Insurance)
35%
Private insurance 20%
Social Insurance26%
Out-of-Pocket19%
Note: 2004 world health expenditure: US$4.1 trillion.
Source: WHO, National Health Accounts (2007).
Global expenditure on health, as shown in figure 3.3, reveals a large amount of out-of-pocket expenditure paid at the point of service delivery. A high share of OOP indicates global inequity and lack of coverage for social health protection. OOP is the most inefficient way of financing health-care spending. It weighs most heavily on the poor and is associated with a high risk of household impoverishment through catastrophic costs (WHO, 2000, pp. 35, 113).
ILO Strategy Social Health Protection 9
Figure 3.4. Out-of-pocket expenditure as a percentage of total health expenditure, selected countries, 2006
0
10
20
30
40
50
60
70
80
Low, Upper-Middle and High Income Countries
Bangladesh
Cambodia
Ghana
India
Pakistan
Yemen, Rep.
Malaysia
Slovak Republic
South Africa
Belgium
Luxembourg
Netherlands
Source: Appendix II, table 1.
Figure 3.4 shows the range of OOP within and among low-, upper-middle- and high-income countries. People in low-income countries such as Cambodia, India and Pakistan shoulder more than 50 per cent of their health expenditures compared to upper-middle- and high-income countries. Such a situation can lead to further inequities, increased poverty, catastrophic health expenditures and impact on income generation due to sale of assets and borrowing. It also reflects that public expenditure seems to increase in tandem with an increase in country income levels. Other country examples of OOP expenditure are shown in Appendix II, table 2.
The level of per capita health expenditure also varies significantly among low-, middle- and high-income countries. As shown in figure 3.5, it ranges between US$1,527, US$176 and US$25 in high-, middle- and low-income countries, respectively. This includes funds from various public, private and other sources.
Figure 3.5. Per capita health expenditure in US$, by country income level, 2004
0200400600800
1000120014001600
High Income 1527
Middle Income 176
Low income 25
Source: World Bank (2006b).

10 ILO Strategy Social Health Protection
The share of total health expenditure as a percentage of GDP amounts to 7.7 per cent in high-income countries, 5.8 per cent in middle-income countries and 4.7 per cent in low-income countries. Public expenditure on health as a percentage of total health expenditure amounts to 70.1 per cent in high-income countries, 61.7 per cent in middle-income countries and 51.7 in low-income countries (figure 3.6).
Figure 3.6. Total health expenditure as a percentage of GDP and public expenditure on health as a percentage of total health expenditure by country income level, 2004
0
10
20
30
40
50
60
70
80
Total Health Expenditure as a % of GDP 7.7 5.8 4.7
Public Expenditure on Health as % of Total HealthExpenditure
70.1 61.7 51.7
High income Middle income Low income
Source: World Bank (2006b).
In the global picture, the growing share of public expenditure on health with rising income levels indicates the increased risk pooling through taxes and e.g. contributions for mandatory social health insurance. This share is usually linked to the overall social and economic development of countries with regard to labour markets, financial markets, enforcement of legislation, infrastructure, capacity to collect taxes etc.
Table 3.1. Sources of social health protection financing by country income level
Countries Tax revenues for social health protection in % of GDP
Social security contributions in health in % of GDP
Low-income 14.5 0.7
Low / middle-income 16.3 1.4
Upper-middle income 21.9 4.3
High-income 26.5 7.2
Source: IMF (2004) , World Bank (2004).
As shown in table 3.1, trends in the use of tax revenues for social health protection range from 14.5 per cent of GDP in low-income countries to 26.5 per cent in high-income countries. Contributions to mandatory social health insurance are significantly lower and range from 0.7 per cent in low-income countries to 7.2 per cent in high-income countries. Globally, the share of tax revenues is higher than the share of contributions - and both are positively correlated to income.
At the regional level, the share of different forms of social health protection in overall health spending varies significantly (figure 3.7). In 2001, tax spending was - at 40 per cent

ILO Strategy Social Health Protection 11
- relatively high in Africa, Eastern Mediterranean countries and Europe; social health insurance ranked particularly high in OECD and transition countries in the European region, in Western Pacific and in Eastern Mediterranean countries; while in the Americas private health insurance played a key role.
Figure 3.7. Sources of health protection by region, 2001
0% 20% 40% 60% 80% 100%
Other
Out-of-Pocket
Private insurance
Social insurance
Government South Asia
East Asia and the Pacif ic
Eastern Europe and Central Asia
Latin America and the Caribbean
Middle East and North Africa
Sub-Saharan Africa
Source: WHO, National Health Accounts Data (2003).
Specific experiences of groups of countries (low-, middle- and high-income countries) reflect more closely the trends in financing social health protection.
Current concerns in low-income countries often relate to the fact that key health policy targets, such as those formulated in the Millennium Development Goals (MDGs), cannot be achieved with the limited funds available. The populations suffer considerably from health and health-related problems, as evidenced by total health expenditures ranging from between under two per cent of GDP in the Democratic Republic of Congo and above 10 per cent of GDP in Cambodia (figure 3.8). The impact of inadequate or low funding in poor countries is similarly enormous, given that people not only lack access to health services but are also more likely to die from diseases that are curable in richer countries – for instance, respiratory infections which account for 2.9 per cent of all deaths in low-income countries, but for relatively few deaths in high-income countries (Deaton, 2006).
Figure 3.8. Total health expenditure as a percentage of GDP, selected low-income countries, 2006
0
2
4
6
8
10
12
Per
cen
tag
e
Low Income Countries
CambodiaBeninMalawiZimbabweBangladeshYemen, Rep.TunisiaIndiaBurundiPakistanCongo, Dem. Rep.
Source: Appendix II, table 2.
The relationship between ill health and poverty has been clearly shown in quantitative ILO/WHO/OECD studies. In countries such as Kenya, Senegal and South Africa, the impoverishment level due to health payments amounts to between 1.5 and 5.4 per cent of

12 ILO Strategy Social Health Protection
households – implying that in 2005 alone, over 100,000 households in Kenya and Senegal, and about 290,000 households in South Africa fell below the poverty line as a direct result of paying for health services. Table 3.2 shows how catastrophic expenses burden the uninsured. In all three countries, out-of-pocket health payments deepen the level of poverty of people that are already poor (up to 10 per cent of households in Senegal, for example) (Scheil-Adlung et al., 2006).
Table 3.2. Percentage of household financial mechanisms to cope with health care expenses, South Africa, Kenya and Senegal, 2005
South Africa Kenya Senegal
Uninsured(%)
Insured (%)
Uninsured(%)
Insured (%)
Uninsured(%)
Insured(%)
Sales of assets 5.9 10.6 1.0 0.2 15.4 4.4
Borrowing from family or friends
10.5 7.0 4.1 4.3 27.9 12.3
Borrowing from outside 11.5 3.0 3.2 6.1
Source: Scheil-Adlung et al (2005).
For people experiencing extreme poverty, health is a crucially important economic asset (OECD, 2003; WHO, 2003). Loss of health and productivity pose major problems for a socially vulnerable person and his or her family. When a poor individual or any member of the family falls ill, the entire household may be forced to address the health needs of the sick by skipping school, missing opportunities to gain income and selling prized livelihood assets.
Figure 3.9. Spiraling health and poverty trap
Source: Adapted from ILO (2005c).
These health and health-related events can be catastrophic and further plunge people into poverty due to income loss and high health-care costs. This situation might lead to vicious cycles of poverty and ill health that can continue from one generation to the next if left unattended (figure 3.9). Social health protection is vital to address the health and financial risks to which vulnerable people are exposed.
As for high-income countries, developments in social health protection show the increasing share of public expenditure and rising levels of income, indicating a growing proportion of risk pooling through taxes and other forms of social health protection. This is linked to the overall social and economic development of countries: the labour markets, financial markets, legislation, institutional infrastructure, and capacity to collect taxes.
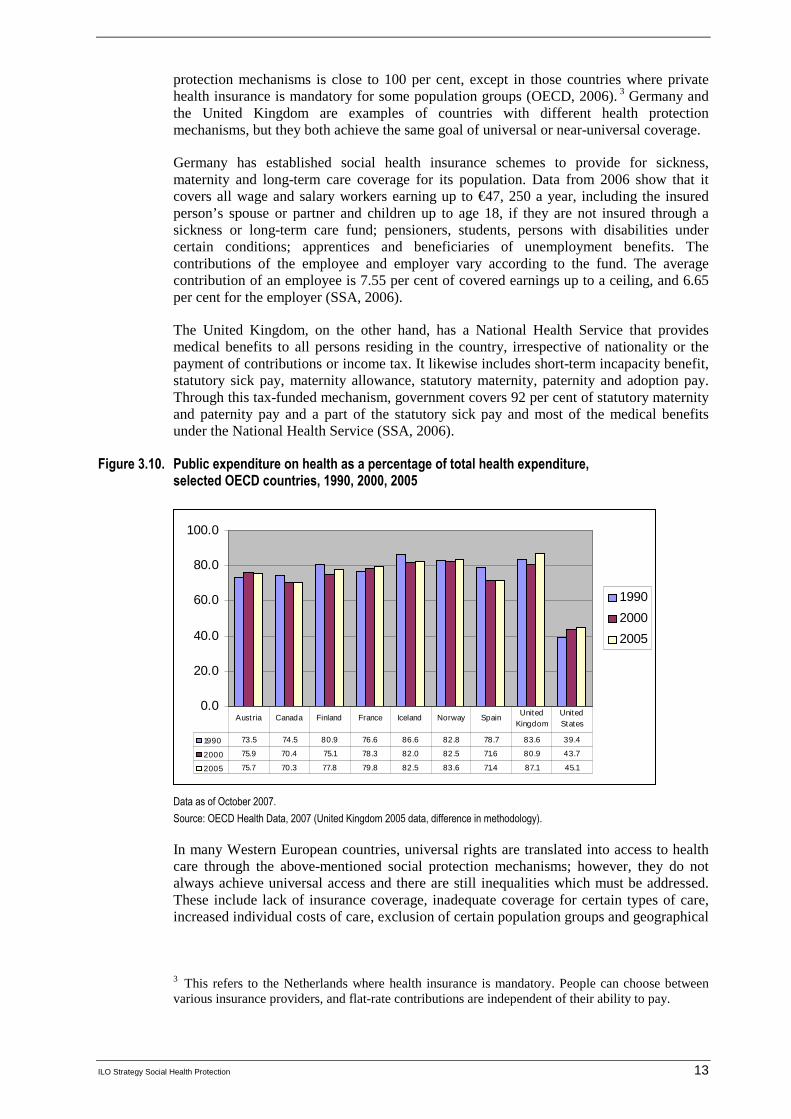
In almost all OECD countries, public spending on health is by far the most relevant source of funding which provides citizens with social health protection (figure 3.10). In Europe, government and social security spending together account for an average of about 70 per cent of total expenditure for health care. The population covered by public social
ILO Strategy Social Health Protection 13
protection mechanisms is close to 100 per cent, except in those countries where private health insurance is mandatory for some population groups (OECD, 2006). 3 Germany and the United Kingdom are examples of countries with different health protection mechanisms, but they both achieve the same goal of universal or near-universal coverage.
Germany has established social health insurance schemes to provide for sickness, maternity and long-term care coverage for its population. Data from 2006 show that it covers all wage and salary workers earning up to €47, 250 a year, including the insured person’s spouse or partner and children up to age 18, if they are not insured through a sickness or long-term care fund; pensioners, students, persons with disabilities under certain conditions; apprentices and beneficiaries of unemployment benefits. The contributions of the employee and employer vary according to the fund. The average contribution of an employee is 7.55 per cent of covered earnings up to a ceiling, and 6.65 per cent for the employer (SSA, 2006).
The United Kingdom, on the other hand, has a National Health Service that provides medical benefits to all persons residing in the country, irrespective of nationality or the payment of contributions or income tax. It likewise includes short-term incapacity benefit, statutory sick pay, maternity allowance, statutory maternity, paternity and adoption pay. Through this tax-funded mechanism, government covers 92 per cent of statutory maternity and paternity pay and a part of the statutory sick pay and most of the medical benefits under the National Health Service (SSA, 2006).
Figure 3.10. Public expenditure on health as a percentage of total health expenditure, selected OECD countries, 1990, 2000, 2005
0.0
20.0
40.0
60.0
80.0
100.0
1990
2000
2005
1990 73.5 74.5 80.9 76.6 86.6 82.8 78.7 83.6 39.4
2000 75.9 70.4 75.1 78.3 82.0 82.5 71.6 80.9 43.7
2005 75.7 70.3 77.8 79.8 82.5 83.6 71.4 87.1 45.1
Austria Canada Finland France Iceland Norway SpainUnited
KingdomUnited States
Data as of October 2007.
Source: OECD Health Data, 2007 (United Kingdom 2005 data, difference in methodology).
In many Western European countries, universal rights are translated into access to health care through the above-mentioned social protection mechanisms; however, they do not always achieve universal access and there are still inequalities which must be addressed. These include lack of insurance coverage, inadequate coverage for certain types of care, increased individual costs of care, exclusion of certain population groups and geographical
3 This refers to the Netherlands where health insurance is mandatory. People can choose between
various insurance providers, and flat-rate contributions are independent of their ability to pay.

14 ILO Strategy Social Health Protection
disparities of supply of health providers. Long waiting periods for medical treatments, as well as lack of information and complex administrative procedures, are further shortcomings. Although increased efforts have been made to cover excluded groups, some gaps remain, e.g. for persons lacking permanent residence status or citizenship (European Commission, 2007, pp. 84-85).
Other challenges faced by populations in high-income countries include demographic ageing, shortage of health professionals (e.g. nurses) and changes in disease trends - which include an increasing prevalence of lifestyle-related diseases, such as obesity 4 - and disability patterns. Disability due to chronic diseases is partly linked to ageing and often requires expensive and labour-intensive long-term care. Data from Germany indicate that in 2002 about 2.5 per cent of the total population was dependent on long-term care, and the figure is expected to rise to 3.4 per cent by 2020 (Federal Statistical Office, 2003). While most high-income countries provide for some kind of professional long-term care services, these often cover only a small percentage of the nursing care required. Given the cost of long-term care, many elderly dependents are unable to access services considered necessary.
Figure 3.11 shows increasing per capita health expenditure in OECD countries from 1960 to 2005. The average health expenditure per capita for persons 65 and older in OECD countries is estimated to be about three times higher than that for younger persons (OECD, 2005a). It is projected that due to demographic ageing, total health spending in OECD countries might increase by about 3 per cent of GDP over the period 2000-50 (OECD, 2004). Total expenditure for long-term care ranges between 0.2 per cent and 3 per cent of GDP in OECD countries (OECD, 2005c). Public revenues are the main source of funding for these expenditures. Nursing care in institutions accounts for 82.8 per cent of total expenditure on long-term care in Canada and for 54.7 per cent in Germany.
Figure 3.11. Total expenditure on health per capita, US $ purchasing power parity, selected OECD countries, 1960-2005
0
1000
2000
3000
4000
5000
6000
7000
1960 1970 1980 1990 2000 2005
Austria
Canada
Finland
France
Iceland
Norw ay
Spain
United Kingdom
United States
Data as of Oct. 2007.
Source: OECD Health Data, 2007 (United Kingdom 2005 data, difference in methodology).
The expected development of health-care costs for higher age-groups and long-term care pose a formidable challenge to the health systems of industrialized countries. New ways to invest in preventing long-term dependency on chronic care and financing of care need to
4 As in Finland, specified in the document containing comments on the ILO strategy paper provided
by the Finnish Ministry of Labour.

ILO Strategy Social Health Protection 15
be devised to avoid the re-emergence of old-age poverty or the dependency on charity in industrialized countries.
Access to adequate and affordable health care for all remains a key problem for many poor countries; however, it is also becoming an increasing challenge for high-income countries, where demographic trends, rising costs, financial constraints of public budgets and economic considerations concerning international competitiveness are making social health protection reform a political priority.
During the past decade, there has been a growing tendency, in most countries, to use various sources of funding simultaneously for health protection mechanisms. This has coincided with the widely held view that universal access to health services should be achieved as quickly as possible. The corresponding financing mechanisms are considered complementary at all stages of development.
In summary, the above findings indicate that national patterns of health financing not only have an impact on the health status of the population but also on their income levels and income security. The global profile of financing social health protection for many low- and middle-income countries is as follows:
� tax funding is significantly higher than contribution funding and both are positively correlated to income;
� there is a close relation between income levels of countries, access to health services and mortality;
� the share of public financing of total health expenditure is low;
� limited financial protection leads to high levels of OOP and ensuing health-related poverty;
� solidarity in financing, expressed by risk pooling, is limited;
� share of social health protection expenditure of GDP and of total health expenditure is low; and
� a large private share of health financing shifts the burden of health expenditure to households.
The experience of many industrialized countries shows that social health protection can raise enough funds to achieve universal access, while protecting the individual against the risk of high health-care costs in case of sickness.
The key concepts of social health protection are vital in understanding the approach to providing universal coverage to the population. The ILO, as a proponent of social health protection, advocates these concepts in order to improve overall access to health services.


ILO Strategy Social Health Protection 17
4. Coverage of social health protection and access to health services
a. ILO concepts and definitions of coverage and access
The ILO’s ultimate objective in the field of social health protection is:
To achieve universal social health protection coverage defined as effective access to affordable health care of adequate quality and financial protection in case of sickness. 5
The concepts and definitions of terminologies related to social health protection advocated by the ILO are introduced in this chapter and will be used in describing the ILO approach.
Concept of Coverage
This definition of coverage refers to the extension of social health protection with respect to the size of the population that can access health services and the extent to which costs of the defined services are covered, so that the amount of health-care cost borne out of pocket does not pose a barrier to access or result in service of limited quality.
To be effective, universal coverage needs to ensure access to care for all residents of a country, regardless of the financing subsystem to which they belong. This does not preclude national health policies from focusing at least temporarily on priority groups such as women or the poor when setting up or extending social health protection.
Definition of Access
For the ILO, coverage relates to effective access to health services that medically match the morbidity structure and needs of the covered population. Compared to legal coverage that describes rights and formal entitlements, effective access refers to the physical, financial and geographical availability of services.
The ILO advocates that benefit packages (i.e. packages of health services that are made available to the covered population) should be defined with a view to maintaining, restoring or improving health, guaranteeing the ability to work and meeting personal health-care needs. Key criteria for establishing benefit packages include the structure and
5 This was first formulated in the Medical Care Recommendation, 1944 (No. 69), which in its
paragraph 8 provides that “[t]he medical care service should cover all members of the community, whether or not they are gainfully occupied”. The universality of the right to health care is also formulated in the Declaration concerning the aims and purposes of the International Labour Organization (Declaration of Philadelphia), 1944, which states as follows: “The Conference recognizes the solemn obligation of the International Labour Organization to further among the nations of the world programmes which will achieve: …. (f) the extension of social security measures to provide a basic income to all in need of such protection and comprehensive medical care;…”. In addition, the 1948 Universal Declaration of Human Rights provides in its Article 25 (1) that “[e]veryone has the right to a standard of living adequate for the health and well-being of himself and of his family, including food, clothing, housing and medical care and necessary social service ser services, and the right to security in the event of unemployment, sickness, disability, widowhood, old age or other lack of livelihood in circumstances beyond his control”.

18 ILO Strategy Social Health Protection
volume of the burden of disease, the effectiveness of interventions, the demand and capacity to pay.
Effective access includes both access to health services and financial protection. Financial protection is crucial to avoid health-related impoverishment. Financial protection includes the avoidance of out-of-pocket payments that reduce the affordability of services and – ideally – some compensation for productivity loss due to illness.
Dimensions of Affordability
Affordability of services refers to the non-existence of financial barriers of access to health services for individuals, groups of individuals and societies as a whole.
Affordability for particular groups concerns first of all the poor and aims at avoiding health-related poverty. This concept should be defined in relation to the maximum share of cost for necessary health care at total household income net of the cost of subsistence; for example, health-care costs could be considered affordable if they amount to less than 40 per cent of the household income remaining after subsistence needs have been met. 6 In line with the WHO, the ILO considers health-care costs below that share to be non-catastrophic for households. Universal coverage is thus associated with equity in financing, implying that households should only be asked to contribute in relation to their ability to pay (Evans, 2007, p.9).
Macroeconomic affordability relates particularly to the fiscal space that can be made available to finance a level of expenditure that ensures universal access to services of adequate quality without jeopardizing economic performance or crowding out other essential national services (such as social cash transfers or education, internal security, etc.). Necessary expenditure levels depend on a population’s health status, the availability of infrastructure, the price level of services and the efficiency of service delivery. While the ILO does not advocate specific benchmarks on public spending on health, it recognizes that several benchmarks for spending on health have been set by other international organizations and commissions, such as the World Bank and the Commission on Macroeconomics and Health (CMH) established by the WHO.
Notion of Quality
The notion of quality refers to various dimensions. These include quality of medical interventions, e.g. compliance with medical guidelines or protocols as developed by WHO or other institutions. The quality of services also includes ethical dimensions such as dignity, confidentiality, respect of gender and culture, and issues such as choice of provider and waiting times.
Compared to the definition of coverage in other areas of social protection, the concept of social health protection coverage is rather complex and multidimensional. Hence, when quantifying the share of the population covered by social health protection, the various dimensions of coverage need to be taken into account. Due to the complexity of the subject matter, no statistical measurement of coverage can be ideal. A set of imperfect indicators is all that can be hoped for. The following section of this chapter provides information on the present level of - and trends in - social health protection coverage based on existing information.
6 This definition refers to the WHO definition of "catastrophic health expenditure".
ILO Strategy Social Health Protection 19
b. Trends in formal social health protection coverage and corresponding data
The history of social health protection is characterized by a gradual increase in risk pooling: some two hundred years ago, private – out-of-pocket – spending was the only financing mechanism available. Smaller risk pools were subsequently developed, but a robust notion of social protection in health did not emerge before Bismarck and Beveridge put the concepts of social health insurance and National Health Service into practice, respectively.
Today, the pioneer countries of social health protection, such as Germany, Luxembourg, Belgium, France and the United Kingdom, are high-income countries with universal formal coverage and effective access to health services. The main health financing mechanisms still being used are contribution-based social health insurance and the tax-based National Health Service. These countries only have a small share of health expenditure by private for-profit insurance companies and an OOP share of about 10 per cent of total health expenditure (Appendix II, table 2).
The trends in formal social health protection coverage, which can be delineated on the basis of existing sources of information, suggest a link (World Bank, 2006b) between rising income levels of countries and the use of health financing mechanisms based on risk pooling and prepayment. However, it is important to note that levels of health expenditure and formal social health protection coverage vary greatly based on the national level of income. This indicates that there is considerable policy space for countries wishing to introduce social protection financing to cover health-care risks.
While there may be a link between increasing national income and the use of prepayment and risk pooling mechanisms, there seems to be a number of countries where this correlation is not apparent. Data presented in Appendix II, table 1, suggest that the extension of social health protection is not necessarily directly linked to a country's income level:
� Burundi and the United Republic of Tanzania, countries with GDP per capita of US$100 and US$290, respectively, formally cover about 13 and 14.5 per cent of their population. The Democratic Republic of the Congo, on the other hand, with a similar GDP per capita, provides coverage at a rate of only 0.2 per cent.
� In Ghana with a per capita GDP of US$320, 18.7 per cent of the population is formally covered by a health protection scheme, while corresponding rates are significantly lower in Togo with 0.4 per cent coverage (GDP per capita US$310,) and Burkina Faso with 0.2 per cent coverage (GDP per capita US$300).
� A country with a slightly higher GDP per capita like Kenya (US$390) offers formal social health protection to a quarter of its population, and Haiti with no more than US$380 per capita to as much as 60 per cent. Countries with a higher level of GDP like Bolivia (US$890, coverage rate 66 per cent) and Guinea-Bissau (US$920, coverage rate 1.6 per cent) also show very different rates of formal coverage.
A country's specific situation, including its strong political will to set priorities, can therefore have an impact on the amount of social health protection its provides to its constituents. Social health protection is an option for low-income countries, and the extent of population coverage is, to some extent, independent of income levels. The composition and design of the benefit packages are, however, different when comparing countries based on their income level - as, for instance, in the case of Germany and the Republic of Korea.

20 ILO Strategy Social Health Protection
The historical developments of national coverage rates also corroborate this trend. Some countries have taken many decades to achieve high levels of coverage; whereas others, starting from similarly low levels of GDP per capita, achieved full coverage within only a few decades or even years (figure 4.1).
Figure 4.1. Achieving universal coverage in social health insurance
0
20
40
60
80
100
120
1920 1950 1980/1990 2007
Year
Co
vera
ge
Germany
France
Korea
Thailand
Luxemburg
Canada
Mexico
Austria
Ghana(estimate)
Sources: ILO: Compulsory sickness insurance, Geneva, 1927 (for years 1920 to 1925); OECD Health Data 2005 (for years 1970 to 2000).
Table 4.1 compares the cases of Austria, Canada, France, Germany, the United Kingdom, Japan, the Republic of Korea, Luxembourg and Norway. In the 1920s, countries such as Austria and Germany formally covered some 30 per cent of their total population while others (e.g. France and Norway) had formal coverage rates of around 20 per cent, and Japan only 3.3 per cent. In 1970, the situation had changed considerably: all countries – except the Republic of Korea – had achieved between 90 per cent and 100 per cent coverage. The related GDP per capita ranged between US$1,997 in Austria and US$3,985 in Canada. In 1980, the Republic of Korea covered some 30 per cent of the total population, based on a GDP per capita of US$1,632; by 2000 (in 1989) it had achieved 100 per cent formal coverage, with a GDP per capita of US$5,429. This coverage rate was thus achieved with a per capita GDP of less than one-third of the other countries compared.
Table 4.1. Historical development of formal health protection coverage
Country Year Total number of insuredas percentage
of total population
GDP per capita /US$ exchange rate
Austria
1920192319241925197019802000
18.332.734
34.3919999
1 99710 53023167
Canada
-197019802000
-100100100
3 98510 84322 708

ILO Strategy Social Health Protection 21
Country Year Total number of insuredas percentage
of total population
GDP per capita /US$ exchange rate
France / Alsace-Lorraine France
1921197019802000
22.995.799.399.8
2 88412 74221 884
Germany
19201925197019802000
31.7328891-
3 04413 14522 814
Great Britain / United Kingdom
192119221925197019802000
35.23535
100100100
2 2059 524
23 954
Japan 1927197019802000
3.3100100100
1 9719 164
37 544
Republic of Korea 197019802000
-29.8100
2721 6325,429
Luxembourg 1922197019802000
16,6100100
-
3 72814 43343 083
Norway
19201925197019802000
21.321.6100100100
3 28515 51936 028
Sources: ILO: Compulsory sickness insurance, Geneva, 1927 (for years 1920 to 1925); OECD Health Data 2005 (for years 1970 to 2000).
c. The formal and informal economy and the need for social health protection
In Tables 4.2 and 4.3, coverage is measured in terms of the population formally covered by social health protection, e.g. under legislation, without reference being made to effective access to health services, quality of services or other dimensions of coverage discussed later in the section. Data show the various social protection schemes in these countries.
22 ILO Strategy Social Health Protection
Table 4.2. Formal coverage in social health insurance protection in selected countries of Africa and Asia
Country Insurance schemes Estimated formal coverage in % of total population
China
– Urban workers
– Basic insurance
– RCMS (new)
10
India
– EISIS
– CGHS
– CBHI
20
Indonesia
– ASKES
– JAMSOSTEK
– CBHI
20
Kenya – NHIF 7
Lao People's Democratic Republic
– CCS
– SSO
– CBHI
5
Mongolia – National scheme 78
Philippines – Phil Health
– CBHI 55
Senegal – IMPs
– MOH 11.4
Source: WHO (2005); Scheil-Adlung et al. (2006).
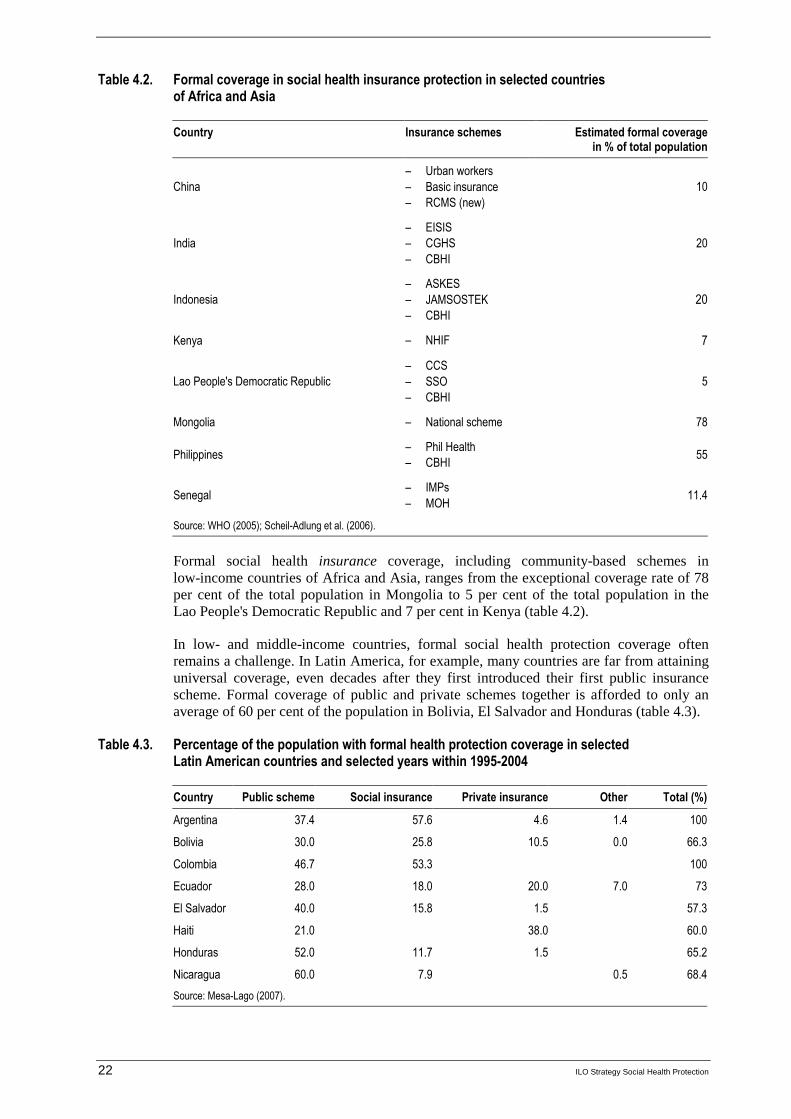
Formal social health insurance coverage, including community-based schemes in low-income countries of Africa and Asia, ranges from the exceptional coverage rate of 78 per cent of the total population in Mongolia to 5 per cent of the total population in the Lao People's Democratic Republic and 7 per cent in Kenya (table 4.2).
In low- and middle-income countries, formal social health protection coverage often remains a challenge. In Latin America, for example, many countries are far from attaining universal coverage, even decades after they first introduced their first public insurance scheme. Formal coverage of public and private schemes together is afforded to only an average of 60 per cent of the population in Bolivia, El Salvador and Honduras (table 4.3).
Table 4.3. Percentage of the population with formal health protection coverage in selected Latin American countries and selected years within 1995-2004
Country Public scheme Social insurance Private insurance Other Total (%)
Argentina 37.4 57.6 4.6 1.4 100
Bolivia 30.0 25.8 10.5 0.0 66.3
Colombia 46.7 53.3 100
Ecuador 28.0 18.0 20.0 7.0 73
El Salvador 40.0 15.8 1.5 57.3
Haiti 21.0 38.0 60.0
Honduras 52.0 11.7 1.5 65.2
Nicaragua 60.0 7.9 0.5 68.4
Source: Mesa-Lago (2007).

ILO Strategy Social Health Protection 23
Out-of-pocket payment, on the other hand, serves as the key financing mechanism for health care in many low-income countries – up to 80 per cent of total health expenditure in countries such as Myanmar, the Democratic Republic of the Congo, Guinea and Tajikistan. These values are above the average OOP expenditure (49.2 per cent) of 45 low-income countries. Remaining expenditures are usually financed by taxes and, to a limited extent, by social and community-based health insurance schemes (figure 4.2).
Figure 4.2. Out-of-pocket expenditure, selected low-income countries, 2006
0.0
20.0
40.0
60.0
80.0
100.0
OOP 49.2 81.7 82.9 79.2 80.4
Average OOP
Congo, Dem.
Guinea Tajikistan Myanmar
Source: Appendix II, table 1.
In middle-income countries, such as Lebanon and Guatemala, private for-profit insurance is reducing the share of OOP. However, OOP often remains the principal financing mechanism, followed by government budgets and social health insurance. In at least 22 countries (China and India among them, see Appendix II, table 2), 50 per cent and more of total health expenditure is borne out of pocket.
Health care is imperative for all workers and their families, regardless of their employment status in the formal and informal economy. Informal economy refers to economic activities not covered by government regulations and laws, including those pertaining to labour protection and social security (ILO, 2004c, p.1). In low- and middle- income countries, many workers and their families do not have suitable health coverage. This is especially true for people in the informal economy (Unni et al., 2002).
The ILO report ‘Decent Work and the Informal Economy’ (ILO, 2002d) states that determining the size, composition and development of the informal economy is exceedingly difficult. It may be composed of informal employment within and outside informal and formal enterprises. Those within informal (e.g. small unregistered or unincorporated) enterprises include employers, employees, own account operators and unpaid family workers. There are also various types of informal wage workers who work for formal enterprises, households, or who have no fixed employer. These include causal day labourers, domestic workers, industrial outworkers (notably homeworkers) and undeclared workers (ILO, 2002c). Informal enterprises are likely to function with low levels of capital, skills and technology and limited access to markets; they provide low and unstable incomes and poor working conditions (ILO, 2004, p.1).
Globalization might contribute to the growth of the informal economy. Competition drives employers to cut costs by resorting to outsourcing to informal enterprises or home-based workers, or to engage temporary workers who do not have social protection. National labour policies do not commonly include temporary and seasonal workers (ILO, 2005, p.20). In addition, these workers do not have job security or benefits. They are more

24 ILO Strategy Social Health Protection
frequently exposed to dangerous and unhealthy working conditions, and are insufficiently informed to change their circumstances (ILO, 2002, p. 21).
People in developing countries who engage in informal employment are often characterized as those with extensive manual/physical labour, prolonged working hours, poor/unhygienic living conditions, deprived benefits, poor bargaining power and voice and deficient capital and assets (Sinha, 2002). Some migrants, especially illegal migrants, are also part of the informal economy and share the same challenges - particularly with respect to limited access to health care and services. Information about their health is usually scanty on account of their socio-economic conditions and legal status.
Most workers in the informal economy are vulnerable. High health-care costs and serious illnesses often force them to sell their assets and/or borrow money, leaving them heavily indebted and predisposing them to vicious cycle of poverty and ill health. Social health protection is a vital option to shield members of the informal economy from health and financial risks. Although covering informal economy workers and their families constitutes a major challenge, a number of initiatives have been launched to capture these workers by pursuing universal coverage and/or extending social health insurance.
An example of an organization covering the informal economy is the community-based scheme in India, the Yeshasvini Co-Operative Farmers Health Scheme (Karnataka). A member’s annual premium amounts to US$ 3 per person, which is supplemented by a Government subsidy of US$ 2.5 per person. About 2 million people are covered by the scheme. The benefit package includes surgical procedures and outpatient diagnosis. Maximum benefit per insured individual per procedure is US$ 2,300 - or US$ 4,600 per year. Recently, medical emergencies (dog bites, accidental poisoning, road traffic accidents, etc.), normal deliveries and pediatric care within the first five days after birth have been included in the package (ILO, 2007, p.2).
The ILO-GTZ-WHO Consortium recently sponsored an international conference to examine ongoing country interventions to extend financial protection through social health insurance to workers in the informal economy. 7 The Consortium, forged in 2004, aims to address the low coverage in social health protection resulting in poor access to health services and catastrophic health expenditures. It endeavours to extend coverage in developing countries through various options of health financing such as tax-based financing, national or social health insurance or community based micro insurance or a combination of various options (e.g. national health insurance).
d. The lack of access to health services: An attempt to estimate the scale
Available data indicate that, worldwide, about 1.3 billion people are unable to access effective and affordable health care when they need it, while 170 million people are forced to spend more than 40 per cent of their household income on medical treatment (WHO, 2004b, p.2).
The 1997 Human Development Report (UNDP, 1997) estimates that the majority of the poor without access to health services live in developing countries: 34 per cent in South Asia, 27 per cent in sub-Saharan Africa and 19 per cent in South-East Asia and the Pacific (figure 4.3).
7 See http://www.socialhealthprotection.org/conference2006.php
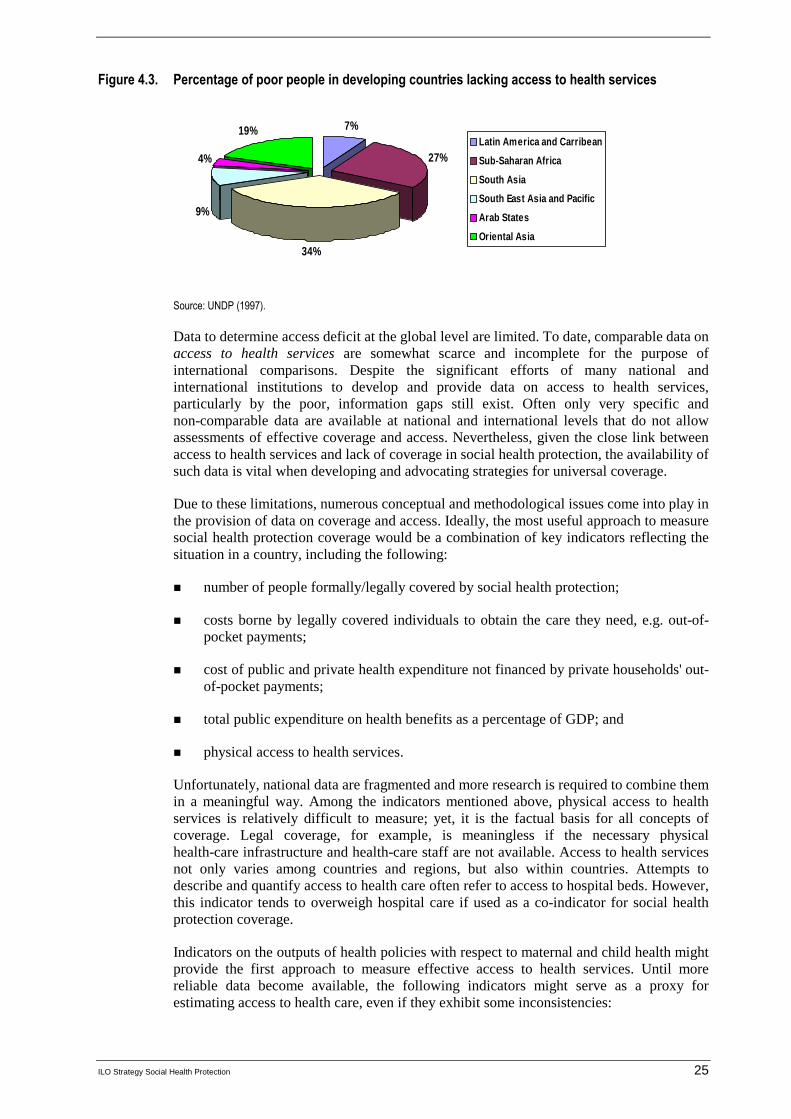
ILO Strategy Social Health Protection 25
Figure 4.3. Percentage of poor people in developing countries lacking access to health services
7%
27%
34%
9%
4%
19%Latin America and Carribean
Sub-Saharan Africa
South Asia
South East Asia and Pacific
Arab States
Oriental Asia
Source: UNDP (1997).
Data to determine access deficit at the global level are limited. To date, comparable data on access to health services are somewhat scarce and incomplete for the purpose of international comparisons. Despite the significant efforts of many national and international institutions to develop and provide data on access to health services, particularly by the poor, information gaps still exist. Often only very specific and non-comparable data are available at national and international levels that do not allow assessments of effective coverage and access. Nevertheless, given the close link between access to health services and lack of coverage in social health protection, the availability of such data is vital when developing and advocating strategies for universal coverage.
Due to these limitations, numerous conceptual and methodological issues come into play in the provision of data on coverage and access. Ideally, the most useful approach to measure social health protection coverage would be a combination of key indicators reflecting the situation in a country, including the following:
� number of people formally/legally covered by social health protection;
� costs borne by legally covered individuals to obtain the care they need, e.g. out-of-pocket payments;
� cost of public and private health expenditure not financed by private households' out-of-pocket payments;
� total public expenditure on health benefits as a percentage of GDP; and
� physical access to health services.
Unfortunately, national data are fragmented and more research is required to combine them in a meaningful way. Among the indicators mentioned above, physical access to health services is relatively difficult to measure; yet, it is the factual basis for all concepts of coverage. Legal coverage, for example, is meaningless if the necessary physical health-care infrastructure and health-care staff are not available. Access to health services not only varies among countries and regions, but also within countries. Attempts to describe and quantify access to health care often refer to access to hospital beds. However, this indicator tends to overweigh hospital care if used as a co-indicator for social health protection coverage.
Indicators on the outputs of health policies with respect to maternal and child health might provide the first approach to measure effective access to health services. Until more reliable data become available, the following indicators might serve as a proxy for estimating access to health care, even if they exhibit some inconsistencies:

26 ILO Strategy Social Health Protection
� births attended by skilled health personnel based on the WHO definition: percentage of live births attended by skilled health personnel in a given period of time, and
� density of health professionals, i.e. the number of population per health professional, i.e. physicians, nurses and midwives.
The parallel use of these proxy indicators opens up a range of relative values that might serve as a crude indicator for access or non-access to health services. They can also be used to establish an indicator for the estimated access deficit in a country.
The access deficit was thus estimated by using the proxy indicator of births attended by skilled health personnel and by comparing a given country’s qualified health professional density to that of Thailand (313 persons per health professional in 2004). Thailand was chosen as a benchmark based on the computation done to obtain the global and national access deficit.
The access deficit was obtained using the difference between 100 and the percentage of live births attended by skilled personnel at a given time – thus revealing the percentage of live births not cared for by a qualified health professional. The health professional density-based access deficit indicator, on the other hand, was measured by the relative difference of the national density levels and the Thailand benchmark. However, this is a conservative minimum estimate. If, for example, health professionals are very unevenly spread in a country, the de facto deficit may be much greater than the estimate based on national averages. But if this rather “optimistic” indicator signals a national or regional problem, it might be safely assumed that the real problem is even bigger than the one indicated by national averages.
Figure 4.4 shows the results of ILO computations on the density of health professionals. It reflects that high-income countries (e.g. United Kingdom with 66 individuals per health professional) have a higher health professional to population ratio compared to low- and middle-income countries (e.g. Chad with 3,113 individuals per health professional). Such ratios reflect inequities in access to health care, especially in low- and middle-income countries. The situation is compounded by the migration of health professionals from low- and middle- income to high-income countries. This is currently being recognized as impacting on the overall health of populations.
Figure 4.4. Density of health professionals
0
500
1000
1500
2000
2500
3000
3500
Population per health professional 66 92 129 262 297 348 388 932 3113
UK FranceBurkina
FasoBolivia Algeria Mexico Egypt Ghana Chad
Source: ILO calculations (2007).

ILO Strategy Social Health Protection 27
e. Measuring the access deficit
Tables 1 and 2 of Appendix II present a profile, albeit imperfect, of the present data on national coverage statistics. They mirror the two deficit indicators on a country-by-country basis, with further information such as population size, GDP, Human Poverty Index (HPI), Gini index, formal coverage, OOP, and total expenditure on health. It should be emphasized that the suggested indicators only estimate the global national access deficit, merely providing an insight into the gap of effective social health protection coverage in connection with the other coverage-related variables. Regression analyses were performed with the help of these tables.
The results of regression analyses conducted to investigate the correlation between the staff-related access deficit and the Human Poverty Index (HPI) 1 and 2, the Human Development Index (HDI) the GDP per capita and Gini coefficient, are described here-below.
Figure 4.5 shows the correlation between staff-related national access deficit and the Human Poverty Index (HPI). HPI is a composite index that measures deprivation in the areas of long and healthy life, knowledge and decent standard of living. HPI-1 is the human poverty index for developing countries and is based on the probability at birth of not surviving to age 40; the adult illiteracy rate; and unweighted data on the average of population without sustainable access to improved water source and children below normal weight for their age. HPI-2 is for selected OECD countries and based on four components, namely: the probability at birth of not surviving to age 60; people lacking functional literacy skills; long-term unemployment; and population below 50 per cent of median adjusted household disposable income. 8
According to figure 4.5, there seems to be a correlation between HPI and staff-related national access deficit. It is noteworthy that most of the developed countries with low HPI are also those with low levels of staff-related national access deficit. Conversely, countries on the upper right-hand side of the figure have high HPI and access deficit; these include Chad, Ethiopia and Bangladesh.
However, some countries show significant variation from the general trend. Botswana, for instance, has a relatively low access deficit, given its poverty level. Assuming data are accurate, it may be observed that Botswana, like other countries in the upper left-hand side of the figure, enjoys relatively high health access - despite what its poverty level might suggest. The opposite statement is true for countries in the lower right-hand side of the figure.
Correlation between the access deficit and HPI does not prove that low national access deficit reduces poverty but rather illustrates that they usually coexist.
8 HPI definition obtained from www.undp.org

28 ILO Strategy Social Health Protection
Figure 4.5. Regression between access deficit and Human Poverty Index (HPI)
Regression analysis was also done on the Human Development Index (HDI). This composite index and measure of human development is based on life expectancy, adult literacy, education, and decent standard of living of countries worldwide. HDI provides a larger view of human progress in the light of income and well-being and has 2 components: GDP per capital and the Gini coefficient. To some extent, the HDI covers many components of the HPI - thus showing comparable trends. Nevertheless, the HDI correlation shown in figure 4.6 is somewhat stronger than with the HPI, implying that, on average, the development level is a better indicator of the staff-related national access deficit than the poverty level.
In the same way, the regression analysis done on GDP per capita and global national access deficit provided interesting information. The regression showed that a high GDP per capita level yielded a correlation with a low health-care deficit. Regression on the Gini coefficient, which is a measure of inequality of income distribution, was less conclusive. It was observed that the correlation was weaker, even though the calculations showed that a greater inequality was correlated with a greater health access deficit.
M ali
ChadNigerEthiopia
Guinea Sierra Leone
M ozambiqueBotswana Benin LesothoZimbabweZambia Gambia Bangladesh
M alawiCôte d'IvoireAngola BurundiNigeria Yemen
Hait iCambodia TogoRwanda
Pakistan United Republic of TanzaniaUgandaCameroon KenyaM orocco GhanaNamibia
IndiaSouth Africa
CongoGabon
GuatemalaM yanmarAlgeria
EgyptCape Verde IndonesiaNicaraguaTunisia Sri Lanka Honduras
El Salvador Viet NamUnited States of America PhilippinesJamaicaBoliviaDominican Republic China PeruCanada
TurkeyM alaysiaParaguayNetherlands ColombiaM exicoNorway
Cuba Costa Rica ChileUruguay
y = 0 .0 0 4 3 x2 + 0 .0 0 11x + 13 .4 4 9R 2 = 0 .6 6 6 1
-
10
20
30
40
50
60
70
- 10 20 30 40 50 60 70 80 90 100
Staff-related national access deficit (% of population)
Hum
an p
over
ty in
dex
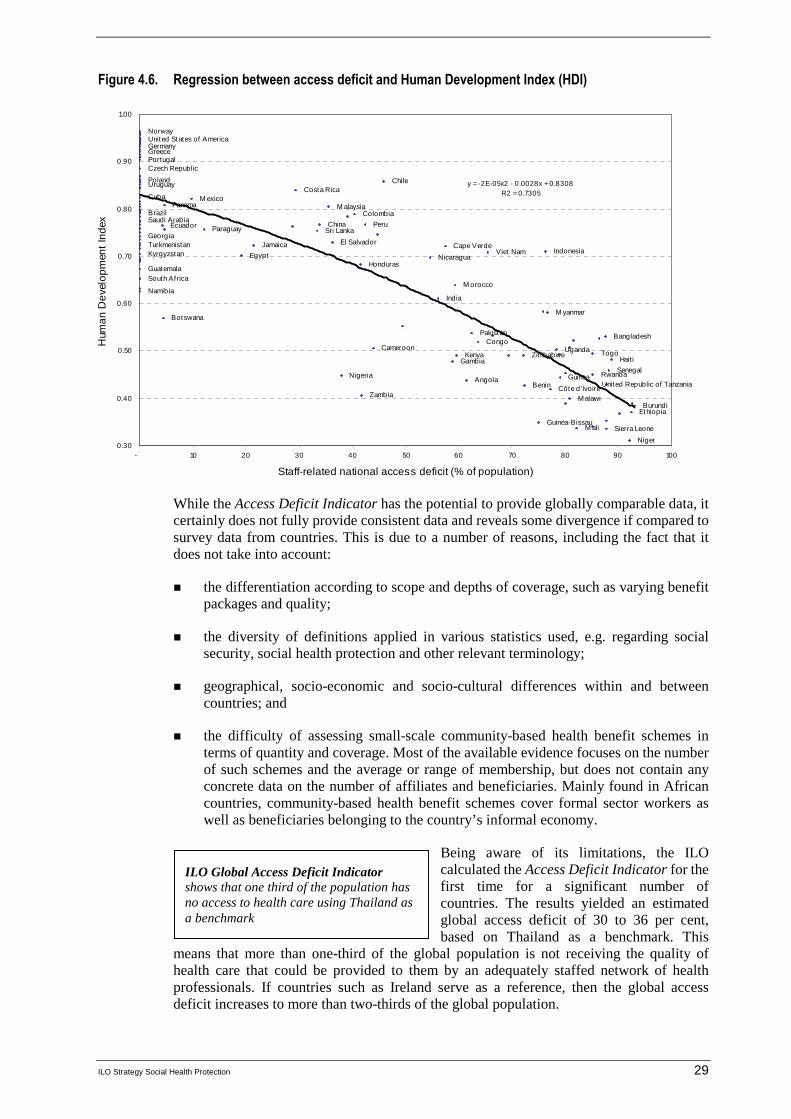
ILO Strategy Social Health Protection 29
Figure 4.6. Regression between access deficit and Human Development Index (HDI)
While the Access Deficit Indicator has the potential to provide globally comparable data, it certainly does not fully provide consistent data and reveals some divergence if compared to survey data from countries. This is due to a number of reasons, including the fact that it does not take into account:
� the differentiation according to scope and depths of coverage, such as varying benefit packages and quality;
� the diversity of definitions applied in various statistics used, e.g. regarding social security, social health protection and other relevant terminology;
� geographical, socio-economic and socio-cultural differences within and between countries; and
� the difficulty of assessing small-scale community-based health benefit schemes in terms of quantity and coverage. Most of the available evidence focuses on the number of such schemes and the average or range of membership, but does not contain any concrete data on the number of affiliates and beneficiaries. Mainly found in African countries, community-based health benefit schemes cover formal sector workers as well as beneficiaries belonging to the country’s informal economy.
Being aware of its limitations, the ILO calculated the Access Deficit Indicator for the first time for a significant number of countries. The results yielded an estimated global access deficit of 30 to 36 per cent, based on Thailand as a benchmark. This
means that more than one-third of the global population is not receiving the quality of health care that could be provided to them by an adequately staffed network of health professionals. If countries such as Ireland serve as a reference, then the global access deficit increases to more than two-thirds of the global population.
Niger
Sierra LeoneM aliGuinea-Bissau
EthiopiaBurundi
M alawiZambiaCôte d'IvoireBenin United Republic of Tanzania
Angola GuineaNigeria RwandaSenegal
Gambia Hait iZimbabweKenya TogoUgandaCameroon
CongoBangladeshPakistan
BotswanaM yanmar
IndiaNamibia
M oroccoSouth AfricaGuatemala
HondurasNicaraguaEgyptKyrgyzstan Viet Nam Indonesia
Cape VerdeTurkmenistan Jamaica El SalvadorGeorgia
Sri LankaParaguayEcuador PeruChinaSaudi Arabia
ColombiaBrazilM alaysiaPanama
M exicoCubaCosta Rica
Uruguay ChilePoland
Czech RepublicPortugalGreeceGermanyUnited States of AmericaNorway
y = -2E-05x2 - 0.0028x + 0.8308R2 = 0.7305
0.30
0.40
0.50
0.60
0.70
0.80
0.90
1.00
- 10 20 30 40 50 60 70 80 90 100
Staff-related national access deficit (% of population)
Hum
an
De
velo
pm
ent
Inde
x
ILO Global Access Deficit Indicator shows that one third of the population has no access to health care using Thailand as a benchmark

30 ILO Strategy Social Health Protection
Country-specific access deficits reveal high staff-related gaps, even though Thailand was used as the benchmark. In China, the estimated staff-related access deficit indicates that 34 per cent of the population has no access to health services - and this figure rises to 40 per cent in Colombia. This is comparable to the staff-related access deficit of 42 per cent in Peru. In terms of births-attended deficit, this is 61 percent in Uganda and 53 percent in Ghana (table 4.4).
Table 4.4. Estimated access deficit in selected countries
Estimated access deficit
Staff-related(in % of population)
Births attended (in % of live births)
Burkina Faso 85 43
China 34 17
Colombia 40 9
Ghana 66 53
Peru 42 29
Philippines 29 40
Uganda 78 61
Source: Appendix II, table 1.
f. Some observations on recent developments in social health protection
Despite evident gaps in data availability and reliability, as well as the given methodological limitations, calculating the estimate of the worldwide access deficits to health services has produced insights into various interesting and challenging developments in a number of countries around the globe. These observations include:
1. Pluralistic use of health financing mechanisms
Public health services, although narrowing and deteriorating due to structural adjustment policies, public expenditure cuts and privatization, continue to play an important role in providing health services through social protection mechanisms. For example, formal coverage still amounts to 47.6 per cent in Egypt and 25 per cent in Kenya.
Alongside public services, the pluralistic use of other health financing mechanisms is found in almost all countries. For example, in the Syrian Arab Republic, practically all public companies and most large private enterprises offer relatively comprehensive health benefit packages free-of-charge to their staff. Dependents are sometimes covered by the scheme itself, or through contribution-borne schemes implemented by trade unions (Schwefel, 2006b). In Yemen, a number of public, private and mixed companies offer various types of health benefit schemes ranging from relatively low flat-rate reimbursement to comprehensive coverage packages, and average per capita expenditure varies between €10 and €450 (Schwefel et al., 2005, p. 66 f.).
There is also a growing interest in and introduction of social and national health insurance to increase coverage and access, as well as an attempt to address issues related to fiscal space.

ILO Strategy Social Health Protection 31
2. The effect of legal social health protection coverage on out-of-pocket payments is heterogeneous
There is only a relatively small difference of the share of OOP expenditure as a percentage of private expenditure on health between Tunisia (83 per cent), which has almost universal legal coverage, Nicaragua (95.7 per cent), where almost 70 per cent of the population has formal health protection, and Niger (89.2 per cent), where less than 1 per cent of the population is formally covered (Appendix II, table 2). At the same time, OOP as a percentage of total expenditure on health accounts for only around 10 per cent in Slovenia and South Africa, while it rises to 26.8 per cent in Ukraine and to 45.1 per cent in Tunisia, although all these countries have achieved universal legal coverage. And the burden of OOP on practically unprotected households in Uganda (36.7 per cent) is only slightly higher than in Turkmenistan (32.6 per cent), where over 80 per cent of the population is covered (Appendix II, table 2). The findings likewise indicate that the scope of benefit packages, including financial protection and the quality of services provided, have a stronger effect on private health expenditure than the number of persons or households legally covered by any kind of prepayment system for health. Social health protection should provide a reasonable level of financial protection in order to shield the population from high private expenditures and impoverishment.
3. The role of community-based schemes
A current trend in low-income countries is to increase the role of mutual health organizations and social health insurance when mainstreaming pro-poor policies in social health protection and addressing issues of high user fees. Voluntary and community-based schemes are also gaining support in many of these countries. Their success and sustainability depend to a great extent on the attractiveness of benefit packages, related financial protection and the quality of services. The coverage of workers and their families in the informal economy may also contribute to their success. Key issues concerning sustainability - e.g. capacity to pay and adverse selection - are currently addressed in creating financial and administrative linkages among schemes at various levels based on different ownerships.
Current country examples show that schemes can work successfully, one of them being the Yeshasvini scheme in India which covers some two million workers and their families. National data from India indicate that the share of informal economy workers (unorganized workers) covered by social security arrangements, both in public and private not-for-profit schemes, is 8 per cent. Out of the total number of 370 million workers in the Indian informal economy, only around 30 million are covered by social protection including health (Kannan, 2006). In these contexts, community based schemes can thus play a crucial role to accelerate progress towards coverage of the informal economy workers.
In Senegal, the variation of affiliation is more than 20 per cent in three out of five community-based health insurance schemes, and four out of every five beneficiaries do not paid their contributions on time.
4. Employer-facilitated insurance systems are not very frequent in most developing countries although they are common in Arab States
Enterprise-based health plans usually provide care directly through employer-owned or on-site health facilities, or rely on contracts with outside providers and facilities. Employer-driven insurance schemes are highly exclusive since only stable workers - and in some cases their families - are covered. The concept is often closely related to the existing labour legislation on work accidents and occupation-acquired diseases.

32 ILO Strategy Social Health Protection
Examples from Africa include employer-provided medical care in Zambia and Nigeria, as well as in the rubber forests in Liberia and the Democratic Republic of the Congo (Develtere and Fonteneau, 2001, p. 29). Company health benefit schemes often reflect a paternalistic relationship between employer and employees, relying partly on individual, case-to-case decisions rather than on vested rights. Even more important is the fact that the size of the schemes is, in many cases, too small to provide an effective coverage of catastrophic diseases. Trade-union-related health insurance systems may be found in countries like Zimbabwe, South Africa, Mauritius, Burkina Faso, Guatemala and Argentina. Some foster dual membership and automatically insure all trade union members through the insurance plan, while others develop mutual insurance systems that are relatively autonomous of the union and are open to members and non-members alike (Develtere and Fonteneau, 2002, p.30).
5. Available data is limited
Often, only information on certain cut-off dates or average data pertaining to utilization of services and other indicators is available. In-depth analysis reveals that a large quantity of data on coverage rates of existing social health protection schemes rely on surveys that have limited samples for estimating the total number of beneficiaries. The data gaps show that statistical figures on population coverage of health benefit schemes should be interpreted carefully, taking into account the methodology used for obtaining them.
The information above gives an initial estimate of access deficit and provides an insight of its global magnitude. It also presents the trends in national health protection policies - and the way in which these policies approach the extension of coverage and improvement of health service access. These approaches are often driven by the need to extend coverage to workers and families in the formal and informal economy and to increase fiscal space. Against this background, a pragmatic strategy would incorporate, to the extent possible, national, regional and community-based approaches, rather than building new schemes or developing only one out of the several options available. However, these schemes need to be coordinated at the national level in order to create synergies and avoid gaps in coverage. It would be particularly beneficial to maximize existing resources and systems when creating new schemes. Against this background, the ILO has developed a strategy on achieving universal access to health care against. This strategy will be discussed in the next chapter - which also addresses the importance of recognizing existing health financing schemes within a given country and harnessing them with a view to providing social health protection for the population as a whole.

ILO Strategy Social Health Protection 33
5. Rationalizing the use of pluralistic financing mechanisms: An ILO strategy for achieving universal coverage in social health protection
a. Overall concept of the ILO strategy on rationalizing the use of pluralistic financing mechanisms
Worldwide experience and evidence show that there is no single right model for providing social health protection or one single pathway towards achieving universal coverage. Countries use various means of resource generation, risk pooling, health care delivery and financing. Experience has also revealed that social protection evolves over years or even decades and is contingent upon historical and economic developments, social and cultural values, institutional settings, political commitment and leadership within countries. In addition, most national health financing systems are based on multiple options that cover disjointed or overlapping subgroups of the population, while others remain uncovered.
Against this background, it is necessary to achieve the following two objectives: 1) to rationalize the use of pluralistic financing mechanisms in order to achieve universal access to essential and affordable care; and 2) to increase fiscal and financial space to fund universal coverage. The ILO suggests to coordinate all financing mechanisms within a country in order increase the volume of resources and risk pools available for universal health care. However, this increase should not be consumed by an equal increase in transaction and administrative costs (Cichon, 2007).
A pragmatic strategy to rationalize the use of various health financing mechanisms with a view to achieving universal coverage and equal access should be developed in three stages:
� by first taking stock of all existing financing mechanisms in a given country;
� by subsequently assessing the remaining coverage and access deficits; and finally
� by developing a coverage plan that fills gaps in an efficient and effective way.
In this context, the government should play a pivotal, active role as facilitator and promoter and define the operational space for each subsystem. This entails developing an inclusive legal framework for the country and ensuring adequate funding and comprehensive benefits for the whole population. The framework should also regulate voluntary private health insurance, including community-based schemes, and consider regulations to ascertain good governance and effective protection. This framework establishes a rights-based approach to social health protection, which takes into account the needs and capacity to pay, thereby realizing the objective of including the population not covered by social health protection.
When developing the coverage plan, all options of financing mechanisms – including all forms of compulsory and voluntary schemes, for-profit and non-profit schemes, public and private schemes ranging from national health services to community-based schemes – should be considered if they contribute, in the given national context, towards achieving universal coverage and equal access to essential services for the population as a whole.
The coverage plan should be accompanied by, or include, an overall national health budget, making it possible to establish and project - on the basis of a National Health
34 ILO Strategy Social Health Protection
Account - the total resources such as taxes, contributions and premiums available to finance health care. It should also estimate the expenditure of the different subsystems in such a way that the process of achieving affordable universal coverage and access might be accelerated and built in line with a realistic and sustainable plan.
Appendix I describes the national health-care system in Thailand as an example of the rational use of pluralistic financing mechanisms. The system consists of social health insurance, major occupational systems, a tax-based system and private health insurance schemes, and combines the various mechanisms through legal benefit entitlements.
Apart from developing a legal framework that would usher in a clear coverage plan, other prerequisites for ensuring the efficient functioning of pluralistic financing include: a legally defined and affordable benefit package; fair pricing; efficient provider-payment systems; and risk equalization among subsystems. The ILO promotes a strong role for a stable government and the social partners, particularly through social dialogue and broad participation in policy processes and governance of schemes - including other partners such as civil society, the insured and other stakeholders in social health protection.
The most promising strategy for attaining universal coverage within a realistic time frame is to coordinate and rationalize the use of pluralistic financing mechanisms with a view to achieving the step-by-step extension of effective social health protection coverage, through national health services, social health insurance, community-based insurance and mandated private health insurance. This is not only an integrated approach but also respects existing coverage and financing arrangements, and can be adjusted to the specific social and economic context of each country.
b. Core elements of the ILO strategy on rationalizing the use of pluralistic financing mechanisms
When applying the suggested ILO strategy on rationalizing the use of pluralistic financing mechanisms on a national basis, it will be necessary to follow a certain number of steps. These include:
� assessing the coverage gap and the access deficit;
� developing a national coverage plan;
� strengthening national capacities for implementation.
i. Assessing the coverage gap and the access deficit
The ILO proposes that access deficits be measured by utilizing detailed national health surveys, as well as regional disaggregated analyses of formal legal coverage by each health financing subsystem. This involves taking stock of all existing social health protection mechanisms within the country and analyzing which portion or sector of the population they cover. This would yield an approximation of the coverage gap and access deficit, thereby providing guidance to the national coverage plan.
ii. Developing a national coverage plan
The national coverage plan aims to provide a coherent design of pluralistic national health financing coverage and delivery systems consisting of subsystems, such as national tax-based services and social health insurance schemes, private insurance schemes etc. Aiming at universal coverage, these would operate within a clearly defined scope of competence
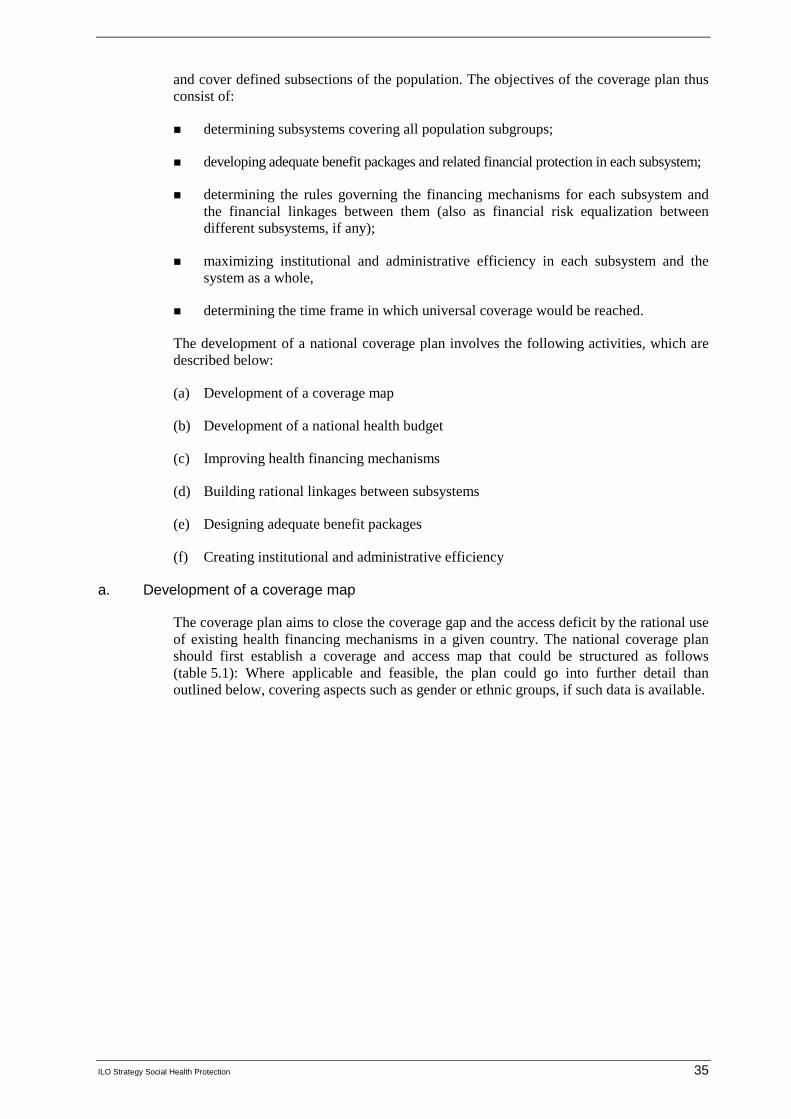
ILO Strategy Social Health Protection 35
and cover defined subsections of the population. The objectives of the coverage plan thus consist of:
� determining subsystems covering all population subgroups;
� developing adequate benefit packages and related financial protection in each subsystem;
� determining the rules governing the financing mechanisms for each subsystem and the financial linkages between them (also as financial risk equalization between different subsystems, if any);
� maximizing institutional and administrative efficiency in each subsystem and the system as a whole,
� determining the time frame in which universal coverage would be reached.
The development of a national coverage plan involves the following activities, which are described below:
(a) Development of a coverage map
(b) Development of a national health budget
(c) Improving health financing mechanisms
(d) Building rational linkages between subsystems
(e) Designing adequate benefit packages
(f) Creating institutional and administrative efficiency
a. Development of a coverage map
The coverage plan aims to close the coverage gap and the access deficit by the rational use of existing health financing mechanisms in a given country. The national coverage plan should first establish a coverage and access map that could be structured as follows (table 5.1): Where applicable and feasible, the plan could go into further detail than outlined below, covering aspects such as gender or ethnic groups, if such data is available.

36 ILO Strategy Social Health Protection
Table 5.1. Health care coverage and access map specimen
Population Proportion of group that can access Proportion of the group whose services are funded by
Government health services
Private sector health services
Total General revenues
Social security
Community- based initiatives
Employer- based initiatives
Private insurance
Out- of- pocket
Subtracting double counting
Total
Public employees
Private employees
Workers
Dependents
Self- employed
Outside Agriculture
Workers
Dependents
Self -employed in agriculture
Workers
Dependents
Unemployed persons of active age
Children not covered
Persons of pensionable age not covered elsewhere
Total
This map could be used, on an annual basis and within the framework of a multi-annual coverage plan, to project intended progress on coverage.
b. Development of a national health budget
Before establishing the coverage plan, the government should document the funds available for social health protection. This requires developing a national health budget that assesses the financial status and development of national health-care schemes. A health budget initially compiles the status quo of all the expenditures and revenues in the health sector in the form of a national health account. This could be structured in tables similar to the one outlined in table 5.1 for a given start year and coverage map.
The ILO Tool Box includes a generic health budget model that can be found in Appendix III of this document. Box 5.1 describes the methodology and results of an abridged health budgeting exercise that the ILO undertook in collaboration with the Thai International Health Policy Program in 2004.

ILO Strategy Social Health Protection 37
Box 5.1
A health budget for Thailand The basic structure of the model is mapped out in figure B.1 below. The basic modelling philosophy follows the pragmatic modelling philosophy of ILO’s genuine social budgeting models. Instead of building a complete national social budget encompassing all social transfer schemes in Thailand, the non-health parts of a social budget were excluded and the budgetary analysis was limited to the health sector and its impact on the government budget.
The model provides classical and pragmatic “if–then” projections, i.e. it depends on exogenous demographic and economic assumptions and then simulates their impact on health expenditure and revenues and the government budget. Observation years are 2002 and 2003 and projection years are 2004 to 2020.
The model consists of four deterministic sub-models that are driven by a set of exogenous assumptions:
� the first sub-model is a demographic model that projects the population and the labour force on the basis of assumptions on future developments of fertility, mortality and labour force participation rates;
� the second sub-model is an economic model that derives employment and wage data from exogenous assumptions on growth, labour productivity and the wage share at GDP;
� the third sub-model is a health budget model which projects health expenditure of the four major financing schemes (UC, SSO, CSMBS and privately funded health care) and the health resources (contributions to SSO and WCS, out-of-pocket and other private outlays, and general taxation). The two central result variables are overall national health expenditure and the resource requirement from general revenues;
� the last sub-model, the government model, links public health expenditure and the general revenue resource requirement to government budget projections. The central result variable is the government annual budget deficit.
This (abridged) health budget model therefore makes it possible to trace the effects of changes in the health delivery and financing system to overall national health expenditure and the government’s budgetary balance, i.e. to one global health system performance indicator and a public finance performance indicator. Two model scenarios were developed: the first (status quo scenario or variant) reflects the legal status quo; the second scenario (reform or UC scenario or variant) uses identical demographic and economic assumptions and differs only in the health budget sub-model which simulates the introduction of the UC Fund and the implementation of the two major cost-reducing measures in the perspective of NHSO (extension of SSO coverage and CSMBS contributions) after 2005.
Figure B.1. Structure of the first version of the National Health Budget Model for Thailand
The key demographic and economic assumptions are provided in figure B2.
Figure B.2. The assumed development of key economic variables for Thailand, 2002-2020
0
2
4
6
8
10
2001
2003
2005
2007
2009
2011
2013
2015
2017
2019
year
percent
Real GDP growth
Labour productivitygrowth
Unemployment rate
Population growth
Demographic and Economic modellabour force model
Abridged National HealthBudget
Government budget

38 ILO Strategy Social Health Protection
The projections for the government budget use the growth rate of nominal GDP as the main driver for all income and revenue items of the central government accounts that are neither driven by wages (such as income tax) nor imported from the abridged health budget sub-model. Further assumptions are documented in the model itself.
The central results of the projections are summarized in figures B.3 and B.4. The model estimates show that the overall health-care expenditure in the country – measured as a percentage of GDP – will rise by about 0.3 per cent of GDP over the next half-decade, starting from an initial level of around 3.5 per cent of GDP. This is largely an effect of two factors: the assumed substantial real GDP growth rates over the next decade; and the fact that the cost development of the major share of public health expenditure is contained through the use of the capitation mechanism which is exercising an overall cost-containment effect on the health financing system as a whole. Total national expenditure is expected to slowly increase back to the original level until 2020 as the GDP growth rates decline.
For the status quo, the general revenue share at financing total health expenditure stagnates throughout the period at a level of 1.98 to 2.17 per cent of GDP. This would not pose a major problem if the overall budgetary balance were projected to remain positive throughout the projection period. However, the model (prudently) suggests that the government budget remains negative throughout the projection period, with a minimum level of deficit of 1.19 per cent of GDP in 2020. The Ministry of Finance assumes – more optimistically – that the budget will turn positive over the years, but in this model it will reach the minimum deficit at the end of considering period. It could well be that this health budget model is too pessimistic. In any case, it can safely be assumed that the trend towards tighter budgetary situations will recommence at the end of the decade if all our assumptions – cum granu salis – hold true.
The first scenario simulates the effects of the suggested revenue increases and cost reductions for the government and the introduction of a special UC fund that would generate earmarked income for the UC scheme from taxes on alcohol and cigarettes. In this scenario, the general revenue share at overall health-care financing would decline over the next two decades to a level of 1.5 per cent of GDP in 2020 and the overall government deficit would shift up by about 1.5 per cent of GDP and remain at a slightly negative level until the end of the projection period at 0.55 per cent of GDP. The second scenario was produced on the basis of assumptions that SSO would expand coverage to non-working spouses and dependants (estimate of 6 million beneficiaries) in 2005. IF SSO expanded their coverage without increasing any contributions and the government did not introduce any additional taxes, the government would reduce the health-care budget subsidy from 2.17 to 1.99 per cent of GDP by the end of the projection. The first and second scenarios were combined together into the third scenario. The government would decrease the budget for health-care financing from 2.17 per cent to 1.35 per cent of GDP by the end of the projection if SSO expanded their coverage to spouses and dependants and introduced additional taxes.
Figure B.3
Total Health Expenditure and Government Contribution
3.53%3.88%
2.17%
1.53%
1.99%
1.98%
1.35%
0.00%
0.50%
1.00%
1.50%
2.00%
2.50%
3.00%
3.50%
4.00%
4.50%
2001
2003
2005
2007
2009
2011
2013
2015
2017
2019
year
% G
DP
THE as % GDP
Govt subsidy as %GDP(STATUS QUO)
Govt subsidy as %GDP(SCENARIO I)
Govt subsidy as %GDP(SCENARIO II)
Govt subsidy as %GDP(SCENARIO III)
Figure B.4
Estimated Government Deficit
-1.19%
-0.55%
-0.92%
-1.53%
-0.55%
-3.00%
-2.50%
-2.00%
-1.50%
-1.00%
-0.50%
0.00%
0.50%
2001
2003
2005
2007
2009
2011
2013
2015
2017
2019
year
in %
of GDP
Total Govt deficit(STATUS QUO)
Total Govt deficit(SCENARIO I)
Total Govt deficit(SCENARIO II)
Total Govt deficit(SCENARIO III)
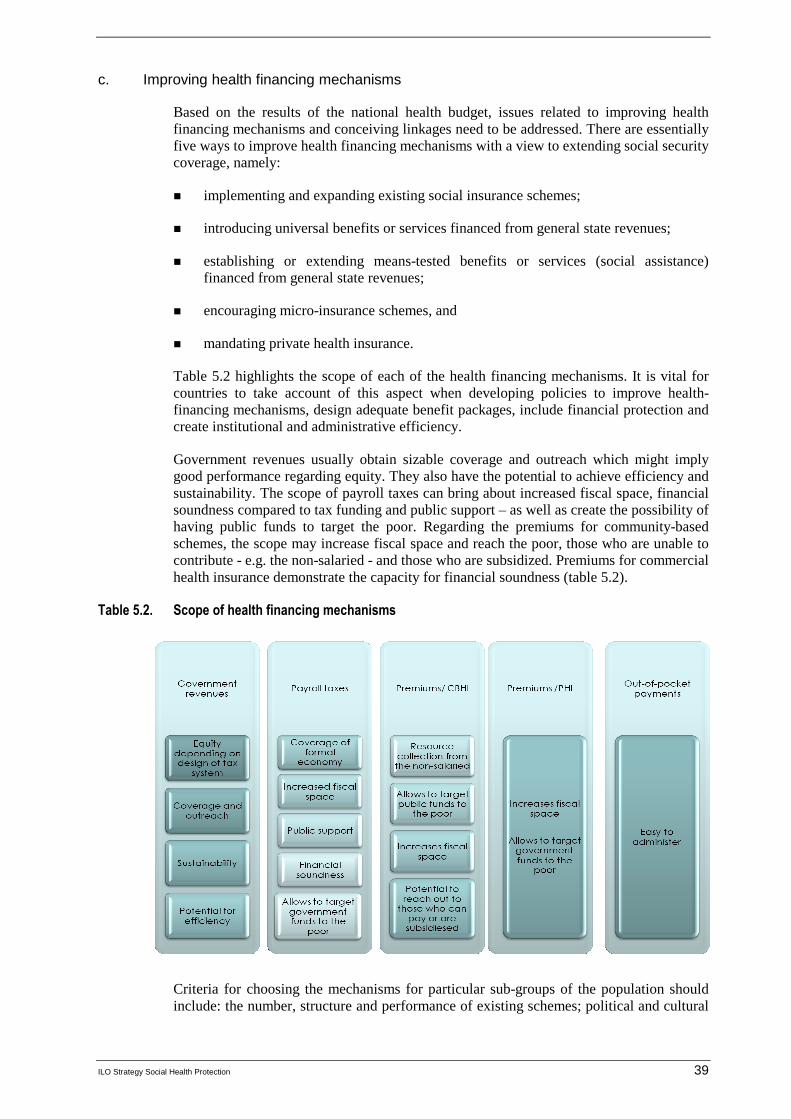
ILO Strategy Social Health Protection 39
c. Improving health financing mechanisms
Based on the results of the national health budget, issues related to improving health financing mechanisms and conceiving linkages need to be addressed. There are essentially five ways to improve health financing mechanisms with a view to extending social security coverage, namely:
� implementing and expanding existing social insurance schemes;
� introducing universal benefits or services financed from general state revenues;
� establishing or extending means-tested benefits or services (social assistance) financed from general state revenues;
� encouraging micro-insurance schemes, and
� mandating private health insurance.
Table 5.2 highlights the scope of each of the health financing mechanisms. It is vital for countries to take account of this aspect when developing policies to improve health-financing mechanisms, design adequate benefit packages, include financial protection and create institutional and administrative efficiency.
Government revenues usually obtain sizable coverage and outreach which might imply good performance regarding equity. They also have the potential to achieve efficiency and sustainability. The scope of payroll taxes can bring about increased fiscal space, financial soundness compared to tax funding and public support – as well as create the possibility of having public funds to target the poor. Regarding the premiums for community-based schemes, the scope may increase fiscal space and reach the poor, those who are unable to contribute - e.g. the non-salaried - and those who are subsidized. Premiums for commercial health insurance demonstrate the capacity for financial soundness (table 5.2).
Table 5.2. Scope of health financing mechanisms
Criteria for choosing the mechanisms for particular sub-groups of the population should include: the number, structure and performance of existing schemes; political and cultural
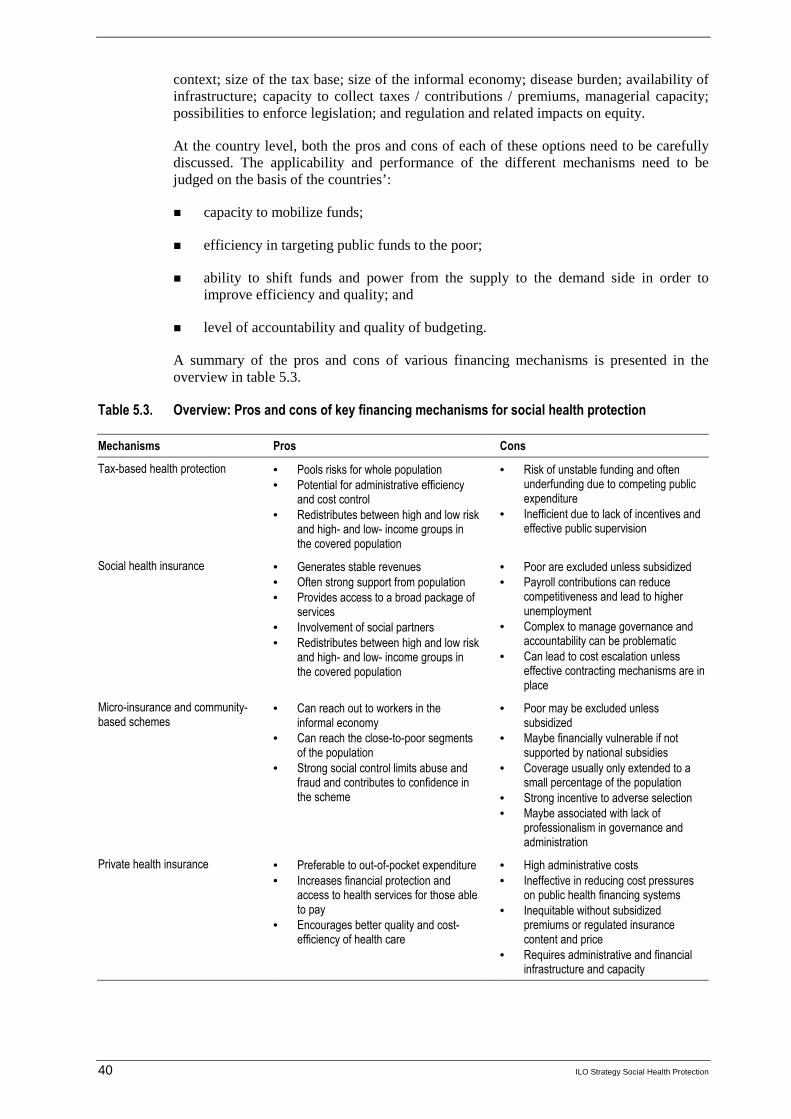
40 ILO Strategy Social Health Protection
context; size of the tax base; size of the informal economy; disease burden; availability of infrastructure; capacity to collect taxes / contributions / premiums, managerial capacity; possibilities to enforce legislation; and regulation and related impacts on equity.
At the country level, both the pros and cons of each of these options need to be carefully discussed. The applicability and performance of the different mechanisms need to be judged on the basis of the countries’:
� capacity to mobilize funds;
� efficiency in targeting public funds to the poor;
� ability to shift funds and power from the supply to the demand side in order to improve efficiency and quality; and
� level of accountability and quality of budgeting.
A summary of the pros and cons of various financing mechanisms is presented in the overview in table 5.3.
Table 5.3. Overview: Pros and cons of key financing mechanisms for social health protection
Mechanisms Pros Cons
Tax-based health protection • Pools risks for whole population • Potential for administrative efficiency
and cost control • Redistributes between high and low risk
and high- and low- income groups in the covered population
• Risk of unstable funding and often underfunding due to competing public expenditure
• Inefficient due to lack of incentives and effective public supervision
Social health insurance • Generates stable revenues • Often strong support from population • Provides access to a broad package of
services • Involvement of social partners • Redistributes between high and low risk
and high- and low- income groups in the covered population
• Poor are excluded unless subsidized • Payroll contributions can reduce
competitiveness and lead to higher unemployment
• Complex to manage governance and accountability can be problematic
• Can lead to cost escalation unless effective contracting mechanisms are in place
Micro-insurance and community-based schemes
• Can reach out to workers in the informal economy
• Can reach the close-to-poor segments of the population
• Strong social control limits abuse and fraud and contributes to confidence in the scheme
• Poor may be excluded unless subsidized
• Maybe financially vulnerable if not supported by national subsidies
• Coverage usually only extended to a small percentage of the population
• Strong incentive to adverse selection • Maybe associated with lack of
professionalism in governance and administration
Private health insurance • Preferable to out-of-pocket expenditure • Increases financial protection and
access to health services for those able to pay
• Encourages better quality and cost-efficiency of health care
• High administrative costs • Ineffective in reducing cost pressures
on public health financing systems • Inequitable without subsidized
premiums or regulated insurance content and price
• Requires administrative and financial infrastructure and capacity

ILO Strategy Social Health Protection 41
Generally, taxes are considered an efficient and equitable source of revenue for the health sector. They may lead to national risk pooling for the whole population and redistribute between high and low risks, and high- and low- income groups. The civil service has the potential to be administratively efficient and control costs.
However, the contribution that taxes make to health-care financing is largely contingent upon national macroeconomic performance and competing demands from other sectors; the quality of governance; the size of the tax base; and the government's human and institutional capacity to collect taxes and supervise the system. In practice, government schemes often tend to be under-funded due to competing public expenditures, which might lead to a shortage of goods and services and to under-the-table payments and lack of efficient governance.
The success of social health insurance schemes depends on the generation of stable resources as revenues, strong support of the population, provision of a broad package of services, involvement of the social partners and redistribution between risk and income groups. However, schemes are administratively complex and governance and accountability can be problematic. Also, from a macroeconomic point of view, payroll contributions can reduce competitiveness and lead to higher unemployment.
Furthermore, in countries with sizeable informal economies, social health insurance might have an impact on equity if coverage is not universal. It should be emphasized that health care for the workforce is not free and that enterprises and the economy have to bear a respective share of the financial burden. In the case of social health insurance schemes, funding should consist of shared financial resources from both employers and employees. For specific benefits such as maternity benefits, specific rules might apply; for instance, full coverage might be provided through public funds to avoid disadvantages for particular groups.
Specific schemes such as private or community health insurance schemes can be an efficient mechanism to collect non-salary-related contributions and reduce costs for the poorest at the point of delivery. But they often experience problems of coverage and therefore fail to achieve sufficient pooling; they also frequently find it difficult to organize membership across different ethnic groups and struggle with management capacity and inadequacy of resources.
Private for-profit health insurance schemes are also found in many countries, ranging from OECD countries to developing countries such as Peru and the Philippines (Appendix II, table 2). If they are not subsidized, they cover the wealthier part of the population and are based on risk-related premiums. Although they provide a better quality of service, their exclusive character and high administrative costs are often criticized.
Improving and linking these different approaches might overcome the pros and cons of the individual financing mechanisms. In the context of coverage plan development, an evaluation should be undertaken to identify the mechanisms best suited to raise sufficient and sustainable revenues in an equitable manner, thereby providing for adequate benefit packages and financial protection for the population as a whole. Given the country-specific nature of the evaluation, there is no general rule as to the way a country should develop its portfolio of national health financing subsystems in an optimal manner. However, it is suggested that a set of guiding principles be applied during the system building, including:
� solidarity in financing, according to capacity to pay, and equity in access to all health services. This includes risk pooling and sharing contributions payments in social health insurance between employees and employers; and
� inclusion of all citizens without discrimination on the basis of gender, ethnicity, religion, etc.

42 ILO Strategy Social Health Protection
A health financing policy checklist is provided in box 2.
Box 5. 2
Checklist for key policies on health care financing
� Mobilizing and collecting sufficient resources to achieve policy objectives.
� Ensuring strong political commitment based on social and national dialogue.
� Improving equity and solidarity in financing through burden sharing by income level.
� Setting up risk equalization and solidarity funds where appropriate.
� Maximizing risk pooling and reducing fragmentation.
� Introducing, in insurance schemes, government subsidies for the poor and for informal economy workers and their families (either direct or for contributions/premiums).
� Minimizing out-of-pocket payments.
� Setting user charges according to capacity to pay.
� Increasing financial sustainability.
� Ensuring efficient and effective use of resources.
� Using a mix of health financing mechanisms to accelerate achievement of universal coverage and to balance equity, efficiency and quality of care.
Improving health financing mechanisms and extending health protection require increasing funds, particularly in public spending on health. However, in many middle- and high-income countries, revenue collection based on public funds and payroll taxes often encounters obstacles because spending on health is perceived as an unproductive cost that hampers economic development. In many low-income countries, fiscal space and domestic revenues are considered too limited to ensure access to health services for the majority of the population. Ensuring financial sustainability involves addressing the issue of identifying other sources of funds and their collection. Some countries have employed the use of consumption taxes such as “sin taxes” as additional sources of funding. Governments should nevertheless ensure that the proceeds of these earmarked taxes are used for their intended purpose and not incorporated into general revenue.
Furthermore, mobilizing additional government resources usually requires a functioning formal economy, whereas many low-income countries have large informal economies. Over the past few years, the share of total labour supply in the informal economy has been constantly growing, particularly in Asia (ADB, 2006). This applies even in countries with high rates of economic growth in the formal sector.
Increasing fiscal space is essential for the improved sustainability of social health protection. It often presupposes changes in government policies - and, for countries relying on international aid - more sustainable support from donors. The most successful methods for increasing fiscal space through government policies include:
� more efficient use of public resources;
� strengthened efficiency in public institutions and service delivery;
� budgetary reallocations;
� greater efforts to collect taxes and contributions;
� effective governance of funds; and
� introduction of new sources of funding for the national health budget.

ILO Strategy Social Health Protection 43
These approaches require strong political commitment; priority setting with a view to extending social health protection; and determination to address issues of transparency and accountability. In this context, it is crucial that a democratic management be established and based on tripartite governance. It is also vital that there should be a participatory approach in scheme management, as well as governance based on social and national dialogue among policy makers, social partners, civil society groups, public and private insurers, health-care providers and others.
d. Building rational linkages between subsystems
Another approach to improve health financing mechanisms consists of creating financial linkages between various schemes. Linkages can achieve redistributive effects, e.g. by means of subsidies and financial consolidation (through reinsurance and guarantee funds, for example).
Further administrative and governance linkages include: sharing management functions; mutual support regarding registration and collection of contributions/premiums; mutual audits and control; co-contracting of providers; and pooling of information.
In order to achieve sustainable solutions when conceiving new linkages between different health financing mechanisms, it is vital to test, evaluate and monitor integrated approaches linking the schemes.
Box 5.3
Checklist for policies on building rational linkages between different health financing mechanisms
� Introducing subsidies.
� Developing efficient fee schedules.
� Setting up risk equalization and solidarity funds where appropriate.
� Maximizing risk pooling through increasing membership.
� Introducing, in insurance schemes, government subsidies for the poor and informal sector workers and their families (either direct or for contributions/premiums).
� Mandating private insurances, hospitals and facilities to cover (for example in part) the health care services for the poor.
� Facilitating reinsurance and guarantee funds.
� Establishing joint management functions.
� Introducing mutual support in registration and collection of contributions/premiums.
� Co-contracting health service delivery networks.
� Establishing mutual audit and control.
e. Designing adequate benefit packages
In addition to improving health financing mechanisms, the coverage plan should develop policies on adequate benefit packages, including protection against catastrophic spending.
Generally, the health challenges to be addressed in benefit packages of social health protection vary in low-, middle- and high-income countries:
� Low-income countries are primarily confronted with health challenges relating to primary health care, maternal and child care and infectious diseases such as HIV/AIDS, TB and malaria.

44 ILO Strategy Social Health Protection
� Middle-income countries are saddled by the double burden of infectious diseases found in low-income countries and non-communicable diseases such as cardio-vascular diseases, drug abuse and tobacco use found in high income countries.
� High-income countries are faced with the long-term care of the elderly, the treatment of non-communicable diseases mentioned above and stress-related syndromes.
Services covered in the benefit package and financial protection should be based on a consensus derived from broad consultations with all stakeholders involved in social health protection, taking into account the diverging views of the medical profession, various groups in the population – e.g. the poor, the old, the minorities – and others. Therefore, the policy mechanism to define health care needs should include national and social dialogue on health care priorities.
Box 5.4
Checklist for key policies on adequate benefit packages and protection from catastrophic spending
� Introducing comprehensive and complementary benefit packages of various schemes providing for an adequate level of services and income protection.
� Ensuring acceptability of the protected, professionals and politicians.
� Balancing the trade-off between equity and quality in broad consultations with all actors.
� Addressing health-related poverty by covering catastrophic health expenditure (> 40 per cent of a households' income net of subsistence).
� Covering out-of-pocket payments / user fees etc. in order to ensure equal access.
� Ensuring adequacy through focus on patients needs regarding quantity, adequacy and quality of services.
� Minimizing out-of-pocket payments.
� Providing access to primary, secondary and tertiary care (through referral systems), including maternity care, preventive care and care in relation to HIV/AIDS.
� Providing for transportation costs, e.g. for groups living in remote areas.
� Addressing loss of income through adequate cash benefit.
While the size of the benefit package involves a balance between cost and risk protection, it is recommended that benefit packages be defined, including financial protection, with a view to providing equitable access to a comprehensive range of services as outlined in ILO Conventions and Recommendations. This may consist of defining primary health care, in-patient care, prevention and maternity care rather than a "minimum benefit package".
The design and scope of the benefit package coincides with the general policy of the ILO to ensure universal access at all times and in all facilities. The cost of the benefit package or the individual’s place of residence should not deny anyone of health care. Health care services should therefore be provided with dignity and without discrimination, taking into consideration traditions and preferences of individuals within the locality.
Under the ILO Social Security (Minimum Standards) Convention, 1952 (No. 102), the following benefits in case of sickness are foreseen: general practitioner care, including domiciliary visits; specialist care; pharmaceutical supplies; and where necessary, hospitalization.
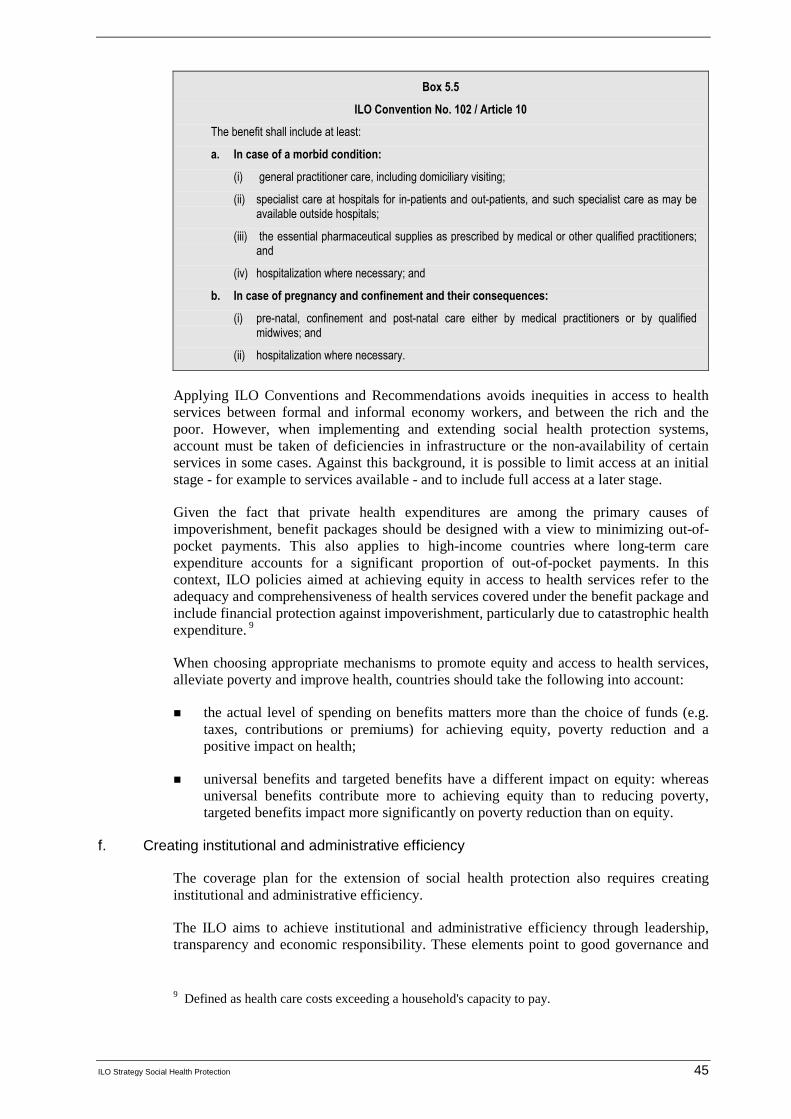
ILO Strategy Social Health Protection 45
Box 5.5
ILO Convention No. 102 / Article 10
The benefit shall include at least:
a. In case of a morbid condition:
(i) general practitioner care, including domiciliary visiting;
(ii) specialist care at hospitals for in-patients and out-patients, and such specialist care as may be available outside hospitals;
(iii) the essential pharmaceutical supplies as prescribed by medical or other qualified practitioners; and
(iv) hospitalization where necessary; and
b. In case of pregnancy and confinement and their consequences:
(i) pre-natal, confinement and post-natal care either by medical practitioners or by qualified midwives; and
(ii) hospitalization where necessary.
Applying ILO Conventions and Recommendations avoids inequities in access to health services between formal and informal economy workers, and between the rich and the poor. However, when implementing and extending social health protection systems, account must be taken of deficiencies in infrastructure or the non-availability of certain services in some cases. Against this background, it is possible to limit access at an initial stage - for example to services available - and to include full access at a later stage.
Given the fact that private health expenditures are among the primary causes of impoverishment, benefit packages should be designed with a view to minimizing out-of-pocket payments. This also applies to high-income countries where long-term care expenditure accounts for a significant proportion of out-of-pocket payments. In this context, ILO policies aimed at achieving equity in access to health services refer to the adequacy and comprehensiveness of health services covered under the benefit package and include financial protection against impoverishment, particularly due to catastrophic health expenditure. 9
When choosing appropriate mechanisms to promote equity and access to health services, alleviate poverty and improve health, countries should take the following into account:
� the actual level of spending on benefits matters more than the choice of funds (e.g. taxes, contributions or premiums) for achieving equity, poverty reduction and a positive impact on health;
� universal benefits and targeted benefits have a different impact on equity: whereas universal benefits contribute more to achieving equity than to reducing poverty, targeted benefits impact more significantly on poverty reduction than on equity.
f. Creating institutional and administrative efficiency
The coverage plan for the extension of social health protection also requires creating institutional and administrative efficiency.
The ILO aims to achieve institutional and administrative efficiency through leadership, transparency and economic responsibility. These elements point to good governance and
9 Defined as health care costs exceeding a household's capacity to pay.
46 ILO Strategy Social Health Protection
form an integral part of the overall strategy design and implementation. It defines good governance in social health protection as referring to decision-making based on:
� existing legal frameworks;
� accountability;
� transparency;
� effectiveness and efficiency;
� equity and inclusiveness;
� participation and consensus.
Tools for participatory and inclusive decision-making include ILO Conventions, as well as national and social dialogue. In this context, ILO particularly stresses the importance of tripartite governance and the participation of stakeholders such as the insured and civil society. The ILO also highlights the need for government supervision of related administrations, funds and private insurances, and government responsibility for covering deficits in social health protection schemes.
ILO quantitative tools for financial governance (ILO Tool Box, Appendix III) aim at achieving quality assurance and monitoring progress and outcome: They include:
� social budgeting;
� Social Protection Expenditure and Performance Reviews (SPERs);
� Social Security Inquiry;
� STEP tools on community-based insurances.
In order to fulfil the criteria of good governance, the financial and administrative separation of health insurance funds from Ministries of Health and Labour is essential. Generally, revenues earmarked for social health protection should be separated from government budgets. Contributions should only be used for health-care benefits and administration of the scheme, and not in support of Ministry of Health functions; it is particularly important to ensure that health-care contributions are not used for other contingencies.
A recent trend in organizing social health protection with a view to efficiency includes various forms of decentralization of responsibilities from the national to local governments or other sub-national institutions. However, the related shift of financial burden to the local level is often problematic, since fund transfers from the national level may be insufficient and result in increasing inequities in access, for example, of the poor (OECD, 2006a). Another form of decentralization of social health protection concerns community-based schemes. They mobilize additional funds at local levels and provide financial protection of out-of-pocket payments, particularly for informal sector workers and their families (ILO, 2006d).
Creating efficiency also relates to purchasing services. Generally, the provision of services can be organized through public or private providers. The most efficient mechanisms to purchase services are:
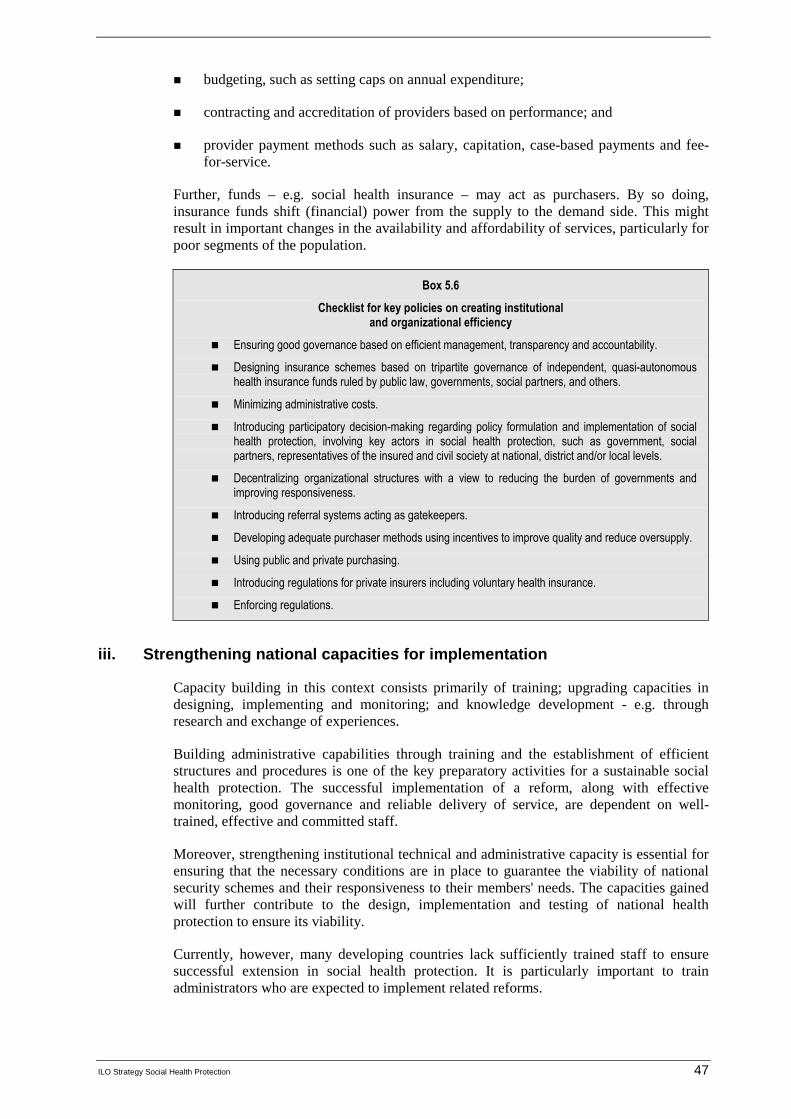
ILO Strategy Social Health Protection 47
� budgeting, such as setting caps on annual expenditure;
� contracting and accreditation of providers based on performance; and
� provider payment methods such as salary, capitation, case-based payments and fee-for-service.
Further, funds – e.g. social health insurance – may act as purchasers. By so doing, insurance funds shift (financial) power from the supply to the demand side. This might result in important changes in the availability and affordability of services, particularly for poor segments of the population.
Box 5.6
Checklist for key policies on creating institutional and organizational efficiency
� Ensuring good governance based on efficient management, transparency and accountability.
� Designing insurance schemes based on tripartite governance of independent, quasi-autonomous health insurance funds ruled by public law, governments, social partners, and others.
� Minimizing administrative costs.
� Introducing participatory decision-making regarding policy formulation and implementation of social health protection, involving key actors in social health protection, such as government, social partners, representatives of the insured and civil society at national, district and/or local levels.
� Decentralizing organizational structures with a view to reducing the burden of governments and improving responsiveness.
� Introducing referral systems acting as gatekeepers.
� Developing adequate purchaser methods using incentives to improve quality and reduce oversupply.
� Using public and private purchasing.
� Introducing regulations for private insurers including voluntary health insurance.
� Enforcing regulations.
iii. Strengthening national capacities for implementation
Capacity building in this context consists primarily of training; upgrading capacities in designing, implementing and monitoring; and knowledge development - e.g. through research and exchange of experiences.
Building administrative capabilities through training and the establishment of efficient structures and procedures is one of the key preparatory activities for a sustainable social health protection. The successful implementation of a reform, along with effective monitoring, good governance and reliable delivery of service, are dependent on well-trained, effective and committed staff.
Moreover, strengthening institutional technical and administrative capacity is essential for ensuring that the necessary conditions are in place to guarantee the viability of national security schemes and their responsiveness to their members' needs. The capacities gained will further contribute to the design, implementation and testing of national health protection to ensure its viability.
Currently, however, many developing countries lack sufficiently trained staff to ensure successful extension in social health protection. It is particularly important to train administrators who are expected to implement related reforms.
48 ILO Strategy Social Health Protection
In addition, enhancing technical capacities of public authorities, social partners and other stakeholders is crucial for overall governance and supervision. Evidence from many countries proves that successfully extending social health protection to the poor requires the consensus of various levels and entities of government, social partners, civil society and others. Given the diverse interests of stakeholders, obtaining the necessary support is a highly complex and difficult task. Problems often arise when stakeholders and social partners feel that they have been ignored in the process involved in the design and provision of social health protection; that concerns have been misunderstood; or that the quality and depth of participatory decision-making was limited. 10 This might result in a lack of support in implementation, enforcement, funding, and compliance to new laws and regulations, leading to a complete failure of important reform activities - even when parliamentarian hurdles have been cleared.
Against this background, it is important to enhance technical capacities of public authorities, social partners and other stakeholders and improve their participation in social and national dialogue. This can be achieved through appropriate training at a tripartite or even broader level.
10 An example might be seen in the recent experience with social health insurance in Kenya:
"Ngilu's fit of fury", in: The Standard (Kenya), 16 November 2004.
ILO Strategy Social Health Protection 49
6. Conclusion
Both developed and developing countries are faced by challenges that have direct implications for the provision of social health protection. High-income countries are confronted by coverage problems related to ageing populations, a shortage of health workers, and an increasing prevalence of lifestyle-related diseases. On the other hand, low-and middle-income countries suffer from low public expenditure, population coverage and access to health services, as well as from high out-of-pocket expenditures and the effects of the vicious cycle of ill health and poverty.
Access to health services is an impact indicator related to social health protection. Globally, data limitations exist to successfully determine gaps in access. Measuring the global access deficit is the ILO’s initial attempt to quantify the discrepancies in access to health services with the use of proxy indicators: density of health professionals and the births attended by skilled health personnel. Statistical analysis was done using these proxy indicators and the Human Poverty and Human Development Indices. According to the analysis made on the Human Development Index and health professional deficit, and with Thailand as the benchmark, one-third of the global population does not have access to health care.
Overall, data showed that there is no single approach to providing protection against financial and health risks. Both developed and developing countries are simultaneously employing various health financing mechanisms to work towards providing universal coverage to the whole population based on adequate benefit packages.
The ILO strategy on rationalizing the use of pluralistic financing mechanisms for achieving universal coverage in social health protection is aimed at accelerating the achievement of universal coverage, promoting equity and supporting global international efforts to alleviate poverty and improve health. The strategy is built on the central credo of incorporating all existing coverage and financing subsystems in a country into one pragmatic pluralistic national system, as long as the existing subsystems and the system as a whole meet a number of outcome and process criteria.
The system should provide for the:
� achievement of universal coverage of the population within a realistic time frame;
� effective and efficient provision of adequate benefit packages, including financial protection for all, but not necessarily uniform benefit packages;
� existence of a governance system that confirms the overall responsibility of the government for the functioning of the system as a whole, but also involves covered persons, financiers (contributors and taxpayers, including employers and workers in the formal and informal economy) and providers of care; and
� fiscal and economic affordability.
A framework was provided to design the ILO strategy, involving the assessment of the coverage gap and access deficit; development of a national coverage plan; and the strengthening of national capacities for implementation. These are the core elements that underpin the approach to social health protection.
The approach is part of the ILO decent work strategy and the Global Campaign on Social Security and Coverage for All. It builds on in-depth analyses of the extent of social health protection coverage and the gaps in access to health services. The ILO, in cooperation with other agencies (notably within the ILO-WHO-GTZ Consortium on social health

50 ILO Strategy Social Health Protection
protection), recommends a comprehensive social protection tool box and information base to governments and other actors in the field of social health protection; it also offers support in closing gaps and addressing limitations. ILO believes that the suggested strategy has the potential to achieve universal coverage in health.

ILO Strategy Social Health Protection 51
Appendix I
Country experiences: A brief overview
This part of the report provides a selection of recent national experiences in extending social health protection in countries in Africa, Asia, Europe and Latin America.
a. Africa
This section provides an overview of the health systems of selected countries in the African region, focusing on trends in social health protection. The case studies included are Benin, Burkina Faso, Egypt, Ghana, Kenya, Senegal and Tunisia. The experience in some African countries with community-based health insurance schemes is particularly noteworthy.
Figure A.1 illustrates the differences and similarities among selected African countries in coverage, access deficit and out-of-pocket spending. Out-of-pocket expenses are generally very high in the region, accounting for over 45 per cent of total health expenditures in all countries selected - and even for more than 68 per cent in Ghana. Similarly, staff-related access deficit at 60 per cent and above is high for the countries selected; only Egypt achieves a comparatively low percentage at 19 per cent. Total formal coverage varies between 0.2 per cent in Burkina Faso and almost universal coverage in Tunisia, with Egypt lying in the middle at 47 per cent.
Figure A.1. Comparison of selected countries in Africa
0102030405060708090
100
Benin
Burkin
a Fas
oEgy
pt
Ghana
Kenya
Seneg
al
Tunisi
a
Per
cen
tag
e
Total Formal Coverage %
Staff related national accessdeficit %
Out of pocket payments as %of total health expenditure
Source: Appendix II, table 2
Benin
According to an ILO study on Social Protection Expenditure and Performance Reviews (SPER) in Benin (ILO/STEP, 2006e; see also, Affo-Massim Ouali et al., 2004), 6.21 per cent of the country's active population benefits from an old-age pension and 0.5 per cent of the country’s population has health-care coverage (table 1). Social security for salaried workers in the semi-public and private sectors is managed by the National Social Security Fund (CNSS). It covers old-age and invalidity pensions, family benefits, occupational accidents and illness, maternity, and survivors’ benefits.

52 ILO Strategy Social Health Protection
Benin has a multiplicity of insurance mechanisms for health protection, broadly falling into three categories. First, there is a public, non-contributory scheme covering about 33,000 state employees and their families, amounting to almost 200,000 people - or 2.95 per cent - of the population. State employees are covered for 80 per cent of their health-care costs (except for pharmaceutical costs), old-age pensions from the National Retirement Fund of Benin (FNRB) and family benefits.
Second, private sector schemes for workers in the formal labour market cover about 45,000 workers, adding up to about 270,000 beneficiaries, or 3,98 per cent of the population. Social security for salaried workers in the semi-public and private sectors is managed by the CNSS. It is obligatory and covers old-age and invalidity pensions, family benefits, occupational accidents and illness, maternity, and survivors’ benefits.
Third, a number of workers in the informal economy are covered by the mutuelles de santé – mutual health organizations - that have been developing rapidly in Benin since 1994 when they were first established. These are generally small in size (covering 200-100 beneficiaries, or about 10 per cent of the people in communities where mutuelles exist) and offer membership at a low cost (between 100 and 500 FCFA). Cost recovery in these schemes is estimated at 45-55 per cent. Over 100 health micro-insurance schemes have been set up, covering an estimated 100,000 people. These schemes are administered by their members and are run on the basis of solidarity. Moreover, there is an umbrella organization - the Réseau Alliance Santé - that provides technical assistance and financial support to the mutuelles (technical and financial management, claims processing, organization of their General Assembly); it also owns a guarantee fund and a reinsurance fund. The mutuelles pay 10 per cent of the contributions raised for the services of the Réseau Alliance Santé (Churchill, 2006).
Table 1. Selected indicators of social health protection in Benin
Selected social health protection indicators Percentage
Total formal coverage as % of population (State, social, private and mutual health insurance schemes)
0.5
Staff-related national access deficit as % of population 72
Total health expenditure as % of GDP 4.4
Out-of-pocket payments as % of total health expenditure 51.4
Out-of -pocket Payments as % of private health expenditure 79.3
Source: Appendix II, table 2.
Burkina Faso
Formal social security schemes in Burkina Faso (ILO/STEP, 2006e) cover less than 10 per cent of the total population and are limited to old-age pensions, work accidents and maternity. Total formal coverage in health is estimated at 0.2 per cent; the staff-related access deficit is very high, at 85 per cent, as is the percentage of OOP of total health expenditure at 52.2 per cent (table 2).
Since the 1990s, new initiatives have emerged to provide social protection. These include: mutuelles de santé, caisses de solidarité, systèmes de prépaiement, assurance santé-crédit. By 2003, over a hundred mutual health organizations, micro-insurance and other schemes were operating in the country. These initiatives are closely supervised and supported by the State through the Direction for the Mutual Benefit Associations within the Ministry of Employment, Labour and Social Security.
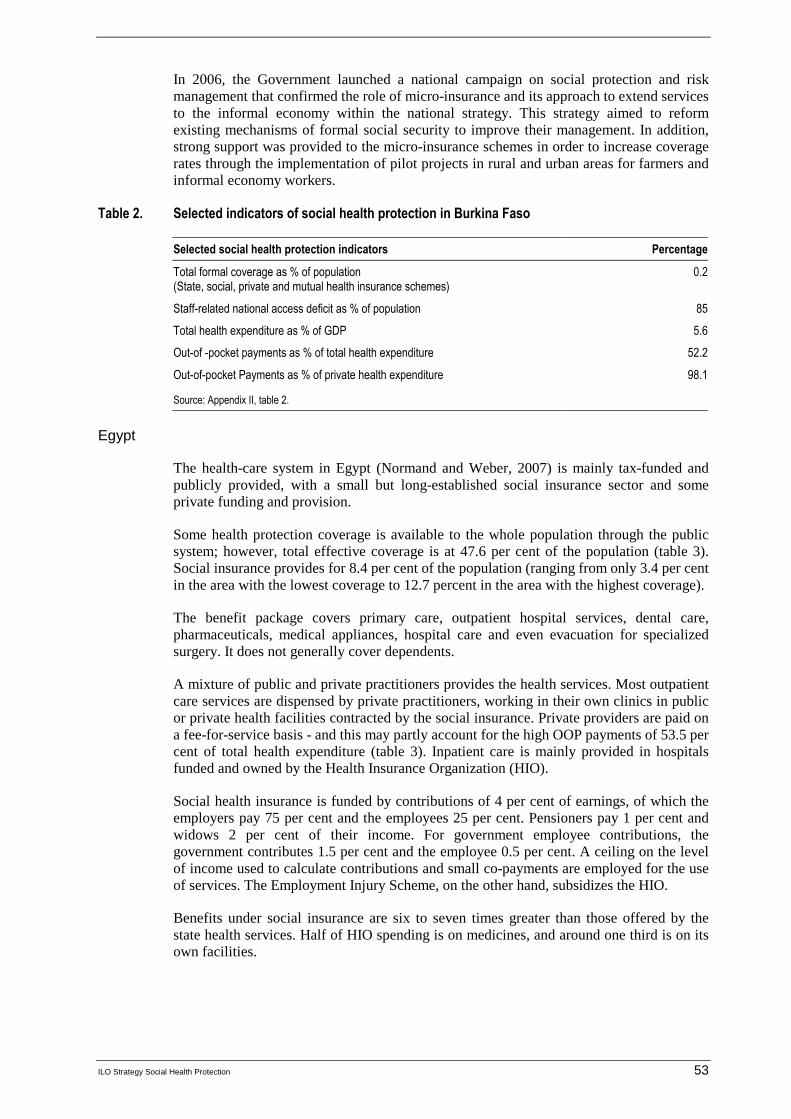
ILO Strategy Social Health Protection 53
In 2006, the Government launched a national campaign on social protection and risk management that confirmed the role of micro-insurance and its approach to extend services to the informal economy within the national strategy. This strategy aimed to reform existing mechanisms of formal social security to improve their management. In addition, strong support was provided to the micro-insurance schemes in order to increase coverage rates through the implementation of pilot projects in rural and urban areas for farmers and informal economy workers.
Table 2. Selected indicators of social health protection in Burkina Faso
Selected social health protection indicators Percentage
Total formal coverage as % of population (State, social, private and mutual health insurance schemes)
0.2
Staff-related national access deficit as % of population 85
Total health expenditure as % of GDP 5.6
Out-of -pocket payments as % of total health expenditure 52.2
Out-of-pocket Payments as % of private health expenditure 98.1
Source: Appendix II, table 2.
Egypt
The health-care system in Egypt (Normand and Weber, 2007) is mainly tax-funded and publicly provided, with a small but long-established social insurance sector and some private funding and provision.
Some health protection coverage is available to the whole population through the public system; however, total effective coverage is at 47.6 per cent of the population (table 3). Social insurance provides for 8.4 per cent of the population (ranging from only 3.4 per cent in the area with the lowest coverage to 12.7 percent in the area with the highest coverage).
The benefit package covers primary care, outpatient hospital services, dental care, pharmaceuticals, medical appliances, hospital care and even evacuation for specialized surgery. It does not generally cover dependents.
A mixture of public and private practitioners provides the health services. Most outpatient care services are dispensed by private practitioners, working in their own clinics in public or private health facilities contracted by the social insurance. Private providers are paid on a fee-for-service basis - and this may partly account for the high OOP payments of 53.5 per cent of total health expenditure (table 3). Inpatient care is mainly provided in hospitals funded and owned by the Health Insurance Organization (HIO).
Social health insurance is funded by contributions of 4 per cent of earnings, of which the employers pay 75 per cent and the employees 25 per cent. Pensioners pay 1 per cent and widows 2 per cent of their income. For government employee contributions, the government contributes 1.5 per cent and the employee 0.5 per cent. A ceiling on the level of income used to calculate contributions and small co-payments are employed for the use of services. The Employment Injury Scheme, on the other hand, subsidizes the HIO.
Benefits under social insurance are six to seven times greater than those offered by the state health services. Half of HIO spending is on medicines, and around one third is on its own facilities.
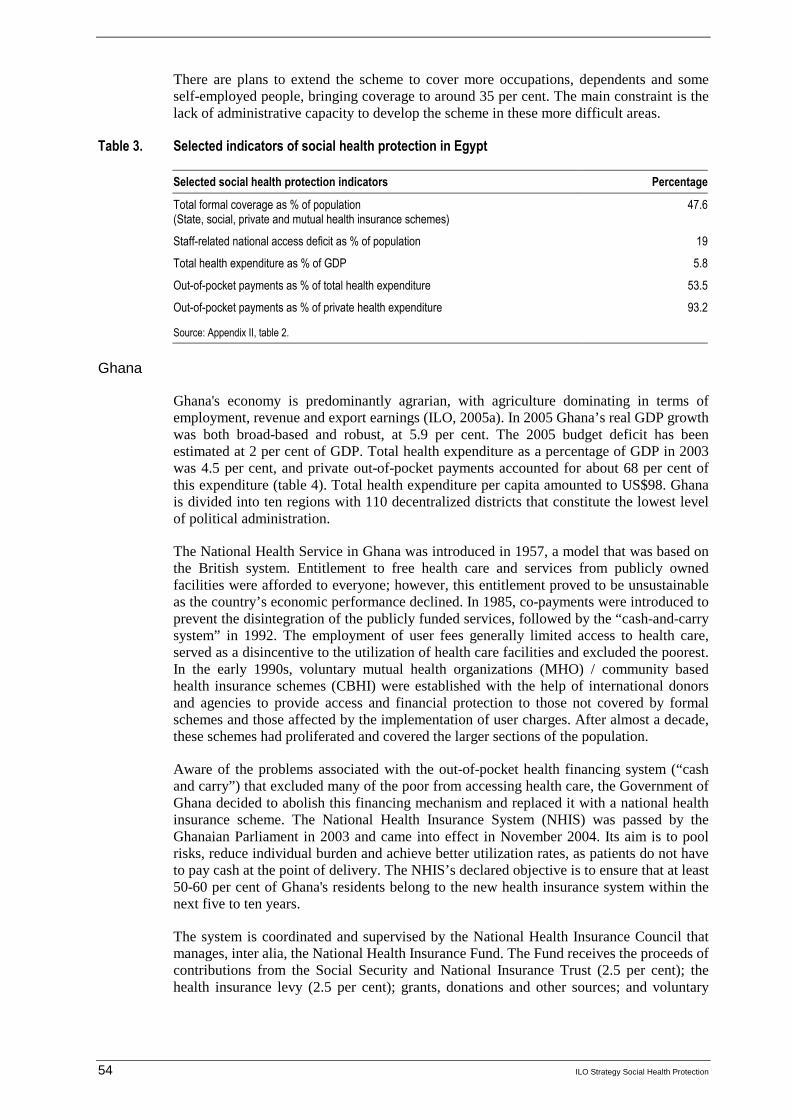
54 ILO Strategy Social Health Protection
There are plans to extend the scheme to cover more occupations, dependents and some self-employed people, bringing coverage to around 35 per cent. The main constraint is the lack of administrative capacity to develop the scheme in these more difficult areas.
Table 3. Selected indicators of social health protection in Egypt
Selected social health protection indicators Percentage
Total formal coverage as % of population (State, social, private and mutual health insurance schemes)
47.6
Staff-related national access deficit as % of population 19
Total health expenditure as % of GDP 5.8
Out-of-pocket payments as % of total health expenditure 53.5
Out-of-pocket payments as % of private health expenditure 93.2
Source: Appendix II, table 2.
Ghana
Ghana's economy is predominantly agrarian, with agriculture dominating in terms of employment, revenue and export earnings (ILO, 2005a). In 2005 Ghana’s real GDP growth was both broad-based and robust, at 5.9 per cent. The 2005 budget deficit has been estimated at 2 per cent of GDP. Total health expenditure as a percentage of GDP in 2003 was 4.5 per cent, and private out-of-pocket payments accounted for about 68 per cent of this expenditure (table 4). Total health expenditure per capita amounted to US$98. Ghana is divided into ten regions with 110 decentralized districts that constitute the lowest level of political administration.
The National Health Service in Ghana was introduced in 1957, a model that was based on the British system. Entitlement to free health care and services from publicly owned facilities were afforded to everyone; however, this entitlement proved to be unsustainable as the country’s economic performance declined. In 1985, co-payments were introduced to prevent the disintegration of the publicly funded services, followed by the “cash-and-carry system” in 1992. The employment of user fees generally limited access to health care, served as a disincentive to the utilization of health care facilities and excluded the poorest. In the early 1990s, voluntary mutual health organizations (MHO) / community based health insurance schemes (CBHI) were established with the help of international donors and agencies to provide access and financial protection to those not covered by formal schemes and those affected by the implementation of user charges. After almost a decade, these schemes had proliferated and covered the larger sections of the population.
Aware of the problems associated with the out-of-pocket health financing system (“cash and carry”) that excluded many of the poor from accessing health care, the Government of Ghana decided to abolish this financing mechanism and replaced it with a national health insurance scheme. The National Health Insurance System (NHIS) was passed by the Ghanaian Parliament in 2003 and came into effect in November 2004. Its aim is to pool risks, reduce individual burden and achieve better utilization rates, as patients do not have to pay cash at the point of delivery. The NHIS’s declared objective is to ensure that at least 50-60 per cent of Ghana's residents belong to the new health insurance system within the next five to ten years.
The system is coordinated and supervised by the National Health Insurance Council that manages, inter alia, the National Health Insurance Fund. The Fund receives the proceeds of contributions from the Social Security and National Insurance Trust (2.5 per cent); the health insurance levy (2.5 per cent); grants, donations and other sources; and voluntary
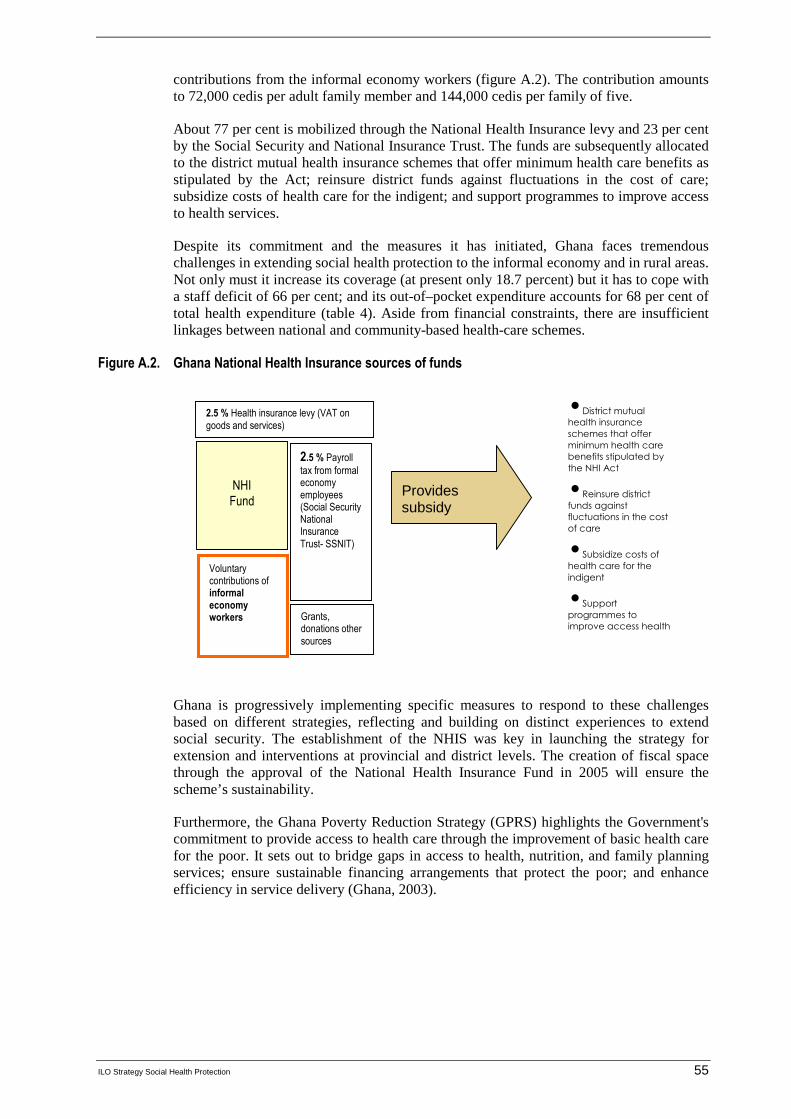
ILO Strategy Social Health Protection 55
contributions from the informal economy workers (figure A.2). The contribution amounts to 72,000 cedis per adult family member and 144,000 cedis per family of five.
About 77 per cent is mobilized through the National Health Insurance levy and 23 per cent by the Social Security and National Insurance Trust. The funds are subsequently allocated to the district mutual health insurance schemes that offer minimum health care benefits as stipulated by the Act; reinsure district funds against fluctuations in the cost of care; subsidize costs of health care for the indigent; and support programmes to improve access to health services.
Despite its commitment and the measures it has initiated, Ghana faces tremendous challenges in extending social health protection to the informal economy and in rural areas. Not only must it increase its coverage (at present only 18.7 percent) but it has to cope with a staff deficit of 66 per cent; and its out-of–pocket expenditure accounts for 68 per cent of total health expenditure (table 4). Aside from financial constraints, there are insufficient linkages between national and community-based health-care schemes.
Figure A.2. Ghana National Health Insurance sources of funds
Ghana is progressively implementing specific measures to respond to these challenges based on different strategies, reflecting and building on distinct experiences to extend social security. The establishment of the NHIS was key in launching the strategy for extension and interventions at provincial and district levels. The creation of fiscal space through the approval of the National Health Insurance Fund in 2005 will ensure the scheme’s sustainability.
Furthermore, the Ghana Poverty Reduction Strategy (GPRS) highlights the Government's commitment to provide access to health care through the improvement of basic health care for the poor. It sets out to bridge gaps in access to health, nutrition, and family planning services; ensure sustainable financing arrangements that protect the poor; and enhance efficiency in service delivery (Ghana, 2003).
NHI Fund
2.5 % Health insurance levy (VAT on goods and services)
2.5 % Payroll tax from formal economy employees (Social Security National Insurance Trust- SSNIT)
Voluntary contributions of informal economy workers
•District mutual
health insurance
schemes that offer
minimum health care
benefits stipulated by
the NHI Act
•Reinsure district
funds against
fluctuations in the cost
of care
•Subsidize costs of
health care for the
indigent
•Support
programmes to
improve access health
services
Provides subsidy
Grants, donations other sources
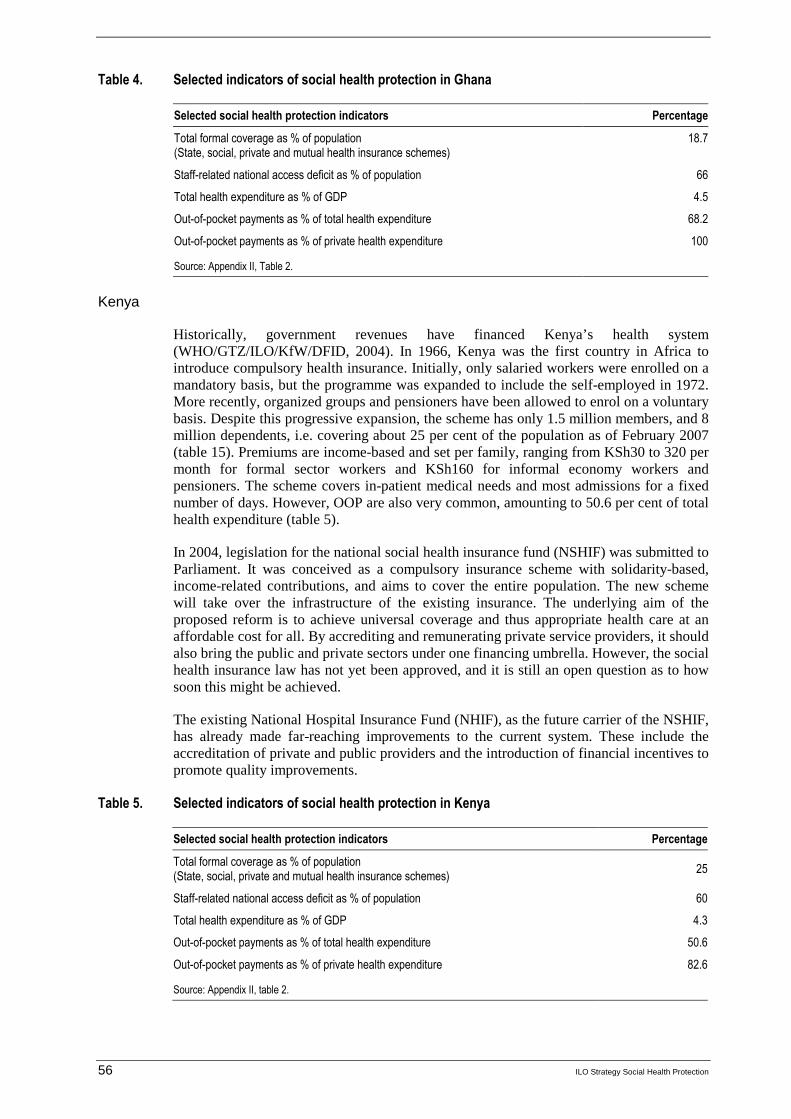
56 ILO Strategy Social Health Protection
Table 4. Selected indicators of social health protection in Ghana
Selected social health protection indicators Percentage
Total formal coverage as % of population (State, social, private and mutual health insurance schemes)
18.7
Staff-related national access deficit as % of population 66
Total health expenditure as % of GDP 4.5
Out-of-pocket payments as % of total health expenditure 68.2
Out-of-pocket payments as % of private health expenditure 100
Source: Appendix II, Table 2.
Kenya
Historically, government revenues have financed Kenya’s health system (WHO/GTZ/ILO/KfW/DFID, 2004). In 1966, Kenya was the first country in Africa to introduce compulsory health insurance. Initially, only salaried workers were enrolled on a mandatory basis, but the programme was expanded to include the self-employed in 1972. More recently, organized groups and pensioners have been allowed to enrol on a voluntary basis. Despite this progressive expansion, the scheme has only 1.5 million members, and 8 million dependents, i.e. covering about 25 per cent of the population as of February 2007 (table 15). Premiums are income-based and set per family, ranging from KSh30 to 320 per month for formal sector workers and KSh160 for informal economy workers and pensioners. The scheme covers in-patient medical needs and most admissions for a fixed number of days. However, OOP are also very common, amounting to 50.6 per cent of total health expenditure (table 5).
In 2004, legislation for the national social health insurance fund (NSHIF) was submitted to Parliament. It was conceived as a compulsory insurance scheme with solidarity-based, income-related contributions, and aims to cover the entire population. The new scheme will take over the infrastructure of the existing insurance. The underlying aim of the proposed reform is to achieve universal coverage and thus appropriate health care at an affordable cost for all. By accrediting and remunerating private service providers, it should also bring the public and private sectors under one financing umbrella. However, the social health insurance law has not yet been approved, and it is still an open question as to how soon this might be achieved.
The existing National Hospital Insurance Fund (NHIF), as the future carrier of the NSHIF, has already made far-reaching improvements to the current system. These include the accreditation of private and public providers and the introduction of financial incentives to promote quality improvements.
Table 5. Selected indicators of social health protection in Kenya
Selected social health protection indicators Percentage
Total formal coverage as % of population (State, social, private and mutual health insurance schemes)
25
Staff-related national access deficit as % of population 60
Total health expenditure as % of GDP 4.3
Out-of-pocket payments as % of total health expenditure 50.6
Out-of-pocket payments as % of private health expenditure 82.6
Source: Appendix II, table 2.
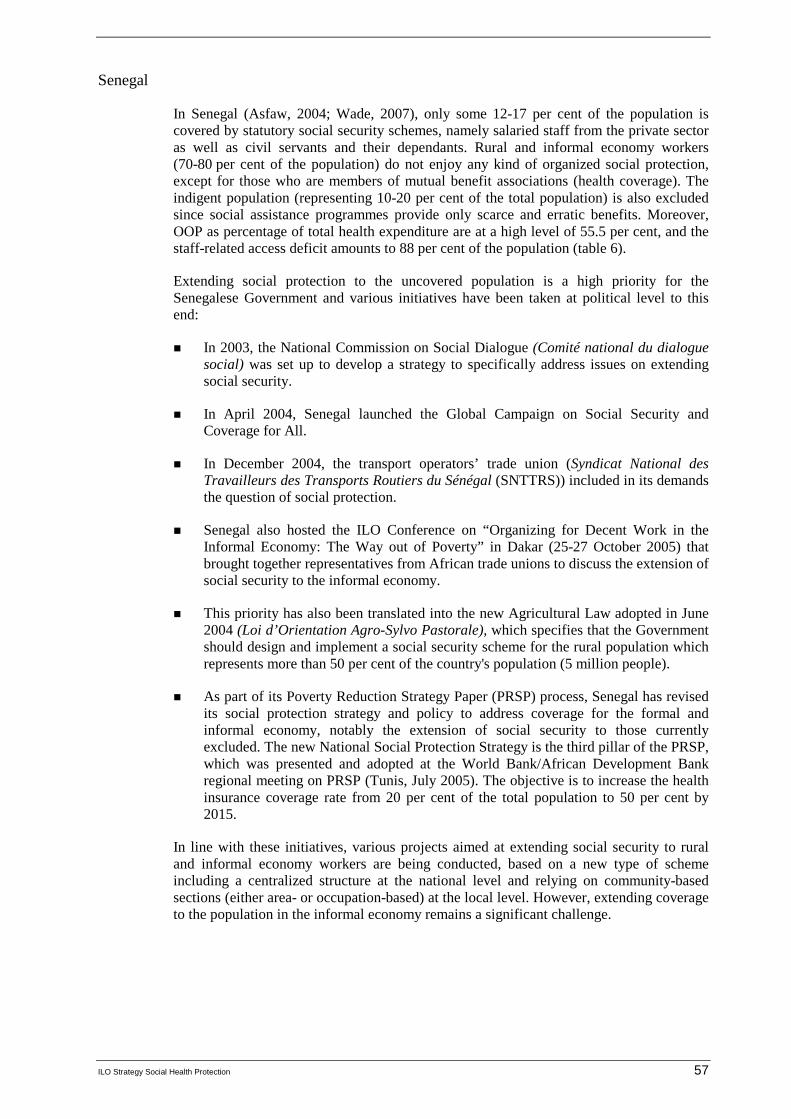
ILO Strategy Social Health Protection 57
Senegal
In Senegal (Asfaw, 2004; Wade, 2007), only some 12-17 per cent of the population is covered by statutory social security schemes, namely salaried staff from the private sector as well as civil servants and their dependants. Rural and informal economy workers (70-80 per cent of the population) do not enjoy any kind of organized social protection, except for those who are members of mutual benefit associations (health coverage). The indigent population (representing 10-20 per cent of the total population) is also excluded since social assistance programmes provide only scarce and erratic benefits. Moreover, OOP as percentage of total health expenditure are at a high level of 55.5 per cent, and the staff-related access deficit amounts to 88 per cent of the population (table 6).
Extending social protection to the uncovered population is a high priority for the Senegalese Government and various initiatives have been taken at political level to this end:
� In 2003, the National Commission on Social Dialogue (Comité national du dialogue social) was set up to develop a strategy to specifically address issues on extending social security.
� In April 2004, Senegal launched the Global Campaign on Social Security and Coverage for All.
� In December 2004, the transport operators’ trade union (Syndicat National des Travailleurs des Transports Routiers du Sénégal (SNTTRS)) included in its demands the question of social protection.
� Senegal also hosted the ILO Conference on “Organizing for Decent Work in the Informal Economy: The Way out of Poverty” in Dakar (25-27 October 2005) that brought together representatives from African trade unions to discuss the extension of social security to the informal economy.
� This priority has also been translated into the new Agricultural Law adopted in June 2004 (Loi d’Orientation Agro-Sylvo Pastorale), which specifies that the Government should design and implement a social security scheme for the rural population which represents more than 50 per cent of the country's population (5 million people).
� As part of its Poverty Reduction Strategy Paper (PRSP) process, Senegal has revised its social protection strategy and policy to address coverage for the formal and informal economy, notably the extension of social security to those currently excluded. The new National Social Protection Strategy is the third pillar of the PRSP, which was presented and adopted at the World Bank/African Development Bank regional meeting on PRSP (Tunis, July 2005). The objective is to increase the health insurance coverage rate from 20 per cent of the total population to 50 per cent by 2015.
In line with these initiatives, various projects aimed at extending social security to rural and informal economy workers are being conducted, based on a new type of scheme including a centralized structure at the national level and relying on community-based sections (either area- or occupation-based) at the local level. However, extending coverage to the population in the informal economy remains a significant challenge.

58 ILO Strategy Social Health Protection
Table 6. Selected indicators of social health protection in Senegal
Selected social health protection indicators Percentage
Total formal coverage as % of population (State, social, private and mutual health insurance schemes)
11.7
Staff-related national access deficit as % of population 88
Total health expenditure as % of GDP 5.1
Out-of -pocket payments as % of total health expenditure 55.5
Out-of -pocket payments as % of private health expenditure 95.3
Source: Appendix II, table 2.
Tunisia
Tunisia pursues an integrated health policy, focusing on both demand-side and supply-side policies as well as creating links between the health sector and national economic development plans. Overall, the state plays a major role for the provision of health infrastructure, specialized equipment, drugs, preventive measures, training, research and the provision of social health insurance. The health infrastructure in Tunisia is well developed. 90% of Tunisians live within less than 5 km of a basic health facility. The number of doctors has increased steadily arriving at a ratio of 968 inhabitants per doctor in 2007. Tunisia has also invested in pharmaceutical industries, producing 46% of its drugs.
The social health protection system in Tunisia is ranked amongst the best of all developing countries and Tunisia has achieved remarkable progress on several health indicators, especially relating to communicable diseases and maternal and child mortality. Child mortality dropped from 51.2 per thousand in 1984 to 18.4 per thousand in 2007. Life expectancy at birth has increased from 68 to 74,2 over the past two decades and vaccination rates for children are at 100%. Overall, social expenditures have risen from 44% to 56,2% of total government budget with health expenditures growing sevenfold over the same period. According to UN estimates, Tunisia is well on track to meet all MDGs before 2015.
Since the end of the 1950s, two out of three Tunisians (Achouri, 2007; Asfaw, 2004) have been insured under either public or private schemes that offer social security to civil servants and workers in the public sector (National Pension and Social Provision Fund or CNRPS), as well as to those in private enterprises (Social Security Fund or CNSS). In total, there are 12 different schemes in place, based on different professional categories. In addition, the Government provides free health-care services for the poor and low-income population as well as for disabled persons in public facilities run by the Ministry of Health, so that Tunisia achieves a close-to-universal coverage rate (table 7). In addition, a supportive regulatory framework has been created for private societies or public bodies offering complementary private health insurance to their employees, covering the same package as the public insurance.
In the 1990s, the Tunisian health insurance system faced a series of problems and difficulties regarding efficiency, quality, equity, and satisfaction of stakeholders and users. The burden of contribution payments of employers and employees was unequally distributed - and OOP remains relatively high at 45.1 per cent of total health expenditure (table 7).
The current health insurance reform (1994) pursues two major goals: to harmonize the benefits of the different health insurance regimes and introduce a sole mandatory health insurance body, the Caisse Nationale d’Assurance Maladie (CNAM); and to create optional complementary regimes to cover OOP that currently remain uncovered. Reforms

ILO Strategy Social Health Protection 59
undertaken are placing the citizen at the center and emphasize the importance of national and social dialogue and participatory processes.
At present the national debate is focusing on issues such as the coverage of the benefit package, cost containment (including provider payment methods), quality assurance, management procedures, regulation and guidelines.
Table 7. Selected indicators of social health protection in Tunisia
Selected social health protection indicators Percentage
Total formal coverage as % of population (State, social, private and mutual health insurance schemes)
99
Staff-related national access deficit as % of population -
Total health expenditure as % of GDP 5.4
Out-of-pocket payments as % of total health expenditure 45.1
Out-of-pocket payments as % of private health expenditure 83
Source: Appendix II, table 2.
b. Asia
This section presents brief summaries of social health protection systems in China, the Republic of Korea, India, Indonesia, the Philippines and Thailand. As can be seen in the overview in figure A.3, the countries selected are very different, as are their situations concerning health protection. The Republic of Korea and Thailand mark examples of countries that have achieved very good outcomes with comparatively few resources; indeed, both countries have achieved almost universal coverage. However, OOP are - at 41.9 per cent of total health expenditure - rather high in the Republic of Korea, as compared to 28.7 per cent in Thailand. In contrast, China and India have low levels of coverage - 23.9 per cent and 5.7 per cent, respectively; and they have high levels of OOP - 55.9 per cent and 72.9 per cent, respectively. The figures for the staff-related access deficit show a rather diverse picture, ranging from 29 per cent in the Philippines to 76 per cent in Indonesia.
Figure A.3. Comparison of selected countries in Asia
0102030405060708090
100
China
Repub
lik o
f Kor
eaIn
dia
Indo
nesia
Philipp
ines
Thaila
nd
Per
cen
tag
e
Total FormalCoverage %
Staff related accessdeficit
Out of pocketpayment as % of totalhealth expenditure

60 ILO Strategy Social Health Protection
China
China is enjoying impressive and sustained economic growth (Tang et al., 2007; Hu, 2007; Drouin and Thompson, 2006), and since the early 1980s the living conditions of the vast majority of its population have improved significantly. The world’s most populated country is currently experiencing major social and economic changes, but the social agenda is still incomplete since inequity in health remains a major concern. Until the 1970s, China enjoyed a relatively well functioning health system, with about 90 per cent of the population covered by health insurance. However, since the 1980s both the quality of health services and the proportion of the population insured have declined dramatically, and health indicators have deteriorated accordingly. The collapse of cooperative medical schemes in rural areas and the crippling of the public insurance schemes have produced serious problems in health financing and access. Out-of-pocket payments increased from 20 per cent in 1978 to 60 per cent in the early 2000s. At the same time, public funding for the health sector had been reduced while health expenditure has continued to rise.
In response to these developments, China has set up “Basic health care services for all” as one of the principle requirements for attaining the goal of building a moderately prosperous society in all respects. Health insurance and social assistance are therefore expected to play an important role. This is one of the underlying reasons for their remarkable expansion over the last decade: the number of persons having health insurance cover rose from less than 150 million (about 12% of the population) in 1997 to an estimated 900 million (above 70% of the population) in 2007. 11 The established national objective is to achieve universal coverage for health insurance by 2010. 12
The Chinese public health insurance system consists of four principle schemes, namely HI for civil servants and those with similar status, HI for urban working population, HI for urban economically inactive residents (HIUR) and the New Rural Cooperative Medical Care (NRCM) for the rural population. The first two can be traced back to the 1950s despite a series of restructuring they have experienced over the time, whilst the last two are more recent initiatives, being only launched in 2003 and 2007 respectively. Both have a heavily charged task to accomplish: To cover 780-910 million and 220-300 million under NRCM and HIUR respectively by 2010. 13 As far as the 2003-launched NRCM is concerned, it operated in 2448 counties or 85.53% of the total with 726 million people insured at the end of September 2007. 14 Among other factors, this extension can be
11 Estimates made by A.HU based on China Statistical Yearbooks from 1998 to 2006, China
Labour Statistical Yearbook 2001, various Government’s periodical bulletins and media information.
12 Decision on further improving the rural health jointly made by the Central Committee of the
Party and the State Council, (Circular No. 13 (2002); Notice of the Cabinet of the State Council on the Guidelines for setting up the New Rural Cooperative Medical Care formulated by the MOH and other responsible ministries, Circular No. 3 (2003); Chen, Zhu (Minister of MOH). Speech at a Press Conference on the latest development of the New Rural Cooperative Medical Care, held on 5 September 2007 in Beijing; Guidelines on piloting the a health insurance scheme for urban economically inactive residents issued by the State Council (Circular No. 20 (2007); Hu, X (Vice Minister of MOLSS), speech at the Press Conference with regard to the new health insurance scheme for urban economically inactive residents, held on 15 August 2007 in Beijing.
13 These are estimates made by various government’s departments and academic people, as no
accurate statistics are available due to many causes, such as rural-to-city migration and Huko registration systems.
14 See http://news.xinhuanet.com/politics/2007-12/17content_7264119.htm
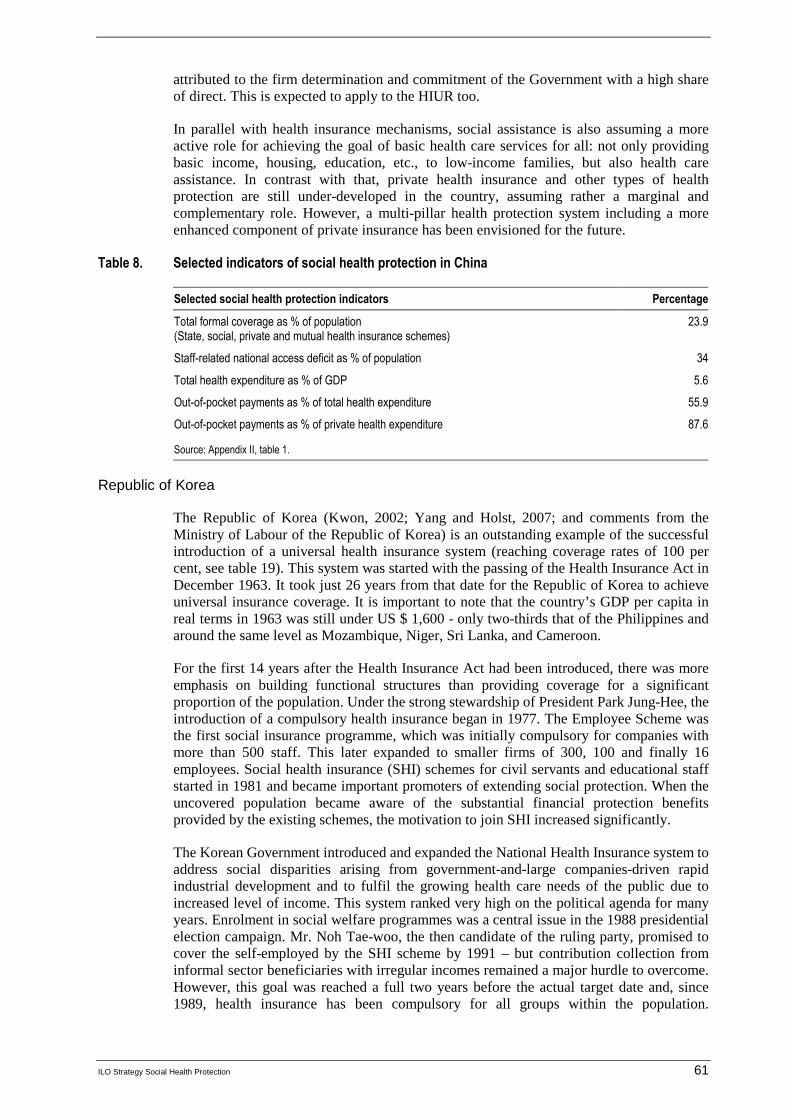
ILO Strategy Social Health Protection 61
attributed to the firm determination and commitment of the Government with a high share of direct. This is expected to apply to the HIUR too.
In parallel with health insurance mechanisms, social assistance is also assuming a more active role for achieving the goal of basic health care services for all: not only providing basic income, housing, education, etc., to low-income families, but also health care assistance. In contrast with that, private health insurance and other types of health protection are still under-developed in the country, assuming rather a marginal and complementary role. However, a multi-pillar health protection system including a more enhanced component of private insurance has been envisioned for the future.
Table 8. Selected indicators of social health protection in China
Selected social health protection indicators Percentage
Total formal coverage as % of population (State, social, private and mutual health insurance schemes)
23.9
Staff-related national access deficit as % of population 34
Total health expenditure as % of GDP 5.6
Out-of-pocket payments as % of total health expenditure 55.9
Out-of-pocket payments as % of private health expenditure 87.6
Source: Appendix II, table 1.
Republic of Korea
The Republic of Korea (Kwon, 2002; Yang and Holst, 2007; and comments from the Ministry of Labour of the Republic of Korea) is an outstanding example of the successful introduction of a universal health insurance system (reaching coverage rates of 100 per cent, see table 19). This system was started with the passing of the Health Insurance Act in December 1963. It took just 26 years from that date for the Republic of Korea to achieve universal insurance coverage. It is important to note that the country’s GDP per capita in real terms in 1963 was still under US $ 1,600 - only two-thirds that of the Philippines and around the same level as Mozambique, Niger, Sri Lanka, and Cameroon.
For the first 14 years after the Health Insurance Act had been introduced, there was more emphasis on building functional structures than providing coverage for a significant proportion of the population. Under the strong stewardship of President Park Jung-Hee, the introduction of a compulsory health insurance began in 1977. The Employee Scheme was the first social insurance programme, which was initially compulsory for companies with more than 500 staff. This later expanded to smaller firms of 300, 100 and finally 16 employees. Social health insurance (SHI) schemes for civil servants and educational staff started in 1981 and became important promoters of extending social protection. When the uncovered population became aware of the substantial financial protection benefits provided by the existing schemes, the motivation to join SHI increased significantly.
The Korean Government introduced and expanded the National Health Insurance system to address social disparities arising from government-and-large companies-driven rapid industrial development and to fulfil the growing health care needs of the public due to increased level of income. This system ranked very high on the political agenda for many years. Enrolment in social welfare programmes was a central issue in the 1988 presidential election campaign. Mr. Noh Tae-woo, the then candidate of the ruling party, promised to cover the self-employed by the SHI scheme by 1991 – but contribution collection from informal sector beneficiaries with irregular incomes remained a major hurdle to overcome. However, this goal was reached a full two years before the actual target date and, since 1989, health insurance has been compulsory for all groups within the population.
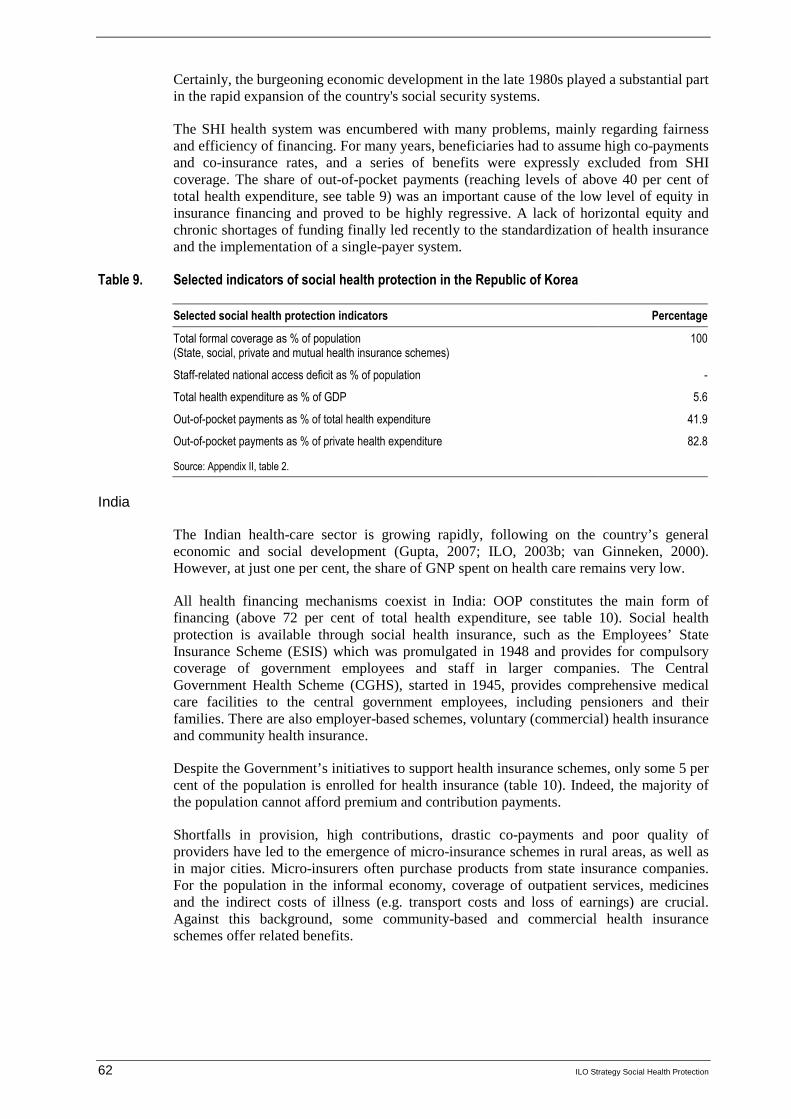
62 ILO Strategy Social Health Protection
Certainly, the burgeoning economic development in the late 1980s played a substantial part in the rapid expansion of the country's social security systems.
The SHI health system was encumbered with many problems, mainly regarding fairness and efficiency of financing. For many years, beneficiaries had to assume high co-payments and co-insurance rates, and a series of benefits were expressly excluded from SHI coverage. The share of out-of-pocket payments (reaching levels of above 40 per cent of total health expenditure, see table 9) was an important cause of the low level of equity in insurance financing and proved to be highly regressive. A lack of horizontal equity and chronic shortages of funding finally led recently to the standardization of health insurance and the implementation of a single-payer system.
Table 9. Selected indicators of social health protection in the Republic of Korea
Selected social health protection indicators Percentage
Total formal coverage as % of population (State, social, private and mutual health insurance schemes)
100
Staff-related national access deficit as % of population -
Total health expenditure as % of GDP 5.6
Out-of-pocket payments as % of total health expenditure 41.9
Out-of-pocket payments as % of private health expenditure 82.8
Source: Appendix II, table 2.
India
The Indian health-care sector is growing rapidly, following on the country’s general economic and social development (Gupta, 2007; ILO, 2003b; van Ginneken, 2000). However, at just one per cent, the share of GNP spent on health care remains very low.
All health financing mechanisms coexist in India: OOP constitutes the main form of financing (above 72 per cent of total health expenditure, see table 10). Social health protection is available through social health insurance, such as the Employees’ State Insurance Scheme (ESIS) which was promulgated in 1948 and provides for compulsory coverage of government employees and staff in larger companies. The Central Government Health Scheme (CGHS), started in 1945, provides comprehensive medical care facilities to the central government employees, including pensioners and their families. There are also employer-based schemes, voluntary (commercial) health insurance and community health insurance.
Despite the Government’s initiatives to support health insurance schemes, only some 5 per cent of the population is enrolled for health insurance (table 10). Indeed, the majority of the population cannot afford premium and contribution payments.
Shortfalls in provision, high contributions, drastic co-payments and poor quality of providers have led to the emergence of micro-insurance schemes in rural areas, as well as in major cities. Micro-insurers often purchase products from state insurance companies. For the population in the informal economy, coverage of outpatient services, medicines and the indirect costs of illness (e.g. transport costs and loss of earnings) are crucial. Against this background, some community-based and commercial health insurance schemes offer related benefits.
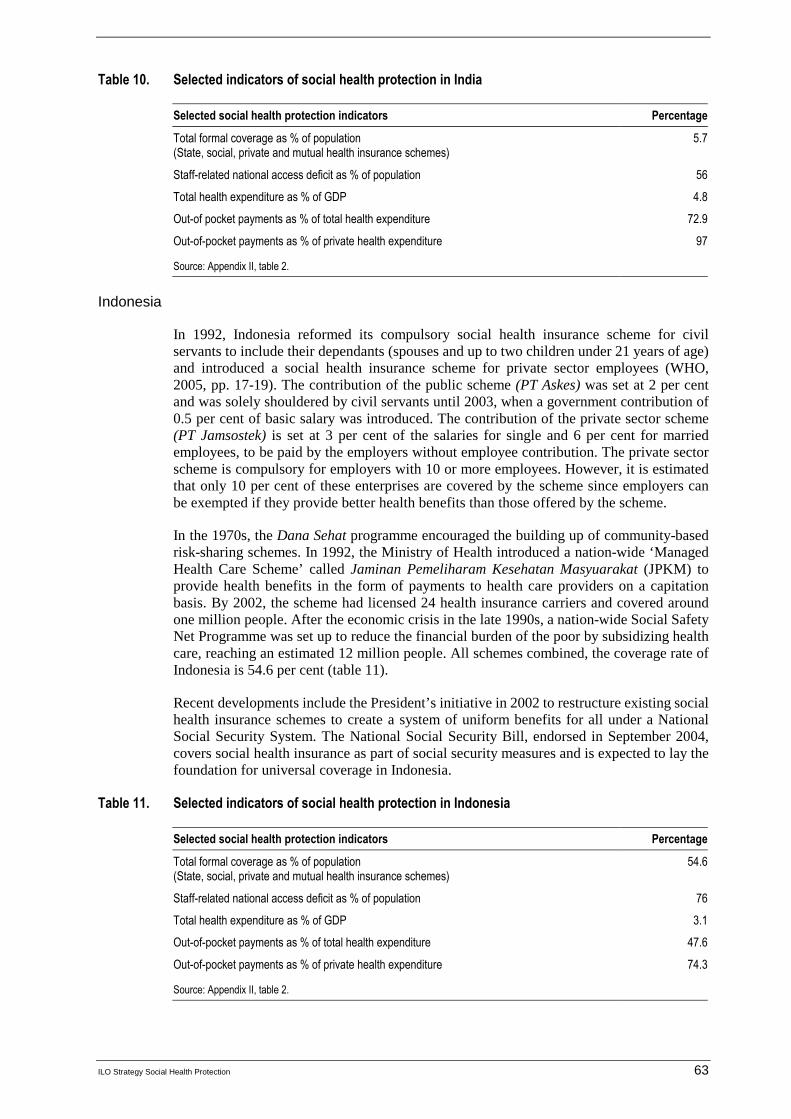
ILO Strategy Social Health Protection 63
Table 10. Selected indicators of social health protection in India
Selected social health protection indicators Percentage
Total formal coverage as % of population (State, social, private and mutual health insurance schemes)
5.7
Staff-related national access deficit as % of population 56
Total health expenditure as % of GDP 4.8
Out-of pocket payments as % of total health expenditure 72.9
Out-of-pocket payments as % of private health expenditure 97
Source: Appendix II, table 2.
Indonesia
In 1992, Indonesia reformed its compulsory social health insurance scheme for civil servants to include their dependants (spouses and up to two children under 21 years of age) and introduced a social health insurance scheme for private sector employees (WHO, 2005, pp. 17-19). The contribution of the public scheme (PT Askes) was set at 2 per cent and was solely shouldered by civil servants until 2003, when a government contribution of 0.5 per cent of basic salary was introduced. The contribution of the private sector scheme (PT Jamsostek) is set at 3 per cent of the salaries for single and 6 per cent for married employees, to be paid by the employers without employee contribution. The private sector scheme is compulsory for employers with 10 or more employees. However, it is estimated that only 10 per cent of these enterprises are covered by the scheme since employers can be exempted if they provide better health benefits than those offered by the scheme.
In the 1970s, the Dana Sehat programme encouraged the building up of community-based risk-sharing schemes. In 1992, the Ministry of Health introduced a nation-wide ‘Managed Health Care Scheme’ called Jaminan Pemeliharam Kesehatan Masyuarakat (JPKM) to provide health benefits in the form of payments to health care providers on a capitation basis. By 2002, the scheme had licensed 24 health insurance carriers and covered around one million people. After the economic crisis in the late 1990s, a nation-wide Social Safety Net Programme was set up to reduce the financial burden of the poor by subsidizing health care, reaching an estimated 12 million people. All schemes combined, the coverage rate of Indonesia is 54.6 per cent (table 11).
Recent developments include the President’s initiative in 2002 to restructure existing social health insurance schemes to create a system of uniform benefits for all under a National Social Security System. The National Social Security Bill, endorsed in September 2004, covers social health insurance as part of social security measures and is expected to lay the foundation for universal coverage in Indonesia.
Table 11. Selected indicators of social health protection in Indonesia
Selected social health protection indicators Percentage
Total formal coverage as % of population (State, social, private and mutual health insurance schemes)
54.6
Staff-related national access deficit as % of population 76
Total health expenditure as % of GDP 3.1
Out-of-pocket payments as % of total health expenditure 47.6
Out-of-pocket payments as % of private health expenditure 74.3
Source: Appendix II, table 2.
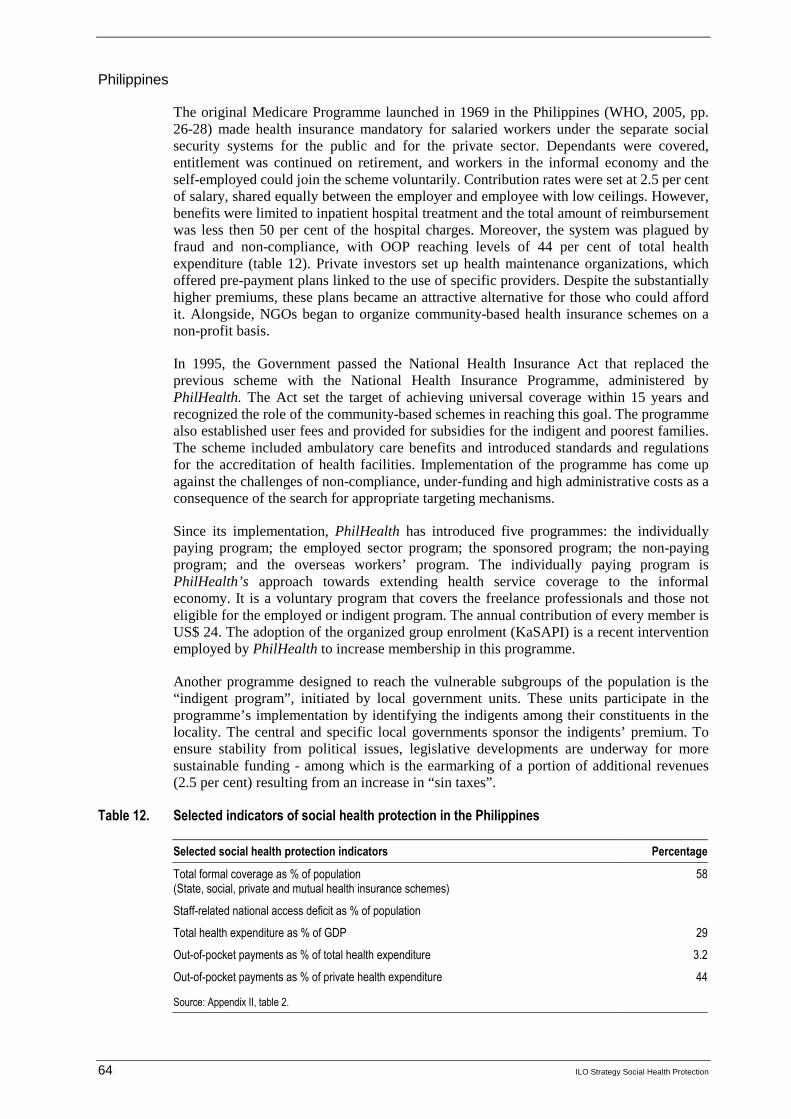
64 ILO Strategy Social Health Protection
Philippines
The original Medicare Programme launched in 1969 in the Philippines (WHO, 2005, pp. 26-28) made health insurance mandatory for salaried workers under the separate social security systems for the public and for the private sector. Dependants were covered, entitlement was continued on retirement, and workers in the informal economy and the self-employed could join the scheme voluntarily. Contribution rates were set at 2.5 per cent of salary, shared equally between the employer and employee with low ceilings. However, benefits were limited to inpatient hospital treatment and the total amount of reimbursement was less then 50 per cent of the hospital charges. Moreover, the system was plagued by fraud and non-compliance, with OOP reaching levels of 44 per cent of total health expenditure (table 12). Private investors set up health maintenance organizations, which offered pre-payment plans linked to the use of specific providers. Despite the substantially higher premiums, these plans became an attractive alternative for those who could afford it. Alongside, NGOs began to organize community-based health insurance schemes on a non-profit basis.
In 1995, the Government passed the National Health Insurance Act that replaced the previous scheme with the National Health Insurance Programme, administered by PhilHealth. The Act set the target of achieving universal coverage within 15 years and recognized the role of the community-based schemes in reaching this goal. The programme also established user fees and provided for subsidies for the indigent and poorest families. The scheme included ambulatory care benefits and introduced standards and regulations for the accreditation of health facilities. Implementation of the programme has come up against the challenges of non-compliance, under-funding and high administrative costs as a consequence of the search for appropriate targeting mechanisms.
Since its implementation, PhilHealth has introduced five programmes: the individually paying program; the employed sector program; the sponsored program; the non-paying program; and the overseas workers’ program. The individually paying program is PhilHealth’s approach towards extending health service coverage to the informal economy. It is a voluntary program that covers the freelance professionals and those not eligible for the employed or indigent program. The annual contribution of every member is US$ 24. The adoption of the organized group enrolment (KaSAPI) is a recent intervention employed by PhilHealth to increase membership in this programme.
Another programme designed to reach the vulnerable subgroups of the population is the “indigent program”, initiated by local government units. These units participate in the programme’s implementation by identifying the indigents among their constituents in the locality. The central and specific local governments sponsor the indigents’ premium. To ensure stability from political issues, legislative developments are underway for more sustainable funding - among which is the earmarking of a portion of additional revenues (2.5 per cent) resulting from an increase in “sin taxes”.
Table 12. Selected indicators of social health protection in the Philippines
Selected social health protection indicators Percentage
Total formal coverage as % of population (State, social, private and mutual health insurance schemes)
58
Staff-related national access deficit as % of population
Total health expenditure as % of GDP 29
Out-of-pocket payments as % of total health expenditure 3.2
Out-of-pocket payments as % of private health expenditure 44
Source: Appendix II, table 2.
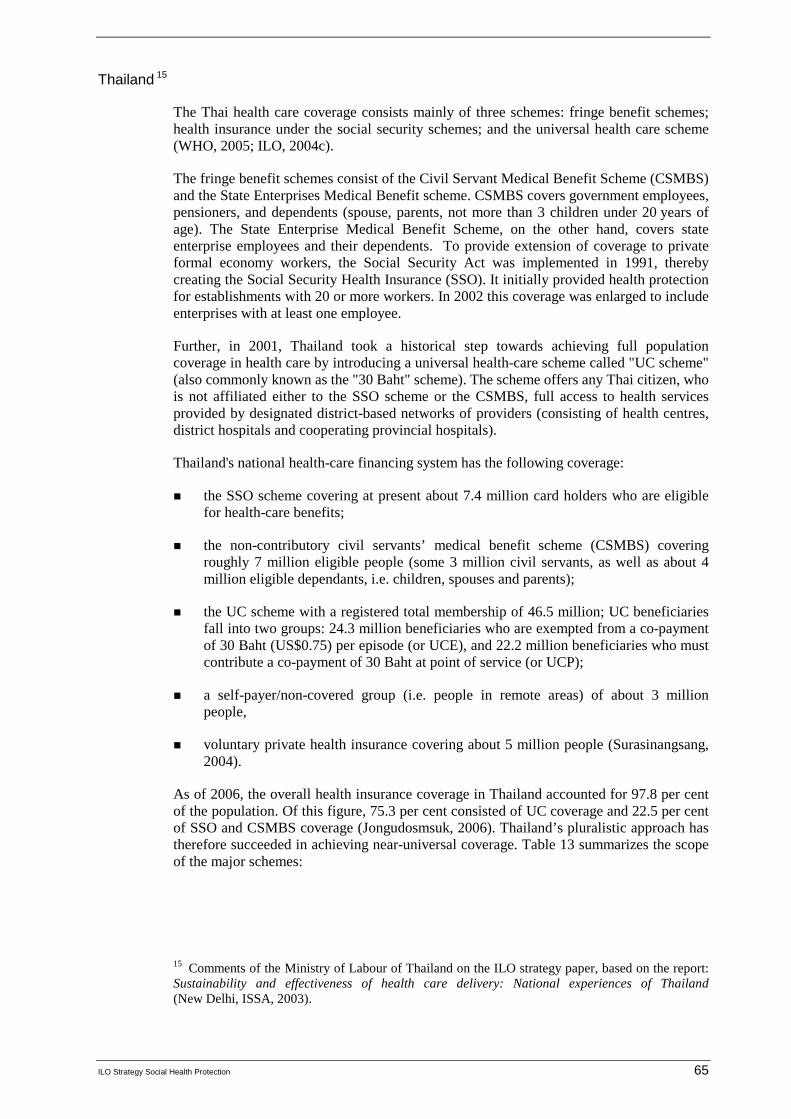
ILO Strategy Social Health Protection 65
Thailand 15
The Thai health care coverage consists mainly of three schemes: fringe benefit schemes; health insurance under the social security schemes; and the universal health care scheme (WHO, 2005; ILO, 2004c).
The fringe benefit schemes consist of the Civil Servant Medical Benefit Scheme (CSMBS) and the State Enterprises Medical Benefit scheme. CSMBS covers government employees, pensioners, and dependents (spouse, parents, not more than 3 children under 20 years of age). The State Enterprise Medical Benefit Scheme, on the other hand, covers state enterprise employees and their dependents. To provide extension of coverage to private formal economy workers, the Social Security Act was implemented in 1991, thereby creating the Social Security Health Insurance (SSO). It initially provided health protection for establishments with 20 or more workers. In 2002 this coverage was enlarged to include enterprises with at least one employee.
Further, in 2001, Thailand took a historical step towards achieving full population coverage in health care by introducing a universal health-care scheme called "UC scheme" (also commonly known as the "30 Baht" scheme). The scheme offers any Thai citizen, who is not affiliated either to the SSO scheme or the CSMBS, full access to health services provided by designated district-based networks of providers (consisting of health centres, district hospitals and cooperating provincial hospitals).
Thailand's national health-care financing system has the following coverage:
� the SSO scheme covering at present about 7.4 million card holders who are eligible for health-care benefits;
� the non-contributory civil servants’ medical benefit scheme (CSMBS) covering roughly 7 million eligible people (some 3 million civil servants, as well as about 4 million eligible dependants, i.e. children, spouses and parents);
� the UC scheme with a registered total membership of 46.5 million; UC beneficiaries fall into two groups: 24.3 million beneficiaries who are exempted from a co-payment of 30 Baht (US$0.75) per episode (or UCE), and 22.2 million beneficiaries who must contribute a co-payment of 30 Baht at point of service (or UCP);
� a self-payer/non-covered group (i.e. people in remote areas) of about 3 million people,
� voluntary private health insurance covering about 5 million people (Surasinangsang, 2004).
As of 2006, the overall health insurance coverage in Thailand accounted for 97.8 per cent of the population. Of this figure, 75.3 per cent consisted of UC coverage and 22.5 per cent of SSO and CSMBS coverage (Jongudosmsuk, 2006). Thailand’s pluralistic approach has therefore succeeded in achieving near-universal coverage. Table 13 summarizes the scope of the major schemes:
15 Comments of the Ministry of Labour of Thailand on the ILO strategy paper, based on the report:
Sustainability and effectiveness of health care delivery: National experiences of Thailand (New Delhi, ISSA, 2003).

66 ILO Strategy Social Health Protection
Table 13. Thailand’s social health protection mechanisms
Characteristics Social security scheme CSMBS UC/ 30- Baht scheme
Membership Private employees Government employees, public sector workers and their dependents
Self employed and those not covered by CSMBS and SSS
Type Compulsory and Contributory Fringe benefit Compulsory
Financing source Contribution for sickness, maternity, invalidity and death is 1.5% from employers, employees and the government. Total contribution is 4.5% of employee’s wages
For sickness benefits (in kind and in cash) the insured pays 3 months contribution within the last 15 months.
General taxes General taxes except for the patients’ co-payment of 30 Baht
Authority
Social Security Office Ministry of Finance National Health Security Office (NHSO)
Provider payment
mechanism
Capitation
Fee-for-service
Global budget and capitation
Benefits Includes: medical benefits for non-work related illness or injuries, maternity benefits, invalidity and death benefits
For sickness benefits, after paying the contribution, then will receive medical care free of charge at a registered hospital and cash benefit (50% of wages) for a maximum of 90 days each time and not more than 180 days each year.
Includes ambulatory and inpatient care at public hospitals with minimum co-payments, inpatient care at private hospitals with more than 50% co-payments, and reimbursement for medicine prescription in case of outpatient care.
Comprehensive package includes
Curative and rehabilitative care and health promotion and disease prevention benefits
Access to a provider Through a contracted hospital (public, university, military and private hospitals) or its network; with registration requirement; Member is free to choose a provider
Member is free to choose a provider
Through contracted units (primary care (CUP), subcontractors of CUP, secondary care (CUS) or tertiary care (CUT) and super tertiary care); with registration requirement
Focusing on the most recent scheme established, the UC/ 30 Baht scheme sets a specific legal entitlement for all people to access health services. This scheme virtually abolishes all financial barriers to access as co-payments are small and the needy are even exempted from them. That entitlement is backed up by a new allocation mechanism for public sector health-care resources, i.e. the capitation payment, which should ensure that all provider networks receive a fixed budget for each person to whom they provide care. In its present state the UC scheme is a variant of a national health service type of health-care financing

ILO Strategy Social Health Protection 67
system that combines insurance elements (through legal benefit entitlements) and public service elements (through general revenue financing).
In theory, the UC scheme at present enables more than 70 per cent of the population to have access to health care. The proportion of the population it caters to is likely to be smaller, as not all people eligible and/or holding UC cards actually take up the service. The 2003 Health and Welfare Survey conducted by the Thai National Statistical Office (NSO) showed that only about 57 per cent of registered members used the outpatient care services in public health centres and hospitals, and 81 per cent used the inpatient care services. Both services are offered by the scheme. The up-take rate varies greatly according to income groups and is significantly higher in the lower-income groups. It appears that about one-third of the population in higher-income groups tend to use the UC scheme as a fallback solution.
In terms of government spending on health care, it is obvious that the change to the UC system in 2001 has increased investment in health care. The actual amount is difficult to determine, as the counterfactual (i.e. government spending on health in the absence of the new UC scheme) is obviously unknown. But from the increase in the spending level between 2000 and 2003, it may be concluded that the additional cost of the scheme is in the order of 25 billion Baht per annum. That order of magnitude is confirmed by the International Health Policy Program (IHPP) estimates of the extent of household savings of out-of-pocket health expenditure. The amount was estimated at around 10-13 billion Baht for all households that were newly covered by the UC third-party arrangement. Due to the differential take-up rates by income strata, this is a substantial income transfer to the lower-income households and confirms the Ministry of Health’s assessment that the reform has had significant pro-poor effects.
The scheme did not have the earmarked resources upon which it could rely during the first years of existence and its resource base had to be renegotiated in an annual government budgeting process. From the point of view of long-term scheme sustainability, it was in the interest of the UC scheme to shrink as much as possible by conceding “market share” to the other two or three schemes. At the same time, it seemed logical to try and establish earmarked income sources that would be protected against annual budgetary competition. This was done in 2005, when a certain proportion of the taxes on tobacco and alcohol were earmarked for the financing of the UC scheme - thus helping to safeguard the resources for health care of the economically weakest sections of the population in times of fiscal difficulties. However, the financial situation of the UC schemes can only be stabilized in the long run if it constantly shrinks at the expense of other players. The most effective way to reduce government expenditure is through the extension of social security (SSO) coverage.
Table 14. Selected indicators of social health protection in Thailand
Selected social health protection indicators Percentage
Total formal coverage as % of population (State, social, private and mutual health insurance schemes)
97.7
Staff-related national access deficit as % of population -
Total health expenditure as % of GDP 3.3
Out-of-pocket payments as % of total health expenditure 28.7
Out-of-pocket payments as % of private health expenditure 74.8
Source: Appendix II, table 2.

68 ILO Strategy Social Health Protection
c. Europe
Country experiences covered in this region (Gamkrelidze, et.al., 2002; Nuri, 2002; Holley et al., 2004; Meimanaliev et al., 2005; Ahmedov et al., 2007) include Albania, Belarus and Georgia. Generally, countries that were under the influence of the Soviet Union at some point in their history inherited a highly centralized system on the lines of the Semashko model - characterized by government revenue financing mechanisms and almost complete public ownership. Planning, organization, control and resource allocation were undertaken in Moscow, leaving local authorities with administrative tasks according to pre-determined plans. In theory, health care was free but under-the-table-payments were very common. Hospitals dominated the delivery system with parallel systems under various ministries.
After the collapse of the Soviet Union, countries in the region embarked upon designing new health strategies and health system reforms. They differed in the extent to which they managed to contain costs and the degree to which they decentralized their health systems, with Georgia having decentralized the most and Belarus the least.
Out-of-pocket payments are widespread in the lower-income countries of the region and constitute a serious barrier to access health services. OOP as percentage of total health expenditure is as high as 74.4 per cent in Georgia and 58.2 per cent in Albania. Although many countries achieve legally universal coverage, e.g. through mandatory state medical insurance or tax-financed national health systems, effective access to health services remains a major challenge for many countries in the region.
Albania
Albania (Nuri, 2002) was also part of the Semashko system during its brief period under Soviet influence. It’s very centralized health system was continued even after its break with the Soviet Union. The Ministry of Health regulated, managed and organized the health sector, and provided all health services in every district until the early 1990s. Staff at the local level had no discretion to improve services - for instance by reallocating staff. Administrative reforms in 1993 introduced decentralization measures, shifting some authority to the 12 newly created prefectures, each of which comprised on average three districts. Responsibility for running and maintaining rural primary health care facilities has now largely devolved to the local governments.
A comprehensive health sector strategy has still to be implemented - but proposals for the strategy envisage a further restructuring of the central institutions. However, for the time being, the Ministry of Health remains the major funder and provider of health services in Albania, owning most health services and devoting most of its time to their administration rather than policy and planning.
Social health insurance, organized by the Health Insurance Institute (HII), was introduced in Albania in 1995 as a national statutory fund. Most of the unwaged (children, women who work at home and the elderly) were automatically covered by the state budget. By 1999, about 40 per cent of the active workforce were covered. Coverage remains low, especially in rural areas, because people are poorly informed about the scheme, are unable to pay the contribution and enrolment does not seem to confer any advantage; the scheme covers limited services and doctors treat all patients without discrimination, although benefits are legally limited to members of the scheme.
Contribution rates are set at 3.5 per cent of wages, split equally between employers and employees. The self-employed contribute between 3 per cent and 7 per cent of their incomes, depending on whether they live in rural or urban areas. Lower rates have been set for private farmers, amongst whom the coverage rate remains particularly low (4 per cent).
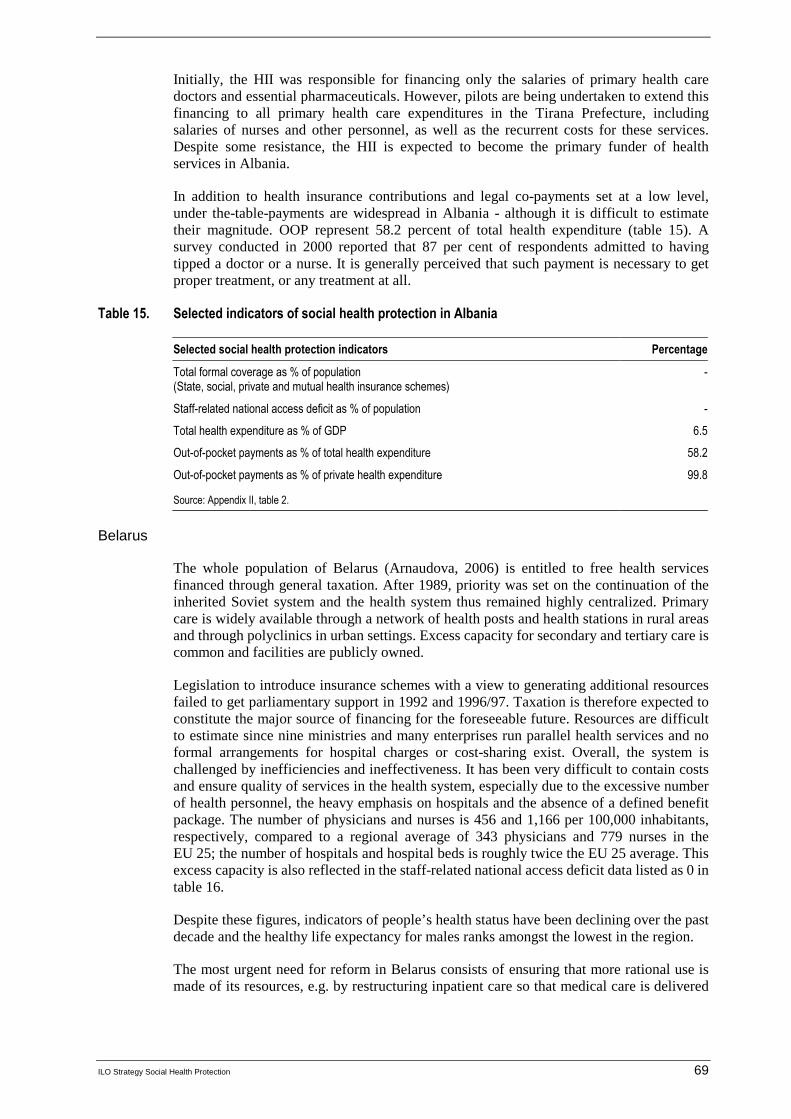
ILO Strategy Social Health Protection 69
Initially, the HII was responsible for financing only the salaries of primary health care doctors and essential pharmaceuticals. However, pilots are being undertaken to extend this financing to all primary health care expenditures in the Tirana Prefecture, including salaries of nurses and other personnel, as well as the recurrent costs for these services. Despite some resistance, the HII is expected to become the primary funder of health services in Albania.
In addition to health insurance contributions and legal co-payments set at a low level, under the-table-payments are widespread in Albania - although it is difficult to estimate their magnitude. OOP represent 58.2 percent of total health expenditure (table 15). A survey conducted in 2000 reported that 87 per cent of respondents admitted to having tipped a doctor or a nurse. It is generally perceived that such payment is necessary to get proper treatment, or any treatment at all.
Table 15. Selected indicators of social health protection in Albania
Selected social health protection indicators Percentage
Total formal coverage as % of population (State, social, private and mutual health insurance schemes)
-
Staff-related national access deficit as % of population -
Total health expenditure as % of GDP 6.5
Out-of-pocket payments as % of total health expenditure 58.2
Out-of-pocket payments as % of private health expenditure 99.8
Source: Appendix II, table 2.
Belarus
The whole population of Belarus (Arnaudova, 2006) is entitled to free health services financed through general taxation. After 1989, priority was set on the continuation of the inherited Soviet system and the health system thus remained highly centralized. Primary care is widely available through a network of health posts and health stations in rural areas and through polyclinics in urban settings. Excess capacity for secondary and tertiary care is common and facilities are publicly owned.
Legislation to introduce insurance schemes with a view to generating additional resources failed to get parliamentary support in 1992 and 1996/97. Taxation is therefore expected to constitute the major source of financing for the foreseeable future. Resources are difficult to estimate since nine ministries and many enterprises run parallel health services and no formal arrangements for hospital charges or cost-sharing exist. Overall, the system is challenged by inefficiencies and ineffectiveness. It has been very difficult to contain costs and ensure quality of services in the health system, especially due to the excessive number of health personnel, the heavy emphasis on hospitals and the absence of a defined benefit package. The number of physicians and nurses is 456 and 1,166 per 100,000 inhabitants, respectively, compared to a regional average of 343 physicians and 779 nurses in the EU 25; the number of hospitals and hospital beds is roughly twice the EU 25 average. This excess capacity is also reflected in the staff-related national access deficit data listed as 0 in table 16.
Despite these figures, indicators of people’s health status have been declining over the past decade and the healthy life expectancy for males ranks amongst the lowest in the region.
The most urgent need for reform in Belarus consists of ensuring that more rational use is made of its resources, e.g. by restructuring inpatient care so that medical care is delivered

70 ILO Strategy Social Health Protection
at the appropriate level and by better coordinating the different government bodies and institutions active in the health sector.
Table 16. Selected indicators of social health protection in Belarus
Selected social health protection indicators Percentage
Total formal coverage as % of population (State, social, private and mutual health insurance schemes)
100
Staff-related national access deficit as % of population 0
Total health expenditure as % of GDP 3.6
Out-of-pocket payments as % of total health expenditure 23.2
Out-of-pocket payments as % of private health expenditure 96.8
Source: Appendix II, table 2.
Georgia
In 1995, the Government of Georgia initiated a health policy reform plan and established the State Committee for Regulating Social Policy for its implementation (Gamkrelidze, 2002). The Committee, made up of representatives from different sectors of government and business, reports to the President and guides the Ministry of Labour, Health and Social Affairs (MoLHSA). The Government also decided to hand much of its decision-making power, as well as responsibility for funding, over to 12 Regional Health Departments (RHDs). The RHDs report to the MoLHSA and monitor local activities. The decentralization process also made most health care providers financially and managerially autonomous from MoLHSA control. In addition, a large number of polyclinics, hospitals, dental clinics and pharmacies have been privatized. In 2000, MoLHSA developed a long-term strategic plan (2000-09), which reiterated decentralization as a key element of the reform process to improve responsiveness and efficiency.
The 1997 Law on Medical Insurance introduced a state compulsory medical insurance programme and set up the State Medical Insurance Company (SMIC) to run it. Private health insurance companies (seven companies existed in 2001) offer insurance that is supplementary to the compulsory state insurance to cover extra costs. The SMIC has 12 regional branches in addition to its headquarters in the capital. It is publicly owned and collects mandatory premiums from the population (1 per cent of salary) and employers (3 per cent of salary) to finance the Basic Benefit Package (BBP) through contracts with health care providers. By 1999, nearly 700 health care providers were carrying out work on 1,300 contracts.
The BBP initially consisted of nine federal (state) and five compulsory municipal health programmes but has gradually expanded to 28 federal and 8 municipal programmes. This expansion has not, however, been accompanied by a corresponding increase in funding; in fact government expenditure on health as a percentage of GDP declined dramatically throughout the 1990s. While the programmes outlined under the BBP appear to be wide-ranging, their content is fairly limited. Services included under the state BBP are free-of-charge. Co-payments have been formalized for the municipal programmes provided under the BBP. Direct fees-for-service must be paid for all other health services at set rates. OOP amounts to 74.7 per cent of total health expenditure (table 17). A large number of people (estimated at up to 30 per cent of the population) are deterred from seeking medical services due to the high level of out-of-pocket payments charged. Others delay their visits to health care providers. Nearly 22 per cent of individuals with health problems do not see a health provider because of their inability to pay.

ILO Strategy Social Health Protection 71
Table 17. Selected indicators of social health protection in Georgia
Selected social health protection indicators Percentage
Total formal coverage as % of population (State, social, private and mutual health insurance schemes)
55
Staff-related national access deficit as % of population -
Total health expenditure as % of GDP 4.0
Out-of-pocket payments as % of total health expenditure 74.7
Out-of-pocket payments as % of private health expenditure 98.2
Source: Appendix II, table 2.
d. Latin America
During the late 1990s and early 2000s, many countries in the Latin American region embarked upon a major reform of their public sector in general and the health sector in particular. Some of these reforms were motivated by achieving the MDGs, and some inspired by the Chilean experimentation with privatizing public services - especially with respect to old-age security and health. The case studies presented here describe the situation of a number of countries that are comparatively well off in the region, like Chile and Costa Rica, and poorer countries such as Ecuador and Colombia. The comparison shows that Chile and Costa Rica are achieving better outcomes, reaching almost universal coverage and keeping OOP relatively low at around 20 per cent. Ecuador and Peru are in the process of extending coverage, scoring above 70 per cent; but in Colombia, coverage at 31.1 per cent is quite low for the region. However, high OOP, especially in the case of Ecuador (54.1 per cent), indicate that barriers to access remain high, especially for the poor. Given Chile’s overall economic performance, its staff-related access deficit of 46 per cent is rather high compared to the other countries in the region (figure A.4).
Figure A.4. Comparison of selected countries in Latin America
0102030405060708090
100
Chile
Colom
bia
Costa
Rica
Ecuad
orPer
u
Per
cen
tag
e
Total Formal Coverage%
Staff related nationalaccess deficit %
Out of pocket paymentas % of total healthexpenditure
Chile
In 1981, Chile's health-care system (Holst et al, 2004) drew widespread attention because it became one of the first market-oriented models to introduce private health insurance funds aimed at achieving efficiency gains and overcoming bottlenecks in provision and funding. Twenty-five years later, the coexistence of public social health insurance and several for-

72 ILO Strategy Social Health Protection
profit private health insurance companies assures universal coverage (96 per cent, see table 18). However, the Chilean health system still faces shortcomings in terms of equity and fair financing and is challenged by risk selection. The staff-related access deficit of 46 per cent is comparatively high.
The National Health Fund (FONASA) currently covers two out of three Chileans, including 3 million people considered to be very poor.
Chile has achieved universal health protection coverage by combining, in a single-payer system, a Bismarck-type contribution system with a tax-financed health system covering the poor.
� Employees in the formal sector and some self-employed pay income-related contributions for a comprehensive benefit package. Indigents are covered by the public health insurance fund, FONSAS, which receives substantial subsidies for this purpose from general taxation.
� Exempted enrolees are not entitled to claim for private health services as other beneficiaries may do for paying high co-payments. However, as affiliation to FONASA is free-of-charge, they are protected from discrimination and stigmatization when receiving health care at public providers.
Table 18. Selected indicators of social health protection in Chile
Selected social health protection indicators Percentage
Total formal coverage as % of population (State, social, private and mutual health insurance schemes)
96
Staff-related national access deficit as % of population 46
Total health expenditure as % of GDP 6.1
Out-of-pocket payments as % of total health expenditure 23.7
Out-of-pocket payments as % of private health expenditure 46.2
Source: Appendix II, table 2.
Colombia
Before the Colombian health sector reform of 1993 (Castano and Zambrano, 2005), employment-based social health insurance schemes covered about one-third of the population. Formal sector workers were compulsorily enrolled in closed pools and paid mandatory contributions. While the largest fund, the Instituto de Seguridad Social (ISS), covered private sector workers, public sector workers were enrolled in funds restricted to state-owned enterprises, public universities or government units. Besides two large public sector funds (Cajanal, for central government employees, and Caprecom, for workers in the state-owned telecommunications, television and postal enterprises), the overall risk pool was divided into more than a thousand small-scale insurance schemes.
The 1993 reform was inspired by the fundamental changes that Chile had applied to its health system 12 years earlier. However, Colombians tried to avoid the obvious undesired effects that were becoming more and more evident in Chile. By creating a contributory system for all formal sector workers and employees, the previously existing monopolistic funds were exposed to a sort of managed competition, since new insurance companies were allowed to enter the market and citizens had the right to choose their insurer according to their own preference. Financing was based on mandatory payroll contributions of 12 per cent of the salary (employer 8 per cent, employee 4 per cent).

ILO Strategy Social Health Protection 73
In order to avoid market failure and inefficient competitive behaviour by health insurers (most of them were private, and some for-profit), Colombians tried to implement effective regulation. In order to prevent competition on prices, contributions within the contributory scheme were pooled in a single equalization fund, which then allocated insurers a risk-adjusted community-rated premium for each enrolee defined by age, gender and geographic location (urban/rural). Thus, enrolees paid according to their ability to pay, but insurers receive contributions according to the individual risk of the insured persons. Furthermore, a standardized benefit package defining covered/excluded services and qualifying periods for full coverage and co-payment rates was established; insurers are now mandated to contract all applicants; enrolment is compulsory for all registered workers; and full portability of benefits is guaranteed.
With regard to the challenge of extending social health protection beyond formal sector employees and workers, the creation of a subsidized system alongside the contributory scheme is especially worth mentioning. Citizens lacking financial means to pay contributions are required to register with the Administrator of the Subsidized System (ARS). However, the number of poor and indigent people affiliated to the subsidized scheme still remains below expectations, as does the overall coverage rate of 31.3 per cent (table 19).
To improve the targeting of the needy and the poor, Colombia has developed a Beneficiary Identification System (SISBEN) based on comprehensive questionnaires and individual contacts by social workers. Entitlement to the subsidized system is conditioned on an adequate SISBEN qualification. Financing of the subsidized scheme relies on tax revenue and on the solidarity contribution of the better off who pay 13 per cent instead of 12 per cent for health insurance - the additional 1 per cent contribution being designated to subsidize the poor. The benefit package covered by the solidarity scheme is more limited than the comprehensive one of the contributory system; the main advantage for its beneficiaries lies in co-payment exemptions at public health-care providers.
Table 19. Selected indicators of social health protection in Colombia
Selected social health protection indicators Percentage
Total formal coverage as % of population (State, social, private and mutual health insurance schemes)
31.3
Staff-related national access deficit as % of population 40
Total health expenditure as % of GDP 2.0
Out-of-pocket payments as % of total health expenditure 35.8
Out-of-pocket payments as % of private health expenditure 100
Source: Appendix II, table 2.
Costa Rica
The health sector in Costa Rica (Weber and Normand, 2007) is mainly funded by social insurance, with preventive services provided by the Ministry of Health. The Costa Rican Social Security Fund (CCSS) was created in the early 1940s to administer the social security insurance system. The system has been very successful in improving the health status of the population. Costa Rica's health indicators resemble those of Europe, the United States and Canada, rather than those generally exhibited by countries with similar per capita incomes (US$1,750). Population coverage has expanded and access to CCSS health services is now more or less universal, while out-of-pocket payments are at a relatively low level of 18.8 per cent of total health expenditure (table 20).

74 ILO Strategy Social Health Protection
The Ministry of Health (17 per cent of total expenditure in 1990) oversees health promotion, disease prevention and environmental health. The CCSS (80 per cent of total expenditure) provides curative and rehabilitative care, individual preventive services (e.g. immunization) and some educational services. The National Insurance Institute (INS) covers the treatment, rehabilitation and compensation of policyholders for occupational illnesses and injuries, as well as automobile-related injuries.
The CCSS owns and operates all of the country's 29 hospitals, providing 95 per cent of hospital services and around 70 per cent of all consultations. Except for three private clinics, virtually all health facilities are operated by the CCSS, the Ministry of Health or the INS, and belong to the national health system. While the quality of care for inpatient services is considered to be quite high, dissatisfaction with the quality of care provided in ambulatory settings is increasing.
Health-care providers in the Ministry of Health and CCSS mainly receive a salary, although the CCSS has been experimenting with other options, including the Company Medicine Scheme (where a company pays the physician's salary and provides a clinic for employees) and capitation payments to physicians or cooperative clinics.
Table 20. Selected indicators of social health protection in Costa Rica
Selected social health protection indicators Percentage
Total formal coverage as % of population (State, social, private and mutual health insurance schemes)
100
Staff-related national access deficit as % of population 29
Total health expenditure as % of GDP 7.3
Out-of-pocket payments as % of total health expenditure 18.8
Out-of-pocket payments as % of private health expenditure 88.7
Source: Appendix II, table 2.
Ecuador
The constitution of Ecuador recognizes health as a right that must be guaranteed, promoted and protected through permanent access to health services by people in need (Panamerican Health Organization, 2007, pp. 304-321). Moreover, the national health policy is based on the principles of equity, universality, solidarity, quality, plurality, efficiency, ethics and comprehensiveness. The National Health System Law of 2002 aspires to put these principles into practice through specific laws such as: the Free Maternity and Health Care Act (in force since 1994); the Law on Patient Rights and Protection; the Law on HIV/Aids Prevention and Comprehensive Care; and the Law on Food and Nutritional Safety.
In line with the country’s decentralization process, the health service is divided up into national, provincial and cantonal levels with corresponding councils at all levels. The National Health System Law expressly mentions social and community participation for the implementation and development of the councils, and recognizes all existing neighbourhood and community organizations.
A variety of health protection programmes cater to different sectors and societal groups, resulting in an overall coverage of 73 per cent of the population (table 21):
— The Ecuadorian Social Security Institute is geared towards providing coverage to workers in the public and private sector which account for about 10 per cent of the population.
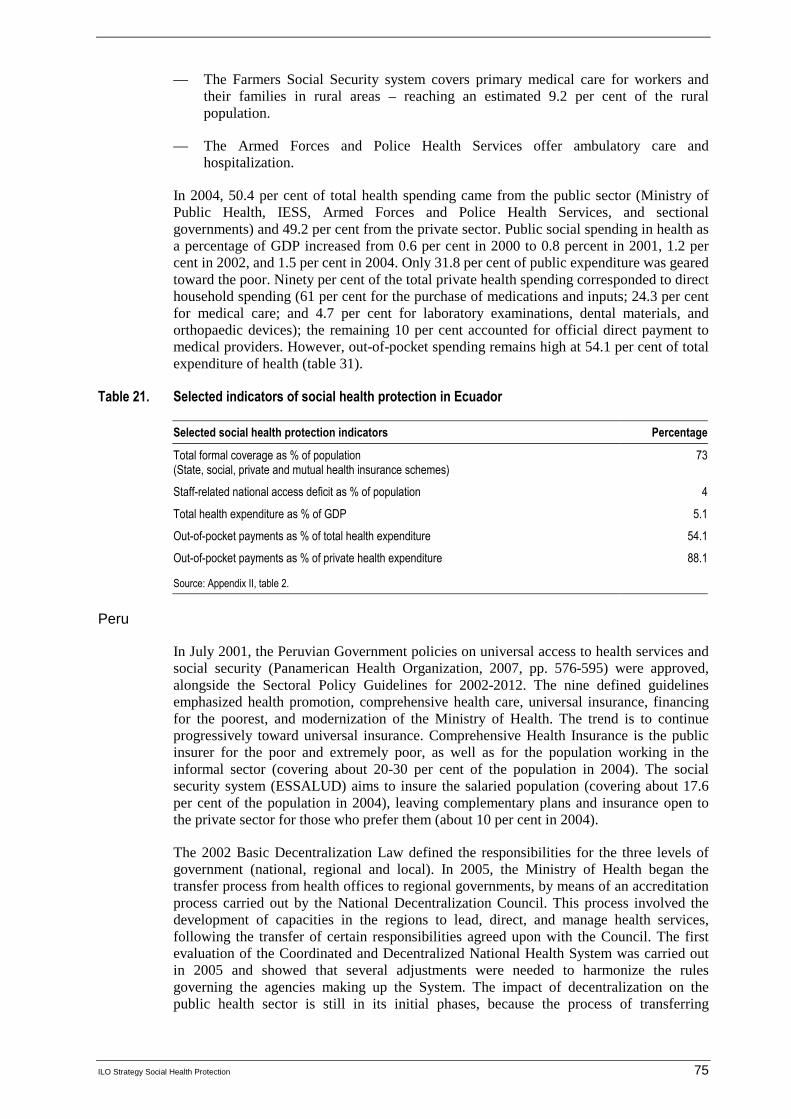
ILO Strategy Social Health Protection 75
— The Farmers Social Security system covers primary medical care for workers and their families in rural areas – reaching an estimated 9.2 per cent of the rural population.
— The Armed Forces and Police Health Services offer ambulatory care and hospitalization.
In 2004, 50.4 per cent of total health spending came from the public sector (Ministry of Public Health, IESS, Armed Forces and Police Health Services, and sectional governments) and 49.2 per cent from the private sector. Public social spending in health as a percentage of GDP increased from 0.6 per cent in 2000 to 0.8 percent in 2001, 1.2 per cent in 2002, and 1.5 per cent in 2004. Only 31.8 per cent of public expenditure was geared toward the poor. Ninety per cent of the total private health spending corresponded to direct household spending (61 per cent for the purchase of medications and inputs; 24.3 per cent for medical care; and 4.7 per cent for laboratory examinations, dental materials, and orthopaedic devices); the remaining 10 per cent accounted for official direct payment to medical providers. However, out-of-pocket spending remains high at 54.1 per cent of total expenditure of health (table 31).
Table 21. Selected indicators of social health protection in Ecuador
Selected social health protection indicators Percentage
Total formal coverage as % of population (State, social, private and mutual health insurance schemes)
73
Staff-related national access deficit as % of population 4
Total health expenditure as % of GDP 5.1
Out-of-pocket payments as % of total health expenditure 54.1
Out-of-pocket payments as % of private health expenditure 88.1
Source: Appendix II, table 2.
Peru
In July 2001, the Peruvian Government policies on universal access to health services and social security (Panamerican Health Organization, 2007, pp. 576-595) were approved, alongside the Sectoral Policy Guidelines for 2002-2012. The nine defined guidelines emphasized health promotion, comprehensive health care, universal insurance, financing for the poorest, and modernization of the Ministry of Health. The trend is to continue progressively toward universal insurance. Comprehensive Health Insurance is the public insurer for the poor and extremely poor, as well as for the population working in the informal sector (covering about 20-30 per cent of the population in 2004). The social security system (ESSALUD) aims to insure the salaried population (covering about 17.6 per cent of the population in 2004), leaving complementary plans and insurance open to the private sector for those who prefer them (about 10 per cent in 2004).
The 2002 Basic Decentralization Law defined the responsibilities for the three levels of government (national, regional and local). In 2005, the Ministry of Health began the transfer process from health offices to regional governments, by means of an accreditation process carried out by the National Decentralization Council. This process involved the development of capacities in the regions to lead, direct, and manage health services, following the transfer of certain responsibilities agreed upon with the Council. The first evaluation of the Coordinated and Decentralized National Health System was carried out in 2005 and showed that several adjustments were needed to harmonize the rules governing the agencies making up the System. The impact of decentralization on the public health sector is still in its initial phases, because the process of transferring

76 ILO Strategy Social Health Protection
functions, competencies, responsibilities, and resources is gradual and taking place by stages, depending also upon the areas involved. Overall, Peru’s health system is segmented and has various actors in both services provision and public insurance, which carry out different but not necessarily complementary functions and with high degrees of overlap. This situation could become more marked with the decentralization of the Peruvian Government.
The Peruvian health system suffers severe access deficits, especially due to lack of payment capacities; 32.1 per cent of the poor with symptoms of disease or who have been involved in accidents do not seek medical treatment for economic reasons. As a strategy to improve access for the poor, the above-mentioned comprehensive health insurance, created in 2001, covers those under 18 years of age, pregnant women, and certain groups of adults living in poverty. According to different estimates, the programme reaches between 20-30 per cent of the population and has thus improved the population’s access to health services - even though 40 per cent of the population is still excluded from health services in some way. This is mainly due to poverty, living in a rural area, and social and ethnic discrimination; problems intrinsic to the health system are also important factors, including the inadequate provision of essential services in the poorest areas. To address some of these problems and provide care to the poor and dispersed populations living in the most distant rural areas of the mountains and Amazonia, the regional governments and the Ministry of Health have organized mobile care units, supported by the comprehensive health insurance; these units provide care at regular intervals to this population and offer a package of basic or essential services They also organize promotional and community organization actions. This service covers approximately 200,000 people.
Based on the data, Peru allocates 4.4 per cent of its GDP to health, with almost 41 per cent of this value attributed to out-of-pocket expenditures. Seventy-one per cent of its population is covered by social health protection. As for the staff-related deficit, this amounts to 42 per cent (table 22).
Table 22. Selected indicators of social health protection in Peru
Selected social health protection indicators Percentage
Total formal coverage as % of population (State, social, private and mutual health insurance schemes)
71
Staff-related national access deficit as % of population 42
Total health expenditure as % of GDP 4.4
Out-of-pocket payments as % of total health expenditure 40.8
Out-of-pocket payments as % of private health expenditure 79
Source: Appendix II, table 2.

ILO S
trategy Social H
ealth Protection
77
Appendix II
Estimated access deficit and formal coverage in social health protection
Table A2.1. Estimated access deficit in social health protection
Population GDP 1 Estimated access deficit
Country Total (2003) 4
Urbanpopulation(%) (2004) 5
Total(in billion
US$)
Per capita
Human Development
Index 2
Human poverty Index
3
Gini-Index
Staff-related national access deficit
(% of population)
Estimate of accessdeficit (skilled
attended births)
Albania 3 45 6 1 740 0.78 28 - 6
Algeria 32 63 60 1 890 0.73 22 35 - 8
Angola 14 53 10 740 0.44 41 62 53
Argentina 38 90 140 3 650 0.86 4 52 - 1
Armenia 3 64 3 950 0.77 38 - 3
Australia 20 88 0 431 21 650 0.96 13 35 - 1
Austria 8 66 215 26 720 0.94 30 - -
Azerbaijan 8 52 7 810 0.74 37 - 16
Bangladesh 141 25 55 400 0.53 44 32 88 87
Belarus 10 72 16 1 590 0.79 30 - -
Belgium 10 97 267 25 820 0.95 12 25 - -
Benin 7 40 3 440 0.43 48 72 34
Bolivia 9 64 8 890 0.69 14 45 - 39
Bosnia and Herzegovina 4 45 6 1 540 0.80 26 - -
Botswana 2 57 6 3 430 0.57 48 63 4 6
Brazil 179 84 479 2 710 0.79 10 59 - 50
Bulgaria 8 70 17 2 130 0.82 32 - 1
Burkina Faso 12 18 4 300 0.34 58 48 85 43
Burundi 7 10 1 100 0.38 41 33 93 75

78 ILO
Strategy S
ocial Health P
rotection
Population GDP 1 Estimated access deficit
Country Total (2003) 4
Urbanpopulation(%) (2004) 5
Total(in billion
US$)
Per capita
Human Development
Index 2
Human poverty Index
3
Gini-Index
Staff-related national access deficit
(% of population)
Estimate of accessdeficit (skilled
attended births)
Cambodia 14 19 4 310 0.58 39 40 76 68
Cameroon 16 54 10 640 0.51 36 45 44 38
Canada 32 80 757 23 930 0.95 11 33 - 2
Cape Verde 57 0.72 19 57 11
Central African Republic 4 38 1 260 0.35 48 61 88 56
Chad 9 25 2 250 0.37 58 90 86
Chile 16 87 69 4 390 0.86 4 57 46 -
China 1 297 40 1 417 1 100 0.77 12 45 34 17
Colombia 45 72 80 1 810 0.79 8 58 40 9
Congo 4 60 2 640 0.52 28 64 64
Costa Rica 4 61 17 4 280 0.84 4 47 29 2
Côte d’lvoire 17 45 11 660 0.42 42 45 77 37
Croatia 5 56 2 5 350 0.85 29 - -
Cuba 10 76 0.83 5 - -
Czech Republic 10 74 69 6 740 0.89 25 - -
Dem. Rep. of the Congo 55 32 5 100 0.39 41 80 39
Denmark 5 86 182 33 750 0.94 8 25 - -
Dominican Republic 9 66 18 2 070 0.75 12 47 - 1
Ecuador 13 62 23 1 790 0.77 9 44 4 31
Egypt 69 43 94 1 390 0.70 20 34 19 31
El Salvador 7 60 14 2 200 0.73 16 53 36 31
Eritrea 5 1 190 0.45 38 80 72
Estonia 1 69 7 4 960 0.86 37 - -
Ethiopia 70 16 6 90 0.37 55 30 93 94
Finland 5 61 141 27 020 0.95 8 27 - -

ILO S
trategy Social H
ealth Protection
79
Population GDP 1 Estimated access deficit
Country Total (2003) 4
Urbanpopulation(%) (2004) 5
Total(in billion
US$)
Per capita
Human Development
Index 2
Human poverty Index
3
Gini-Index
Staff-related national access deficit
(% of population)
Estimate of accessdeficit (skilled
attended births)
France 60 77 1 523 24 770 0.94 11 33 - -
Gabon 1 83 4 2 739 0.63 27 - 14
Gambia 1.5 53 12 8 0.48 45 59 45
Georgia 5 53 4 830 0.74 37 - 4
Germany 83 75 2 085 25 250 0.93 10 28 - -
Ghana 21 47 7 320 0.53 33 30 66 53
Greece 11 59 147 13 720 0.92 35 - -
Guatemala 13 47 23 1 910 0.67 23 48 - 59
Guinea 8 33 3 430 0.45 52 40 79 65
Guinea-Bissau 1.5 30 12 960 0.35 48 75 65
Haiti 9 38 3 380 0.48 39 89 76
Honduras 7 46 7 970 0.68 17 55 42 44
Hungary 10 66 64 6 330 0.87 24 - -
Iceland 0.3 93 858 2 932 0.96 - -
India 1 080 29 568 530 0.61 31 33 56 57
Indonesia 218 47 173 810 0.71 19 34 76 34
Iran, Islamic Republic 67 66 133 2 000 0.75 16 43 45 10
Ireland 4 60 106 26 960 0.96 16 36 - -
Israel 7 92 105 16 020 0.93 36 - -
Italy 58 68 1 243 21 560 0.94 36 - -
Jamaica 3 53 7 2 760 0.72 15 38 22 5
Japan 128 66 4 390 34 510 0.95 12 25 - -
Jordan 5 82 10 1 850 0.76 36 - -
Kazakhstan 15 57 27 1 780 0.77 31 - 1
Kenya 32 21 13 390 0.49 36 45 60 58

80 ILO
Strategy S
ocial Health P
rotection
Population GDP 1 Estimated access deficit
Country Total (2003) 4
Urbanpopulation(%) (2004) 5
Total(in billion
US$)
Per capita
Human Development
Index 2
Human poverty Index
3
Gini-Index
Staff-related national access deficit
(% of population)
Estimate of accessdeficit (skilled
attended births)
Korea, Republic of 48 81 576 12 020 0.91 32 - -
Kuwait 3 98 38 16 340 0.87 - -
Kyrgyzstan 5 36 2 330 0.71 29 - 2
Lao People’s Dem. Rep. 6 20 2 320 0.55 36 37 49 81
Latvia 2 68 9 4 070 0.85 32 - -
Lebanon 5 87 18 4 040 0.77 10 - 7
Lesotho 2 19 1 590 0.49 48 63 79 45
Lithuania 3 67 16 4 490 0.86 32 - -
Luxembourg 1 83 25 664 56 780 0.95 11 - -
Madagascar 17 27 5 290 0.51 36 48 81 49
Malawi 11 17 2 170 0.40 43 50 81 39
Malaysia 25 66 94 3 780 0.81 8 49 35 3
Mali 12 30 3 290 0.34 60 51 82 59
Mauritania 3 40 1 430 0.49 41 39 77 43
Mexico 104 76 637 6 230 0.82 7 55 10 14
Moldova, Republic of 4 47 2 590 0.69 36 - 1
Mongolia 3 57 1 480 0.69 19 44 - 1
Morocco 31 58 40 1 320 0.64 33 40 59 37
Mozambique 19 34 4 210 0.39 49 40 93 52
Myanmar 54.3 6 30 13.8 7 270 0.58 22 77 44
Namibia 2 35 4 1 870 0.63 33 71 - 24
Nepal 25 15 6 240 0.53 38 37 87 89
Netherlands 16 80 427 26 310 0.95 8 33 - -
New Zealand 4 86 64 15 870 0.94 36 - -
Nicaragua 6 59 4 730 0.70 18 55 55 33

ILO S
trategy Social H
ealth Protection
81
Population GDP 1 Estimated access deficit
Country Total (2003) 4
Urbanpopulation(%) (2004) 5
Total(in billion
US$)
Per capita
Human Development
Index 2
Human poverty Index
3
Gini-Index
Staff-related national access deficit
(% of population)
Estimate of accessdeficit (skilled
attended births)
Niger 12 17 2 200 0.31 56 51 92 84
Nigeria 140 47 43 320 0.45 41 51 38 65
Norway 5 77 198 43 350 0.97 7 26 - -
Oman 3 72 0.81 - 5
Pakistan 152 35 69 470 0.54 36 33 62 77
Panama 3 70 13 4 250 0.81 8 56 4 7
Papua New Guinea 6 13 3 510 0.52 41 51 82 82
Paraguay 6 58 6 1 100 0.76 8 57 12 23
Peru 28 72 58 2 150 0.77 12 50 42 29
Philippines 83 62 88 1 080 0.76 15 46 29 40
Poland 38 62 201 5 270 0.86 32 - -
Portugal 10 57 124 12 130 0.90 39 - -
Romania 22 54 51 2 310 0.81 30 - 2
Russian Federation 143 73 375 2 610 0.80 46 - 1
Rwanda 8 19 2 220 0.45 37 29 85 69
Saudi Arabia 23 81 187 8 530 0.78 - 7
Senegal 11 41 6 550 0.46 44 41 88 42
Serbia and Montenegro 8 16 1 910 - 7
Sierra Leone 5 40 1 150 0 52 63 88 58
Singapore 4 100 90 21 230 1 43 - -
Slovakia 5 56 26 4 920 1 26 - 1
Slovenia 2 51 23 11 830 1 28 - -
South Africa 46 59 126 2 780 1 31 59 - 16
Spain 41 77 698 16 990 1 13 33 - -
Sri Lanka 19 15 18 930 1 18 34 33 3

82 ILO
Strategy S
ocial Health P
rotection
Population GDP 1 Estimated access deficit
Country Total (2003) 4
Urbanpopulation(%) (2004) 5
Total(in billion
US$)
Per capita
Human Development
Index 2
Human poverty Index
3
Gini-Index
Staff-related national access deficit
(% of population)
Estimate of accessdeficit (skilled
attended births)
Sweden 9 84 258 28 840 1 7 25 - -
Switzerland 7 75 293 39 880 1 11 33 - -
Syrian Arab Republic 18 51 20 1 160 1 14 - 30
Tajikistan 6 25 1 190 1 35 - 29
Tanzania, United Rep. of 37 24 10 290 0 36 38 88 54
Thailand 64 32 136 2 190 1 9 43 - 1
The FYR of Macedonia 2 68 4 1 980 0.80 28 - 2
Togo 5 39 1 310 0 39 85 51
Tunisia 10 65 22 2 240 1 18 40 - 10
Turkey 72 67 197 2 790 1 10 40 4 17
Turkmenistan 5 46 5 1 120 1 41 - 3
Uganda 26 13 6 240 1 36 43 78 61
Ukraine 48 77 47 970 1 29 - 1
United Kingdom 59 90 1 680 28 350 1 15 36 - 1
United States 294 81 10 946 37 610 1 15 41 - 1
Uruguay 3 92 13 3 790 1 3 45 - 1
Uzbekistan 26 37 11 420 1 27 - 4
Venezuela, Boliv. Rep. of 26 93 89 3 490 1 9 49 39 6
Viet Nam 82 26 39 480 1 16 36 66 15
Yemen 20 27 10 520 0 41 33 69 78
Zambia 11 35 4 380 0 46 53 42 57
Zimbabwe 13 35 6 480 0 46 57 72 27
World Bank data sources were used to obtain references of country figures: 1 World Bank (2006b) pp. 292-295. 2 Human Development Report 2006 (2006), pp. 283-286. 3 Idem, pp. 292-295. 4 All data from World Bank (2005), pp. 256ff. except for Cuba. 5 Human Development Report 2006 (2006), pp, 297-299. 6 Myanmar National Health Accounts, 2004-2005. 7 Health in Myanmar.

ILO S
trategy Social H
ealth Protection
83
Table A2.2. Formal coverage in social health protection
Formal coverage
Country Total (%)
State (%)2
SHI(%)
PHI (%)
Other (%)
Company based/ trade
unionMHI Total
OOP as % of total exp. on
health
Total expenditure on health as %
of gross domestic product1
Social security expenditure on health as % of
general government
expenditure on health1
Out-of-pocket expenditure
as % of private expenditureon health1
Albania … 58.2 6.5 25.1 99.8
Algeria 85.0 173 684 0 18.3 4.1 28.4 95.3
Angola … 15.8 7.1 89.2 71.1
Argentina 99.9 37.35 13.66 0.27 48.88 28.6 2.8 0.0 100
Armenia 100.0 100 64.3 4.5 0.0 100
Australia 100.0 59.7 40.39 22 8.9 56.8 55.6
Austria 98.1 3.810 94.2 0.19 19.2 6.0 0.0 80.6
Azerbaijan ... 73.8 9.5 0.0 67.8
Bangladesh 0.4 0.41 58.9 7.5 65.8 59.2
Belarus 100.0 10011 23.2 3.6 0.0 96.8
Belgium 100.0 99 57.59 21.8 9.4 88.4 66.6
Benin 0.5 0.44 51.4 4.4 ... 90.3
Bolivia 66.9 30 25.8 10.5 0.6 28.5 6.7 65.0 79.3
Bosnia and Herzegovina 100.0 100 49.3 9.5 77.5 100
Botswana … 12 5.6 ... 28.8
Brazil 85.0 10012 24.5 35.1 7.6 0.0 64.2
Bulgaria 100 10013 44.8 7.5 51.6 98.4
Burkina Faso 0.2 014 0.2 52.2 5.6 1.0 98.1
Burundi 13 1315 0 76.7 3.1 ... 100
Cambodia 0.66 69.6 10.9 0.0 86.2
Cameroon 0.1 0.05 69.9 4.2 0.1 98.3
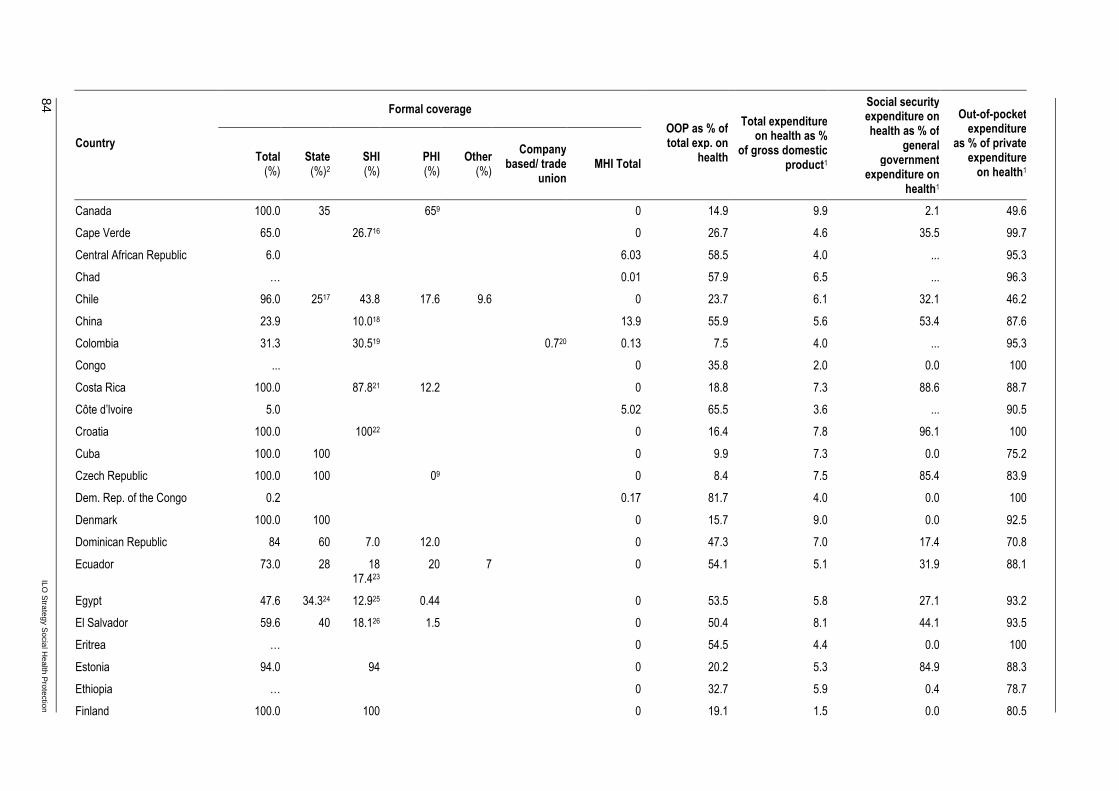
84 ILO
Strategy S
ocial Health P
rotection
Formal coverage
Country Total (%)
State (%)2
SHI(%)
PHI (%)
Other (%)
Company based/ trade
unionMHI Total
OOP as % of total exp. on
health
Total expenditure on health as %
of gross domestic product1
Social security expenditure on health as % of
general government
expenditure on health1
Out-of-pocket expenditure
as % of private expenditureon health1
Canada 100.0 35 659 0 14.9 9.9 2.1 49.6
Cape Verde 65.0 26.716 0 26.7 4.6 35.5 99.7
Central African Republic 6.0 6.03 58.5 4.0 ... 95.3
Chad … 0.01 57.9 6.5 ... 96.3
Chile 96.0 2517 43.8 17.6 9.6 0 23.7 6.1 32.1 46.2
China 23.9 10.018 13.9 55.9 5.6 53.4 87.6
Colombia 31.3 30.519 0.720 0.13 7.5 4.0 ... 95.3
Congo ... 0 35.8 2.0 0.0 100
Costa Rica 100.0 87.821 12.2 0 18.8 7.3 88.6 88.7
Côte d’lvoire 5.0 5.02 65.5 3.6 ... 90.5
Croatia 100.0 10022 0 16.4 7.8 96.1 100
Cuba 100.0 100 0 9.9 7.3 0.0 75.2
Czech Republic 100.0 100 09 0 8.4 7.5 85.4 83.9
Dem. Rep. of the Congo 0.2 0.17 81.7 4.0 0.0 100
Denmark 100.0 100 0 15.7 9.0 0.0 92.5
Dominican Republic 84 60 7.0 12.0 0 47.3 7.0 17.4 70.8
Ecuador 73.0 28 1817.423
20 7 0 54.1 5.1 31.9 88.1
Egypt 47.6 34.324 12.925 0.44 0 53.5 5.8 27.1 93.2
El Salvador 59.6 40 18.126 1.5 0 50.4 8.1 44.1 93.5
Eritrea … 0 54.5 4.4 0.0 100
Estonia 94.0 94 0 20.2 5.3 84.9 88.3
Ethiopia … 0 32.7 5.9 0.4 78.7
Finland 100.0 100 0 19.1 1.5 0.0 80.5

ILO S
trategy Social H
ealth Protection
85
Formal coverage
Country Total (%)
State (%)2
SHI(%)
PHI (%)
Other (%)
Company based/ trade
unionMHI Total
OOP as % of total exp. on
health
Total expenditure on health as %
of gross domestic product1
Social security expenditure on health as % of
general government
expenditure on health1
Out-of-pocket expenditure
as % of private expenditureon health1
France 100.0 99.9 9227 0 10 1.5 0.0 80.5
Gabon 55.0 14.428 2329 4.730 12.931 0 33.4 4.4 1.7 100
Gambia 99.9 0 40.2 8.1 0.0 67.0
Georgia 55.0 1432 0 74.7 4.0 59.2 98.2
Germany 101.6 3.933 85.734 1035 236 0 10.4 11.1 87.4 47.9
Ghana 18.7 18.7 68.2 4.5 ... 100
Greece 99.5 109 0 46.5 9.9 32.0 95.4
Guatemala 72.6 26 16.618.237
30 > 0.00838 55.4 5.4 50.5 91.9
Guinea 1.1 1.09 82.9 5.4 1.5 99.4
Guinea-Bissau 1.6 1.6 43.5 5.6 2.2 80.2
Haiti 60.0 21 38 1 43 7.5 0.0 69.5
Honduras 65.2 52 11.7 1.5 37.3 7.1 11.6 85.8
Hungary 100.0 100 0 24.5 8.4 83.4 88.9
Iceland 100.0 100 09 16.5 10.5 36.5 100
India 5.7 5.239 0.0440 0.48 72.9 4.8 4.2 97.0
Indonesia 54.6 16.641 36.142 1.943 47.6 3.1 9.9 74.3
Iran Islamic Republic of … 50 6.5 30.9 94.8
Ireland 100.0 100 43.89 13.1 7.3 0.8 61.9
Israel 9.0 28.3 8.9 61.9 89.1
Italy 100.0 100 15.69 20.7 8.4 0.2 83.3
Jamaica … 32 5.3 0.0 64.7
Japan 100.0 100 17.1 7.9 80.5 90.1
Jordan ≈80.0 70 5 3 7 40.6 9.4 0.7 74.0
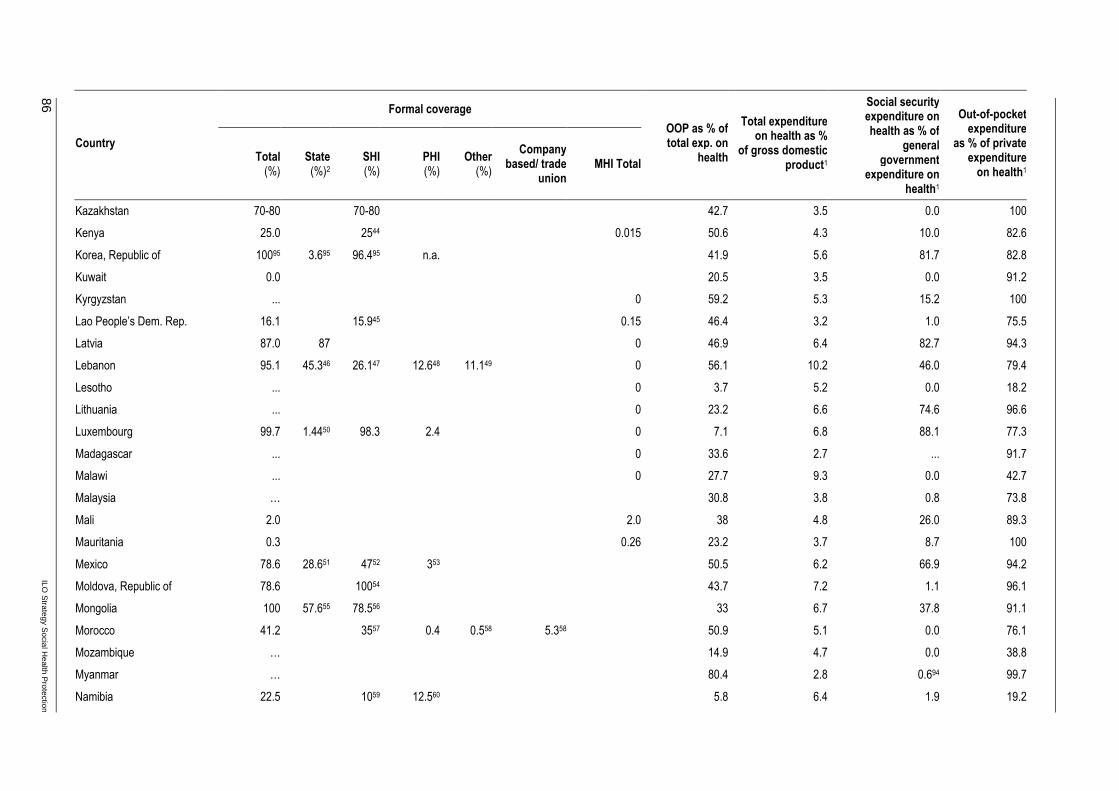
86 ILO
Strategy S
ocial Health P
rotection
Formal coverage
Country Total (%)
State (%)2
SHI(%)
PHI (%)
Other (%)
Company based/ trade
unionMHI Total
OOP as % of total exp. on
health
Total expenditure on health as %
of gross domestic product1
Social security expenditure on health as % of
general government
expenditure on health1
Out-of-pocket expenditure
as % of private expenditureon health1
Kazakhstan 70-80 70-80 42.7 3.5 0.0 100
Kenya 25.0 2544 0.015 50.6 4.3 10.0 82.6
Korea, Republic of 10095 3.695 96.495 n.a. 41.9 5.6 81.7 82.8
Kuwait 0.0 20.5 3.5 0.0 91.2
Kyrgyzstan ... 0 59.2 5.3 15.2 100
Lao People’s Dem. Rep. 16.1 15.945 0.15 46.4 3.2 1.0 75.5
Latvia 87.0 87 0 46.9 6.4 82.7 94.3
Lebanon 95.1 45.346 26.147 12.648 11.149 0 56.1 10.2 46.0 79.4
Lesotho ... 0 3.7 5.2 0.0 18.2
Lithuania ... 0 23.2 6.6 74.6 96.6
Luxembourg 99.7 1.4450 98.3 2.4 0 7.1 6.8 88.1 77.3
Madagascar ... 0 33.6 2.7 ... 91.7
Malawi ... 0 27.7 9.3 0.0 42.7
Malaysia … 30.8 3.8 0.8 73.8
Mali 2.0 2.0 38 4.8 26.0 89.3
Mauritania 0.3 0.26 23.2 3.7 8.7 100
Mexico 78.6 28.651 4752 353 50.5 6.2 66.9 94.2
Moldova, Republic of 78.6 10054 43.7 7.2 1.1 96.1
Mongolia 100 57.655 78.556 33 6.7 37.8 91.1
Morocco 41.2 3557 0.4 0.558 5.358 50.9 5.1 0.0 76.1
Mozambique … 14.9 4.7 0.0 38.8
Myanmar … 80.4 2.8 0.694 99.7
Namibia 22.5 1059 12.560 5.8 6.4 1.9 19.2

ILO S
trategy Social H
ealth Protection
87
Formal coverage
Country Total (%)
State (%)2
SHI(%)
PHI (%)
Other (%)
Company based/ trade
unionMHI Total
OOP as % of total exp. on
health
Total expenditure on health as %
of gross domestic product1
Social security expenditure on health as % of
general government
expenditure on health1
Out-of-pocket expenditure
as % of private expenditureon health1
Nepal 0.1 0.00861 0.13 66.6 5.3 0.0 92.2
Netherlands 100 76.3 289 7.8 9.8 93.0 20.8
New Zealand 100.0 100 359 15.6 8.1 0.0 72.1
Nicaragua 68.5 60 7.9 0.5 0.13 49.4 7.7 26.6 95.7
Niger 0.7 0.7 41.9 4.7 2.2 89.2
Nigeria … 67.9 5.0 0.0 91.2
Norway 100.0 09 15.6 10.3 17.9 95.4
Oman 100.0 9.5 3.2 0.0 56.1
Pakistan ... 70.9 2.4 53.3 98.0
Panama 100.0 35.4 64.6 27.6 7.6 55.5 82.2
Papua New Guinea ... 9.7 3.4 0.0 87.2
Paraguay 63.7 33.3 14.262 12.4 0.1863 3.59 51.1 7.3 39.8 74.6
Peru 71.0 11.764 27.265 0.34 40.8 4.4 42.4 79.0
Philippines 37.766 21.167 44 3.2 21.8 78.2
Poland … 09 0 26.4 6.5 86.0 87.8
Portugal 100.0 100.0 14.89 0 29 9.6 6.5 95.7
Romania 100.0 10068 0 33.5 6.1 85.8 90.4
Russian Federation 88 8869 0 29.2 5.6 43.7 71.1
Rwanda 36.6 2.670 8.971 25.172 23.6 3.7 9.8 41.7
Saudi Arabia … 0 6.9 4.0 ... 28.6
Senegal 11.7 773 4.72 55.5 5.1 15.8 95.3
Serbia and Montenegro 96.2 96.274 0 20.9 9.6 89.8 85.3
Sierra Leone … 0 41.7 3.5 0.0 100
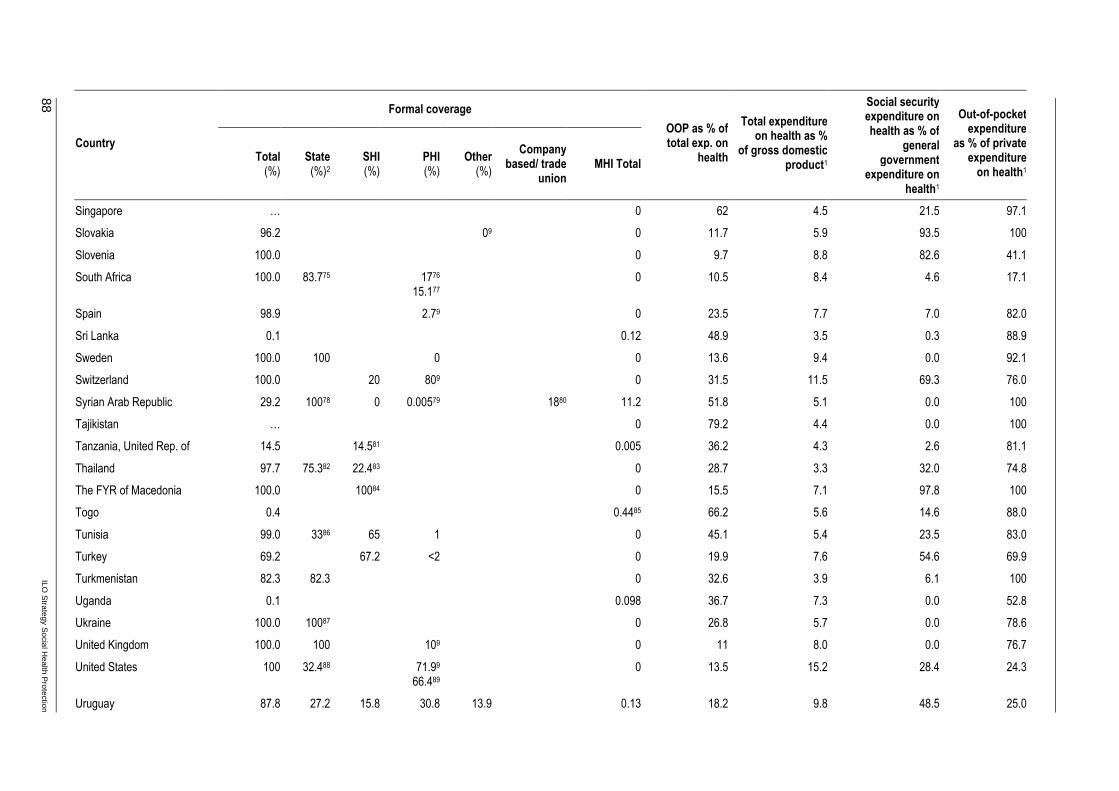
88 ILO
Strategy S
ocial Health P
rotection
Formal coverage
Country Total (%)
State (%)2
SHI(%)
PHI (%)
Other (%)
Company based/ trade
unionMHI Total
OOP as % of total exp. on
health
Total expenditure on health as %
of gross domestic product1
Social security expenditure on health as % of
general government
expenditure on health1
Out-of-pocket expenditure
as % of private expenditureon health1
Singapore … 0 62 4.5 21.5 97.1
Slovakia 96.2 09 0 11.7 5.9 93.5 100
Slovenia 100.0 0 9.7 8.8 82.6 41.1
South Africa 100.0 83.775 1776
15.177
0 10.5 8.4 4.6 17.1
Spain 98.9 2.79 0 23.5 7.7 7.0 82.0
Sri Lanka 0.1 0.12 48.9 3.5 0.3 88.9
Sweden 100.0 100 0 0 13.6 9.4 0.0 92.1
Switzerland 100.0 20 809 0 31.5 11.5 69.3 76.0
Syrian Arab Republic 29.2 10078 0 0.00579 1880 11.2 51.8 5.1 0.0 100
Tajikistan … 0 79.2 4.4 0.0 100
Tanzania, United Rep. of 14.5 14.581 0.005 36.2 4.3 2.6 81.1
Thailand 97.7 75.382 22.483 0 28.7 3.3 32.0 74.8
The FYR of Macedonia 100.0 10084 0 15.5 7.1 97.8 100
Togo 0.4 0.4485 66.2 5.6 14.6 88.0
Tunisia 99.0 3386 65 1 0 45.1 5.4 23.5 83.0
Turkey 69.2 67.2 <2 0 19.9 7.6 54.6 69.9
Turkmenistan 82.3 82.3 0 32.6 3.9 6.1 100
Uganda 0.1 0.098 36.7 7.3 0.0 52.8
Ukraine 100.0 10087 0 26.8 5.7 0.0 78.6
United Kingdom 100.0 100 109 0 11 8.0 0.0 76.7
United States 100 32.488 71.99
66.489
0 13.5 15.2 28.4 24.3
Uruguay 87.8 27.2 15.8 30.8 13.9 0.13 18.2 9.8 48.5 25.0
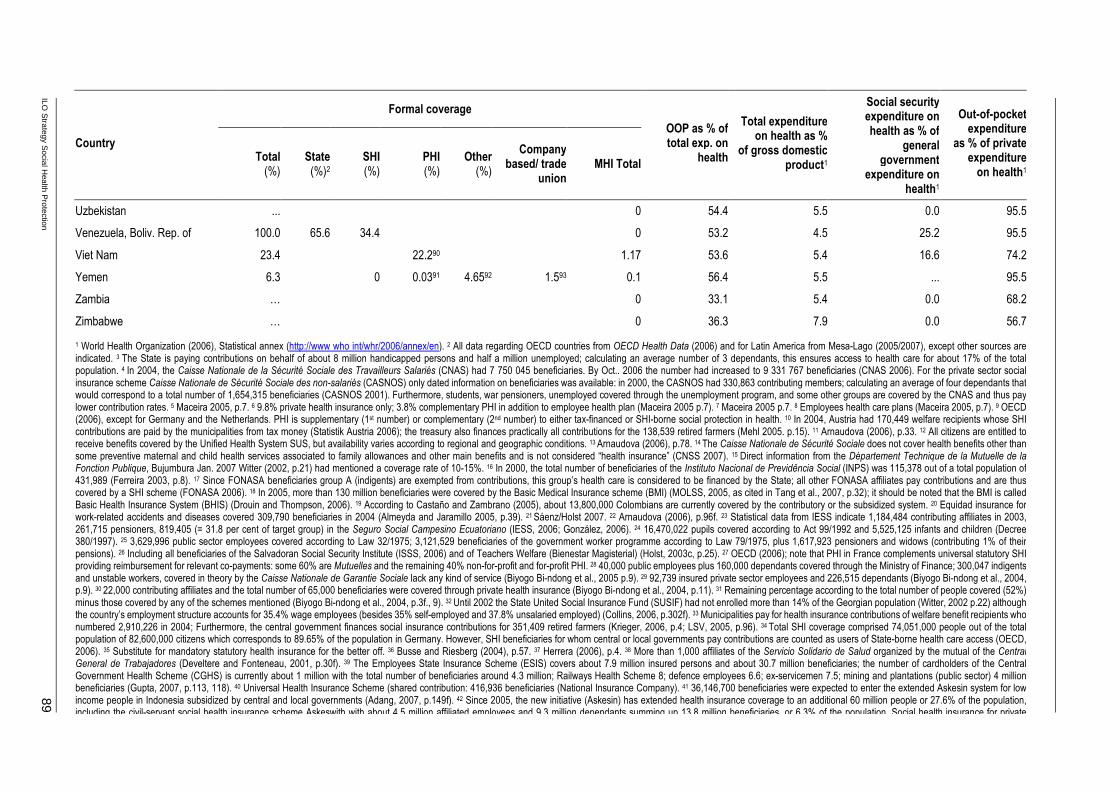
ILO S
trategy Social H
ealth Protection
89
Formal coverage
Country Total (%)
State (%)2
SHI(%)
PHI (%)
Other (%)
Company based/ trade
unionMHI Total
OOP as % of total exp. on
health
Total expenditure on health as %
of gross domestic product1
Social security expenditure on health as % of
general government
expenditure on health1
Out-of-pocket expenditure
as % of private expenditureon health1
Uzbekistan ... 0 54.4 5.5 0.0 95.5
Venezuela, Boliv. Rep. of 100.0 65.6 34.4 0 53.2 4.5 25.2 95.5
Viet Nam 23.4 22.290 1.17 53.6 5.4 16.6 74.2
Yemen 6.3 0 0.0391 4.6592 1.593 0.1 56.4 5.5 ... 95.5
Zambia … 0 33.1 5.4 0.0 68.2
Zimbabwe … 0 36.3 7.9 0.0 56.7
1 World Health Organization (2006), Statistical annex (http://www who int/whr/2006/annex/en). 2 All data regarding OECD countries from OECD Health Data (2006) and for Latin America from Mesa-Lago (2005/2007), except other sources are indicated. 3 The State is paying contributions on behalf of about 8 million handicapped persons and half a million unemployed; calculating an average number of 3 dependants, this ensures access to health care for about 17% of the total population. 4 In 2004, the Caisse Nationale de la Sécurité Sociale des Travailleurs Salariés (CNAS) had 7 750 045 beneficiaries. By Oct.. 2006 the number had increased to 9 331 767 beneficiaries (CNAS 2006). For the private sector social insurance scheme Caisse Nationale de Sécurité Sociale des non-salariés (CASNOS) only dated information on beneficiaries was available: in 2000, the CASNOS had 330,863 contributing members; calculating an average of four dependants that would correspond to a total number of 1,654,315 beneficiaries (CASNOS 2001). Furthermore, students, war pensioners, unemployed covered through the unemployment program, and some other groups are covered by the CNAS and thus pay lower contribution rates. 5 Maceira 2005, p.7. 6 9.8% private health insurance only; 3.8% complementary PHI in addition to employee health plan (Maceira 2005 p.7). 7 Maceira 2005 p.7. 8 Employees health care plans (Maceira 2005, p.7). 9 OECD (2006), except for Germany and the Netherlands. PHI is supplementary (1st number) or complementary (2nd number) to either tax-financed or SHI-borne social protection in health. 10 In 2004, Austria had 170,449 welfare recipients whose SHI contributions are paid by the municipalities from tax money (Statistik Austria 2006); the treasury also finances practically all contributions for the 138,539 retired farmers (Mehl 2005. p.15). 11 Arnaudova (2006), p.33. 12 All citizens are entitled to receive benefits covered by the Unified Health System SUS, but availability varies according to regional and geographic conditions. 13 Arnaudova (2006), p.78. 14 The Caisse Nationale de Sécurité Sociale does not cover health benefits other than some preventive maternal and child health services associated to family allowances and other main benefits and is not considered “health insurance” (CNSS 2007). 15 Direct information from the Département Technique de la Mutuelle de la Fonction Publique, Bujumbura Jan. 2007 Witter (2002, p.21) had mentioned a coverage rate of 10-15%. 16 In 2000, the total number of beneficiaries of the Instituto Nacional de Previdência Social (INPS) was 115,378 out of a total population of 431,989 (Ferreira 2003, p.8). 17 Since FONASA beneficiaries group A (indigents) are exempted from contributions, this group’s health care is considered to be financed by the State; all other FONASA affiliates pay contributions and are thus covered by a SHI scheme (FONASA 2006). 18 In 2005, more than 130 million beneficiaries were covered by the Basic Medical Insurance scheme (BMI) (MOLSS, 2005, as cited in Tang et al., 2007, p.32); it should be noted that the BMI is called Basic Health Insurance System (BHIS) (Drouin and Thompson, 2006). 19 According to Castaño and Zambrano (2005), about 13,800,000 Colombians are currently covered by the contributory or the subsidized system. 20 Equidad insurance for work-related accidents and diseases covered 309,790 beneficiaries in 2004 (Almeyda and Jaramillo 2005, p.39). 21 Sáenz/Holst 2007. 22 Arnaudova (2006), p.96f. 23 Statistical data from IESS indicate 1,184,484 contributing affiliates in 2003, 261,715 pensioners, 819,405 (= 31.8 per cent of target group) in the Seguro Social Campesino Ecuatoriano (IESS, 2006; González, 2006). 24 16,470,022 pupils covered according to Act 99/1992 and 5,525,125 infants and children (Decree 380/1997). 25 3,629,996 public sector employees covered according to Law 32/1975; 3,121,529 beneficiaries of the government worker programme according to Law 79/1975, plus 1,617,923 pensioners and widows (contributing 1% of their pensions). 26 Including all beneficiaries of the Salvadoran Social Security Institute (ISSS, 2006) and of Teachers Welfare (Bienestar Magisterial) (Holst, 2003c, p.25). 27 OECD (2006); note that PHI in France complements universal statutory SHI providing reimbursement for relevant co-payments: some 60% are Mutuelles and the remaining 40% non-for-profit and for-profit PHI. 28 40,000 public employees plus 160,000 dependants covered through the Ministry of Finance; 300,047 indigents and unstable workers, covered in theory by the Caisse Nationale de Garantie Sociale lack any kind of service (Biyogo Bi-ndong et al., 2005 p.9). 29 92,739 insured private sector employees and 226,515 dependants (Biyogo Bi-ndong et al., 2004, p.9). 30 22,000 contributing affiliates and the total number of 65,000 beneficiaries were covered through private health insurance (Biyogo Bi-ndong et al., 2004, p.11). 31 Remaining percentage according to the total number of people covered (52%) minus those covered by any of the schemes mentioned (Biyogo Bi-ndong et al., 2004, p.3f., 9). 32 Until 2002 the State United Social Insurance Fund (SUSIF) had not enrolled more than 14% of the Georgian population (Witter, 2002 p.22) although the country’s employment structure accounts for 35.4% wage employees (besides 35% self-employed and 37.8% unsalaried employed) (Collins, 2006, p.302f). 33 Municipalities pay for health insurance contributions of welfare benefit recipients who numbered 2,910,226 in 2004; Furthermore, the central government finances social insurance contributions for 351,409 retired farmers (Krieger, 2006, p.4; LSV, 2005, p.96). 34 Total SHI coverage comprised 74,051,000 people out of the total population of 82,600,000 citizens which corresponds to 89.65% of the population in Germany. However, SHI beneficiaries for whom central or local governments pay contributions are counted as users of State-borne health care access (OECD, 2006). 35 Substitute for mandatory statutory health insurance for the better off. 36 Busse and Riesberg (2004), p.57. 37 Herrera (2006), p.4. 38 More than 1,000 affiliates of the Servicio Solidario de Salud organized by the mutual of the Central General de Trabajadores (Develtere and Fonteneau, 2001, p.30f). 39 The Employees State Insurance Scheme (ESIS) covers about 7.9 million insured persons and about 30.7 million beneficiaries; the number of cardholders of the Central Government Health Scheme (CGHS) is currently about 1 million with the total number of beneficiaries around 4.3 million; Railways Health Scheme 8; defence employees 6.6; ex-servicemen 7.5; mining and plantations (public sector) 4 million beneficiaries (Gupta, 2007, p.113, 118). 40 Universal Health Insurance Scheme (shared contribution: 416,936 beneficiaries (National Insurance Company). 41 36,146,700 beneficiaries were expected to enter the extended Askesin system for low income people in Indonesia subsidized by central and local governments (Adang, 2007, p.149f). 42 Since 2005, the new initiative (Askesin) has extended health insurance coverage to an additional 60 million people or 27.6% of the population, including the civil-servant social health insurance scheme Askeswith with about 4.5 million affiliated employees and 9.3 million dependants summing up 13.8 million beneficiaries, or 6.3% of the population. Social health insurance for private

90 ILO
Strategy S
ocial Health P
rotection
Formal coverage
Country Total (%)
State (%)2
SHI(%)
PHI (%)
Other (%)
Company based/ trade
unionMHI Total
OOP as % of total exp. on
health
Total expenditure on health as %
of gross domestic product1
Social security expenditure on health as % of
general government
expenditure on health1
Out-of-pocket expenditure
as % of private expenditureon health1
employees (Jamsostek)
was covering 1.26 million employees and 2.74 million beneficiaries in 2005. About 2 million people were insured by the military health services system covering all armed forces. 43 In 1999 (!), 4 million people were covered by private commercial health insurance. (Adang 2007, p.148). 44 Witter (2002), p.21; National Health Insurance Fund (NHIF) covers 7% of the Kenyan population (Scheil-Adlung et al. 2007, p.133). 45 875,000 beneficiaries covered by the Public Sector Social Security Scheme, including ≈91,000 civil servants and ≈100,000 members of armed forces and 48,096 beneficiaries of the private sector Social Security Organisation (SSO) (Hohmann et al., 2005). 46 2,083,662 Lebanese – 1,047,338 male and 1,036,324 female - are eligible for MoPH coverage (MoPH, 2006). 47 Self-reported coverage of the National Social Security Fund was 26.1% in 2001, although household surveys showed a lower rate of 17.8% (Ammar et al., 2000) since in 2003 the NSSF had 386,000 affiliates: 253,000 males (65.54%) and 133,000 females (34.45%) (Papadopoulos 2006, p.4). The average number of dependants would be close to two persons, which appears relatively low for an Arab country. 48 8% of the population has complete coverage through private insurance, and 4.6% of the population has contracted PHI to complement coverage of other insurance schemes (Ammar et al. 2000, p.24). 49 Beneficiaries covered by any scheme in place for members of the four arms of the security apparatus (Ammar et al. 2000, p.24). 50 Ministère de la Sécurité Sociale (2005). 51 Frenk et al. (2007), p.24; for tax financing please note the yearly expected inclusion of 14.3% of the target group consisting of 11 million families, or 50 million beneficiaries representing 49% of the total population. Estimations for the second year after the implementation of the System for Social Protection in Health (SSPH) in 2004. 52 Ibid. 53 Ibid. 54 Arnaudova (2006), p.114f. 55 1,439,544 people were covered by the State in 2002 (Khorolsuren and Tseden, 2005, p.3f). 56 In 2002, the total number of health insurance affiliates was 523,617 corresponding to 1,963,161 beneficiaries (Khorolsuren and Tseden 2005, p.3f). 57 In 2005, the private sector social insurance scheme Caisse Nationale de Sécurité Sociale (CNSS) covered about 6 million beneficiaries, and the public sector employees’ health insurance scheme Caisse Nationale des Organismes de Prévoyance Sociale (CNOPS) about 3.2 million beneficiaries. About 4% were covered by employer-based health insurance (Caisse Mutualiste Interprofessionnelle Marocaine) (L’Observatoire de Tanger 2007; Kaddar et al., 1999, p.4f). 58 Direction de la Statistique 2005, p.485. 59 Witter (2002), p.21. 60 Feeley et al.(2006), p.6. 61 The General Federation of Nepalese Trade Unions was covering about 2,000 beneficiaries (ILO, 2003a, pp.8,10). 62 Instituto de Prevision Social (2003); Holst (2003b). 63 Employees of Binational Itaipú Company covered through the Seguro Itaipú (Holst 2003b). 64 Also, the publicly run insurance scheme Seguro Integral de Salud (SIS) counted 11,044,140 affiliated beneficiaries (MINSA, 2006, p.IR-1). Only 3,221,090 beneficiaries enjoyed effective coverage (personal communication by SIS-staff). 65 The total number of formal sector employees and their dependants who are covered by the SHI-scheme EsSalud is 7,500,000 (http://www essalud gob pe). 66 As at 31 Dec., 2004, PhilHealth covered a total number of 31,290,750 beneficiaries through the sponsored (indigent) programme which provides subsidized premiums to indigents (PhilHealth, 2006). 67 The total number of 17,520,000 beneficiaries comprises Government employees (compulsory insurance), private sector employees and workers affiliated so far, plus enrolees of the Individual Paying Program offered to informal sector workers (Basa, 2007). 68 Arnaudova (2006), p.132. 69 Balabanova et al. (2003), p.2126. 70 Beneficiaries of Gacaca (113,770) and prisoners (107,000) are entitled to public sector health benefits free of charge (Musango et al., 2006, p.126). 71 The Rwandaise d’Assurance Maladie (RAMA): 155,394; Fonds d’appui aux rescapés du génocide (FARG): 283,000; Army: 100,000; and private sector health insurance: 213,512 (Musango et al., 2006, p.126). 72 Musango et al. (2006), p.126. 73 Total number of beneficiaries covered by company and inter-company health insurance institutions (IPMs) running the statutory formal sector social health protection scheme (Scheil-Adlung et al., 2007, p.133). 74 Information provided by Prof. Laaser Belgrade. 75 Basic health care offered to the large majority in South Africa through public facilities charging user fees according to region and service (Scheil-Adlung et al., 2007, p.133). 76 Covered through employment-based private health insurance plans (Scheil-Adlung et al., 2007, p.134). 77 Council for Medical Schemes (2006), p.47. 78 In principle, Syrians are entitled to preventive and primary care at public providers. Furthermore, patients with chronic conditions also receive health care free of charge or for reduced tariffs at public health facilities. 79 PHI is emerging in Syria since the first companies got licensed in July 2006 (Holst, 2006). 80 Half of the 3 million public sector employees are estimated to be covered by some kind of insurance scheme, according to the first assessment of company-based health benefit schemes in Syria. About 12-14% of the population is entitled to company-based health benefits. However, corresponding studies did not take into account the fact that trade unions are running additional schemes for their dependants in a number of public companies, resulting in a higher number of people protected by company-based health insurance (Schwefel 2006a, 2006b; Holst, 2006). 81 The total number of social security beneficiaries in the United Republic of Tanzania is 5,319,378: NSSF 400,000 members, 2,360,000 beneficiaries; PPF 60,000 members, 354,000 beneficiaries; PSPF 193,000 members, 1,138,700 beneficiaries; LAPF 40,000 members, 236,000 beneficiaries; NHIF 248,343 members, 1,142,178 beneficiaries; GEPF 15,000 members, 88,500 beneficiaries (Dau, 2005, p.2; Humba, 2005 p.7). 82 In 2002 the UC scheme covered 47 million people in Thailand (Tangcharoensathien et al., 2007, p.127). 83 Civil Servant Medical Benefit Scheme for public sector (6 million or 10% of the population) and the Social Health Insurance for private sector employees (8 million or 13%) are both considered SHI systems (Tangcharoensathien et al., 2007, p.127). 84 Arnaudova (2006), p.197f. 85 Concertation (2004), p.14. 86 Achouri (2007), p.52; it should be noted that the CNSS covers about four out of every five social security beneficiaries. The percentage of people covered through tax-based services includes those entitled to health services free of charge (8%) and to reduced tariffs in public facilities (25% of the population). 87 Arnaudova (2006), p.233f. 88 In 2003, 41.2 million US citizens were enrolled in Medicare and 54 million in Medicaid (US Census Bureau, 2007). 89 Hoffman et al. (2005), p.10. 90 At the end of 2005, the compulsory scheme had affiliated 8,142,000 and the voluntary schemes 6,245,000 Vietnamese citizens, while 3,889,000 poor people were enrolled through subsidies from the Heath Care Fund for the Poor (Tien, 2007, p.64). 91 Estimated number of Yemeni citizens covered through PHI is about 6,000 (Schwefel et al., 2005, p.108ff). 92 Armed forces and police are estimated to have 920,000 personnel who are covered through the military health benefit scheme or the scheme of the Ministry of Interior (Schwefel et al., 2005, p.105). 93 According to estimations, about half of all formal sector workers and employees are entitled to some kind of health benefit scheme (Schwefel et al., 2005, p.105). 941997 fig. ,Myanmar Statistical Yearbook 2004.95 2005 Report on Health Insurance Statistics (National Health Insurance Corporation).

ILO Strategy Social Health Protection 91
Appendix III
ILO Tool Box
NATLEX
NATLEX is a database of national labour, social security and related human rights legislation maintained by the International Labour Standards Department. Database records provide abstracts of legislation and relevant citation information indexed by keywords and subjects. NATLEX contains more than 55,000 records covering over 170 countries and territories. Each record in NATLEX appears in only one of the three ILO official languages (either in English, French or Spanish). As far as possible, the full text of the law or a relevant electronic source is linked to the record. The database is usually kept up to date, although some delay between receiving information and updating the records might occur.
Actuarial and financial advisory services
Many countries require neutral, objective advice on strategic or managerial financial and fiscal questions or support in building up national capacities for sound financial design and management of social protection programmes. The ILO's International Financial and Actuarial Service (ILO FACTS) assists government agencies and autonomous social protection organisms in developing their own capacity for quantitative planning and improving the management and governance of their social protection schemes. ILO FACTS is a public sector advisory group for the exclusive use of national social protection agencies or social security schemes. It is a service that the ILO provides to its constituents. It is highly specialized in the actuarial, financial and fiscal questions of social protection. ILO FACTS is the consulting group with the longest and most extensive international experience in quantitative aspects of social security in the world.
The ILO model family
Population projections. ILO-POP produces population forecasts that match the standard UN methodology for demographic projections on the basis of an initial population structure combined with mortality, fertility and migration assumptions. This model is also used as a standard input producer for the ILO actuarial pension and social budget models that require long-term population forecasts. Population forecasting models have recently been elaborated to take into account the effects of the HIV/AIDS epidemic on mortality.
Social budgeting. ILO-SOCBUD consists of four sub-models: the labour force sub-model (ILO-LAB) and the economic sub-model (ILO-ECO) together provide data on employment and earnings to the social expenditure sub-model (ILO-SOC), which provides information on functional expenditures (expenditure by function of social protection) for main social security subsystems and schemes, e.g. social health protection and old-age protection; the fourth sub-model, ILO-GOV, aggregates data for use in government and institutional accounts of the social security system.
Pension model. ILO-PENS is an actuarial pension model that is traditionally used to undertake stand-alone long-term financial and actuarial projections for national pension schemes. It can also be used as an input to ILO-SOCBUD.
Wage distribution. ILO-DIST is developed to generate data on salary distribution. It is used primarily for pension projections but, as social protection systems are redistributive, it

92 ILO Strategy Social Health Protection
is also necessary to take income distribution into account when providing policy advice on the design and financing of such systems.
Health model. ILO-HEALTH is the latest arrival in the ILO social protection modelling family and is still in the testing process. It is designed as a tool to undertake stand-alone assessments of the financial status and development of national health-care systems and is also applicable for generating inputs for the health part of ILO-SOCBUD.
Performance indicators
The Social Security Department has developed a preliminary set of quantitative performance indicators that can be used by managers and supervisory bodies to assess the performance of social security schemes.
STEP
In order to address low rates in social protection coverage in developing countries, STEP develops innovative strategies and mechanisms specifically aimed at providing coverage to those who are currently excluded from existing schemes. STEP works on community-based social benefit schemes and in particular on mutual health organizations. STEP works also on the linkages between the various schemes designed and implemented for protecting excluded people.
CIARIS
The Learning and Resources Centre on Social Inclusion (CIARIS) is an Internet platform. It supports organizations and individuals in the conception, planning, implementation, monitoring and evaluation of projects aimed at combating social exclusion at the local level. CIARIS contains a wide range of information and resources available in four languages. It allows users to interact and facilitates mutual assistance through three services:
� CIARISAssist connects people with specialized experts;
� CIARISLearning offers a wide range of distance-learning sessions,
� CIARISFora provides online discussion forums.
GIMI
The Global Information on Micro-insurance (GIMI) platform is aimed at improving the knowledge base on social health protection and fostering interaction between actors through modern information and communication technologies. It provides resources and services to support users in the design, implementation and management of social protection schemes, through:
� online library including guides, case studies, articles and presentations;
� bilingual French-English glossary;
� database on microinsurance schemes around the world;
� free management and monitoring software;

ILO Strategy Social Health Protection 93
� training packages to be used in online or face-to-face sessions; as well as self-learning kits;
� online assistance from experts in the field;
� the e-Gimi discussion forum;
� collaborative websites called “wikis” to explore technical issues or conduct joint projects,
� a collaborative newsletter based on contributions from users.


ILO Strategy Social Health Protection 95
References
Achouri, H. 2007. "Advances in implementing social security: Lessons from Tunisia", in: J. Holst and A. Brandrup-Lukanow (eds.): Extending social health protection – developing countries experiences (Eschborn, GTZ), pp. 52-56.
Affo-Massim, O. et al. 2004. Couverture du Risque Maladie au Benin, Republique du Benin. Ministere de la Sante Publique, Report presented at the Colloque sur la couverture du risque maladie en Afrique Francophone WBI-IMA, Paris, 26-30 April 2004. (http://www.ces-asso.org/docs/WBI_IMA_Rapport_Benin.PDF)
Ahmedov, M.; Azimov, R.; Alimova, V.; Rechel, B. 2007. Uzbekistan: Health system review. Health systems in transition, 9(3): 1–210. (http://www.euro.who.int/Document/E90673.pdf).
Akal, A. 2005. Social security in Fiji Kiribati Samoa Solomon Islands and Vanuatu, Extending Social Health Insurance Coverage in Pacific Island Countries Project: RAS/04/M59/NET. ILO/Netherlands Government. (http://zope0.itcilo.org/socpro/pacific/db/Reports/)
Almeyda, G.; Jaramillo, F. 2005. La Equidad Seguro ,Colombia. CGAP Working Group on Microinsurance, Good and Bad Practices, Case Study No. 12. (http://microfinancegateway.org/files/27891_file_Equidad_Good_and_Bad_Practices_No._12.pdf)
Ammar, W. et al. 2000. Lebanon National Health Accounts. World Health Organization, Ministry of Health, World Bank (draft). (http://www.who.int/nha/docs/en/Lebanon_NHA_report_english.pdf)
Appiah-Denkyira E.; Prever A. 2007. "Reaching the poor in Ghana with national health insurance – an experience from the districts of the Eastern Region of Ghana," in: J. Holst and A. Brandrup-Lukanow (eds.): Extending social health protection – developing countries experiences (Eschborn, GTZ,), pp. 73-81.
Arhin-Tenkorang, D. 2001. Health insurance for the informal sector in Africa: Design features, risk protection and resource mobilization, CMH Working Paper Series, Paper No. WG3: 1, Washington DC. (http://www.cmhealth.org/docs/wg3_paper1.pdf)
Arnaudova, A. 2006. 10 health questions about the new EU neighbours, WHO Regional Office for Europe, Copenhagen. (http://www.euro.who.int/Document/E88202.pdf)
Asian Development Bank (ADB). 2004. A framework for poverty reduction: Pillars of the Poverty Reduction Strategy, Manila. (http://www.adb.org/Documents/Policies/Poverty_Reduction/2004/poverty200.asp)
—. 2006. Asian Labour Market Developments, Manila.
Asfaw, A. 2006. Country study prepared for Xenia Scheil-Adlung et al. What is the impact of social health protection on access to health care health expenditure and impoverishment? A comparative analysis of three African countries, Extension of Social Security, ESS Paper No. 24 (ILO, Geneva).
Bailey, C. 2004. Extending social security coverage in Africa, Extension of Social Security, ESS Paper No. 20 (ILO, Geneva). (http://www3.ilo.org/public/english/protection/secsoc/downloads/707sp1.pdf)

96 ILO Strategy Social Health Protection
Balabanova, D., Falkingham, J., McKee, M. 2003. “Winners and losers: Expansion of insurance coverage in Russia in the 1990s”, in: American Journal of Public Health, 93 (12), pp. 2124-2130. (http://www.pubmedcentral.nih.gov/picrender.fcgi?artid=1448163&blobtype=pdf)
Bayarsaikhan, D. 2005. Current challenges in delivering social security health insurance. Current needs and challenges in delivering social health insurance in Asia and the Pacific, Paper presented at the ISSA Meeting of Directors of Social Security Organizations in Asia and the Pacific, Seoul, 9-11 November 2005 (ISSA, Geneva). (http://www.issa.int/pdf/seoul05/2bayarsaikhan.pdf)
Bennett, S. 2004. "The role of community-based health insurance within the health care financing system: a framework for analysis", in Health Policy and Planning, 19 (3), pp. 147-158 (Oxford University Press, London). (http://heapol.oxfordjournals.org/cgi/reprint/19/3/147)
Biyogo Bi-ndong, G. et al. 2005. Assurance Maladie au Gabon, Presentation made at the "Colloque sur la Couverture maladie en Afrique Francophone", 26-30 April 2004, WBI-IMA Paris. (http://www.ces-asso.org/docs/WBI_IMA_Rapport_Gabon.pdf)
Bonilla, A.; Gruat, J.-V. 2003. Social protection. A life cycle continuum investment for social justice, poverty reduction and sustainable development, Version 1.0 (ILO, Geneva). (http://www.ilo.org/public/english/protection/download/lifecycl/lifecycle.pdf)
Brown, W.; Churchill, C. 2000. Insurance provision in low-income communities, Part II: Initial lessons from micro-insurance experiments for the poor, Micro-enterprise Best Practices (Bethesda, Maryland). (http://www.microinsurancecentre.org/resources/Documents/Micro-Insurance-Part2.pdf)
Caisse Nationale de la Sécurité Sociale des Travailleurs Salariés (CNAS). 2006. Evolution du nombre des assurés par catégorie et sexe de 2002 jusqu'à 2006 au niveau national. Base de données arrêtée en octobre 2006, Direction Informatique, CNAS, Algiers. (http://www.cnas.org.dz/etats/evolasseff1006.pdf). Répartition nationale de la population immatriculée par catégorie, sexe et situation familiale. Base de données arrêtée en octobre 2006. Direction Informatique, CNAS, Algiers. (http://www.cnas.org.dz/etats/assstf1006.pdf)
Caisse Nationale de Sécurité Sociale des non-salariés (CASNOS). 2001. Intervention de Monsieur le Ministre du Travail et de la Protection Sociale, CASNOS, Algiers. (http://www.casnos.com.dz/intervention.htm).
Caisse Nationale de Sécurité Sociale (CNSS). 2007. La CNSS en chiffres, Ouagadougou. (http://www.cnss.bf/)
Castaño, R.; Zambrano, A. 2005. Biased selection within the social health insurance market in Colombia, paper presented at CERDI – 2nd International Conference: Health Financing in Developing Countries, 1-2 December 2005, Clermont-Ferrand.
Churchill, C. (ed.). 2006. Protecting the poor. A microinsurance compendium (ILO/Munich Re Foundation, Geneva/Munich). (http://www.munichre-foundation.org/StiftungsWebsite/Projects/Microinsurance/ 2006Microinsurance/Microinsurance_Compendium.htm)
Cichon, M. 2007. Health protection in developing countries: Breaking the vicious circle of disease and poverty, Third Roundtable Conference, Paris, France.
ILO Strategy Social Health Protection 97
Collins, T. 2006. "The Georgian healthcare system: Is it reaching the WHO health system goals?" in: The International Journal of Health Planning and Management, 21 (4), pp. 297-312. (http://www3.interscience.wiley.com/cgi-bin/fulltext/112777197/PDFSTART)
Concertation sur les Mutuelles de santé en Afrique (Concertation). 2004. Inventaire des mutuelles de santé en Afrique. Synthèse des travaux de recherche dans 11 pays, Dakar. (http://www3.ilo.org/public/english/protection/socsec/step/download/1554p1.pdf)
Council for Medical Schemes. 2006. Annual Report 2005-6, Pretoria. (http://www.medicalschemes.com/publications/publications.aspx?catid=7)
Dau, R. K. 2006. The adequacy of current social security benefits, paper presented at the ISSA Meeting of Directors of Social Security Organizations in English-Speaking Africa, Mahe, Seychelles, 3-6 October 2006 (ISSA, Geneva). (http://www.issa.int/pdf/seychelles06/2Tanzania.pdf)
Deaton, A. 2006. WIDER Annual Lecture, World Institute for Development Economics Research (WIDER), United Nations University, Helsinki.
Develtere, P.; Fonteneau, B. 2001. Member-based organisations for social protection in health in developing countries. Member-based health micro-insurance in developing countries – second draft, paper prepared for ILO/STEP, Catholic University of Louvain. (http://www.hiva.be/docs/paper/34.pdf)
Dror, D.; Preker, A. (eds). 2002. Social reinsurance: a new approach to sustainable community health financing (ILO/World Bank, Washington, DC). (http://www-wds.worldbank.org/servlet/WDSContentServer/WDSP/IB/2002/11/01/000094946_02102204203143/Rendered/PDF/multi0page.pdf)
Drouin, A., Thompson, L. 2006. Perspectives on the social security system of China, Extension of Social Security, ESS Paper No. 25 (ILO, Geneva). (http://www3.ilo.org/public/english/protection/secsoc/downloads/1511sp1.pdf)
Economic Commission for Latin America and the Caribbean; Instituto de Pesquisa Ecônomica Aplicada; United Nations Development Programme (ECLAC/IPEA/UNDP). 2002. Meeting the Millennium Poverty Reduction Targets in Latin America and the Caribbean, United Nations, Santiago. (http://www.undp.org/rblac/documents/poverty/mdg/MDGs-libro70.pdf)
Estivill, J. 2003. Concepts and strategies for combating social exclusion. An overview, ILO-STEP/Portugal, Geneva. (http://www3.ilo.org/public/english/protection/socsec/step/download/96p1.pdf)
European Commission. 2007. Joint Report on Social Protection and Social Inclusion, Luxembourg.
Evans, T. 2007. "Universal coverage: from concept to implementation", in: J. Holst and A. Brandrup-Lukanow (eds.): Extending social health protection – developing countries experiences. (Eschborn, GTZ), pp. 7-12.
Feeley, F.; de Beer, I.; Rinke de Wit, T.; van der Gaag, J. 2006. The health insurance industry in Namibia Baseline Report, Center for International Health, Amsterdam Institute for International Development; PharmAccess Foundation, Boston. (http://sph.bu.edu/images/stories/scfiles/cih/final_namibia_insurance_situation__june_2006.pdf).

98 ILO Strategy Social Health Protection
Ferreira, O. 2003. A extensão da protecção social: o caso de Cabo Verde. Extensão da Segurança Social, ESS Informe N° 15 (Extending social security: Challenges for Cape Verde. ESS Paper No. 15), ILO, Geneva. (http://www3.ilo.org/public/english/protection/secsoc/downloads/455sp1.pdf)
Fondo Nacional de Salud (FONASA). 2006. Demografia_2003.xls, tables 1.1. and 1.2.6, Santiago (http://www.fonasa.cl) [accessed 29 Dec. 2006].
Fouad, S. 2005. Egypt National Health Accounts 2001-02, the Partners for Health Reformplus project, Abt Associates Inc., Bethesda, Maryland. (http://www.phrplus.org/Pubs/WP013_fin.pdf)
Frenk, J.; Knaul, F.; González-Pier, E.; Barraza-Lloréns, M. 2007. "Poverty health and social protection," in: J. Holst and A. Brandrup-Lukanow (eds.): Extending social health protection – developing countries experiences (Eschborn, GTZ), pp. 22-31.
Gamkrelidze, A. et al. 2002. In: L. MacLehose and M. McKee (eds): Heath care systems in transition: Georgia, Copenhagen, European Observatory on Health Care Systems, 4(2). (http://www.euro.who.int/document/E75489.pdf)
Ghana. 2003. Ghana Poverty Reduction Strategy 2003-2005, An agenda for growth and prosperity, Volume I: Analysis and policy statement, Accra.
General Organisation for Social Insurance (GOSI). 2006. Statistical data on employers and workers for the year 2005. (http://www.gosi.org.bh/english/statistics-2005.htm#1)
González-J., L. A. 2006. El Seguro Social Campesino Ecuatoriano: evolución y perspectivas, presentation given at the ISSA Regional Conference for the Americas, Belize City, 28-31 May 2006.
Gulliford, M. et al. 2002. "What does 'access to health care' mean?" in: Journal of health services research & policy, 7 (3), pp. 186-188. (http://phs.kcl.ac.uk/martin/access.pdf)
Gupta, I. 2007. "Health coverage for all: Strategies and choices for India” in: J. Holst and A. Brandrup-Lukanow (eds.): Extending social health protection – developing countries experiences (Eschborn, GTZ), pp. 111-120.
Hakobyan, T. et al. 2006. “Armenia: Health system review” in: Health systems in transition. Vol. 8 (6), pp. 1-180. (http://www.euro.who.int/Document/E89732.pdf)
Henke, K.-D., Schreyögg, J. 2004. Towards sustainable health care systems. Strategies in health insurance schemes in France, Germany, Japan and the Netherlands. A comparative study (ISS, Geneva), ISBN 92-843-1166-7. (http://www.ww.tu-berlin.de/diskussionspapiere/2004/dp09-2004.pdf)
Hoffman, C., Carbaugh, A., Yang Moore, H., Cook, A. 2005. Health insurance coverage in America. 2004 Data Update, Kaiser Family Foundation, Washington, DC. (http://www.kff.org/uninsured/upload/Health-Coverage-in-America-2004-Data-Update-Report.pdf)
Hofmarcher, M., Rack, H. 2001. "Health care systems in transition – Austria," in: Health care systems in transition, European Observatory on Health Care Systems, Copenhagen. (www.euro.who.int/document/e72787.pdf)
Hohmann, J.; Vorasarn, S.; Manivong, K. 2005. The promising role of the formal sector towards health for all: Laos develops ambitious strategies based on its successful inception of social security. Paper presented at CERDI – 2nd International Conference: Health Financing in Developing Countries, 1-2 December, 2005, Clermont-Ferrand.

ILO Strategy Social Health Protection 99
Holley, J.; Akhundov, O.; Nolte, E. 2004. Health care systems in transition: Azerbaija, Copenhagen, WHO Regional Office for Europe on behalf of the European Observatory on Health Systems and Policies. (http://www.euro.who.int/Document/E84991.pdf)
Holst, J. 2003a. Esquemas de financiamiento de salud en el Paraguay. Breve descripción de los sistemas aseguradores de salud existents en el país. (Health care financing systems in Paraguay), PLANDES (Planning project for sustainable development) and Sector Project “Social health insurance in developing countries” (GTZ), Asunción/ Bonn. (http://www.gtz.de/de/dokumente/es-esquemas-salud-py.pdf)
—. 2003b. Evaluación del Bienestar Magisterial en El Salvador con la Metodología InfoSure, San Salvador, GTZ. (http://www.gtz.de/de/dokumente/es-evaluacion-bm-sv.pdf)
—. 2006. The potential of health insurance to contribute to universal coverage in health in Syria. Detection and assessment of selected health insurance schemes in the country, Mission Report 1, Result Area 6 of the HSMP: Sustainable Health Financing, Ministry of Health/Health Sector Modernisation Project, Damascus.
—. A. Brandrup-Lukanow (eds.). 2007. Extending social health protection – developing countries experiences (Eschborn, GTZ).
Hu, A. 2007. “China: Towards universal coverage by the new rural cooperative medical insurance”, in: Social protection and inclusion: Experiences and policy issues. (ILO/STEP, Geneva), pp. 125-147. (http://www3.ilo.org/public/english/protection/secsoc/downloads/1503p1.pdf)
Huber, G.; Hohmann, J.; Reinhard, K. 2003. Mutual health organization – five years experience in West Africa (GTZ, Universum Verlagsanstalt, Weisbaden).
Humba, E. 2005. Social health insurance. Implementing social security health care. The experience of the National Health Insurance Fund, paper presented at the ISSA Regional Conference for Africa, Lusaka, Zambia, 9-12 August, 2005 (ISSA, Geneva). (http://www.issa.int/pdf/lusaka05/2humba.pdf)
Instituto Ecuatoriano de Seguridad Social (IESS). 2006. Afiliados Cotizantes por Sector Económico, Regionales y Rangos de Edad, Año 2003 (IESS, Quito). (http://www.iess.gov.ec/)
Instituto de Seguridad y Servicios Sociales de los Trabajadores del Estado (ISSSTE). 2006. Población amparada por organismos. Anuario Estadístico del ISSSTE, México DF. (http://148.245.224.30/poblacion/index.htm)
Instituto Salvadoreño del Seguro Social (ISSS). 2006. Estadísticas 2004. Cuadro I: Población cubierta según categoría de asegurado, San Salvador. (http://www.isss.gob.sv/descargables.htm)
Insurance Regulatory and Development Authority (IRDA). 2006. Annual Report for the year 2004-05, Hyderabad (http://www.irdaindia.org/).
International Labour Office. 1999. More than 140 million denied access to health care in Latin America and the Caribbean. ILO/PAHO meeting aims to reduce social exclusion in the health sector, press release, Geneva. (http://www.ilo.org/public/english/bureau/inf/pr/1999/41.htm)
—. 2001. ORT Health Plus Scheme in the Province of La Union, Philippines: A case study of a community-based health micro-insurance scheme, Geneva. (http://www3.ilo.org/public/english/protection/socsec/step/download/26p1.pdf)

100 ILO Strategy Social Health Protection
—. 2002a. Extending social protection in health through community based health organizations. Evidence and challenges, discussion paper, Universitas Programme (ILO, Geneva). (http://unpan1.un.org/intradoc/groups/public/documents/APCITY/UNPAN018656.pdf)
—. 2002b. Social dialogue in the health services: Institutions, capacity and effectiveness, Geneva. (http://www.ilo.org/public/english/dialogue/sector/techmeet/jmhs02/jmhs-r.pdf)
—. 2002c. Women and men in the informal economy: A statistical picture, Geneva.
—. 2002d. Decent work and the informal economy. International Labour Conference, 90th Session, Geneva.
—. 2003. Extending maternity protection to women in the informal economy. An overview of community-based health-financing schemes, Working Paper, Geneva. (http://www3.ilo.org/public/english/protection/socsec/step/download/67p1.pdf)
—. 2003a. An inventory of micro-insurance schemes in Nepal, Kathmandu/Geneva. (http://www.ilo.org/amin/download/publ/714p1.pdf)
—. 2003c. Gender mainstreaming in technical cooperation projects: the experience of the ILO Global Programme STEP, Working Paper, Geneva. (http://www3.ilo.org/public/english/protection/socsec/step/download/70p1.pdf)
—. 2004a. A fair globalization: Creating opportunities for all, World Commission on Social Dimension of Globalization, Geneva. (http://www.ilo.org/public/english/wcsdg/docs/report.pdf)
—. 2004b. Enabling women to address their priority health concerns. The role of community-based systems of social protection, Working Paper, Geneva. (http://www3.ilo.org/public/english/protection/socsec/step/download/666p1.pdf)
—. 2004c. Financing universal health care in Thailand, A technical note to the Government, Geneva.
—. 2005. India: An inventory of micro insurance schemes. Community based schemes, Working Paper No. 2, Geneva. (http://www.ilo.org/amin/download/publ/831p1.pdf)
—. 2005a. Improving social protection for the poor: Health insurance in Ghana. The Ghana Social Trust pre-Pilot Project, Final Report, Geneva. (http://www3.ilo.org/public/english/protection/secsoc/downloads/999sp1.pdf)
—. 2005b. Economía Informal en las Américas: situación actual, prioridades de políticas y buenas prácticas. Resumen, Regional Office for Latin America and the Caribbean, Lima. (http://www.oit.org.pe/cimt/nn/documentos/economia_informal__resumen.pdf)
—. 2005c. Role of social health protection in reducing poverty: the case of Africa, ESS, Extension of Social Security, ESS Paper No. 22, Geneva.
—.2005d. Social dialogue in the health services: A tool for practical guidance. The handbook for practitioners, Geneva.
—. 2006a. Social security for all - investing in global social and economic development. A consultation, Issues in social protection, Discussion paper 16, Geneva. (http://www.ilo.org/public/english/protection/secsoc/downloads/publ/1519sp1.pdf)
ILO Strategy Social Health Protection 101
—. 2006b. Vanuatu: Report on the implementation of the Health Insurance Scheme in Vanuatu, Manila/Geneva. (http://www3.ilo.org/public/english/protection/secsoc/downloads/1215sp1.pdf)
—. 2006c. Ghana: Technical note on financial assessment of the National Health Insurance Fund, Geneva. (http://www3.ilo.org/public/english/protection/secsoc/downloads/1559sp1.pdf)
—. 2006d. The social protection perspective of micro-insurance, Geneva.
—. 2006e. Rapport d'avancement, ILO/STEP en Afrique de l'ouest, Geneva.
—. 2007. Extension of social protection in India: Yeshasvini Cooperative Farmers’ Health Scheme, Geneva, p.2.
International Labour Organization/Government of the Netherlands. 2006. Social Security for all men and women - the feasibility of extending social security coverage in Vanuatu, Project:-RAS/04/M59/NET, Subregional Initiative on Social Security in Pacific Island Countries. Suva, Fiji. (http://www3.ilo.org/public/english/protection/secsoc/downloads/1191sp1.pdf).
International Social Security System (ISSA). 2005. Social security programs throughout the world: The Americas 2005 (Washington, DC.)
—. 2006. Sustainability and effectiveness of health care delivery: National experiences of Thailand. ISSA Regional Conference for Asia and the Pacific, New Delhi, India, 21 – 23 November 2006.
—. 2006. Social security programs throughout the world: Europe 2006 (Washington, DC.).
—. 2007. Social security programs throughout the world: Africa 2007 (Washington DC.)
Jacquier, C.; Ramm, G.; Marcadent, P.; Schmitt-Diabate, V. 2006. "The social protection perspective on microinsurance", in: C. Churchill (ed.): Protecting the poor. A microinsurance compendium (ILO/Munich Re Foundation, Geneva/Munich), pp. 45-64.
Jongudosmuk, P. 2006. PowerPoint presentation: Managing rapid increase of health care coverage in Thailand: What lessons can we learn? Conference on Extending Social Health Insurance to Informal Economy Workers, Manila, Philippines.
Jütting, J. 1999. Public-private-partnership and social protection in developing countries: the case of the health sector, paper presented at the ILO workshop on “The extension of social protection”, Geneva 13-14 December 1999, Center for Development Research (ZEF), University of Bonn (http://www.oecd.org/dataoecd/32/47/2510186.pdf)
Kannan, K.P. 2006. Employment and social security for the working poor. Two major initiatives in India, paper presented at the Lisbon Conference, Lisbon, 2-3 October 2006.
Kaiser Family Foundation. 2006. The uninsured and their access to health care, Washington, DC. (http://www.kff.org/uninsured/upload/The-Uninsured-and-Their-Access-to-Health-Care-Oct-2004.pdf)
Khorolsuren, L.; Tseden, P. 2005. Health care financing and health inequality in Mongolia, paper presented at CERDI – 2nd International Conference: Health Financing in Developing Countries, 1-2 December 2005, Clermont-Ferrand.
102 ILO Strategy Social Health Protection
Krieger, S. 2006. Sozialhilfe regional 2004. Ein Vergleich aller 439 Kreise in Deutschland, Statistische Ämter des Bundes und der Länder, Statistisches Bundesamt – Zweigstelle Bonn. (http://www.statistik-portal.de/Statistik-Portal/Sozialh_Regional.pdf)
Kutzin, J. 2001. 'A descriptive framework for country-level analysis of health care
financing arrangements’ in: Health Policy, 56(3), pp. 171-204.
—. 2007. "Myths instruments and objectives in health financing and insurance" in: J. Holst and A. Brandrup-Lukanow (eds.): Extending social health protection – developing countries experiences (Eschborn, GTZ), pp. 87-95.
Kwon, S. 2002. Achieving health insurance for all: Lessons from the Republic of Korea. Extension of Social Security, ESS Paper No. 1 (ILO, Geneva). (http://www3.ilo.org/public/english/protection/secsoc/downloads/509sp1.pdf)
Lamiraud, K.; Booysen, F.; Scheil-Adlung, X. 2005. The impact of social health protection on access to health care, health expenditure and impoverishment: A case study of South Africa, Extension of Social Security, ESS Paper No. 23 (ILO, Geneva) (http://www.ilo.org/public/english/protection/secsoc/downloads/publ/1007sp1.pdf)
Löwe, M. 2006. "Downscaling, upgrading or linking? Ways to realize micro-insurance,” in: International Social Security Review, 59 (2), pp. 37–59. (http://www.blackwell-synergy.com/doi/abs/10.1111/j.1468-246X.2006.00238.x)
Maceira, D. 2005. Social protection mechanisms in health and impact of financial shocks. The Argentinean case, paper presented at Forum 9, Mumbai, India 12-16 September 2005 (Center for the Study of the State and Society (CEDES), Buenos Aires). (http://www.globalforumhealth.org/filesupld/forum9/CD%20Forum%209/papers/Bumbak%20S%20-%20Maceira%20D.pdf)
McCord, M. 2000a. Microinsurance in Uganda: A case study of an example of the partner-agent model of microinsurance provision, NHHP/FINCA Uganda – Health Care Financing Plan, MicroSave – Market-led solutions for financial services, Nairobi. (http://www.microsave.org/relateddownloads.asp?id=11&cat_id1=149&Page=Free&cat_id=104&title=Product+Innovations+%3E%3E+MicroInsurance)
—. 2000b. Microinsurance: A case study of an example of the mutual model of microinsurance provision – UMASIDA, MicroSave – Market-led solutions for financial services, Nairobi. (http://www.microsave.org/relateddownloads.asp?id=11&cat_id1=149&Page=Free&cat_id=104&title=Product+Innovations+%3E%3E+MicroInsurance)
—. 2001. Microinsurance: A case study of an example of the provider model of microinsurance provision, GRET, Cambodia. (http://www.microsave.org/SearchResults.asp?cboKeyword=39&ID=20&cmdSubmit=Submit&NumPerPage=50)
—. Osinde, S. 2002. Community health plan (“CHeaP” - Kisumu Kenya). Notes from a visit, 1-2 July 2002., the Microinsurance Centre, MicroSave – Market-led solutions for financial services, Nairobi. (http://www.microsave.org/SearchResults.asp?cboKeyword=39&ID=20&cmdSubmit=Submit&NumPerPage=50)
Mehl, P. 2005. Soziale Sicherung der Landwirte in Österreich - Modell für eine Reform des agrasozialen Sicherungssystems in Deutschland? Arbeitsberichte des Bereichs
ILO Strategy Social Health Protection 103
Agrarökonomie 03/2005, Institut für Ländliche Räume, Bundesforschungsanstalt für Landwirtschaft (FAL), Braunschweig. (http://literatur.fal.de/fallitdok_extern/bitv/zi038627.pdf)
Meimanaliev, A.-S., Ibraimova, A., Elebesov, B., Rechel, B. 2005. Health care systems in transition: Kyrgyzstan, Copenhagen, WHO Regional Office for Europe on behalf of the European Observatory on Health Systems and Policies. (http://www.euro.who.int/document/E86633.pdf)
Mesa-Lago, C. 2005. Las reformas de salud en América Latina y el Caribe: Su impacto en los principios de la seguridad social, CEPAL/GTZ, United Nations, Santiago. (http://www.eclac.cl/publicaciones/xml/8/24058/LCW63_ReformasSalud_ALC_Indice.pdf)
—. 2006a. Integración de políticas de protección social para extender la cobertura: El rol de las instituciones de seguridad social. La extension de la cobertura de salud en América Latina: problemas y políticas, paper presented at the ISSA Regional Conference for the Americas, Belize City, 28-31 May 2006. (http://www.issa.int/pdf/belize06/3mesa-lago.pdf)
— 2007. "The extension of healthcare coverage and protection in relation to the labour market: Problems and policies in Latin America," in: International Social Security Review, 60 (1), pp. 3–31. (http://www.blackwell-synergy.com/doi/abs/10.1111/j.1468-246X.2007.00258.x)
Mills, A., Bennett, S. 2002. "Lessons on the sustainability of health care funding from low-and middle-income countries", in: E. Mossialos et al. (eds.): Funding health care: options for Europe, European Observatory on Health Care Systems series (Open University Press, Buckingham), pp. 206-225. (http://www.euro.who.int/document/e74485.pdf)
Ministère de la Sécurité Sociale. 2005. Rapport général sur la sécurité sociale 2005, IGSS, Luxembourg.
Ministry of Health, Ghana. 2006. Pause….Get it right…Move on. Review of Ghana Health Sector 2005 Programme of Work, Main Sector Review Report, final draft, Government of Ghana, Accra. (http://www.moh-ghana.org/moh/docs/Report2005.pdf)
Ministry of Public Health, Lebanon. 2006. Statistics of coverage data extracted from the visa billing center at the Ministry of Health, Government of Lebanon, Beirut.
Munguía Ramírez, M. 2006. Social protection for indigenous and native populations. New strategies to extend health protection, paper presented at the ISSA Regional Conference for the Americas, Belize City, 28-31 May 2006. (http://www.issa.int/pdf/belize06/2ramirez.pdf)
Musango, L., Butera, J.D., Inyarubuga, H., Dujardin, B. 2006. "Rwanda's health system and sickness insurance schemes", in: International Social Security Review, 59 (1), pp. 93-103. (http://www.blackwell-synergy.com/doi/abs/10.1111/j.1468-246X.2005.00235.x)
Normand, C., Weber, A. 1994. Social health insurance: a guidebook for planning. (WHO/ILO, Geneva).
—. 2007. Social health insurance, A development guidebook, draft for consultation, Geneva.

104 ILO Strategy Social Health Protection
Nuri, B. 2002. In: E. Tragakes (ed.), Heath care systems in transition: Albani, Copenhagen, European Observatory on Health Care Systems, 4(6). (http://www.euro.who.int/document/E80089.pdf)
Organisation for Economic Co-operation and Development (OECD). 2001. Towards Asia’s sustainable development. The role of social protection. Paris. (http://213.253.134.43/oecd/pdfs/browseit/8102031E.PDF)
—. 2003. OECD Health Data 2003, Paris.
—. 2004. Ensuring financial sustainability of health systems, Meeting of the OECD Council at Ministerial Level, Paris, 13-14 May 2004.
—. 2005a. Health at a glance, OECD Indicators 2005, Paris. (http://www.oecd.org/document/11/0,2340,en_2649_34631_16502667_1_1_1_1,00.html)
—. 2005b. The OECD Observer, No 246-247, Volume 2004, Issue 5, Paris.
—. 2006. OECD Health Data 2006 (Update October 2006), OECD-IRDES, Paris.
—. 2006a. Decentralisation in Asian health sectors: Friend or foe? Paris.
—. 2007. OECD Health Data 2007, retrieved November 26 2007. (http://www.oecd.org/document/16/0,3343,en_2825_495642_2085200_1_1_1_1,00.html)
Ortiz, I. 2001. Strategies for improved social protection: Social protection in Asia and the Pacific, Asian Development Bank, Manila. (http://www.adb.org/Poverty/Forum/pdf/Ortiz.pdf)
Pal, K.; Behrendt, C.; Leger, F.; Cichon, M.; Hagemejer, K. 2005. Can low income countries afford basic social protection? First results of a modelling exercise, Issues in Social Protection, Discussion Paper 13 (ILO, Geneva). (http://www3.ilo.org/public/english/protection/secsoc/downloads/1023sp1.pdf)
Panamerican Health Organization. 2007. Health in the Americas 2007. WHO, Copenhagen. (http://www.paho.org/hia/vol2paisesing.html)
Papadopoulos, H. 2006. Women and social safety nets in Lebanon. Background paper, Active Citizenship and Gendered Social Entitlements (ACGEN), Collective for Research and Training on Development (CRTD), Beirut. (http://crtd.org/acgen/pdf/Background%20Report%20on%20Women%20and%20Social%20Safety%20Nets%20in%20Lebanon.pdf)
Perry, G., Arias, O., López, H., Maloney, W., Servén, L. 2006. Poverty reduction and growth: Virtuous and vicious circles (World Bank, Washington, DC.). (http://siteresources.worldbank.org/EXTLACOFFICEOFCE/Resources/870892-1139877599088/virtuous_circles1_complete.pdf)
PhilHealth. 2006a. PhilHealth – Your partner in health, sponsored program (http://www.philhealth.gov.ph/sponsored.htm)
—. 2006b. PhilHealth – Stats & Charts, 1st Semester 2004. (http://www.philhealth.gov.ph/stats&charts/stats2004.pdf)
Poursat, C. 2004. BIM: Micro-assurance santé et microfinance: quels liens? L’exemple du projet microassurance du Gret au Cambodge, Global Information on Micro Insurance (GIMI) (ILO, Geneva).

ILO Strategy Social Health Protection 105
(http://www.ilo.org/gimi/RessShowRessource.do?ressourceId=297&longTitle=default&author=default&ressYear=0000)
Preker et al. 2002a. "Effectiveness of community health financing in meeting the cost of illness", in: Bulletin of the World Health Organization (Geneva, WHO), 80(2), pp. 143-150. (http://www.scielosp.org/pdf/bwho/v80n2/a10v80n2.pdf)
—. 2002b. "Rich-poor difference in health financing,” in: D. Dror and A. Preker (eds.): Social reinsurance: A new approach to sustainable community health financing (World Bank/ILO, Washington, DC.), pp. 21-36. (http://www1.worldbank.org/publications/pdfs/15041intro.pdf)
Rodríguez, M.; Miranda, B. 2004. Serviperú Perú. CGAP Working Group on Microinsurance, Good and bad practices, Case study No. 1. (http://www.microfinancegateway.com/files/22462_file_SERVIPER_.pdf)
Ron, A.; Scheil-Adlung, X. (eds.). 2001. Recent health policy innovations in social security, ISSA (Transaction Publishers, New Jersey).
Sachs, J. 2001. Macroeconomics and health: Investing in health for economic development, Report of the Commission on Macroeconomics and Health (WHO, Geneva).
Scheil-Adlung, Xenia. 2001. "Healthy markets - sick patients? Effects of recent trends on the health care market," in: X. Scheil-Adlung (ed.) Building social security: The challenge of privatization, ISSA (Transaction Publishers, New Jersey).
—. 2004. Indonesia: Advancing social health protection for the poor (UNSFIR/ILO Jakarta).
—. Jütting, J.; Xu K.; Carrin G. 2006. What is the impact of social health protection on access to health care, health expenditure and impoverishment? A comparative analysis of three African countries, Discussion paper number 2 (WHO, Geneva).
—. Xu, K.; Carrin, G.; Jütting, J. 2007. "Social health protection, poverty reduction and access to care. A comparative study on Kenya, Senegal and South Africa,” in: J. Holst and A. Brandrup-Lukanow (eds.): Extending social health protection – developing countries e xperiences (Eschborn, GTZ).
Schmidt, J.-O. et al. 2005. Linking up social protection systems in developing countries. Overview of some experiences and approaches (Eschborn). (http://www.gtz.de/de/dokumente/en-linking-up-social-protection-systems.pdf)
Schwefel, D. 2006a. Towards a framework for sustainable health financing in Syria. Third batch of advices on implementing the annual plan 2005 for health economics and health financing within the Health Sector Modernisation Programme, Mission Report, Result Area 6 of the HSMP: Sustainable Health Financing, Ministry of Health/Health Sector Modernisation Project, Damascus.
—. 2006b. Towards a framework for sustainable health financing in Syria. Fourth batch of advices on implementing the annual plan 2005 for health economics and health financing within the Health Sector Modernisation Programme. Mission Report, Result Area 6 of the HSMP: Sustainable Health Financing, Ministry of Health/Health Sector Modernisation Project, Damascus.
—. Holst, J. et al. 2005. Towards a national health insurance system in Yemen. Situation assessment and proposals for health insurance, Part 1: Background and assessments. Study Report of a joint GTZ-WHO-ILO mission in Yemen, 2005 (Sana’a/Eschborn).

106 ILO Strategy Social Health Protection
(http://www.gtz.de/de/dokumente/en-health-insurance-assessments-ye.pdf; www.who.int/entity/health_financing/countries/yemen_en1-1_9-front_execsum.pdf)
Sheikhzadeh,Y., Vahidi, R.G., Seth, V.K. 2005. An investigation on the oil income elasticity of health care expenditures during 1979-2004 and lost and faulty links of flow of funds in the health care system of Iran, paper presented at CERDI – 2nd International Conference: Health financing in developing countries, 1-2 December 2005, Clermont-Ferrand.
Sinha, S.; Vima SEWA team. 2002. Strength in solidarity: Insurance for women workers in the informal sector (Gujarat, SEWA).
Spitzenverbände der Landwirtschaftlichen Sozialversicherung. 2005. Jahresberichte 2004, Kassel. (http://www.lsv.de/verbaende/05orga/07jahresberichte/04-2004.pdf)
Statistisches Bundesamt (Federal Statistical Office). 2003. 40 Jahre Sozialhilfe in Deutschland, Wiesbaden, Berlin.
Statistik Austria. 2006. Statistisches Jahrbuch, Vienna. (http://www.statistik.at)
Surasinangsang. 2004. The annual report of the private insurance in Thailand, 2002.
Swiss Agency for Development Cooperation (SDC). 2003. Views of the poor, Dar es Salaam (Direktion für Entwicklung und Zusammenarbeit – Deza).
Tang, S., Cheng, X., Xu, L. 2007. "Developing urban social health insurance in a rapidly changing economy of China: Problems and challenges", in: J. Holst and A. Brandrup-Lukanow (eds.): Extending social health protection – developing countries experiences (Eschborn, GTZ), pp. 32-41.
Tien, T. V. 2007. "The inclusion of the poor in a social health insurance framework: The strategies applied in Viet Nam" in: J. Holst and A. Brandrup-Lukanow (eds.): Extending social health protection – developing countries experiences (Eschborn, GTZ), pp. 63-70.
Titelman, D., Uthoff, A., Jiménez, L.F. 2000. "Toward new social security systems in the 21st century: universal coverage is impossible without cohesion in financing”, in: Revista Panamericana de Salud Pública, 8(1/2), pp. 112-117. (http://www.scielosp.org/pdf/rpsp/v8n1-2/3010.pdf)
Unni, J.; Rani, U. 2002. Social protection for informal workers: Insecurities, instruments and institutional mechanisms (ILO, Geneva).
Unidad de Análisis de Políticas y Sociales y Económicas. 2006. Bolivia, Evaluación de Impacto de los Seguros de Maternidad y Niñez en Bolivia 1989–2003 (UDAPE/UNICEF, La Paz). (http://www.udape.gov.bo/docsociales/Seguros.pdf)
United Nations Development Programme (UNDP). 1997. Human Development Report 1997, Human development to eradicate poverty, New York.
—. 2006. Human Development Report 2006, Beyond scarcity: power poverty and the global water crisis, New York.
USAID/PHRPlus. 2006. Approaches to scaling up community-based health financing schemes, Primer for policy makers, the Partners for Health Reformplus Project, Abt Associates Inc., Bethesda, Maryland, Washington, DC. (http://www.phrplus.org/Pubs/prim2.pdf)

ILO Strategy Social Health Protection 107
US Census Bureau. 2007. The 2007 Statistical Abstract, Health & Nutrition: Medicare, Medicaid, National Data Book, Washington, DC. (http://www.census.gov/compendia/statab/health_nutrition/medicare_medicaid/)
Vásquez, E.; Mendizabal, E. 2001. "Social protection policies and challenges in Latin America," in: Cooperation South Journal, No. 2, pp. 4-30. (http://tcdc.undp.org/coopsouth/2001_2/4-30.pdf)
van Ginneken, W. 2000. India - social protection for the unorganized sector. (ILO, Geneva).
—. 2005. Etendre la sécurité sociale: politiques pour les pays en développement, Extension de la Sécurité Sociale, Document ESS No. 13 (ILO, Geneva) (http://www.ilo.org/gimi/RessShowRessource.do?ressourceId=168&longTitle=default&author=default&ressYear=0000)
Waelkens, M-P., Criel, B. 2004. Les Mutuelles de Santé en Afrique Sub-Saharienne. État des Lieux et Réflexions sur un Agenda de Recherche, Health, Nutrition and Population (HNP) Discussion Paper, World Bank, Washington, DC. (http://siteresources.worldbank.org/HEALTHNUTRITIONANDPOPULATION/Resources/281627-1095698140167/Waelkens-LesMutuelles-whole.pdf)
Wang, L., Bales, S., Zhang, Z. w.y. China’s social protection schemes and access to health services: A critical review, draft World Bank publication, Washington, DC. (http://siteresources.worldbank.org/INTEAPREGTOPHEANUT/Resources/502734-1129734318233/safetynetandhealth_correctauthor.pdf)
Witter S. 2002. Health financing in developing and transitional countries, briefing paper for OXFAM GB (University of York, York). (http://projects.ics.hawaii.edu/strev/ics614/files/health%20financing%20methods%20-%20oxfam%5B1%5D.pdf)
World Bank. 2004. A better investment climate for everyone, World Development Report 2005 (World Bank; Oxford University Press. Washington, DC., New York, NY) (http://siteresources.worldbank.org/INTWDR2005/Resources/complete_report.pdf)
—. 2005. Equity and development. World Development Report 2006, Washington, DC. (http://siteresources.worldbank.org/INTWDR2006/Resources/477383-1127230817535/ 082136412X.pdf)
—. 2006b. Disease control priorities in developing countries (2nd edition). Oxford University Press, New York, NY.
World Health Organization (WHO). 2000. The World Health Report 2000 - Health systems: Improving performance, Geneva. (http://www.who.int/whr/2000/en/)
—. 2003. National Health Data, Geneva.
—. 2004a. Social Health Insurance, Report by the Secretariat, Executive Board EB115/8, 115th Session, 2 December 2004, Provisional agenda item 4.5, Geneva. (http://www.who.int/gb/ebwha/pdf_files/EB115/B115_8-en.pdf)
—. (ed.). 2004b. Regional overview of social health insurance in South-East Asia, SEA-HSD-274 Regional Office for South-East Asia, New Delhi. (http://www.searo.who.int/LinkFiles/Social_Health_Insurance_HSD-274.pdf)

108 ILO Strategy Social Health Protection
—. 2004c. Western Pacific. Country Health Information Profiles, 2004 Revision, Regional Office for the Western Pacific, Manila. (http://libdoc.who.int/publications/2004/9290611693.pdf)
—. 2004d. GTZ/ ILO / KfW / DFID Compendium of technical mission reports on social health insurance development, Geneva.
—. 2005. Social Health Insurance, selected case studies, Manila, New Delhi.
—. 2005a. WHO/AFRO Report to the Regional Committee Meeting, Maputo.
—. 2006. The World Health Report 2006: Working together for health, Geneva (http://www.who.int/whr/2006/whr06_en.pdf)
—. National Health Accounts (various years).
Xu, K.; Evans, D.; Kawabata, K.; Zeramdini, R.; Klavus, J.; Murray, C. 2003. "Household catastrophic health expenditure: a multicountry analysis," in: The Lancet, Vol. 362, pp. 111–117. (http://www.who.int/health_financing/Lancet%20paper-catastrophic%20expenditure.pdf)
Yamabana, H. 2005. New approaches to extending social security coverage. Overview and challenges of social security coverage: Country examples in East Asia, paper presented at the ISSA Meeting of Directors of Social Security Organizations in Asia and the Pacific, Seoul, 9-11 November 2005 (ISSA, Geneva). (http://www.issa.int/pdf/seoul05/2yamabana.pdf)
Yang, B.; Holst, J. 2007. "Implementation of health insurance in developing countries: Experience from selected Asian countries,"in: J. Holst and A. Brandrup-Lukanow (eds.): Extending social health protection – developing countries experiences (Eschborn, GTZ), pp. 158-167.