illinois tax data and state comparisons · illinois tax data and state comparisons illinois...
TRANSCRIPT

ILLINOIS TAX DATA AND STATE COMPARISONS
ILLINOIS DEPARTMENT OF REVENUE
February 5th, 2014
1

Revenue By Source
Source FY 2014 Estimate Percent of Total
Individual Income
Taxes $16,301 44.4%
Corporate Income
Taxes $3,317 9.0%
Sales Taxes $7,610 20.7%
Public Utilities $1,006 2.7%
Gaming and
Lottery $996 2.7%
Other Sources $3,382 9.2%
Federal Sources $4,113 11.2%
Total $36,725
2
Individual Income Taxes
44%
Corporate Income Taxes
9%
Sales Taxes 21%
Public Utilities
3%
Gaming and Lottery
3% Other
Sources 9%
Federal Sources
11%
FY 2014 Estimate

Types of Business in Illinois
• Every business that earns or receives income in Illinois must file a business income tax return
Number of Filers by Entity Type
Tax Year C-Corporations S-Corporations Partnerships Total
2011 109,235 242,428 115,487 467,150
2010 109,525 236,436 112,702 458,663
2009 112,918 235,992 110,716 459,626
Percent of Filers by Entity Type
Tax Year C-Corporations S-Corporations Partnerships Total
2011 23.4% 51.9% 24.7% 100.0%
2010 23.9% 51.5% 24.6% 100.0%
2009 24.6% 51.3% 24.1% 100.0% 3

Comparison States
Border States
Manufacturing States
Sunbelt and Other States
Indiana Indiana Arizona
Iowa Iowa Florida
Missouri Louisiana South Carolina
Wisconsin Minnesota California
Kentucky North Carolina Georgia
Ohio Pennsylvania
Oregon New York
Texas
Wisconsin
4

Individual Income Taxes
Of the 19 states surveyed:
3 have a flat rate: Illinois, Indiana, and Pennsylvania
14 have graduated rates
2 have no individual income tax: Florida and Texas
(Florida has an intangible tax on investments)
5

STATE INDIVIDUAL INCOME TAX COMPARISON
Tax Rate as of January 1, 2013
STATES
Federal Adjusted Gross
Income as Starting Point
to Calculate State Taxable
income
TAX RATE
RANGE
Numb
er INCOME BRACKETS FOR
SINGLE
Note
(in percents) of
Low High
Brack
ets
Lowest Highest
ARIZONA adjusted gross income 2.6 - 4.5 5.0 0 - 10,000 (b) - $15,0001 or above (b) CALIFORNIA (a) adjusted gross income 1.0 12.3 (f) 9.0 0 - 7,582 (b) - $508,500 or above (b) FLORIDA No State Income Tax GEORGIA adjusted gross income 1.0 - 6.0 6.0 0 - 750 (h) - above $7,000 (h) ILLINOIS adjusted gross income 5.0 1.0 -----Flat rate----- INDIANA adjusted gross income 3.4 1.0 -----Flat rate----- IOWA (a) adjusted gross income 0.4 - 9.0 9.0 0 - 1,494 - above $67,230 KENTUCKY adjusted gross income 2.0 - 6.0 6.0 0 - 3,000 - above $75,000 LOUISIANA adjusted gross income 2.0 - 6.0 3.0 0 - 12,500 (b) - above $50,000 (b) MINNESOTA (a) taxable income 5.4 - 9.9 4.0 0 - 24,270 (l) - $150,000 or above (l) MISSOURI adjusted gross income 1.5 - 6.0 10.0 0 - 1,000 - $9001 or above NEW YORK adjusted gross income 4.0 - 8.8 8.0 0 - 8,200 (b) - above $1,029,250 (b) NORTH CAROLINA taxable income 6.0 - 7.8 3.0 0 - 12,750 (p) - $60,000 or above (p) OHIO (a) adjusted gross income 0.5 5.4 9.0 0 - 5,200 - $208,500 or above OREGON (a) taxable income 5.0 - 9.9 4.0 0 - 3,250 (b) - $125,000 or above (b) PENNSYLVANIA taxable income (as defined by state) 3.1 1.0 -----Flat rate-----
SOUTH CAROLINA (a) taxable income 0.0 - 7.0 6.0 0 - 2,850 - $14,250 or above TEXAS No State Income Tax WISCONSIN (a) adjusted gross income 4.6 - 7.8 5.0 0 - 10,750 (v) - $236,600 or above (v) Sources: Federation of Tax Administrators, Tax Foundation, CCH State Tax Handbook, Thomson Reuters/Tax & Accounting, Retirement Living Information Center, Inc., National Conference of State Legislatures, http://www.taxcreditsforworkingfamilies.org/, Individual state tax and revenue departments,
(a) 17 states have statutory provision for automatically adjusting to the rate of inflation the dollar values of the income tax brackets, standard deductions, and/or personal exemptions. (b) For joint returns, taxes are twice the tax on half the couple’s income.
(f) California imposes an additional 1% tax on taxable income over $1 million, making the maximum rate 13.3% over $1 million. (h) The Georgia income brackets reported are for single individuals. For married couples filing jointly, the same tax rates apply to income brackets ranging from $1,000, to $10,000. (l) The income brackets reported for Minnesota are for single individuals. For married couples filing jointly, the same tax rates apply to income brackets ranging from $35,480, to $140,961. (p) The income brackets reported for North Carolina are for single individuals. For married taxpayers filing jointly, the same tax rates apply to income brackets ranging from $21,250, to $100,000. (v) The Wisconsin income brackets reported are for single individuals. For married taxpayers filing jointly, the same tax rates apply income brackets ranging from $14,330, to $315,460.
6

In addition, some of the states permit local income taxes (may be designated wage taxes, income taxes, payroll taxes, local services taxes, and occupational privilege taxes):
In Tax Year 2011: In California, San Francisco 1.50% (imposed on employer) In Kentucky, 75 counties and 143 municipalities (largest -2.5%) In Ohio, 593 of Ohio's 932 municipalities and 181 of Ohio's 611 school districts
Examples: Columbus 2.5%, Youngstown 2.75% In New York:
• New York City 2.907% - 3.876% • New York City Metropolitan Transportation Authority (MTA) 0.34% (imposed
on employers) • New York-New Jersey Waterfront (employers of port personnel) 2.00%
(imposed on employers) • Yonkers 15% of net state tax
In Missouri, Kansas City and St. Louis had 1% income tax rates. In Oregon, two transit districts imposed an income tax on employers (0.0067% and
0.6918%) In Pennsylvania, 2,492 of Pennsylvania's 2,562 municipalities and 469 of
Pennsylvania's 500 school districts impose a local income tax or local services tax. Examples: Philadelphia 3.928%; Pittsburgh 3.00% plus $52 per year
Source: Tax Foundation
7

Standard deduction itemized deductions capital gains
ARIZONA Single-4,833; married-9,665 Allowed, specific deductions for medical expenses,
caualty and theft losses,charitable gifts, student
expenses, interest, long-term care, state taxes, and
college tuition expenses
CALIFORNIA single-3,841; married-7,682 Allowed, but with adjustments for state and foreign
income taxes, federal estate taxes, interest, and other
items.
FLORIDA
GEORGIA single-2,300; married-3,000 Allowed but with adjustments for state taxes and
expenses connected with exempt income.
ILLINOIS Not allowed
INDIANA Not allowed
IOWA Single-1,900; married-4,670 Allowed, but with adjustments for state taxes, charitable
mileage, and oher items. Can deduct federal income tax.
KENTUCKY single-2,290; married-2,290 Allowed, but with adjustments for state taxes, charitable
contributions, and other items.
LOUISIANA Filer can deduct that portion of federal itemized
deductions exceeding the federal standard deduction
amount. Can deduct federal income tax.
MINNESOTA single-5,950; married-11,900 Allowed, but with adjustments for state tax.
MISSOURI single-6,100; married-12,200 Allowed, but with adjustments for state taxes and
cultural contributions. Limited deduction for federal
income taxes. Deduction for other specified federal
taxes.
NEW YORK single-7,700; married-15,400 Allowed, but with adjustments for state taxes, foreign
income taxes, interest, and other items. Taxpayers can
itemize for N.Y. purposes only if they itemize on their
federal returns.
NORTH CAROLINA single-3,000; married-6,000 Allowed, but with adjustments for state taxes
OHIO single-2,205; married-4,055 Not allowed. Allowed adjustments for some items.
OREGON Allowed, but with adjustments for state tax, medical
expenses, and other items. Limited deduction allowed
for federal income tax.
PENNSYLVANIA n/a Not allowed. Unreimbursed employee business expenses
and employee educational expenses can be deducted.
SOUTH CAROLINA single-6,100; married-6,100 Allowed, but with adjustments for state tax and other
items.
Individuals are allowed a deduction from South
Carolina taxable income equal to 44% of the net capital
gain recognized in South Carolina.
TEXAS
WISCONSIN single-9,930; married-
17,880***
Credit allowed based on 5% of difference between
allowable federal itemized deductions and Wisconsin
standard deduction.
In 2013 a deduction for 30% of the net capital gain
from assets held more than one year is allowable when
computing Wisconsin taxable income(60% of net
capital gain on farm assets). Another difference
results in 2013 because of the $500 limit on the
Wisconsin deduction for capital losses.
***The standard deduction phases out by 12% at $14,069 for single and 19.778% at $17,880 for married filing joint. The standard deduction phases out to zero at $97,069 for single, $110,493 for joint.
VARIOUS DEDUCTIONS
8

Individual Income Tax Credits
• Credits directly reduce the taxpayers liability since a taxpayer applies them after multiplying taxable income by the applicable tax rate. The surveyed states offer a wide range of credits.
9

Examples of various income tax credits
For Tax Year 2011
Arizona tax credits Indiana tax credits Louisiana tax credits Missouri tax credits
• Clean election fund tax credit • College donation • Bulletproof vest • Affordable housing assistance
• Contributions to charities that assist the working poor • Community revitalization enhancement district • Child care • Children in crisis
• Contributions to private school tuition organizations • Contributions made to college choice 529 education • Contributions of technological equipment to • Family development account
• Donation of school site savings plan educational institutions • Food pantry
• Donations to the Military Family Relief Fund • County credit for the elderly or permanently disabled • Conversion of vehicle to alternative fuel • Health care access
• Family income tax credit • Earned income tax credit • Disabilities • Historic preservation
• Fees paid and certain contributions to public schools • Historic building rehabilitation and residential historic • Earned income tax credit • Income taxes paid to other states
• Income taxes paid to other states/countries rehabilitation • Education • Maternity home
• Increased excise taxes • Income taxes paid to other states and localities • Family responsibility programs • Pregnancy resource
• Investment in qualified small businesses • Individual development account • Historic residential/historic structures • Property tax
• Property tax/rent • Lake County residential income tax • Household expense for physically and mentally • Public safety officer surviving spouse
• Solar energy devices • Maternity home incapable persons • Residential dwelling accessibility
• Neighborhood assistance • Hunting & fishing license fees for the military • Self-employed health insurance
• Scholarship program • Income taxes paid to other states • Shared care for the elderly
• Unified tax credit for elderly • Law enforcement education • Shelter for victims of domestic violence
• Venture capital investment • LA citizens property insurance assessments • Special needs adoption
• Organ donation • Youth opportunities
• Partial federal credits (elderly, foreign tax,
investment tax, residential energy, and jobs)
• Small town doctor/dentist
• School readiness
• Wind and solar energy systems
Source: Individual Income Tax Provisions in the States; Wisconsin Legislative Fiscal Bureau -January,
2013
10

The amount of a credit may differ per taxpayer depending on household income and may be refundable. EITC; refundable? Child tax credit Child and dependent care tax credit
ARIZONA
CALIFORNIA “Dependent Exemption Credit” or “Dependent Tax Credit”
For 2012, the maximum credit is $309 per dependent. The credit is
reduced for higher-income taxpayers.
Not refundable.
Tax Credit for Child and Dependent Care Expenses
The state credit varies based on the income of the filer.
Filers earning less than $40,000 may claim 50 percent of the federal credit.
Filers earning between $40,001 and $70,000 may claim 43 percent of the federal credit.
Filers earning between $70,001 and $100,000 may claim 34 percent of the federal credit.
All other filers earning more than $100,000 are ineligible for the state credit.
not refundable
FLORIDA
GEORGIA Georgia has a low-income tax credit for individuals
with an income below $20,000.
30 percent of the federal child and dependent tax credit up to $315 for one child and $630
for two more more children. Note refundable
ILLINOIS 10 percent of federal EITC; yes
INDIANA 9 percent of federal EITC; yes
IOWA 14 percent of federal EITC; yes The formula for the Iowa Child and Dependent Credit is calculated as a percentage of the
provided federal Child and Dependent Care Credit. The percentage varies based on the
income of the filer.
Income (Percentage of Federal Credit)
<$10,000 (75%)
$10,000-$19,999 (65%)
$20,000-$24,999 (55%)
$25,000-$34,999 (50%)
$35,000-$39,999 (40%)
$40,000-$44,999 (30%)
≥$45,000 (Zero)
Refundable
KENTUCKY Filers may claim a credit equal to 20 percent of their federal credit, not to exceed the
filer’s tax liability, up to $210 for one child and $420 for two or more children. Not
refundable. Kentucky also has a Family Size Tax Credit is based on modified gross income
(MGI) and the size of the family.
LOUISIANA 3.5 percent of federal EITC; yes Filers receive a percentage of the federal credit, with the specific percentage calculated
based on the filer’s income.
Income Percentage of the federal credit
≤$25,000 50 percent
$25,001-$35,000 30 percent
$35,001-$60,000 10 percent
>$60,000 10 percent, not to exceed 25 dollars
Refundable: Yes for filers with income below $25,000. No for all others. Louisiana has
two additional credits. One for care of a child under age six at a child care facility rated
two stars or higher by the state quality rating system. The credit is also refundable for
filers with income below $25,000; the maximum for one child is $1,050, for two or more
children $2,100. The second credit is for dependents “physically or mentally incapable of
self-care.” It is not refundable; the maximum credit for one child is $1,050, for two or
more children $2,100.
MINNESOTA Based on a formula in state statute, the Minnesota
Working Familiy Credit for tax filers with children
can range from 25 percent to 45 percent of the
federal credit. Taxpayers with no children can
receive a 25 percent credit . Maximum credit $973
if one qualifying child; $1,879 for two or more
qualifying children
100 percent of federal credit, not to exceed certain limitations:
-Filers with income up to $18,040 are limited to $720 for one qualifying child.
-Filers with income up to $18,040 and two or more qualifying children may claim up to
$1,440.
-Filers with income over $18,040, the credit is reduced by $18 for every $350 of income for
filers with one qualifying child and $36 for every $350 of income for filers with two or
more qualifying children.
Refundable
MISSOURI
11

NEW YORK 30 percent of federal EITC; In addition to the state
credit, New York City offers its own EITC which is
calculated as 5 percent of the federal credit.
33 percent of the filer’s federal child credit or $100 per qualifying
child. Filers with income above $75,000 ($110,000 for couples)
must use the percentage formula. Refundable
Filers with New York AGI below $25,000 (including negative income) may claim up to 110
percent of the federal child and dependent care credit. Filers earning NY AGI $25,001-
$39,999 may claim between 109 and 100 percent of the federal credit. Filers earning NY
AGI $50,001-$64,999 may claim 100 percent of the federal credit. Filers earning NY AGI
$65,000 or more may claim 20 percent of the federal credit. Refundable for in-state
residents.
NORTH CAROLINA 4.5% of federal EITC for 2013; 0 percent thereafter;
yes
Residents who are entitled to claim the federal Child Tax Credit
may claim a ”Credit for Children” of $100 on the State return if
their adjusted gross income is less than:
-$100,000 for married filing jointly
-$80,000 for head of household
-$60,000 for single
-$50,000 for married filing separately
They may claim a credit of $125 if their adjusted gross income is
less than:
-$40,000 for married filing jointly
-$32,000 for head of household
-$20,000 for single or married filing separately
OHIO 5% of federal EITC; limited to 50 % of liability for
Ohio Taxable Income above $20,000
Filers must have income below $40,000. Any expenses that qualify for the federal credit
also qualify for the Ohio credit.
For filers earning less than $20,000, the credit is equal to 100 percent of qualifying
expenses. For filers earning between $20,000 and $40,000, the credit equals 25 percent of
qualifying expenses.
OREGON 6% of federal EITC; yes Filers are eligible for the Child and Dependent Care Credit if they are eligible for the
federal credit, except that the household income must be under $45,000. Filers may
claim a percentage of the federal credit for expenses allowed for the federal credit on
their Oregon tax return. The percentage varies based on the filer’s income. Incomes above
$45,000 are ineligible.
Income (Percentage of the federal credit)
≤ $5,000 (30%)
$5,001-$10,000 (15%)
$10,001-$15,000 (8%)
$15,001-$25,000 (6%)
$25,001-$35,000 (5%)
$35,001-$45,000 (4%)
The state also has a Working Family Child Care Credit if filers have at least $8,400 of
earned income. The credit also varies depending on household size and income:
Refundable
PENNSYLVANIA
SOUTH CAROLINA 7 percent of eligible expenses; not refundableTEXAS
WISCONSIN Number of qualifying children EITC rate (% of
federal)
1 4%
2 11%
3 or more 34%
The state does not offer a credit to individuals
without children.
12

Fiscal Year 2012 IIT Tax Expenditure Report
$ thousands
Expenditure*: FY12
Federally taxed retirement and social security subtractions $1,962,688
Standard exemption: taxpayers and dependents $1,035,906
Tax credit for residential real property taxes $554,929
Earned income tax credit $105,802
Education expense credit $79,605
Military pay subtraction $47,663
Additional exemptions: blind and elderly $32,111
Other tax credits and subtractions $97,161
Total impact $3,915,865
* Based on Tax Year 2011 IL-1040 return data.
13

CORPORATE INCOME TAXES AND PERSONAL PROPERTY TAXES
ILLINOIS DEPARTMENT OF REVENUE
14

Rate Structure
• 15 States have multiple rates
• Illinois has a flat rate structure, like 29 other states and D.C.
15

How Illinois’ Top Rate Compares to Other States
*Ohio and Texas have business taxes which are not directly comparable to corporate income taxes
12.00
9.99 9.80
8.84
8.00 7.90 7.60 7.50
7.10 6.97 6.90
6.25 6.00 6.00
5.50
5.00
0.00
2.00
4.00
6.00
8.00
10.00
12.00
Top
Co
rpo
rate
Tax
Rat
e
CIT
= 7
.0
PP
RT
= 2
.5
16

Personal Property Taxes
• Constitution of 1970 eliminated personal property tax is in Illinois.
• Personal Property Replacement Tax – 2.5% rate on C-Corp Net Income, 1.5% on S-Corps, Partnerships, and Trusts
• Two other (smaller) replacement taxes are levied on public utilities
17

Personal Property Taxes, continued
• Illinois is one of 9 states without a personal property tax (PPT)
• Among our neighbors only Iowa doesn’t have a PPT
• Other states generate significant amounts of revenue from the PPT
• Missouri state and local governments get 6.8% of own-source revenue from PPT, Indiana 1.8%
• SOURCE: Tax Foundation, “States Moving Away from Personal Property
Taxes”. October 2012 http://taxfoundation.org/sites/taxfoundation.org/files/docs/bp63.pdf
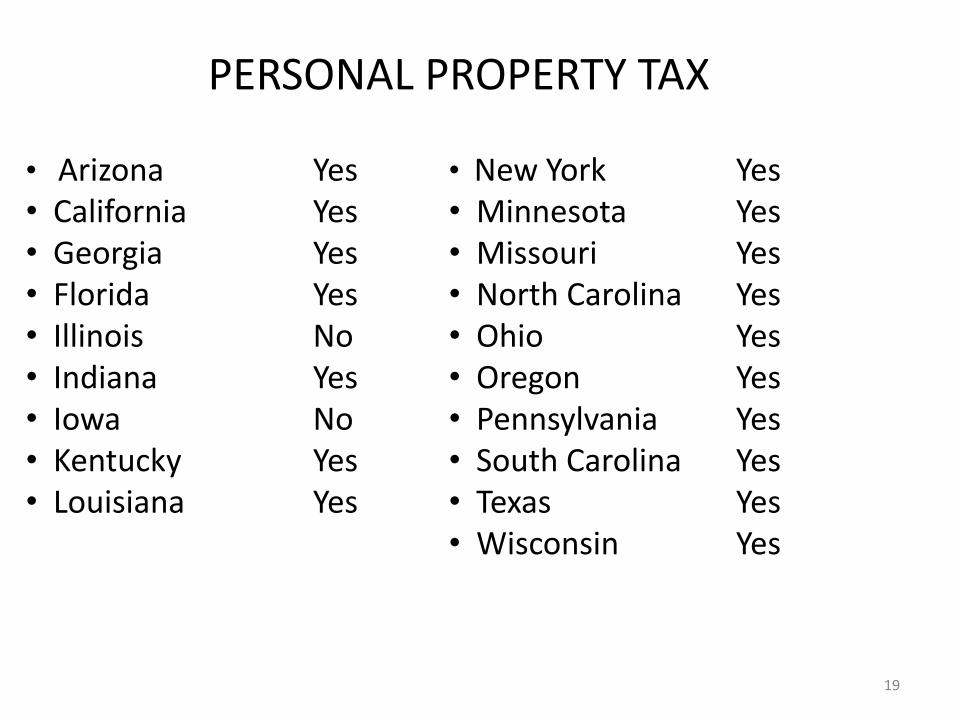
• New York Yes • Minnesota Yes • Missouri Yes • North Carolina Yes • Ohio Yes • Oregon Yes • Pennsylvania Yes • South Carolina Yes • Texas Yes • Wisconsin Yes
• Arizona Yes • California Yes • Georgia Yes • Florida Yes • Illinois No • Indiana Yes • Iowa No • Kentucky Yes • Louisiana Yes
PERSONAL PROPERTY TAX
19

Apportionment Factor
• Income earned by multi-state companies must be apportioned for tax purposes
• Illinois generally uses Illinois sales divided by total US sales to apportion income (single sales factor)
20

Apportionment in Other States
• 21 States use single sales factor apportionment
• 9 states use 33% sales, 33% property, 33% payroll
• Others are in between or do not have a corporate income tax
21
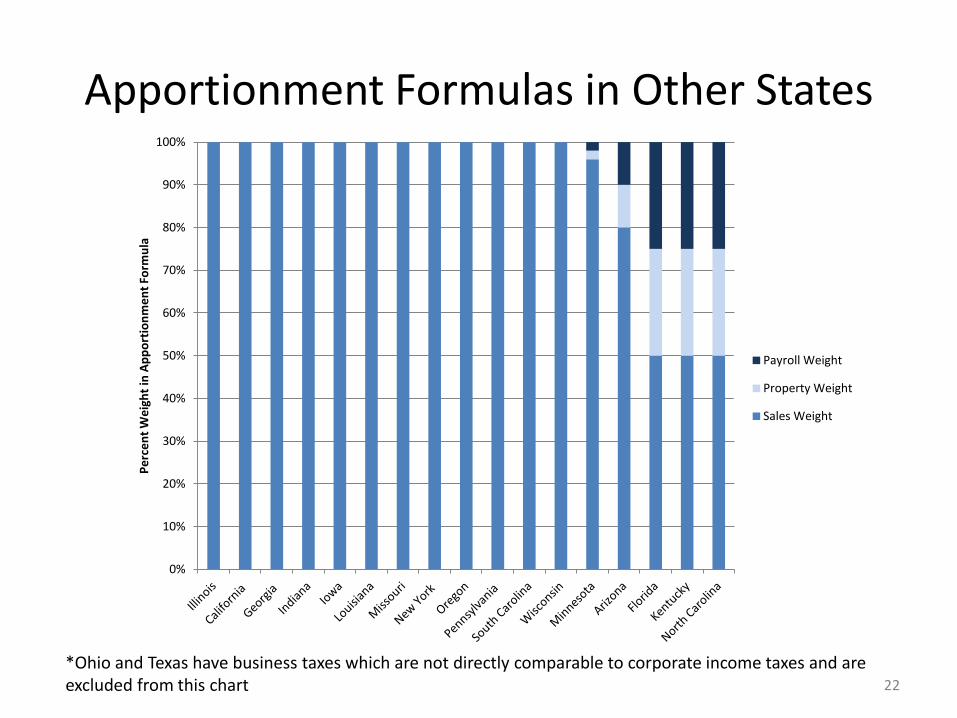
Apportionment Formulas in Other States
0%
10%
20%
30%
40%
50%
60%
70%
80%
90%
100% P
erc
en
t W
eig
ht
in A
pp
ort
ion
me
nt
Form
ula
Payroll Weight
Property Weight
Sales Weight
*Ohio and Texas have business taxes which are not directly comparable to corporate income taxes and are excluded from this chart 22

Note about Single Sales Factor Apportionment in Illinois
• If Company A makes widgets in Illinois and sells 75 percent to Illinois customers and 25 percent to Indiana customers, then 75 percent of Company A’s base income is apportioned to Illinois.
• If Company A moves to Indiana and continues to sell 75 percent of their widgets to Illinois customers and 25 percent to Indiana customers, then 75 percent of Company A’s base income is still apportioned to Illinois.
23

Alternative Business Tax Structures
State Tax Name Tax Rate How Income is Sourced
Ohio Commercial Activity
Tax 0.26%
Goods: Where property is
received
Services: Where most of
the benefit was received
Washington Business and
Occupation Tax
0.1% for certain
manufacturers
to 1.5% for most
services
Goods: Where property is
received
Services: 50% payroll /
50% “service income” factor
New Hampshire Business Enterprise
Tax 0.75%
Goods: Where property is
received
Services: Where cost of
performance is greatest
Texas Gross Margin Tax 0.5% for retail/
wholesale,
1.0% for others
Gross Receipts apportioned
based on Gross Receipts in
Texas / Gross Receipts in
US

Major Corporate Income Tax Expenditures
Expenditure* Amount ($ millions)
EDGE Credit $45.1
R&D Credit $30.7
Film Credit $18.8
Enterprise Zone Credit $17.9
Affordable Housing Credit $8.5
*Preliminary Department of Revenue tax expenditure data. Estimates based on tax returns from Tax Year 2011. For a detailed explanation of these and other credits refer to the Tax Expenditure Report included in the support documentation provided to the committee.
25

CORPORATE FRANCHISE TAX ILLINOIS DEPARTMENT OF REVENUE
26
Illinois Corporate Franchise Tax
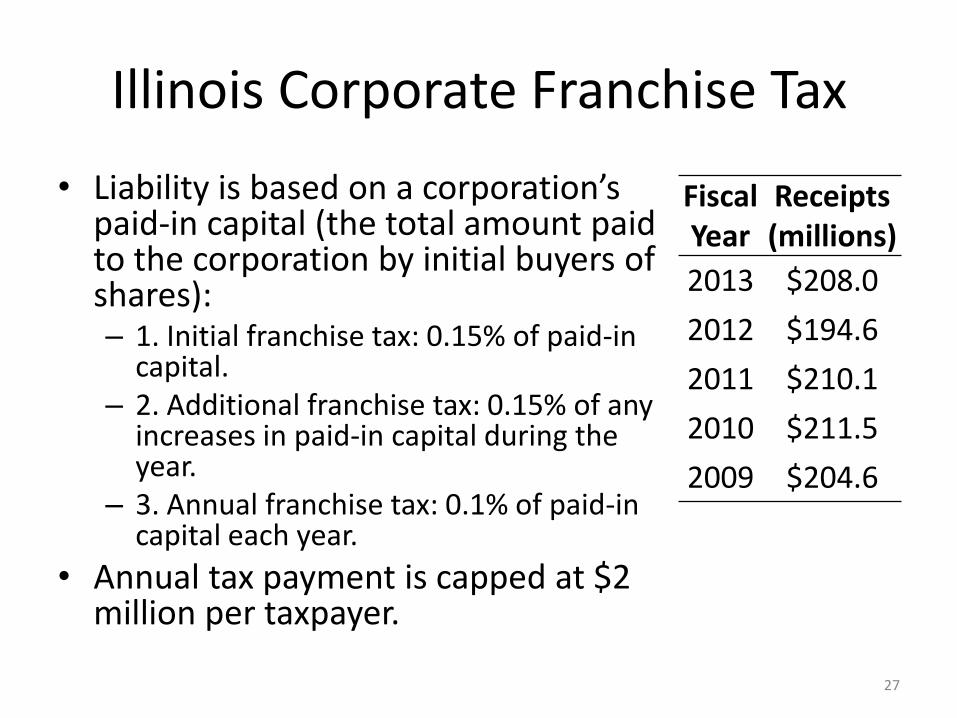
• Liability is based on a corporation’s paid-in capital (the total amount paid to the corporation by initial buyers of shares): – 1. Initial franchise tax: 0.15% of paid-in
capital. – 2. Additional franchise tax: 0.15% of any
increases in paid-in capital during the year.
– 3. Annual franchise tax: 0.1% of paid-in capital each year.
• Annual tax payment is capped at $2 million per taxpayer.
Fiscal Year
Receipts (millions)
2013 $208.0
2012 $194.6
2011 $210.1
2010 $211.5
2009 $204.6
27

RETAILERS OCCUPATION TAX (SALES TAX)
ILLINOIS DEPARTMENT OF REVENUE
28
Retailers Occupation Tax
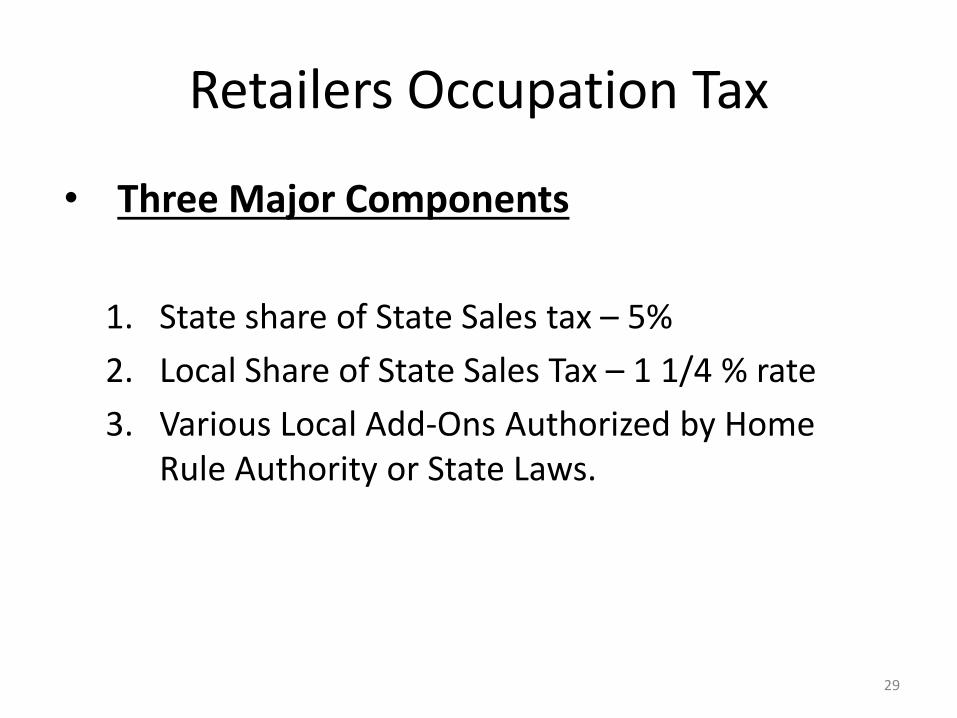
• Three Major Components
1. State share of State Sales tax – 5%
2. Local Share of State Sales Tax – 1 1/4 % rate
3. Various Local Add-Ons Authorized by Home Rule Authority or State Laws.
29

Tax Base
• Illinois does not tax services under the state sales tax, although some services are taxed pursuant to other state statutes or by local governments .
• Consumer spending has been shifting towards services and away from goods for years.
• Illinois does not tax digital goods, unlike many other states.
30

Sales Taxation of Goods State State tax rate Food for off-premises
consumption
Prescription drugs Non-prescription
drugs
Motor fuels Digital goods (excl.
software and games)
Arizona 5.60% No No Yes No Yes
California 7.50% No No Yes Yes No
Florida 6.00% No No No Yes No
Georgia 4.00% Yes, but locals only No Yes Yes No
Illinois 6.25% Yes, 1.0% to locals Yes, 1.0% to locals Yes, 1.0% to locals Yes No
Indiana 7.00% No No Yes Yes Yes
Iowa 6.00% No No Yes No No
Kentucky 6.00% No No Yes No Yes
Louisiana 4.00% No No Yes No Yes
Minnesota 6.875% No No No No No
Missouri 4.225% Yes, 1.225% No Yes No Yes
New York 4.00% No No No No No
North Carolina 4.75% No No Yes No Yes
Ohio 5.75% No No Yes No Yes
Oregon No state sales tax N/A N/A N/A N/A N/A
Pennsylvania 6.00% No No No No No
South Carolina 6.00% No No Yes No No
Texas 6.25% No No No No No
Wisconsin 5.00% No No Yes No Yes

Tax Treatment of Service Sectors
Service Sectors IL IA IN KY MO WI Agricultural Services 0 2 1 0 0 3
Industrial and mining services 0 0 0 0 0 1
Construction 0 3 0 0 0 0
Utilities 12 13 7 11 8 11
Transportation 0 1 0 0 1 2
Storage 0 3 1 0 0 1
Finance, Information, Real Estate 0 2 0 0 0 0
Personal services 1 15 4 2 1 11
Business services 1 18 3 4 2 8
Computer services 1 1 2 0 2 3
Automotive services 0 5 0 0 0 5
Admissions and amusements 0 14 3 6 10 14
Professional services 0 0 0 0 0 0
Leases 1 3 2 1 2 3
Fabrication, repair and installation 1 13 1 4 0 14
Miscellaneous 0 1 0 0 0 0
Taxable Categories 17 94 24 28 26 76
Source: Federation of Tax Administrators Service Taxation Survey
Note: The FTA survey includes all taxes levied on service provision, not just sales taxes.
Border States
32

Tax Treatment of Service Sectors
Service Sectors IL IA IN LA MN NC OH OR TX WI Agricultural Services 0 2 1 0 2 0 1 0 2 3
Industrial and mining services 0 0 0 1 1 0 0 0 2 1
Construction 0 3 0 0 0 0 0 0 3 0
Utilities 12 13 7 10 15 10 8 0 12 11
Transportation 0 1 0 0 0 0 2 0 3 2
Storage 0 3 1 2 1 0 4 0 2 1
Financial, Information, Real Estate 0 2 0 0 0 0 0 0 2 0
Personal services 1 15 4 8 7 4 12 0 10 11
Business services 1 18 3 5 12 5 14 0 14 8
Computer services 1 1 2 3 2 0 5 0 8 3
Automotive services 0 5 0 3 5 0 4 0 1 5
Admissions and amusements 0 14 3 9 13 9 3 0 12 14
Professional services 0 0 0 0 0 0 0 0 1 0
Leases 1 3 2 1 2 1 3 0 1 3
Fabrication, repair and installation 1 13 1 13 6 1 12 0 10 14
Miscellaneous 0 1 0 0 0 0 0 0 0 0
Taxable Categories 17 94 24 55 66 30 68 0 83 76
Source: Federation of Tax Administrators Service Taxation SurveyNote: The FTA survey includes all taxes levied on service provision, not just sales taxes.
Manufacturing States
33

Tax Treatment of Service Sectors
Service Sectors IL FL AZ SC CA GA NY PA Agricultural Services 0 0 1 0 0 0 3 2 Industrial and mining services 0 0 2 0 1 0 0 0 Construction 0 0 4 0 0 0 0 0 Utilities 12 7 12 4 2 10 4 9 Transportation 0 1 5 0 0 3 2 1 Storage 0 6 6 0 0 0 4 0 Financial, Information, Real Estate 0 0 0 0 0 0 0 0 Personal services 1 4 2 6 2 4 4 5 Business services 1 9 7 7 7 5 13 16 Computer services 1 0 0 4 2 2 1 1 Automotive services 0 4 1 0 1 0 5 4 Admissions and amusements 0 14 9 10 1 8 6 1 Professional services 0 0 0 0 0 0 0 0 Leases 1 2 3 2 2 3 1 1 Fabrication, repair and installation 1 16 2 1 3 1 14 15 Miscellaneous 0 0 1 1 0 0 0 0Taxable Categories 17 63 55 35 21 36 57 55
Source: Federation of Tax Administrators Service Taxation SurveyNote: The FTA survey includes all taxes levied on service provision, not just sales taxes.
"Sunbelt" and Other States
34

Local Option Retailer Occupation Taxes (ROT)
• IDOR collects ten different local option ROTs. – Home Rule
– Non-Home Rule
– Metro-East Transit District
– Regional Transit Authority
– DuPage Water Commission
– County Public Safety
– County School Facility
– Business District Development
– Metro-East Park and Recreation
– County Flood Prevention
• Local ROT tax rates have been increasing.
– FY 1996 weighted average local option rate 1.10%
– FY 2013 weighted average local option rate 1.92%
35

Top 10 Illinois Sales & Use Tax Expenditures
Name FY12 Amount - State 5% Tax
Rate (millions)
Food, Drugs, and Med App. Rate Reduction $1,635
Sales to Exempt Organizations $405
Traded-In Property $315
Farm Chemicals (includes feed, seed, and fertilizer) $259
Manufacturing Machinery and Equipment Exemption $183
Gasohol 20% Exemption $142
Biodiesel 20% and 100% Exemptions $127
Retailers' Discount $121
Rolling Stock Exemption $74
Farm Machinery and Equipment Exemption $57

Retailers’ Discount
• 27 states allow retailers to keep a portion of the sales tax they collect to cover their cost of collection.
• Many states cap the amount that can be kept or lower the rate as collections increase.
• Illinois has the most generous retailers’ discount: a flat rate of 1.75% of tax collected.
• Retailers kept $183 million in state and local sales tax in FY 2013.
37

PROPERTY TAXES ILLINOIS DEPARTMENT OF REVENUE
38

Property Tax • Property Assessed at 33.33% of Fair Cash Value (AV) EXCEPT IN Cook County • Classification of property allowed in counties over 200k population – (one class of
property cannot be assessed 2 ½ times that of another class) – Cook county – Since 2008
• 10% Vacant, Residential, Apartment • 25% Commercial Industrial
• Department of Revenue has the authority to equalize assessed value to 33.33% - (EAV)
• State Assessed Property – Pollution Control Facilities – Low Sulfur Dioxide Coal Fueled Devices – Railroads – Regional Water Treatment Facilities
• Special Assessed property – Examples - Farm, Wind Turbines, and Sports Stadiums
• Exempt property – Examples – Churches, Government owned properties
• Homestead Exemptions
39

Property Tax: State Rankings State and Local Property Tax
Collections Per Capita, Fiscal Year 2010
Property Tax Share of State and Local Tax Revenue
Property Taxes as Percent of Home Value
Amount Rank Percent Rank Percent Rank
Arizona $1,147 30 37.3% 17 0.77% 34
Florida $1,507 15 42.9% 7 1.08% 20
Illinois $1,827 10 43.6% 6 1.91% 2
Indiana $1,182 29 32.8% 27 0.88% 29
Iowa $1,367 23 34.8% 24 1.36% 14
Kentucky $684 46 21.5% 41 0.76% 36
Louisiana $748 43 20.9% 46 0.48% 48
Minnesota $1,412 20 30.7% 31 1.09% 19
Missouri $960 37 30.2% 33 1.00% 23
North Carolina $902 38 26.2% 40 0.80% 32
Ohio $1,130 32 30.0% 36 1.52% 9
Oregon $1,292 26 37.6% 16 0.97% 26
South Carolina $1,022 36 35.8% 22 0.54% 45
Texas $1,562 14 45.2% 5 1.74% 5
Wisconsin $1,698 12 39.5% 13 1.74% 4 40