ili cue see model paper
TRANSCRIPT

8/12/2019 Ili Cue See Model Paper
http://slidepdf.com/reader/full/ili-cue-see-model-paper 1/8
Helping LeadersBetter Execute Strategy & Manage Enterprise Risks
– Matt Barney
Today more than ever, leaders find it difficult to systematically manage risks effectively. High-profile disasters such as Lehman Brothers’ record breaking $639 Billion USD bankruptcyhave highlighted the urgency for better ways to manage enterprise risks while winning inthe marketplace. In the case of the 2008 banking collapses, some leaders had sufficient riskmanagement controls, and survived. Bank of America, for example, was one who retainedsufficient stamina to both survive and also rescue Merrill Lynch and Countrywide. But evenBank of America’s Chief Risk Officer was let go after failing new government-mandated stresstests (Story & Dash, 2009). A key question is whether Lehman may have survived if its’ leaderswere more clear about the risks of complex derivatives in Lehman’s portfolios.
An introduction to the Cue See Model
8/12/2019 Ili Cue See Model Paper
http://slidepdf.com/reader/full/ili-cue-see-model-paper 2/8
2 | Infosys – White Paper
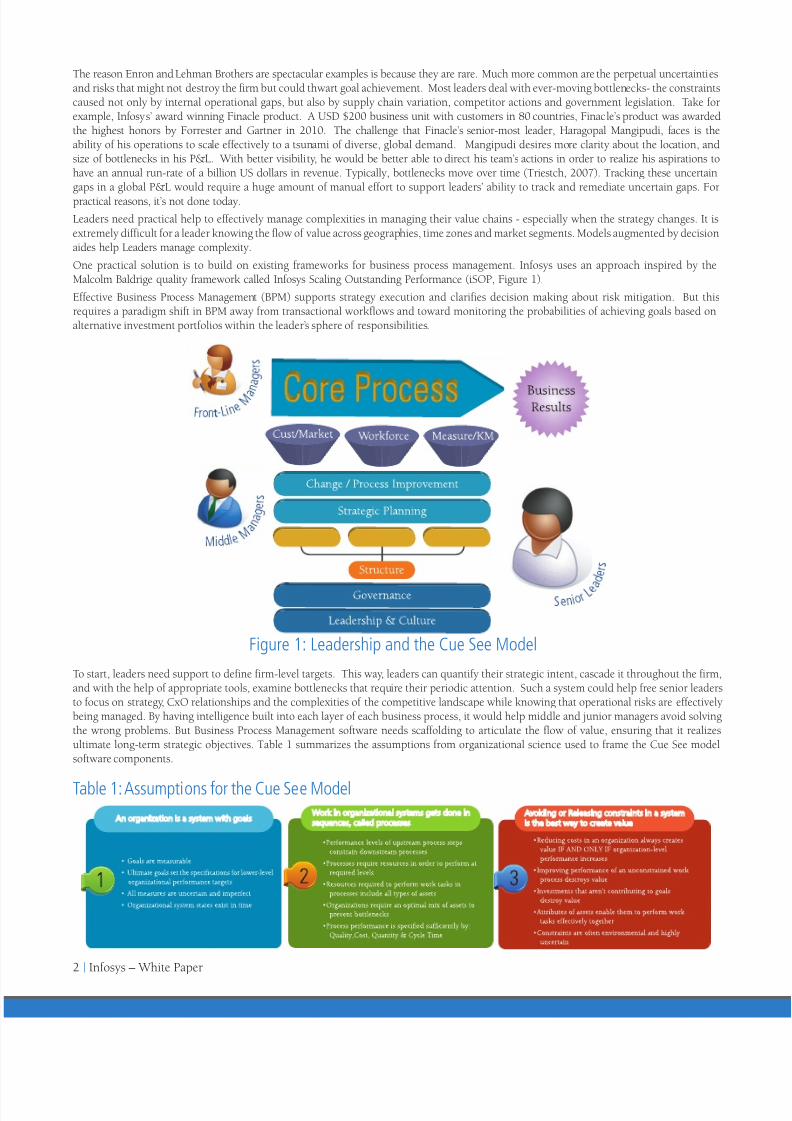
The reason Enron and Lehman Brothers are spectacular examples is because they are rare. Much more common are the perpetual uncertaintiesand risks that might not destroy the firm but could thwart goal achievement. Most leaders deal with ever-moving bottlenecks- the constraintscaused not only by internal operational gaps, but also by supply chain variation, competitor actions and government legislation. Take forexample, Infosys’ award winning Finacle product. A USD $200 business unit with customers in 80 countries, Finacle’s product was awardedthe highest honors by Forrester and Gartner in 2010. The challenge that Finacle’s senior-most leader, Haragopal Mangipudi, faces is theability of his operations to scale effectively to a tsunami of diverse, global demand. Mangipudi desires more clarity about the location, andsize of bottlenecks in his P&L. With better visibility, he would be better able to direct his team’s actions in order to realize his aspirations tohave an annual run-rate of a billion US dollars in revenue. Typically, bottlenecks move over time (Triestch, 2007). Tracking these uncertaingaps in a global P&L would require a huge amount of manual effort to support leaders’ ability to track and remediate uncertain gaps. Forpractical reasons, it’s not done today.Leaders need practical help to effectively manage complexities in managing their value chains - especially when the strategy changes. It isextremely difficult for a leader knowing the flow of value across geographies, time zones and market segments. Models augmented by decisionaides help Leaders manage complexity.One practical solution is to build on existing frameworks for business process management. Infosys uses an approach inspired by theMalcolm Baldrige quality framework called Infosys Scaling Outstanding Performance (iSOP, Figure 1).Effective Business Process Management (BPM) supports strategy execution and clarifies decision making about risk mitigation. But thisrequires a paradigm shift in BPM away from transactional workflows and toward monitoring the probabilities of achieving goals based onalternative investment portfolios within the leader’s sphere of responsibilities.
Figure 1: Leadership and the Cue See ModelTo start, leaders need support to define firm-level targets. This way, leaders can quantify their strategic intent, cascade it throughout the firm,and with the help of appropriate tools, examine bottlenecks that require their periodic attention. Such a system could help free senior leadersto focus on strategy, CxO relationships and the complexities of the competitive landscape while knowing that operational risks are effectivelybeing managed. By having intelligence built into each layer of each business process, it would help middle and junior managers avoid solvingthe wrong problems. But Business Process Management software needs scaffolding to articulate the flow of value, ensuring that it realizesultimate long-term strategic objectives. Table 1 summarizes the assumptions from organizational science used to frame the Cue See modelsoftware components.
Table 1: Assumptions for the Cue See Model

8/12/2019 Ili Cue See Model Paper
http://slidepdf.com/reader/full/ili-cue-see-model-paper 3/8
Infosys – White Paper | 3
Cue-See, Systems Engineering & GoalsThe Cue See model is an approach developed to blend expertise across a variety of business sciences to help leaders make better decisions aboutexecuting strategy and mitigating risk. Evidence from Finance, Industrial/Systems Engineering, Organizational Psychology, and Economics areintegrated into what is hoped is a practical approach to make better decisions about investments, respecting the complexity and scarce time ofsenior leadership decision making.Systems engineering has refined approaches to articulate system-level requirements that impose requirements on sub-systems. Since anorganization is one special kind of probabilistic system, these same methods may be used to deploy goals through all processes. IndustrialEngineers and Design for Six Sigma Master Black Belts call this “Requirements Flowdown”. In contrast, the ability of a system to realize ultimategoals is called “Capability Flowup”. Figure 2 gives an example of the flow down of goal targets, and allowable sources of variation from ultimateoutcomes (capital Y’s), to lower levels of performance (lowercase y’s) through meso and micro processes (depicted by x’s). Figure 2 hypothesizesthe specific causal links between the Cue See model’s four process factors and ultimate financial outcomes. The intent is to clarify how theorganizational system is designed to execute strategy and ensure the probabilistic combination of assets is likely to win in the marketplace.Each facet of the Cue See model has a different impact on balance sheets, profit and loss statements, and income statements. The model’s fourfactors in have probabilistic relationships with each other and cause ultimate goals to be realized (see Figure 2):
Quality - The degree to which a product or service is useful to the customer. The relationship between quality and price; and quality andquantity is probabilistic. Higher quality (Low cost of poor quality; fewer defects) favorably affects total costs, as indicated by the positive greenarrow between quality and cost.
Cost - Expenses are the total sum of monetary outlays in a period across all processes and overhead in the firm. Some costs are supportive(G&A) while others directly vary as a function of production/service delivery, and are allocated to the cost of sales.
Quantity - Volumes are the units delivered. In manufacturing, they are products sold; in services they are the number of customers served.Overproduction of units or over engineering services beyond the marketplace demand negatively affects cost shown by a red arrow betweenquantity and cost.
Cycle Time - The timeframe in which the cost, quality, and volumes are produced. This is a critical lens through which to consider organizationalperformance, with respect to the dates the business wants to achieve strategic goals. Cycle Time is additive in that each process and subprocesses require a certain level of time to achieve the target quality, cost and quantity levels. The total amount of time required to produceservices or products affects the degree to which the customer is delighted, and ultimately the desired level of economic profit realized.The purpose of the Cue See model is to help characterize organizational level strategic goals’ requirements themselves throughout the company.The Cue See model reflects a framework and set of methods to design and manage an organization and/or processes toward specific outcomes.
It borrows highly refined approaches to articulate system-level requirements that impose requirements on sub-systems, such as parts from LeanSix Sigma and Reliability Engineering. Six Sigma methods use techniques such as the “House of Quality” also known as “Quality FunctionDeployment” are another way establish relationships between ultimate outcomes and lower level performance requirements. This cascade ofrequirements from the top of the organizational system to lower level processes, and the resources required to perform effectively is also knownas the “Critical to Quality” (CTQ) flowdown.In the Cue See model, each of the four variables (QCQC) have different tolerances, or ranges of variation that are sufficient for the firm toachieve its’ goals. Quality is ultimately customer defined, and parameters that drive customer delight could be targeted around one of threeoptions - minimize, maximize, or optimize around a target. Higher quality creates less waste and reduces total costs. At various process steps,however, quality may take different forms, depending on the outcomes required to fulfill ultimate customer requirements. Quantity is also
Cost of Capital
Taxes
General Administrative
Costs Q&ACost of Sales Gross Receipts
Price
Volume
Quality
Cost
Quantity
Cycle-Time
Brand Loyalty
Figure 2: Relationship Between Facets of the Cue-See Model and Financials
8/12/2019 Ili Cue See Model Paper
http://slidepdf.com/reader/full/ili-cue-see-model-paper 4/8
4 | Infosys – White Paper
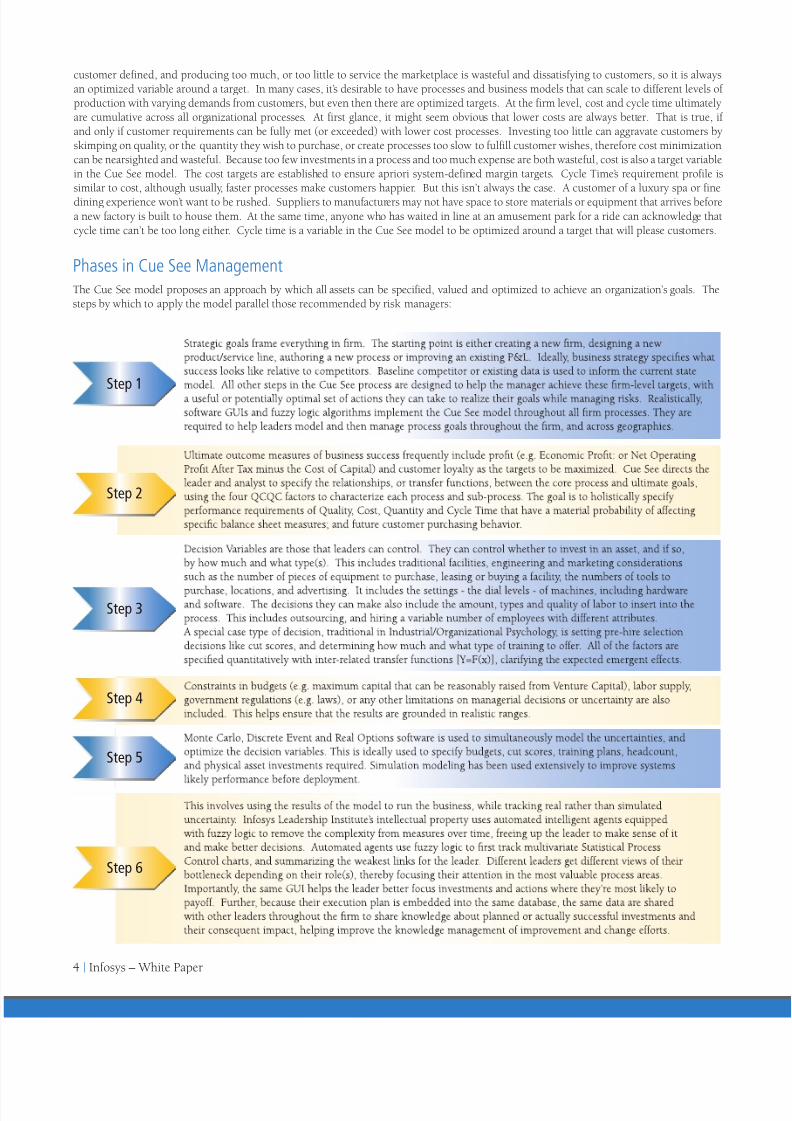
Phases in Cue See Management
The Cue See model proposes an approach by which all assets can be specified, valued and optimized to achieve an organization’s goals. Thesteps by which to apply the model parallel those recommended by risk managers:
Step 1
Step 3
Step 5
Step 2
Step 6
Step 4
customer defined, and producing too much, or too little to service the marketplace is wasteful and dissatisfying to customers, so it is alwaysan optimized variable around a target. In many cases, it’s desirable to have processes and business models that can scale to different levels ofproduction with varying demands from customers, but even then there are optimized targets. At the firm level, cost and cycle time ultimatelyare cumulative across all organizational processes. At first glance, it might seem obvious that lower costs are always better. That is true, ifand only if customer requirements can be fully met (or exceeded) with lower cost processes. Investing too little can aggravate customers byskimping on quality, or the quantity they wish to purchase, or create processes too slow to fulfill customer wishes, therefore cost minimizationcan be nearsighted and wasteful. Because too few investments in a process and too much expense are both wasteful, cost is also a target variablein the Cue See model. The cost targets are established to ensure apriori system-defined margin targets. Cycle Time’s requirement profile issimilar to cost, although usually, faster processes make customers happier. But this isn’t always the case. A customer of a luxury spa or finedining experience won’t want to be rushed. Suppliers to manufacturers may not have space to store materials or equipment that arrives beforea new factory is built to house them. At the same time, anyone who has waited in line at an amusement park for a ride can acknowledge thatcycle time can’t be too long either. Cycle time is a variable in the Cue See model to be optimized around a target that will please customers.

8/12/2019 Ili Cue See Model Paper
http://slidepdf.com/reader/full/ili-cue-see-model-paper 5/8
Infosys – White Paper | 5
References• Ackoff, R.L. (1999). Re-Creating the Corporation: A design of organizations for the 21st Century. Oxford University Press.• Andriesson, Daniel (2004). Making Sense of Intellectual Capital: designing a method for the valuation of intangibles. Elsevier
Butterworth-Heinemann, Amsterdam, Netherlands.• Algera, Jen A.; Monhemius, Leo; & Wijnen, Cees J.D. (1997). Quality Improvement: Combining ProMES and SPC to Work Smarter.
European Journal of Work and Organizational Psychology, 6(3), 261-278.• Barney, Jay B. (1991). “Firm Resources and Sustained Competitive Advantage”, Journal of Management 17: 99-120.• Barney, Matthew F. (June, 2002). Measuring ROI in Corporate Universities: death of the student day and birth of human capital. In
Allen, M. (Ed.), The Corporate University Handbook. Pepperdine University Press: Malibu, California.• Barney, Matthew F. & McCarty, T. (Eds) (2002). The New Six Sigma: A leader’s guide to rapid business improvement and sustainable
results. Prentice Hall: Saddle River, NJ.• Barney, M.F. (2009a, February). Leading Scientically - Introducing the Cue-See Model for Evidence-based Leadership. Invited
address, Society of Psychologists in Management (SPIM). San Diego, California.• Barney, M.F. (2009b, April). Enhancing Utility Analysis to Inuence Your CFO: Introducing the Cue See Model. Poster at the 2009
Annual Society for Industrial-Organizational Psychology (SIOP) Conference, New Orleans, LA.• Bawden, Tom. (2008, September 16). Bruiser of Wall St Dick Fuld looked after his people, but didn’t know when to quit. Times Online.
Downloaded September 23, 2008: http://business.timesonline.co.uk/tol/business/industry_sectors/banking_and_nance/article4761890.ece• BBC News (April 21, 2005). Dozens killed in Zambia explosion. http://news.bbc.co.uk/2/hi/africa/4466321.s• Box, George E. P. (1976): “Science and Statistics”. Journal of the American Statistical Association, 71, 791-799.• Burton, Richard M. & Obel, Borge (2004). Strategic Organizational Diagnosis and Design: the dynamics of t, third edition. Kluwer
Academic Publishers. Boston.
Conclusion Early studies on the Cue See model are promising (Barney, 2009a, Barney 2009b, Barney 2010), and it is hoped that with additional evidenceand tools, the Cue See model may better focus leaders’ actions in the areas most likely to realize ultimate goals (Trietsch, 2005). This paperoutlines hypotheses and an early example of applying this interdisciplinary, cross-level approach. Future work needs to examine otheraspects of finance and operations decisions including probabilistic contingency-based valuation including Managerial Real Options (Munn,2000), and discrete-event simulations (Sage & Rouse, 1999); ensuring that the results empirically translate to real organizations. Ultimately,empirical evidence is needed to fully flesh out the degree to which the model and simulation results are more useful than alternatives.Further, for the Cue See model to be practical, information technology is required to deploy a better, more dynamic and mass-customizedbalanced scorecard and business process management system for Leaders. If the Cue See model holds as a useful way to think about stochasticvalue creation, and can be substantiated empirically, then Business Process Management (BPM) software is ideal for executing it. BPM isuseful in preventing defects in white collar, human-intensive processes as well as manufacturing and equipment-intensive processes. You’veused components of a BPM as a customer when you’ve ordered something on-line, and forgot to include your email address and the webserver prevented you from submitting your request until you had corrected the omission.In good BPM software, managerial approvals can be requested and obtained, and digitally implement. But more important for senior leadersis to use BPM more for tracking uncertainty and the portfolio of actions underway to harvest ultimate goals. The software in effect combinesuncertainty with a leadership GUI that respects Vilfredo Pareto’s 80/20 Principle. By programming a BPM system with the Cue-See model’stargets and specifications for every process and team, in all 4 areas of process performance that are necessary and sufficient for firm-levelperformance, uncertain bottlenecks can be prioritized. Within each leader or work team’s sphere of influence, the software can be used toonly point out the places with the largest gaps in Quality, Cost, Quantity and/or Cycle time for action. This can include “just do it” actionsto make improvements or reduce variation; or it can include situations where the root cause isn’t obvious and classical Lean Six Sigma (e.g.DMAIC) methods are better applied. In this way, the Cue See model can augment a firm’s “Business Operating System” and “Dashboard
Drill Down” detail tracking, by providing a dramatically faster way to determine a better portfolio of improvement projects, specified froma strategically-cascaded set of goals across the enterprise, and characterized against specific performance targets in all four of Cue See’scategories.This combination of the Cue See model and the software should help leaders at all levels focus on what really matters to the firm, and notdrown in the complexity of too much information. If specified correctly, they can rest assured that the measures and deltas tracked in theirprocesses are the right set to ensure firm-level success. Similarly, digitizing the Cue See model should substantially speed improvementefforts. First, it will help focus the processes most constrained for the entire enterprise. It should hasten leaders’ ability to launch newimprovement projects or make new investments in known solutions to constrained value chains. In my experience, the front end of LeanSix Sigma projects, defining the goal and the improvement team is one of the hardest to get right and takes time to get right. The new modelshould help make this faster. Also the ability to collect digital data should dramatically accelerate the speed with which improvement projectscan collect good data.

8/12/2019 Ili Cue See Model Paper
http://slidepdf.com/reader/full/ili-cue-see-model-paper 6/8
6 | Infosys – White Paper
• Cascio, W.F.(2002). Responsible Restructuring: Creative and protable alternatives to layoffs. Berrett-Koehler.• CNN (January 26, 2002). Former Enron Exec Dies in Apparent Suicide. http://archives.cnn.com/2002/US/01/25/enron.suicide/ • Committee of the Sponsoring Organizations of the Treadway Commision (COSO) (2004). Enterprise Risk Management Framework:
Executive Summary. http://www.erm.coso.org• DeMeuse, K.P.; Marks, M.L. (2003). Resizing the Organization: managing layoffs, divestitures, and closings. Jossey-Bass. ISBN 0-7879-5891-3• de Vreede, Gert-Jan; & Verbraeck, Alexander (2003). Integrating the Conceptualization and Simulation of Business Processes: A
Modeling Method and Arena Template. SIMULATION, Vol. 79, No. 1, 43-55 (2003)• DiFrancesco & Berman (2000). Human Productivity: The new frontier. National Productivity Review, Summer• Giaglis, George M. (2001, April). A Taxonomy of Business Process Modeling and Information Systems Modeling Techniques.
International Journal of Flexible Manufacturing Systems, 13 (2): 209-228• Gilbert, N.; Troitzsch, K.G. (2002 reprint). Simulation for the Social Scientist. Open University Press. Buckingham, UK. ISBN 0-335-19744-0• Goldratt, Eliyahu M. (1985). The Goal. North River Press.• Goldratt, Eliyahu M (1990). Theory of Constraints. North River Press.• Gunasekaran A.; Patel C.; & Tirtiroglu E. (2001, February 14). Performance measures and metrics in a supply chain environment.
International Journal of Operations & Production Management, vol. 21, no. 1, pp. 71-87(17)• Hand, John M.; & Lev, Baruch (2003). Intangible
Assets: values, measures & risks. Oxford University Press, Oxford, UK.
• Ilgen, D.R.; Hulin, C.L. (Eds) (2000). Computational Modeling of Behavior in Organizations: the third scientic discipline. AmericanPsychological Association. Washington, DC. ISBN 1-55798-639-8
• Kaplan, R.S. & Norton, D.P. (1992, January-February). The Balanced Scorecard: Measures that drive performance. Harvard Business Review, p• Kleijnen J.P.C.; Smits M.T.(2003, May) Performance metrics in supply chain management. Journal of the Operational Research Society,
vol. 54, no. 5, pp. 507-514(8)• Krulikowski, Alex (1998). Fundamentals of Geometric Dimensioning and Tolerancing, Second Edition. Delmar, Thompson Learning.• Laguna, Manuel (1997a). Metahuristic Optimization with Evolver, Genocop and OptQuest. University of Colorado, Graduate School
of Business Administration. http://www.decisioneering.com/optquest• Laguna, Manuel (1997b). Optimization of Complex Systems with OptQuest. University of Colorado Graduate School of Business.
http://www.decisioneering.com/optquest• Lev, Baruch (2001). Intangibles: Management, Measurement and Reporting. Brookings Institution, Washington, DC. ISBN 0-8157-0094-6• Lipe, M. & Salterio, S. (2000). The Balanced Scorecard: Judgement Effects of Common and Unique Performance Measures. The
Accounting Review 75, p283-298.• Litan, Robert E. & Wallison, Peter J. (2000). The GAAP Gap: Corporate Disclosure in the Internet Age. American Enterprise Institute-
Brookings Joint Center for Regulatory Studies. Washington, D.C.• Munn, Johnathan (2002). Real Options Analysis: Tools and techniques for valuing strategic investments and decisions. John Wiley & Sons, Hoboken, NJ.
• Nakamura, Leonard (2003). A Trillion Dollars a Year in Intangible Investment and the New Economy. In Hand, J. & Lev, B. (Eds.),Intangible Assets: values, measures and risks. Oxford University Press, Oxford, UK.
• Nørreklit, Hanne S.O. (2000). The Balance on the Balanced Scorecard - a critical analysis of some of its assumptions. Management Accounting Research, 11, 1, s. 65-88.
• Nørreklit, Hanne S.O.(2003). The Balanced Scorecard: What is the Score? A Rhetorical Analysis of the Balanced Scorecard. Accounting, Organizations and Society, 28, s. 591-619.
•
Orlowski, Andrew (2003, June 17th). Linus Torvalds leaves Transmeta. The Register. Downloaded September 25, 2008 from http:// www.theregister.co.uk/2003/06/17/linus_torvalds_leaves_transmeta• Osterland, Andrew (2001, April). Decoding Intangibles: Companies are eager to measure their intangibles, they just aren’t keen on
sharing their results. Chief Financial Ofcer Magazine, pp57-59,61-62.• Prietula, M., Carley, K., & Gasser, L. (Eds.) (1998). Simulating Organizations: Computational models of institutions and groups. AAAI
Press/MIT Press. ISBN#0-262-66108-x.• Pritchard, R. D., Jones, S. D., Roth, P. L., Stuebing, K. K., & Ekeberg, S. E. (1988). The effects of feedback, goal setting, and incentives
on organizational productivity. Journal of Applied Psychology Monograph Series, 73(2), 337-358.• Pritchard, R. D., Jones, S. D., Roth, P. L., Stuebing, K. K., & Ekeberg, S. E. (1989). The evaluation of an integrated approach to
measuring organizational productivity. Personnel Psychology, 42(1), 69-115.

8/12/2019 Ili Cue See Model Paper
http://slidepdf.com/reader/full/ili-cue-see-model-paper 7/8
Infosys – White Paper | 7
• Repo, Aatto J. (1989), An approach to the value of information: effectiveness and productivity of information use in research work,Technical Research Center of Finland, Espoo, 150 p
• Robb, Fenton (1991). Accounting - A Virtual Autopoietic System? Systems Practice, Vol 4, no 3, pp 215-235.• Romer, Paul (2003). The Soft Revolution: Achieving growth by managing intangibles. In Hand, J. & Lev. B. (Eds), Intangible Assets:
values, measures and risks. Oxford University Press, Oxford, UK. p65.• Roos, Göran; & Roos, Johan (1997). Measuring Your Company’s Intellectual Performance. Long Range Planning, special issue on
intellectual capital. Vol 30(3), pp.413-426• Rothenberg, J. (1975). Cost-Benet Analysis: A methodological exposition. In Struenung, E.L. & Guttentag, M. Handbook of
Evaluation Research. Sage Publications: Beverly Hills pp 55-88.• Sage, A.P.; & Rouse, W.B. (Eds.). (1999). Handbook of Systems Engineering and Management. John Wiley & Sons. ISBN 0-471-15405-9.• Schmidt, F.L & Hunter, J.E. (1998). The Validity and Utility of Selection Methods in Personnel Psychology: Practical and Theoretical
Implications of 85 years of Research Findings. Psychological Bulletin, 124, No. 2 262-274.• Schmidt, F.L., Hunter, J.E., McKenzie, R.C. and Muldrow, T (1979). The impact of valid selection procedures on workforce
productivity. Journal of Applied Psychology, 64, 609-624.• Schumpeter, J.A. (1942/1975). “Creative Destruction” From Capitalism, Socialism and Democracy. New York: Harper. [orig. pub. 1942].• Shunk, Dan L.; Kim, Joong-In; & Nam, Hee Yerl (2003, June). The application of an integrated enterprise modelling methodology--
FIDO: to supply chain integration modeling. Computers and Industrial Engineering, Volume 45, Issue 1, pp 167 - 193.• Skandia (1997). Annual Report 1996.• Slack, N.; Chambers, S.; Harland, C.; Harrison, A.; & Johnston, R. (1995). Operations Management, Pian Publishing, London.• Smart, Geoffrey H. (1998). Management Assessment Methods in Venture Capital: Toward a theory of human capital valuation.
Unpublished doctoral dissertation. Claremont Graduate University, Claremont, CA.• Software Engineering Institute (SEI), (2002). List of High-Maturity Organizations. http://www.sei.cmu.edu/cmm/high-maturity/
HighMatOrgs.pdf. Carnegie Mellon University, Pittsburg, PA.• Stamp, Edward, (1981). Why can accounting not become a science like physics? Abacus 17:1, pp 13-27• Stata, Ray. (1989). Organizational Learning - The Key to Management Innovation, Sloan Management Review, 30(3), Spring, 63-74.• Sterling, R. R. 1975. Toward a Science of Accounting. Financial Analysts Journal (September/October): 42-53.• Story, Louise; Dash, Eric (2009, June 4). Bank of America Ousts Head of Risk Oversight. New York Times online. http://www.
nytimes.com/2009/06/05/business/05risk.html•
Sullivan, P. H. (1998). Proting from Intellectual Capital: extracting value from innovation. New York: John Wiley & Sons.• Todd, Petra, E. & Wolpin, Kenneth I (2003). On the Specication and Estimation of the Production Function for Cognitive Achievement.• The Economic Journal, 113:485 p. F3.• Trietsch, D. (2003, November). Does Goldratt Understand the ‘Theory’ of Constraints? Evaporating the ‘Do Not Balance” Cloud. INFORMS, Atlanta.• Trietsch, D. (2004). From the Flawed “Theory of Constraints” to Hierarchically Balancing Criticalities (HBC). ISOM, University of
Auckland, Working Paper No. 281.• Trietsch, D. (2005a). Why a Critical Path by Any Other Name Would Smell Less Sweet: Towards a holistic approach to PERT/CPM.
Project Management Journal, 36(1), 27-36.• Trietsch, D. (2005b). From Management by Constraints (MBC) to Management by Criticalities (MBCII). Human Systems
Management, 24, 105-115 (Special Issue on TOC).• Trietsch. D. (2007). System Wide Management by Criticalities (MBCII). Hierarchical Balancing of Stochastic Resources. Human
Systems Management, 26(1), 11-21• Tsionas, Efthymios G. (2002). Stochastic Frontier Models with Random Coefcients• Journal of Applied Econometrics. Volume 17, Issue 2, 2002. Pages 127-147.• van Aken, Joan E. (2004, March). Management Research Based on the Paradigm of the Design Sciences: The Quest for Field-Tested
and Grounded Technological Rules. Journal of Management Studies, 41(2).• Zeithaml, Valarie A. (2000). Service Quality, Protability, and the Economic Worth of Customers: What We Know and What We Need
to Learn. Journal of the Academy of Marketing Science. 28: 67-85.

8/12/2019 Ili Cue See Model Paper
http://slidepdf.com/reader/full/ili-cue-see-model-paper 8/8
About the AuthorMatt Barney, Ph.D.
Vice President and Director of the Infosys Leadership Institute
He has held global leadership positions at AT&T, Lucent Technologies, Motorola,Merck, Sutter Health, Virtual Mindworks, and The Scientic Leader. He has publishedin areas ranging from Human Capital Asset Management to Lean Six Sigma. He is co-editor of the best selling book, “The New Six Sigma” and authored 3 patents, with twomore pending. In 2007, he was named a “Future Leader” by Human Capital Magazine.Barney is a certied Motorola Master Black Belt, a certied Risk Manager; and holdsa masters and Ph.D. in Industrial-Organizational Psychology from the University ofTulsa; and a B.S. in Psychology from the University of Wisconsin-Madison. Dr. Barneycan be reached at [email protected]